Developing a Guide for Rural Highways: Reliability and Quality of Service Evaluation Methods (2024)
Chapter: Appendix F: Bicycle Quality of Service on Rural Highways, Survey of Practitioners
Appendix F: Bicycle Quality of Service on Rural Highways, Survey of Practitioners
Complete results from the models described here can be obtained from the authors with reasonable request.
Introduction
An online survey was designed to solicit input from state DOTs to identify potential revisions/improvements to the HCM LOS methodology and/or the AASHTO Green Book design elements to help these agencies better evaluate the impact of traffic, roadway, and control characteristics on bicyclist LOS.
The survey has been designed in LimeSurvey and contains four main sections:
- Introduction
- Quality of service for rural cyclists
- Definition of rural cyclists
- Closing
A pretest was conducted with the research team members and panel members to refine overall understanding, time management and variables included. Afterwards, it was submitted to the University of Florida Institutional Review Board (UF-IRB), which oversees research studies involving human subjects. The survey was approved by UF-IRB in early December and distributed through the following channels:
- State DOT bicycle and pedestrian coordinators - December 7th, 2021; reminder sent January 26th, 2022.
- Members and friends of the TRB Committee on Highway Capacity and Quality of Service (ACP40) - December 6th, 2021.
- Members and friends of the TRB Committee on Bicycle Transportation (ACH20) - December 22nd, 2021.
- Members and friends of the TRB Committee on Performance Effects of Geometric Design (AKD10) - December 14th, 2021.
Descriptive Analysis of the Sample
Sample Size
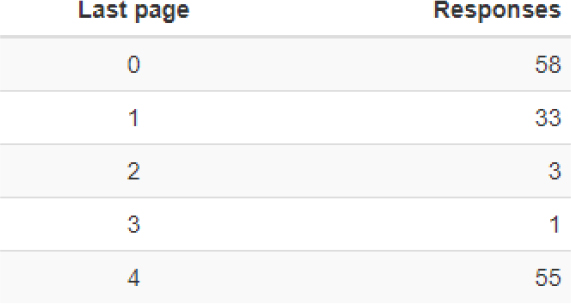
A total of 150 persons entered the survey. 58 and 33 persons left the survey on the welcome and first page, respectively. The final number of completed responses is 55.
Table F-1. Number of responses by the last page of the survey
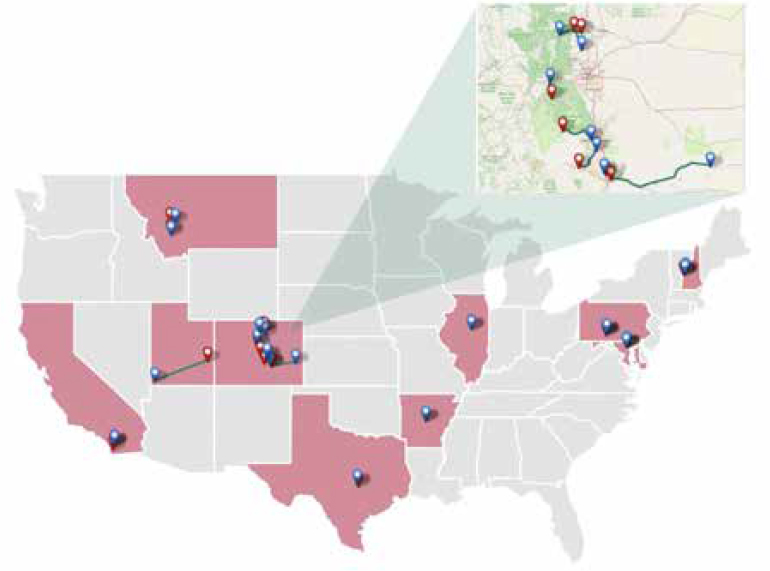
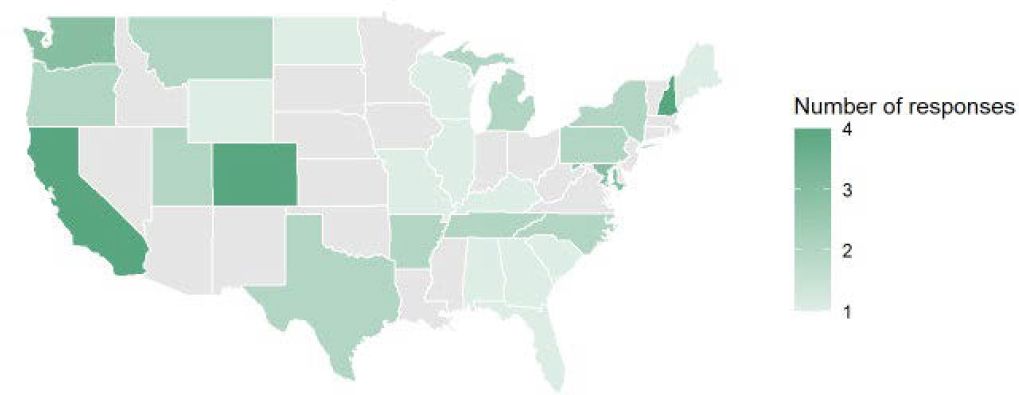
Almost all respondents were primarily developing their work in the United States, with the notable exception of six responses from Germany, Spain, Canada, South Korea, and Greece. Responses from 28 different states were received, including Alaska and Hawaii. The highest number of responses by state is 7, from California, followed by Maryland (6), Washington state (6), New Hampshire (5), Colorado (4), Georgia (4), Oregon (4) and Texas (4).
Agency, Department, and Position
The respondents are primarily employed by state or local government (38 respondents) and consulting groups (11 respondents). They work mainly in the planning department and are engineers or planners.
Table F-2. Descriptive analysis – agency
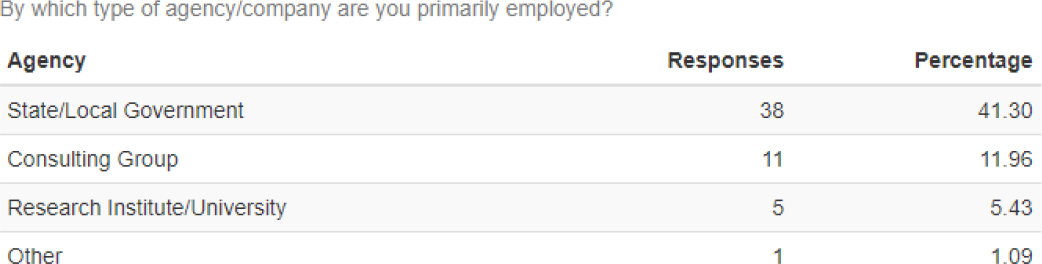
Table F-3. Descriptive analysis – department
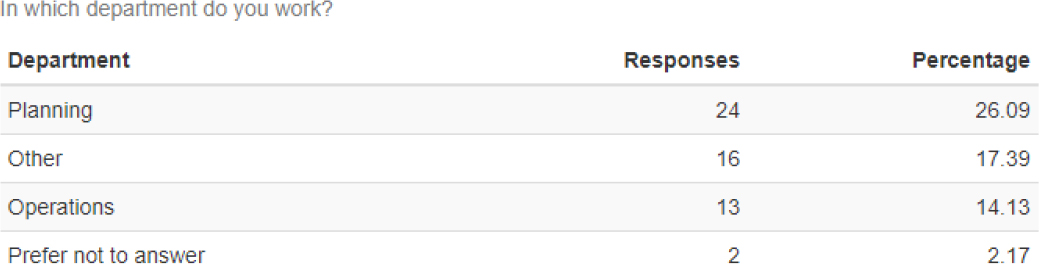
Table F-4. Descriptive analysis – position
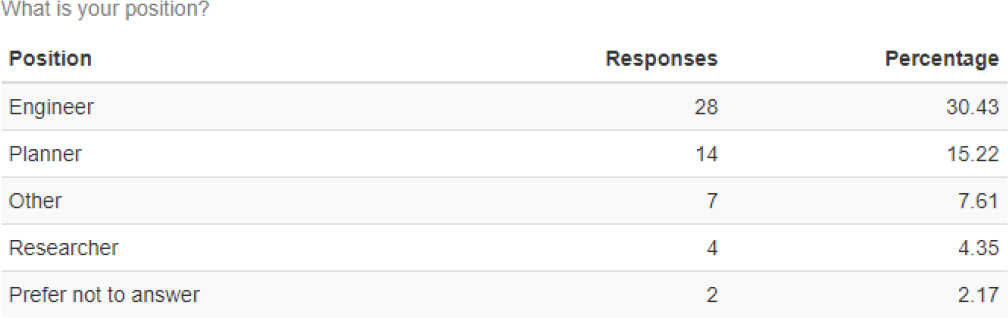
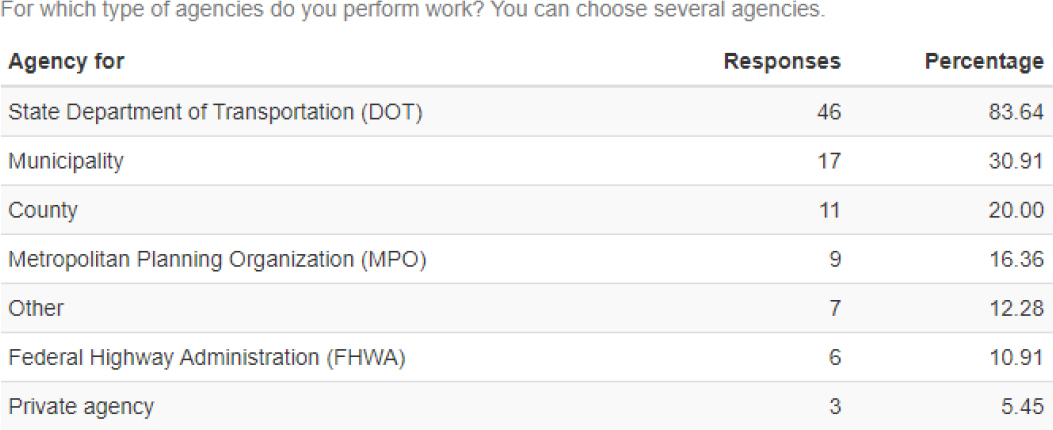
Most of the respondents perform their work for state DOTs (30.91%), followed by municipalities and counties.
Table F-5. Descriptive analysis – agency perform work for
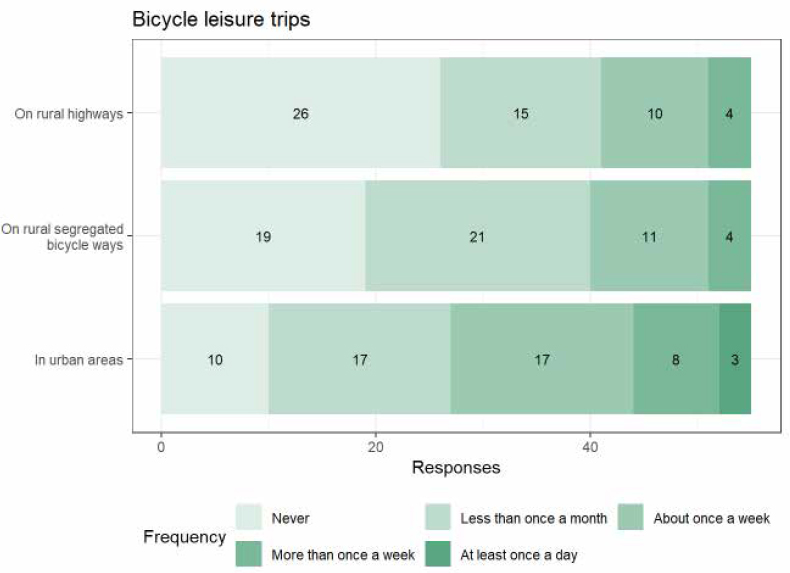
Cycling Experience
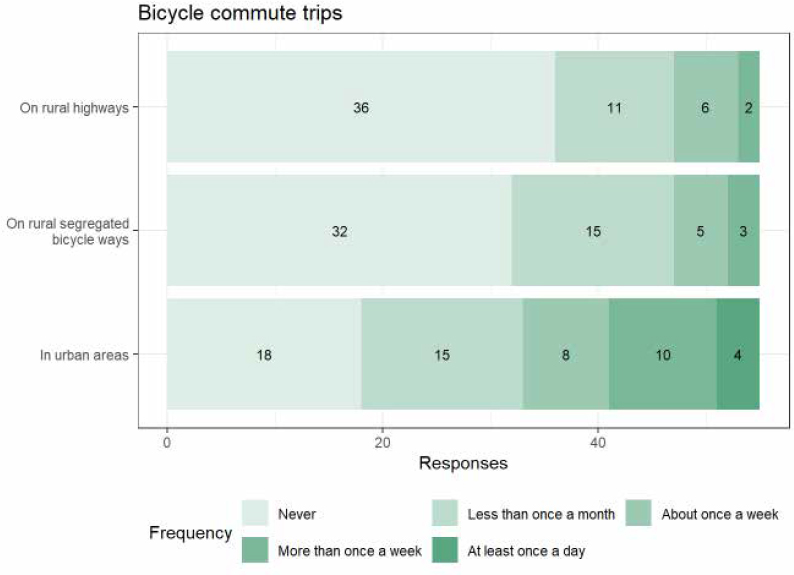
To finalize the characterization of the sample, we included questions regarding cycling experience for commute and leisure. Interestingly, eight respondents indicated that they commute by bicycle on rural highways about once a week or more, compared to 22 of respondents cycling on rural highways for leisure. Cycling frequency in urban areas was significantly higher, with 14 of respondents commuting at least once a week by bicycle and 28 of them for leisure.
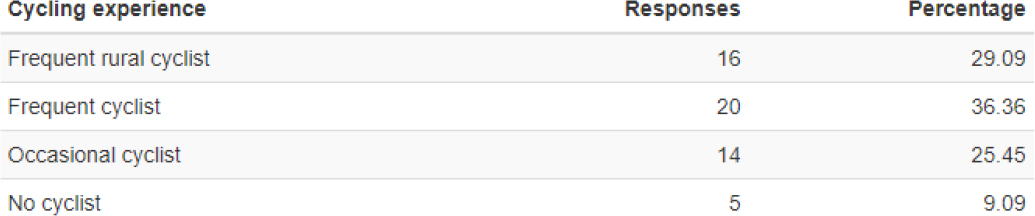
Respondents were classified based on their cycling experience, as follows:
- Frequent rural cyclist: cycles for commute and/or leisure on rural highways at least once per week.
- Frequent cyclist: cycles for commute and/or leisure in urban areas and/or rural segregated bicycle ways at least once per week.
- Occasional cyclist: cycles for commute and/or leisure in urban areas and/or rural segregated bicycle ways less than once a month.
- No cyclist: never cycles for commute and/or leisure in any area.
Most respondents are frequent cyclists, either on rural highways (16 responses) or urban areas (20 responses). 14 individuals are occasional cyclists and only five did not cycle.
Table F-6. Cycling experience of respondents
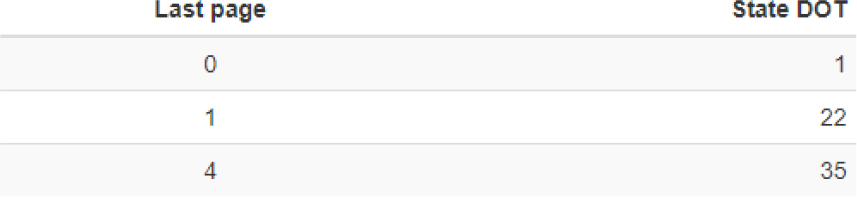
State DOT Responses
In this section, responses from state DOTs are analyzed independently. They were identified as individuals that are primarily employed in local or state administration and work for a state DOT. We received NA responses from state DOTs. 23 persons from state DOTs did not complete the survey.
Table F-7. Number of responses by the last page of the survey
Specifically, we received responses from 30 different state DOTs, including Hawaii and the District of Columbia.
Current Use of Bicycle Methodologies
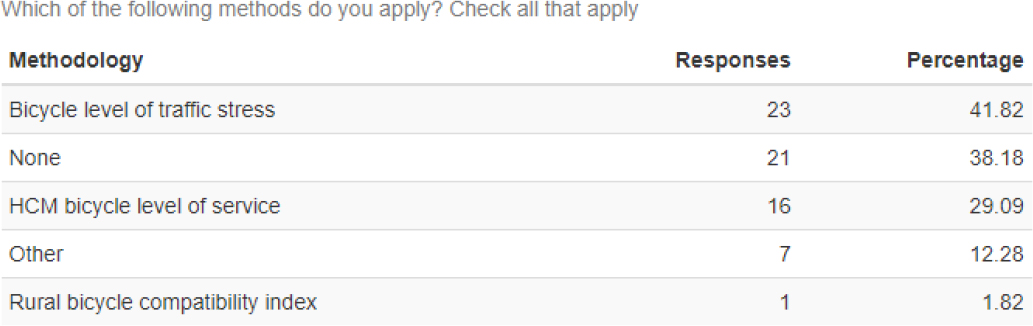
Methods Applied
In the introduction, we asked which bicycle operations quality assessment methodologies they apply. Respondents could check all that apply. Seven respondents indicated that they apply to none. Within the methodologies, the Bicycle LTS (BLTS) is the most applied (16 respondents), followed by the HCM LOS (HCM BLOS) (21 respondents). Eight respondents indicated that they applied for both BLTS and HCM BLOS. Only one respondent indicated that he/she used the RBCI.
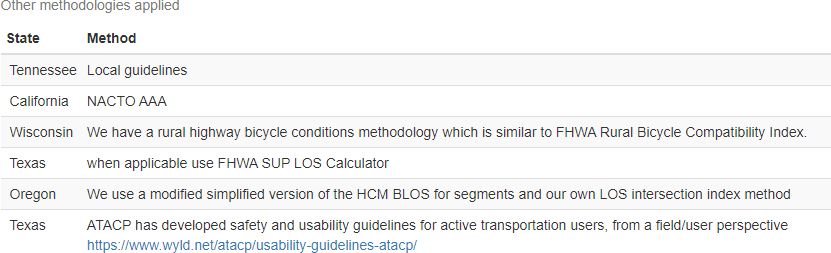
Some respondents indicate that other methodologies are applied, such as multimodal analysis tools outlined in Oregon DOT Analysis Procedure Manual, Caltrans Highway Design Manual or ATACP safety and usability guidelines for active transportation users.
Table F-9. Other methodologies applied.
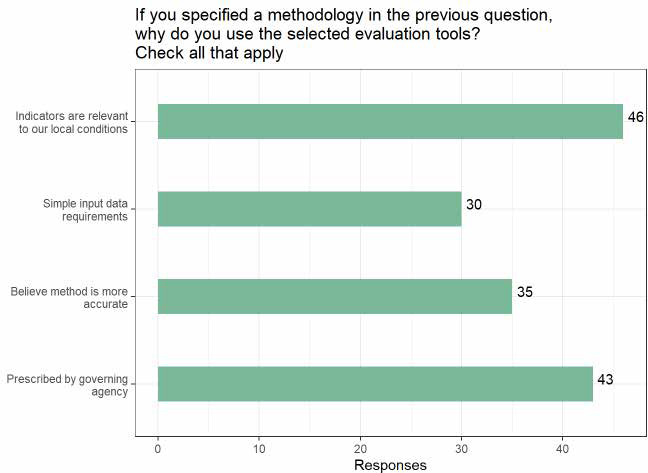
Reasons to Use Applied Methods
Furthermore, we asked why they used the selected evaluation tool(s). 42 respondents indicated that the governing agency prescribed it, while 45 expressed that the indicators are relevant to their local conditions. The other two reasons were also selected by 29 and 34 persons, respectively.
We analyzed if there are differences in the motivations to select a specific evaluation tool. The most used method, BLTS, is selected due to its simple input data and/or being prescribed by the governing agency. In the case of the HCM, the most reported reason is that the indicators are relevant to local conditions, and they believe that the method is more accurate, and with the least percentage, simple input data requirements.
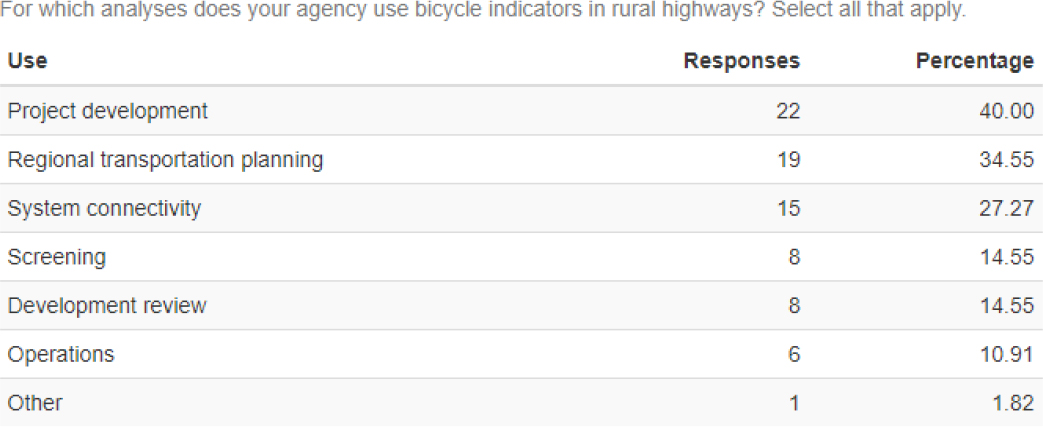
Uses
The use of the methods is mainly distributed between project development (19 responses), regional transportation planning (8 responses) and system connectivity (22 responses). Other uses include system connectivity. The use for screening, development review or operations is limited (between 6 and 8 responses).
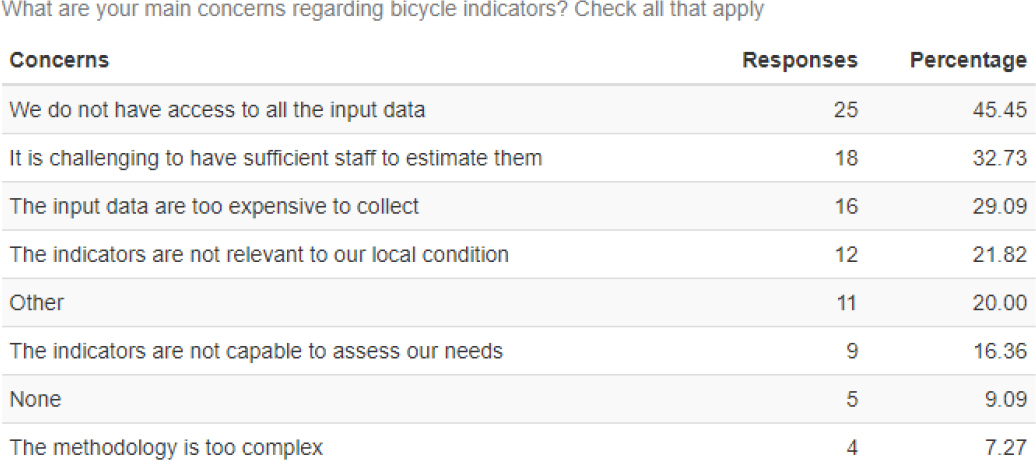
Concerns
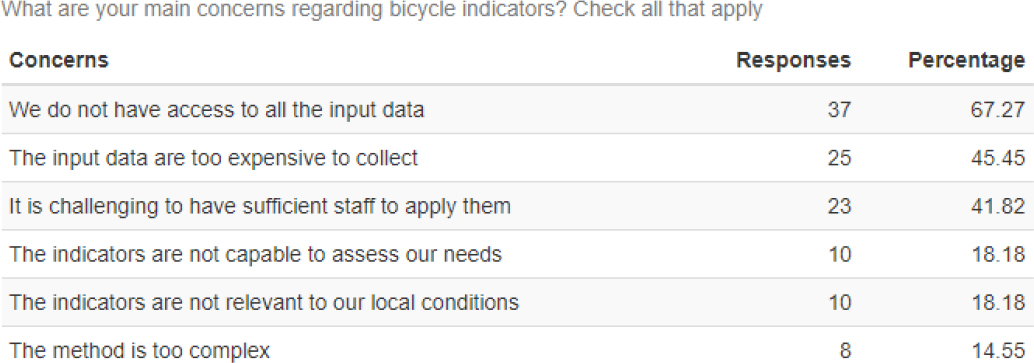
In the following subsection, we included one question regarding the respondents' concerns regarding bicycle indicators. Not surprisingly, data availability is the highest concern, followed
by insufficient staff to estimate the indicators and expensive input data. Other concerns include not being relevant to local conditions or incapable of assessing local needs.
Table F-11. Main concerns regarding bicycle indicators – all responses
Data Sources
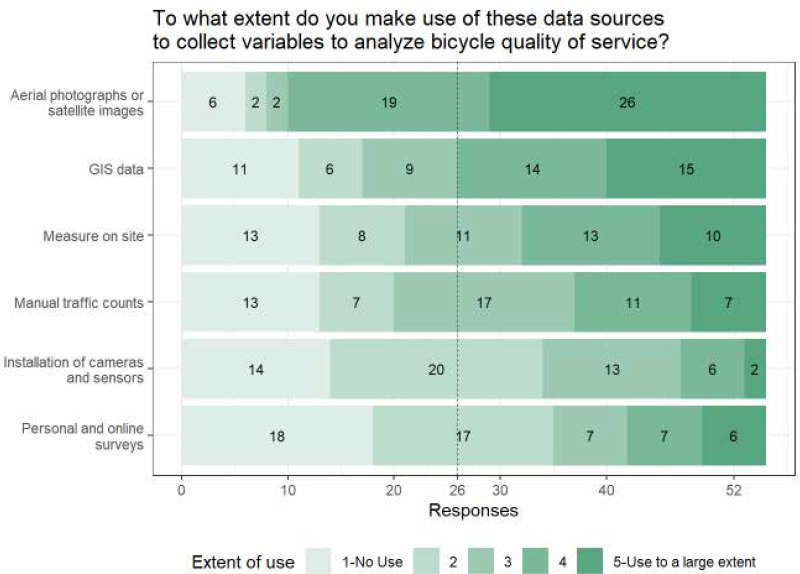
The research team anticipated that data availability could be essential in applying bicycle methodologies. Therefore, we included one question on data sources to collect variables for analyzing bicycle quality of service on rural highways. Respondents indicated to what extent they use some data sources, such as aerial photographs or on-site measurements.
A 5-point Likert scale between “1- No use” and “5 - Use to a large extent” was implemented. Data sources are ordered from most to least used. Aerial photographs were the most used data source (26 largely used them and 19 to some extent). GIS data, measures on-site and manual traffic counts were the next most used data sources, with more than 25 respondents using them at least to certain extent (point values equal to 3 or more), and between 7 and 15 largely using them. The least used data sources are personal and online surveys.
State DOT Responses
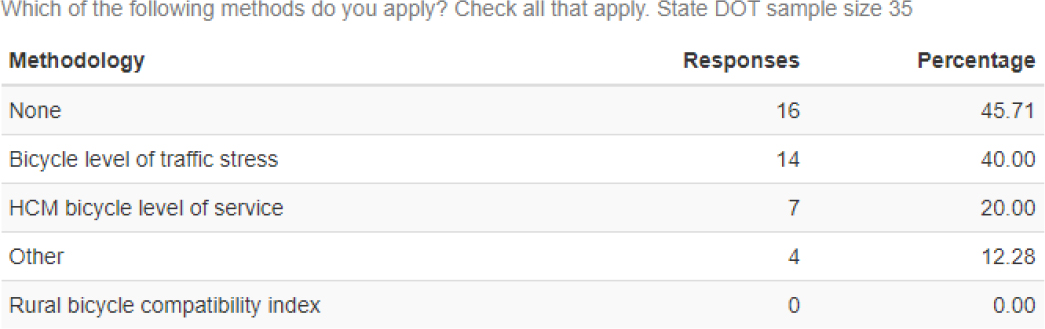
If we consider only responses from individuals working for a state DOT, four out of 35 respondents stated that they use none of the methodologies. The most used methodology is the BLTS, with seven responses. The HCM is less applied, with only 14 responses.
Table F-12. Methods applied – state DOT responses.
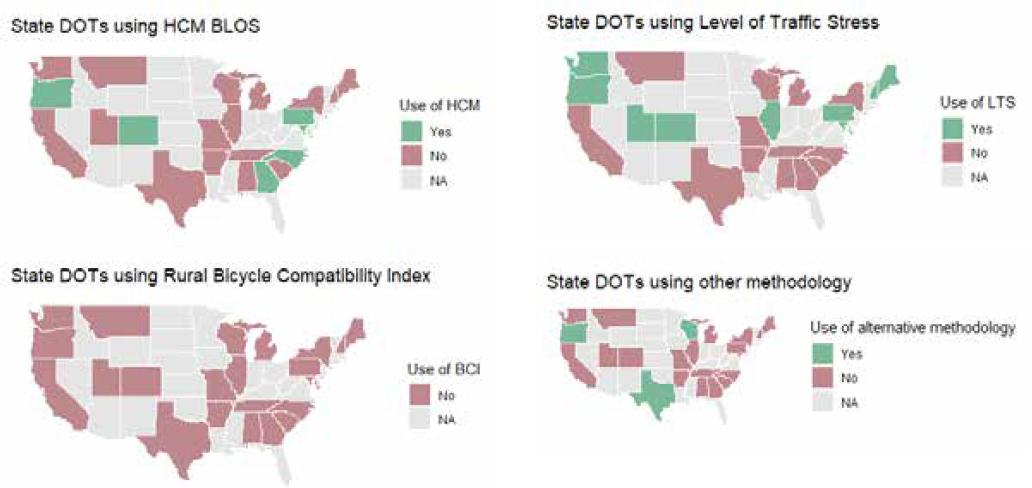
Then, we analyze the use of each method by each state DOT. Hawaii and Alaska used none of the methodologies.
Concerns for state DOTs are like other respondents, with data availability and insufficient staff being the most predominant.
Table F-13. Main concerns regarding bicycle indicators – state DOT responses
Data sources of state DOTs are predominantly aerial photographs, with only five respondents not using them.
Quality of Service for Rural Cyclists
The main section of the survey is devoted to assessing the influence on perceived quality of service of certain variables.
Firstly, respondents were asked to evaluate how sensitive are rural cyclist perceptions of quality of service to the individual variables. A 5-point Likert scale ranging from “1 - No effect” to “5 - Very sensitive” was used to categorize the responses. Responses for both shared lanes and
bicycle lanes were collected. They were classified into five main categories: design elements, traffic characteristics, traffic control elements, land use, and environmental conditions.
To better visualize the results, variables were arranged in descending order by median and mean value. It was checked that the order of how individual elements were presented did not influence the results (e.g., first element had always the highest scores, or elements are ordered by presentation order). Afterwards, a final comparison across all individual variables is performed.
Secondly, respondents were asked to rank eight groups of variables based on their relative importance to assess the quality of service for rural cyclists. Similarly, groups were ordered by median and mean values. Moreover, a comparison was included depending on the applied methods and the bicyclist's experience.
Analysis of Individual Variables
Design elements
For shared lanes, the design elements with the highest influence on perceptions of quality of service were speed limit and paved shoulder width, with most of the responses equal to “5 - very sensitive”. All other variables were also significant, with 26 to 47 responses equal to “4” or “5 - very sensitive”. They were, by order: pavement condition, grade, presence of on-street parking, driveway density, automobile lane width, sight distances, raised profile pavement markings, and horizontal curvature.
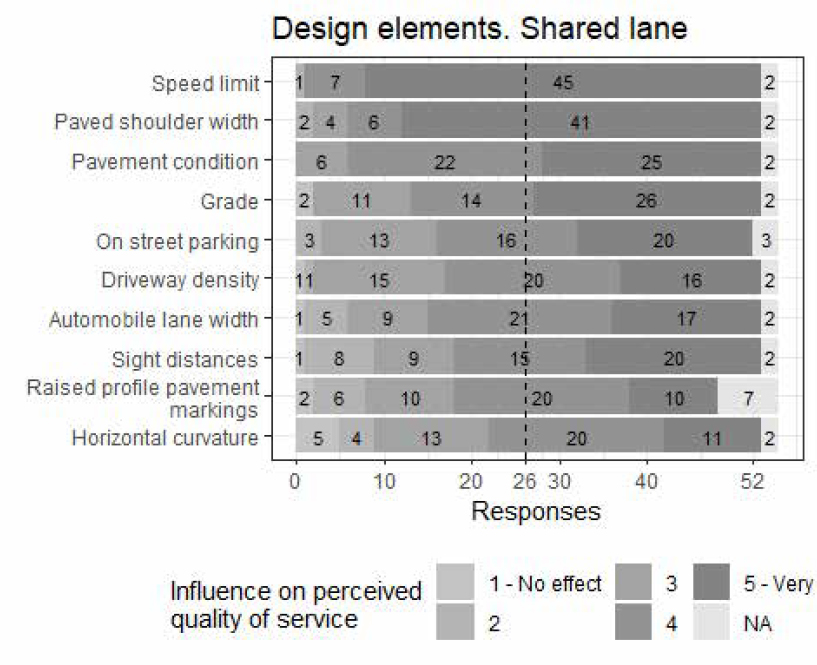
For bicycle lanes, the results were different. Firstly, the percentage of responses equal to “5- very sensitive” was lower than for shared lanes. For example, the speed limit was “5 - very sensitive.” To 45 respondents on bicycle lanes and 15 respondents on shared lanes. Secondly, it changed the relative order among design elements. The influence of automobile-related variables is lower on
bicycle lanes, and pavement and margin conditions have a more significant role. Specifically, pavement condition has the highest number of responses, “4” and “5 - very sensitive”, followed by on-street parking, speed limit, driveway density, or paved shoulder width.
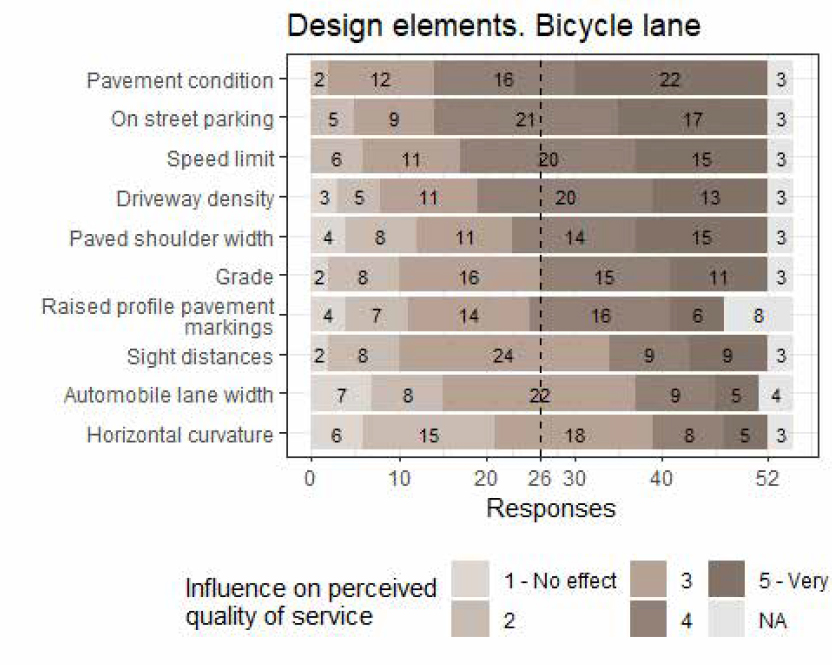
Traffic characteristics
As for traffic characteristics, we observe two groups of responses on both shared and bicycle lanes. The first group consists of “4” and “5 - very sensitive” traffic characteristics: lateral clearance, automobile average speed, speed differential, and directional automobile volume. These traffic characteristics are “clearance-related” and “speed-related.” In the case of shared lanes, the percentage of “5 – very sensitive” response is more significant than for bicycle lanes.
Other traffic characteristics presented more dispersed responses and the relative order differed in shared lanes and bicycle lanes. For example, bicycle volume had higher significance for bicycle lanes than for shared lanes. Not surprisingly, the influence of opposing traffic volume decreased on bicycle lanes, compared to shared lanes.
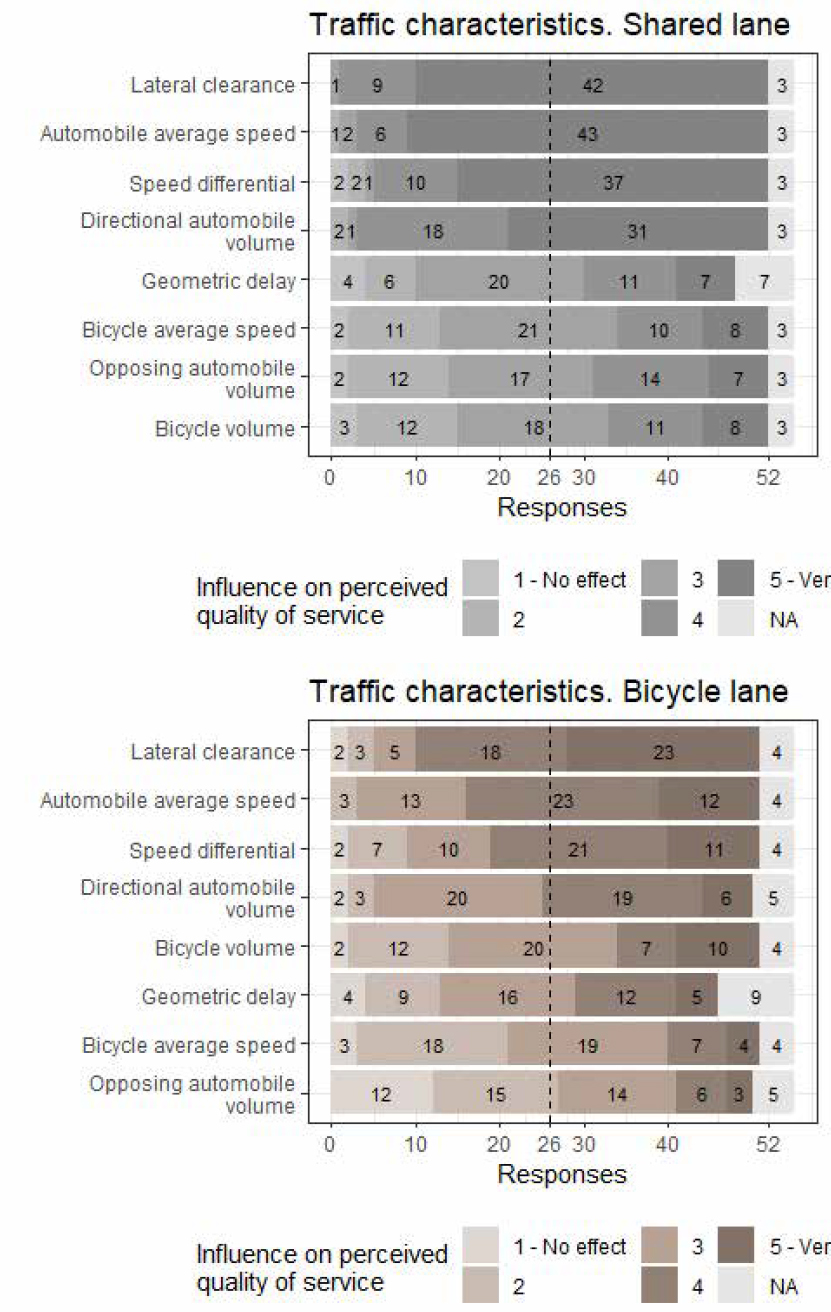
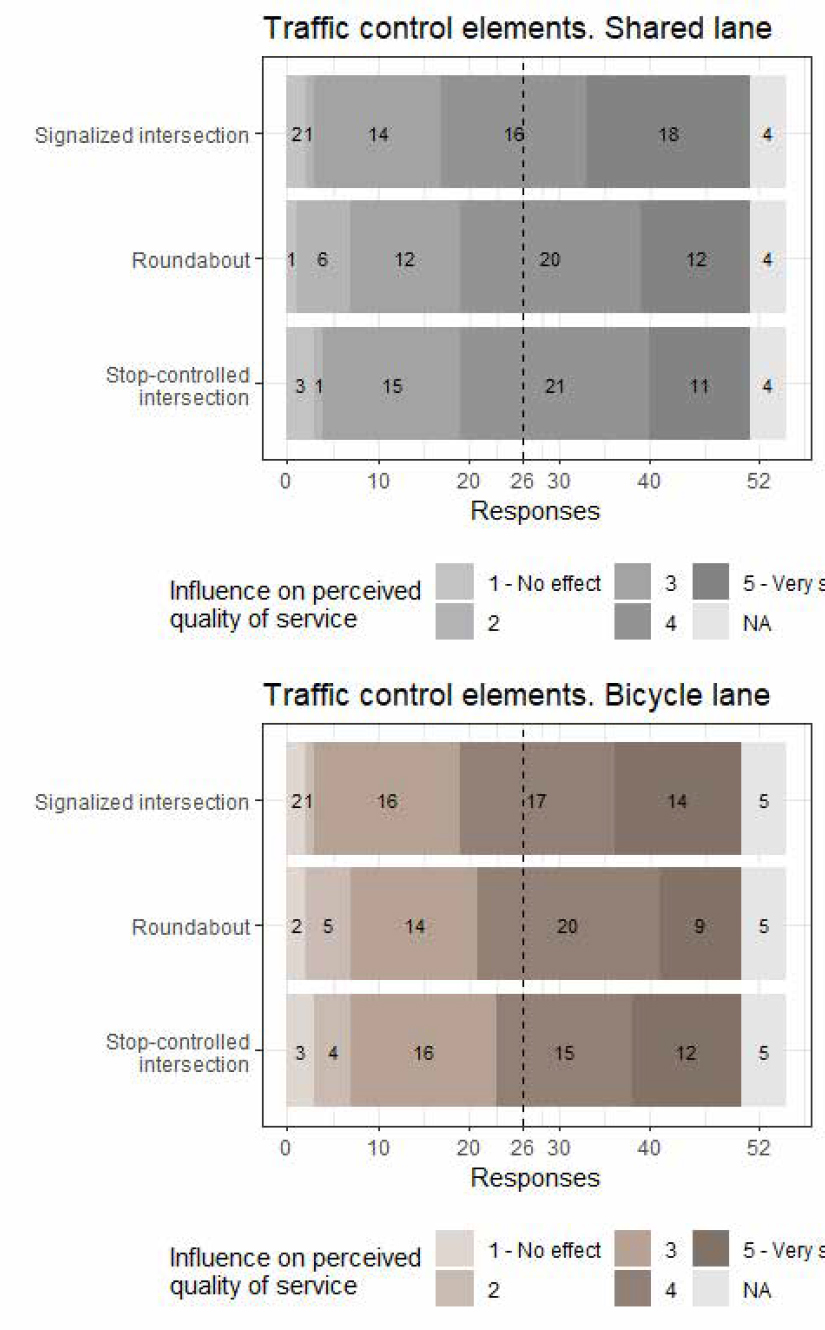
Traffic control elements
Signalized intersections, roundabouts, and stop-controlled intersections presented similar results for shared and bicycle lanes. Their influence on the perceived quality of service was between
“3.” and “5-very sensitive”, with most responses equal to “4”. Signalized intersections presented higher scores than roundabouts and stop-controlled intersections, although the differences were marginal.
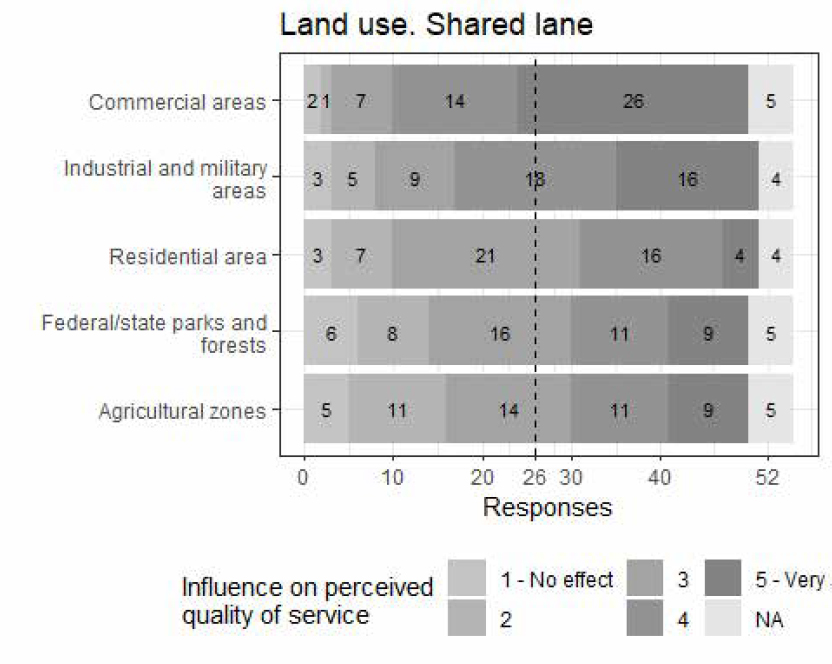
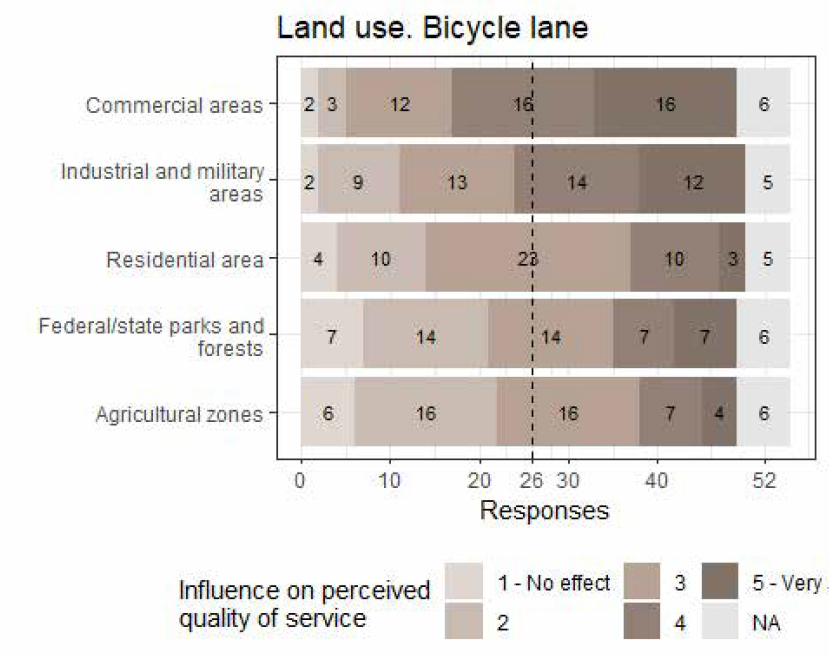
Land use
The relative order of adjacent land uses was the same for shared and bicycle lanes. The most important land use was commercial areas, mainly because it is expected to be a higher interaction between cyclists and other users, such as pedestrians or turning automobiles. In the case of shared lanes, 40 respondents indicated “4” or “5 – very sensitive”, compared to 32 respondents on bicycle lanes. The next land use was industrial and military areas, on where it is also expected some interaction with heavy vehicles. In this case, the number of responses equal or greater than “4” was between 26 and 34.
The land uses with the lowest influence on perceived quality of service were federal/state parks and agricultural zones. Most of their responses were equal to “2” and “3”.
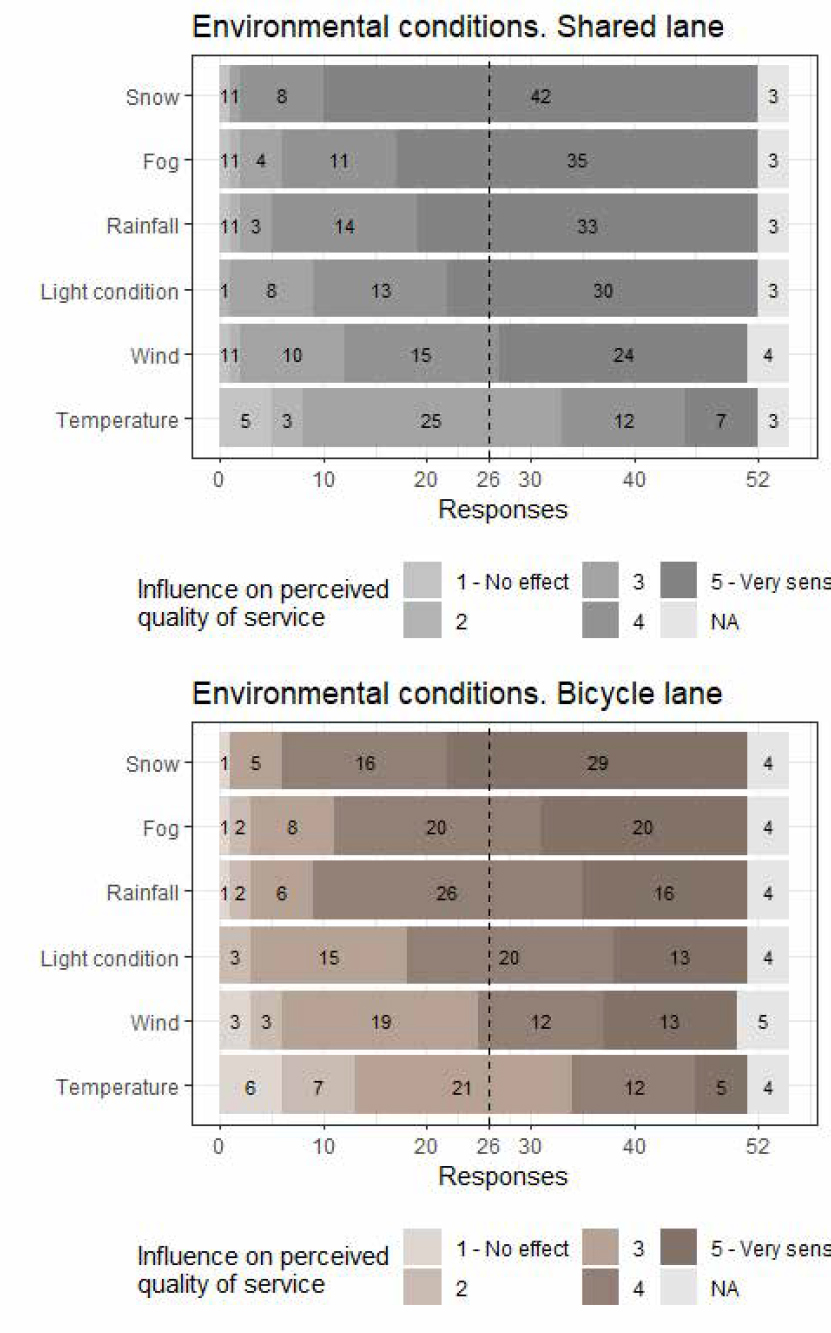
Environmental conditions
The last group of elements was environmental conditions. Most responses were “5 – very sensitive” for snow, fog, rainfall, light conditions, and wind. This relative order of environmental conditions was the same for both shared and bicycle lanes. Similar as previous groups, the percentage of “5 – very sensitive” responses were higher on shared lanes. Temperature had more dispersed responses, with most responses equal to “3”.
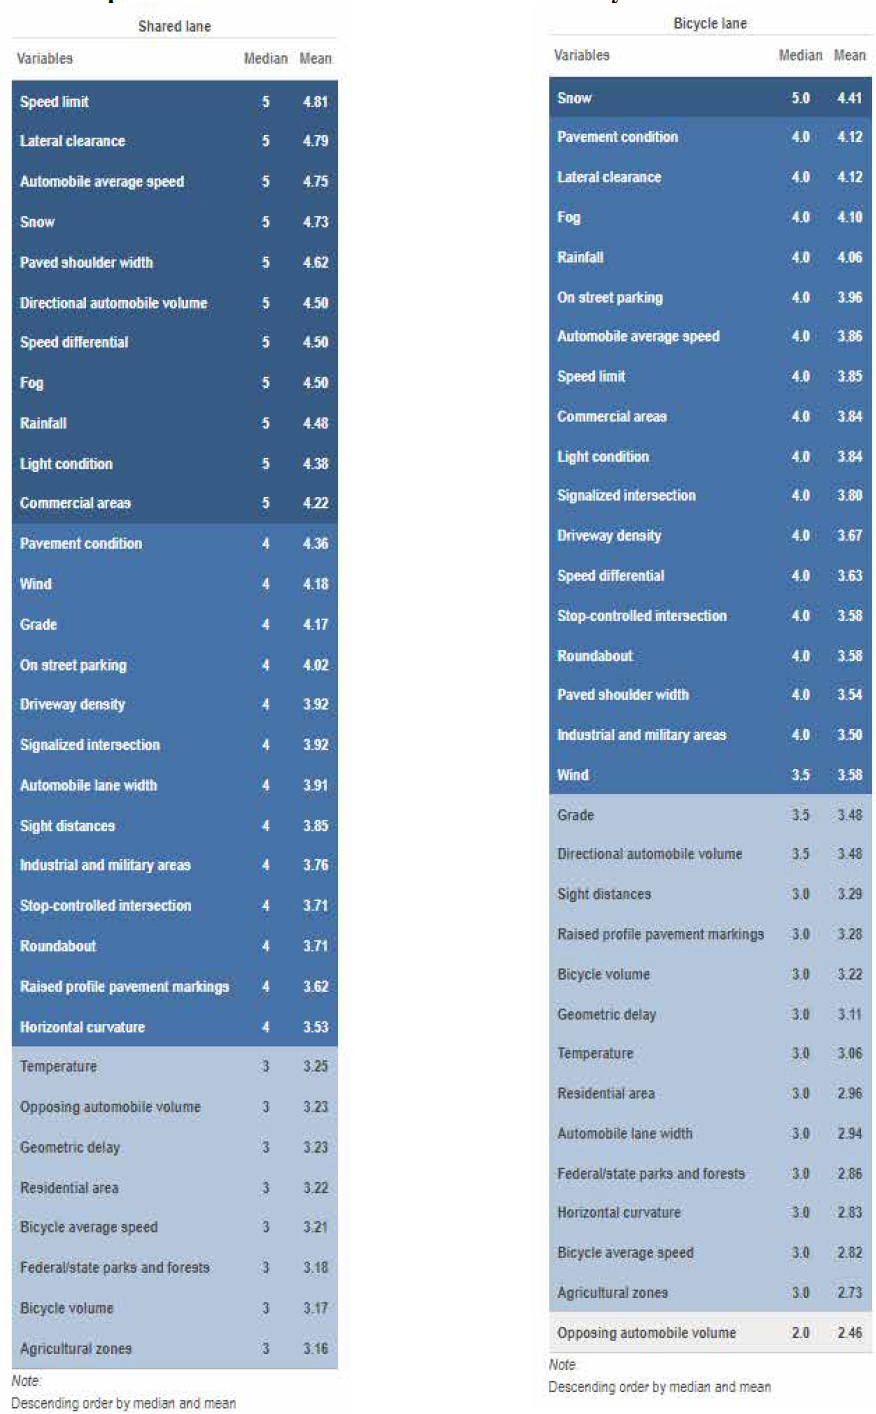
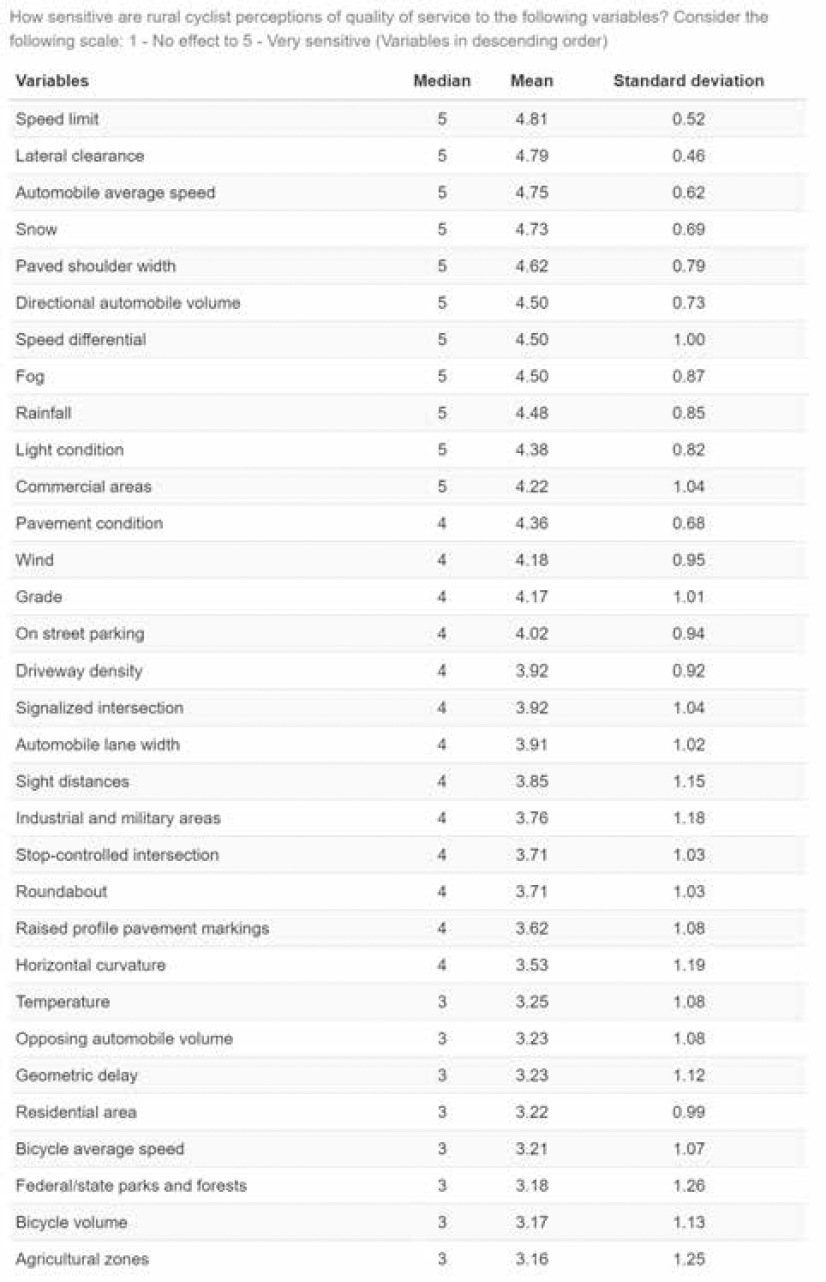
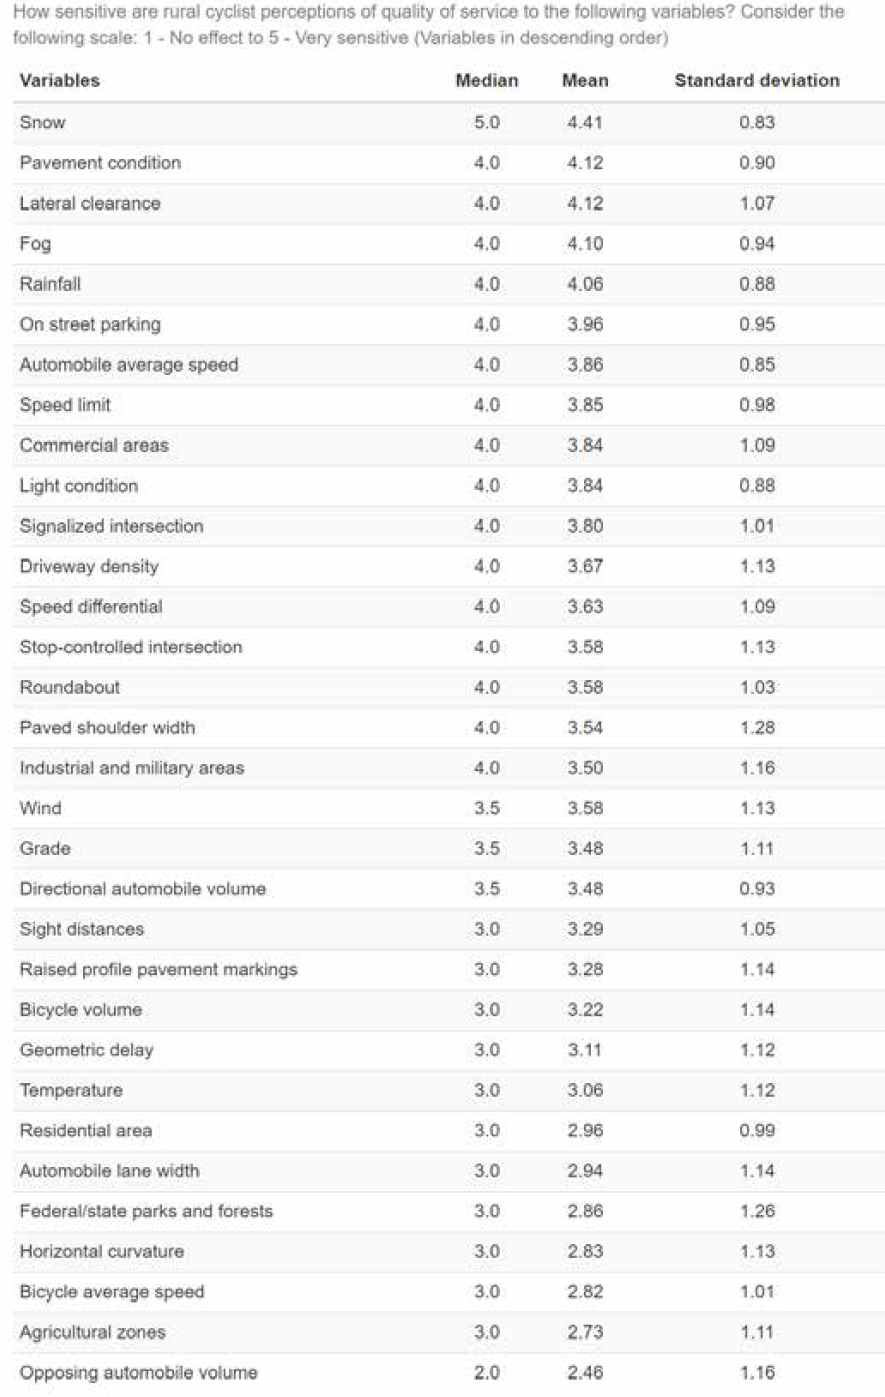
Comparison Across Variables
In a final step, all variables were compared and arranged in descending order by median and mean values. The aggregated summary included inter-quantile range (IQR) as a measure of
dispersion. IQR represents the range of 50% central responses. The higher the IQR, the more dispersion on central values. This metric was preferred over standard deviation because Likert scales are ordered variables and responses are not normally distributed around a central value.
We can observe that the order and median value slightly differ between shared and bicycle lanes. However, there are commonalities between shared and bicycle lanes. The most important elements for both facilities can be arranged as follows:
- “Speed-related”: speed limit, automobile average speed, speed differential
- “Clearance-related”: lateral clearance, paved shoulder width
- “Environmental-related”: fog, light condition, wind
- “Hindrance-related”: directional automobile volumes, commercial areas, on-street parking, driveway density
- “Actual pavement condition”: pavement condition, snow, rainfall
- “Delay-related”: intersection, roundabout
Overall, shared lanes presented higher median and mean values. The relative importance of speed-related and clearance-related elements was higher for shared lanes than for bicycle lanes. On bicycle lanes, environmental and activity volume-related elements played a more important role, as separated bicycle lanes reduce the impact of automobiles on perceived quality of service. In both cases, pavement condition was highly important. The HCM analysis procedure for bicycle mode accounts for most of them, except for environmental factors.
Rank of Variables
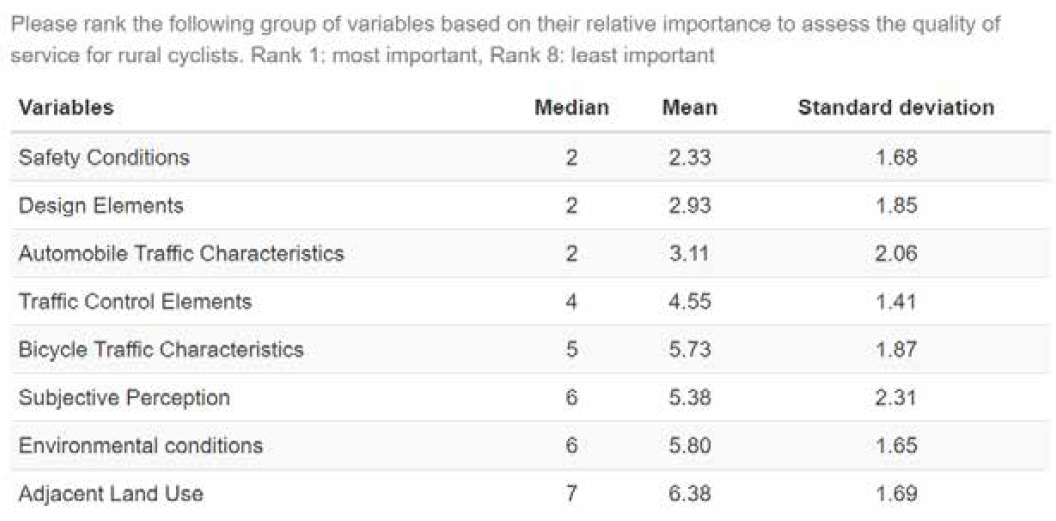
In the last question of this section, respondents were asked to rank eight groups of variables based on their relative importance to assess the quality of service for rural cyclists.
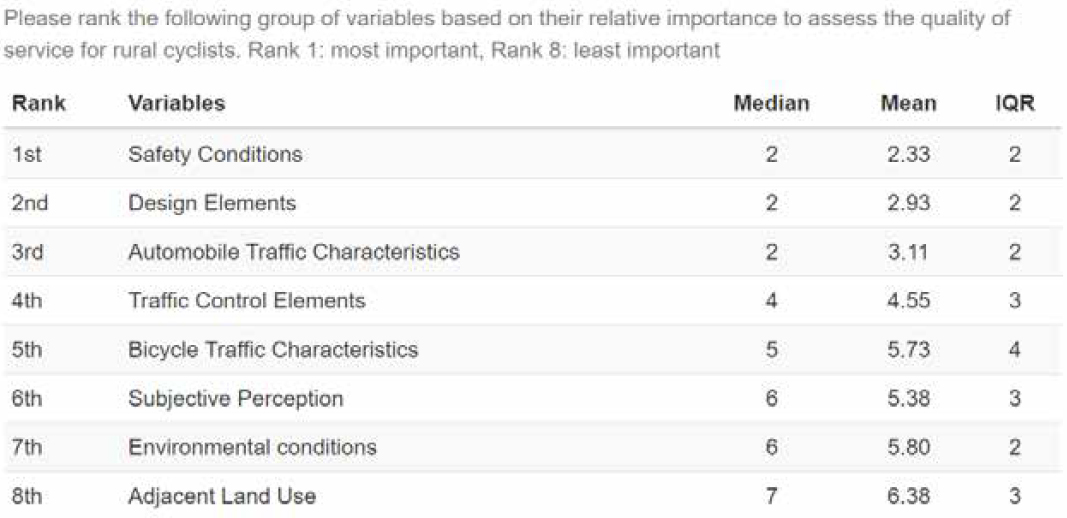
Firstly, we analyzed the frequency of each response. To facilitate the visualization, we merged the responses in four ranks: “1st – most important or 2nd”, “3rd or 4th”, 5th or 6th” and “7th or 8th – least important”, and ordered the elements based on their median rank. Safety conditions were the most important group of variables, followed by design elements and automobile traffic characteristics. Most of the respondents ranked them as “1st or 2nd.” The next group of variables was traffic control elements, with 29 responses “3rd or 4th.” The least important groups of variables were subjective perception, bicycle traffic characteristics, environmental conditions, and adjacent land use. We found that most responses were equal to “7th or 8th”, although they presented higher dispersion, as seen with IQR between 2 and 4. The relative importance of this ranking produced different results than the individual comparison across variables. Firstly, the influence on the perceived quality of service of environmental-related elements was “very sensitive,” while the ranking of environmental conditions was between “5th” and “8th – least important” for 42 respondents. This aligns with current methodologies, where environmental conditions are not accounted for. Secondly, activity volume-related elements were also significant, but in the ranking, adjacent land use had the lowest ranks (“7th or 8th”). However, it could be a translation between the most influential categories and the highest levels: “speed-related,” “clearance-related,” and “pavement condition” affect safety conditions, and some of them are either design elements or automobile traffic characteristics. The results suggest that the grouping of variables in the last question was not entirely aligned with the individual responses. Therefore, one recommendation for future work would be to rename the variables more meaningfully rather than by design or traffic.
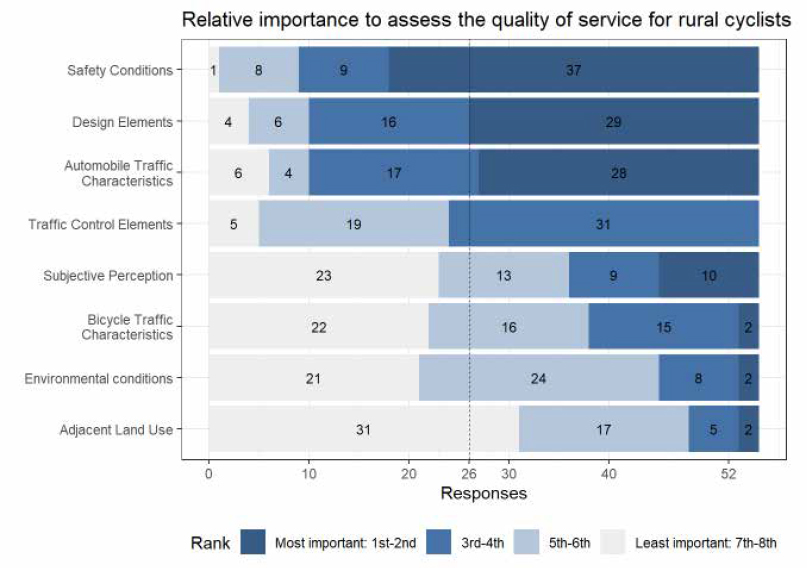
Table F-15. Ranking of elements – statistics summary
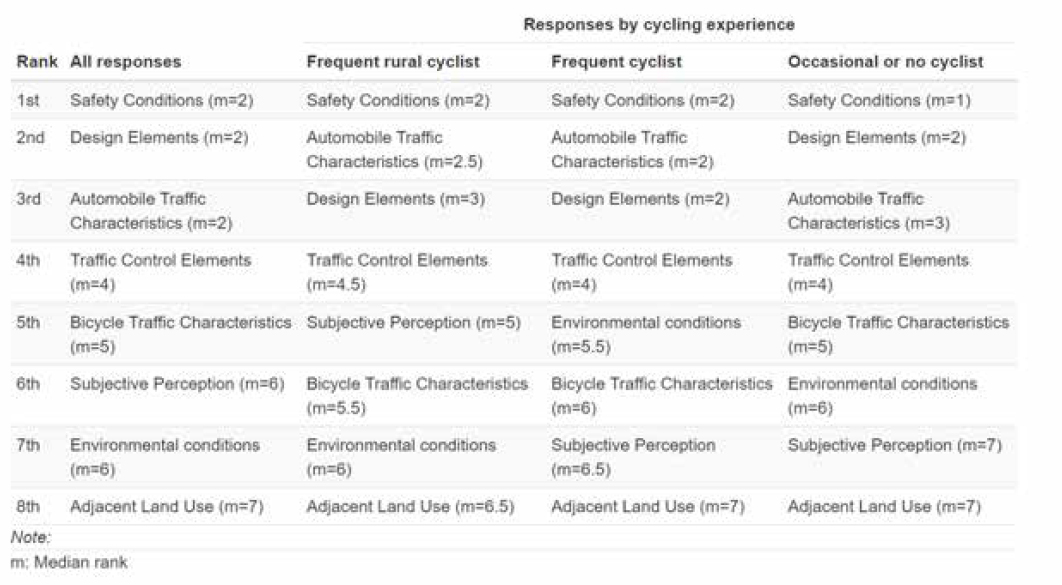
Afterwards, we analyze if the respondent cycling experience had an influence on how variables were ranked. We used three categories of cycling experience:
- Frequent rural cyclist: cycles for commute and/or leisure on rural highways at least once per week.
- Frequent cyclist: cycles for commute and/or leisure in urban areas and/or rural segregated bicycle ways at least once per week.
- Occasional cyclist or no cyclist: cyclists that cannot be classified as frequent rural or frequent cyclist.
The results indicated slight differences depending on cycling experience. Respondents agreed on the three highest ranked variables: safety conditions, design elements and automobile traffic characteristics. However, frequent rural and frequent cyclists valued more automobile traffic characteristics than design elements, compared to occasional or no cyclists.
The three groups also agreed on the fourth ranked group: traffic control elements and the four lowest-ranked variables: subjective perception, bicycle traffic characteristics, environmental conditions, and adjacent land use. We could observe that frequent rural cyclists provided lower relative importance to environmental conditions than other cyclists and valued more subjective perception. On the other hand, occasional or no cyclists valued more bicycle traffic characteristics, which had a lower ranking for frequent rural and frequent cyclists.
Table F-16. Ranked variables by cycling experience.
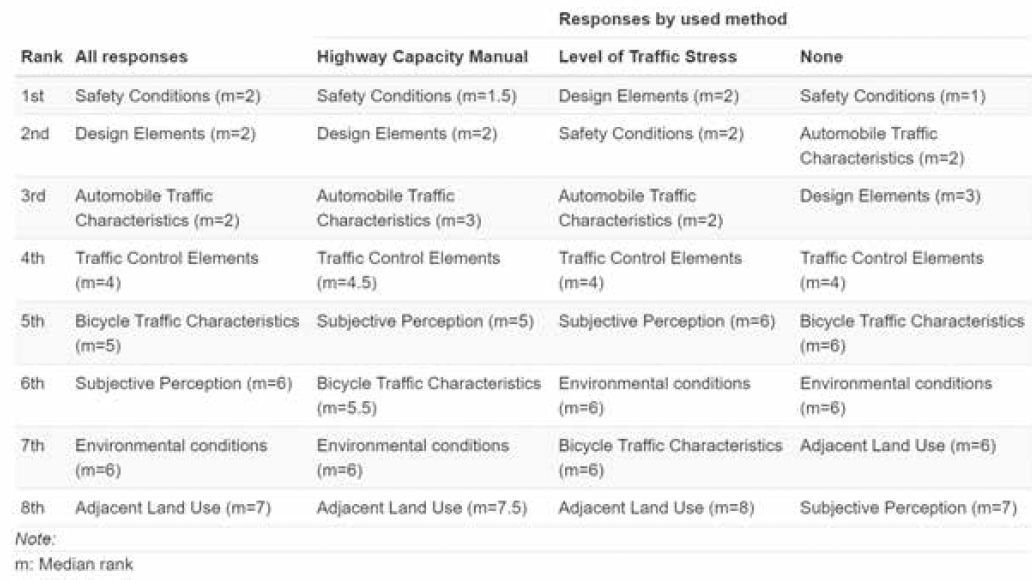
A similar analysis was carried out depending on the applied methodology. There were minor differences. Significantly, users of the LTS ranked higher design elements than safety conditions.
Table F-17. Ranked variables by applied methodology.
Defining Rural Cyclists
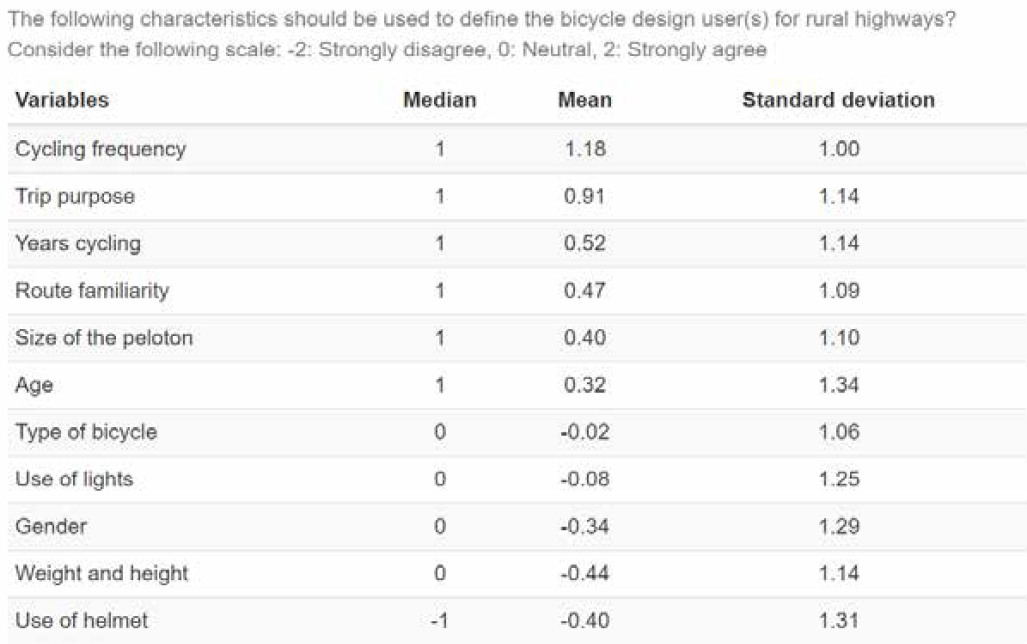
The third section of the survey included questions to define the rural design user. Specifically, respondents were asked to indicate their agreement to: The following characteristics should be used to define the bicycle design user(s) for rural highways.
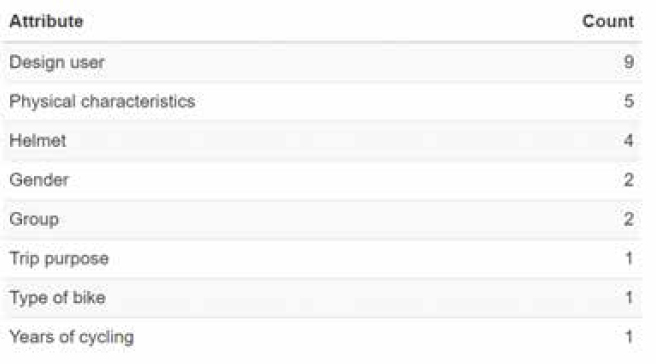
The most significant characteristics to define rural cyclists were bicycle trip frequency, trip purpose and years cycling. For those variables, many respondents expressed strong agreement or agreement (between 33 and 46). Other variables that had positive responses were size of the peloton, age, and route familiarity (between 28 and 30). For all previous characteristics, the number of respondents indicating disagreement or strong disagreement was lower than 14. Opinion seems divided about the type of bicycle, use of lights, gender, weight/height, and helmet use. The number of respondents that “strongly disagree” and “disagree” varied between 17 and 23 and outnumbered the respondents indicating “agree” or “strongly agree” (between 10 and 17). In these characteristics, “neutral” had the highest number of responses. Finally, the use of helmet had significantly more disagreement responses than agreement responses, with 27 replies either “strongly disagree” or “disagree,” compared to 14 responses “agree” or “strongly agree.”
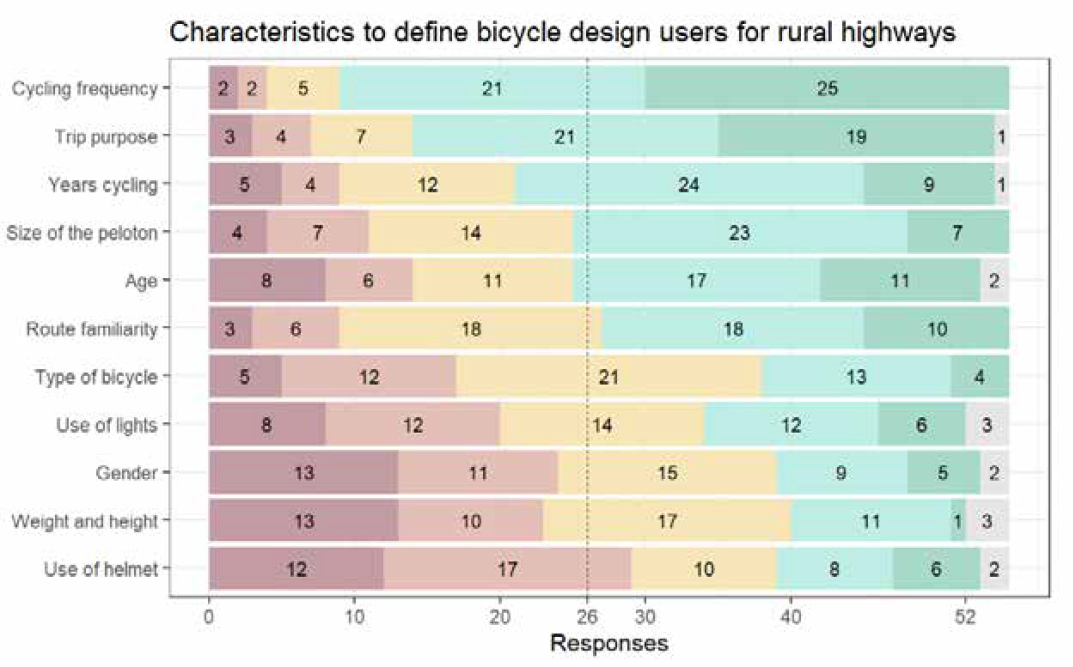
Table F-18. Bicyclist attributes -statistics summary
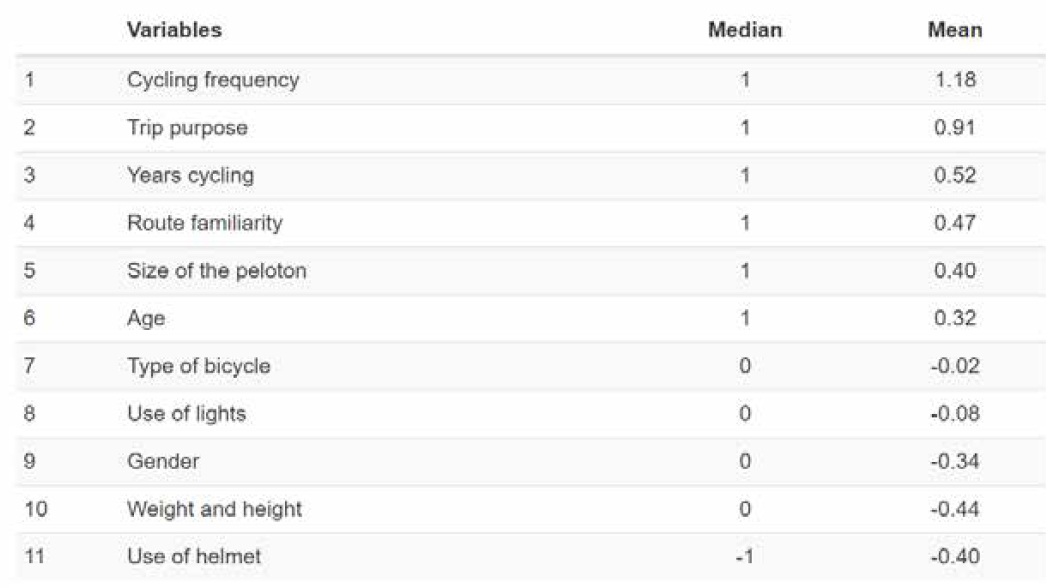
Similar conclusions can be derived from the analysis of median and IQR. Most respondents indicated agreement with the idea that cycling frequency, trip purpose, years cycling, size of the peloton, age and route familiarity could be used to define bicycle design users for rural highways (median = 1, IQR <= 2). Neutral opinions were found for type of bicycle, use of lights, gender, and weight/height, although there was a high dispersion on the responses (median = 0, IQR >= 2). Most respondents indicated disagreement with the use of helmet as one characteristic to define bicycle design users (median = −1, IQR = 2).
The results align with the Rural Compatibility Index, which defines bicycle users based on trip purpose and level of experience (experienced commuter, experienced recreational, and casual recreational). A lower level of agreement is found with the BLTS, which utilizes a level of experience and confidence to define bicycle users (“no way, no how,” “interested but concerned,” enthused and confident,” and “strong and fearless”).
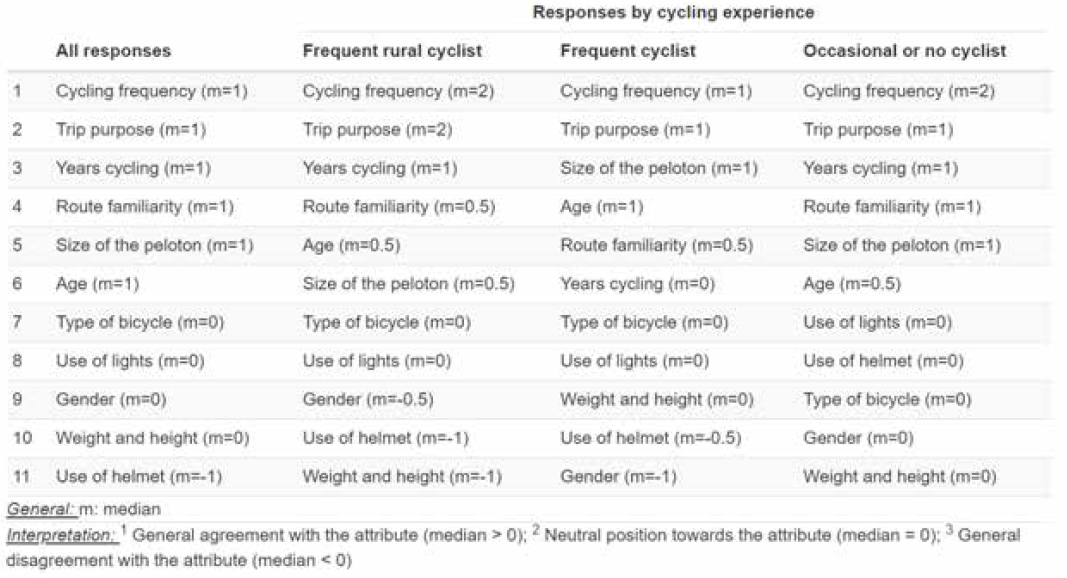
We also analyzed the responses based on cycling experience. Frequent rural cyclists found more robust agreement with using cycling frequency and trip purpose to define bicycle design users (median = 2) compared to other users. The attributes that all respondents found agreement with were the same. Differences were observed in the details where disagreement was indicated. Frequent rural cyclists and frequent cyclists suggested a more robust debate by defining users based on gender, helmet use, or physical characteristics (median < 0). For occasional or no cyclists, all attributes presented positive or neutral responses (median >= 0).
Table F-19. Bicyclist attributes by cycling experience of the respondent.
The analysis by applied methodology reveals similar results. There was a general agreement on which attributes should be considered to define design users by all respondents. Interestingly, HCM and LTS users had a neutral response towards route familiarity and strongly agreed with cycling frequency. HCM users disagreed more on more attributes, such as the type of bicycle, helmet use, gender, and physical characteristics.
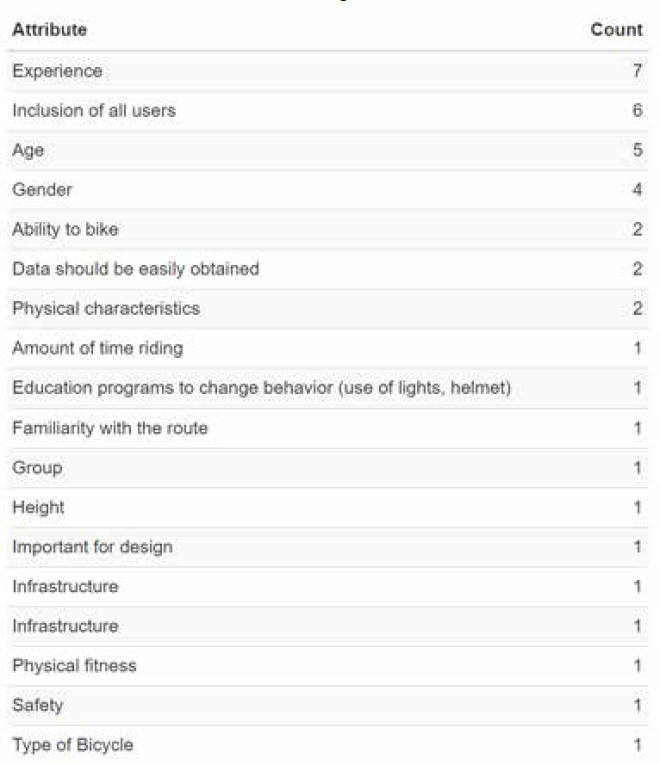
Some respondents also provided further comments on a free-text box. The words were analyzed and classified by which attributes shall be considered when defining the design user. Not surprisingly, experience was mentioned by more respondents, as well as age.
Table F-20. Comments to bicyclist attributes. Attributes that should be considered
Some comments also indicated which attributes were not significant to the respondents. 9 out of 51 respondents stated that there is no need for a design user and that it should be designed for all users regardless of age, abilities, or experience. Other attributes that were explicitly mentioned to not be considered were physical characteristics, helmet use, or gender.
Table F-21. Comments to bicyclist attributes. Attributes that should not be considered?
Conclusions
An online survey was designed to identify potential revisions/improvements to the HCM LOS methodology and/or the AASHTO Green Book design elements. The main conclusions of the study are:
- Respondents felt that the most important elements to rural cyclists in their assessment of quality of service, for both shared lanes and bicycle, are classified as: 1) speed-related; 2) clearance-related; 3) actual condition of pavement; 4) hindrance-related; 5) environmental-related and 6) delay-related.
- The relative importance of speed-related and clearance-related elements was believed to be higher for shared lanes than for bicycle lanes. Environmental and hindrance-related factors played an important role in bicycle lanes, as separated bicycle lanes may reduce the impact of automobiles on the perceived quality of service.
- The individual analysis of elements revealed a high sensitivity to environmental factors. However, environmental factors were ranked in the latest positions when compared to other variables. The disparity in the results may suggest the need to reformulate the question for future analyses.
- There was a general agreement on using the following attributes to define bicycle design users: bicycle trip frequency, trip purpose, years of cycling, peloton size, age, and route familiarity. These results are consistent with the Compatibility Bicycle Index, which defines bicycle users based on trip purpose and level of experience, and BLTS, which utilizes a level of knowledge, confidence, and willingness to cycle.
- There is a division of opinions regarding the definition of bicycle design users for rural highways. Many respondents indicated that all users must be considered, regardless of their attributes. However, an equal number of respondents stated that user type must be considered. Obtaining additional responses may provide more clarity on the design user definition.
The study's conclusions are limited to the designed questionnaire and the collected responses. Extrapolating these results to specific geographical areas should be cautiously undertaken since the sample size was limited. Based on these conclusions, the recommendations of the study are:
- BLOS scores for shared and bicycle lanes should be distinct, as their sensitivity to variables differs. The results of this survey should be further validated with an effort to collect user perceptions of the groups of variables by facility type.
- Corridor analyses should be considered to evaluate the quality of service for cyclists along rural highways. A future methodology should be able to accommodate different facility types and context classifications seamlessly.
- This research points to the need for future discussions on the role of bicycle user segmentation for operational analyses. If the HCM analysis procedure aligns with the current LTS-based design criteria, different LOS thresholds should be considered for bicycle users. The most important characteristics have been identified, but specific criteria and thresholds still need to be defined.
The team designed a survey targeted to bicycle riders on rural highways to validate the conclusions from the transportation planner/engineer practitioner survey. Based on the results of
both surveys, recommendations on potential revisions/improvements to the HCM bicycle LOS methodology and user segmentation were developed.
Supplementary Appendix
Shared Lane. Statistics Summaries
Bicycle Lane. Statistics Summaries
Ranked Variables. Statistics Summaries
Bicyclist Attributes. Statistics Summaries
Data Sources. Open Question
The comments are not edited.
Comments:
Would like to see more effort than currently doing. Getting counts has become so much easier and cost-effective in recent years. It’s more about realizing the ease of getting data and then taking the time to get the data.
Limited availability, coverage, and reliability for most elements specific to bike infrastructure and operations.
A lot of information is available from DOT records (roadway management system, etc.), aerial views, and street view style data (either DOT developed or publicly available). I support projects all over the country, so often the only perception of the site is via the computer screen. Available data is often challenging (especially on not state highway system). Without good data, we are generally making engineering decisions based on qualitative determinations.
Currently have no bicycle counts.
We have had several intermittent efforts but minimal ongoing.
We get input from the local authorities as to whether they prefer bicycle accommodations in their jurisdiction. We either refer to a locally adopted plan and or speak with local officials about their preferences.
Hard to find money to do these data collections.
Bicycle Count Data - this relates to issues for operational analysis where traffic engineers (who translate plans into concrete) are not able to assess the impact related to the loss of shoulder or bike lane for motor vehicle turn lanes (right-only or left-only) and then failing to provide proper marking and signing to address merging movements.
DOT’s do not, as a rule, count bicycle traffic in rural areas. They rely on local counts or 24 hour counts which do not reflect need. They rely on crash data, but the field seems to be transitioning to ‘near-miss’ data at intersections and Streetlight data (or similar) for planning work.
Rural roads in PA have horizontal and vertical curve issues that lead to poor lines of sight - very expensive to fix.
Most of the rural communities I work with do not have the means to collect data themselves and therefore rely on what’s available from other agencies, which can often be complicated to access.
We don’t have an inventory of bicycle facilities; we lack count data as well. We rely on roadway conditions, surrounding land use, regional/local plans, and crash data. There are also challenges within roadway improvement projects to evaluate and make improvements for bicycling at times.
We do not collect extensive bicyclist data.
We currently have somewhat limited data available. We use NHDOT’s TDMS (MS2) for motor vehicular data, but it has little to no nonmotorized data (only in some TMC data). We have access to STRAVA Metro, which is helpful to see relative use of nonmotorized volumes, but it doesn’t capture all users and varies by region and demographics. We currently use GIS data in a limited means but hope to bring in BLTS and facility inventory data into layers for all to use.
Historically, in rural areas it is difficult to get traffic count information that includes cyclists and pedestrians even though these road users are there. Now with COVID, current traffic counts to include cyclists (and pedestrians) are less likely to be done because of the effects of COVID on travel patterns
Expensive and difficult to measures bicycle traffic volumes in a systematic way. Difficult to forecast impacts of different infrastructure improvements due to limited data availability/sample size. Lack of engineering resources to predict how shoulder widening will affect design speed of roadway for vehicles.
Vehicular traffic volume data, and roadway geometric data is readily available. Bicycle volume data is limited.
Bicycle count data is basically not available to planners and designers for rural highways. Bicycle usage levels are often anecdotal at best, Traditional traffic counts use FHWA vehicle class bins, which do not include bicycles. Data would be useful in both assessing quality of service and to provide input into design. With crowdsourced data that is becoming available, it seems to me that some standards to validate that data should be considered against actual counts.
Depending on the area, there is a lot of manual and expensive equipment to gather data
Limited data is available from the state DOT. We need to find ways to collect data ourselves. Without a dedicated funding stream, it is difficult to keep bicycle specific data up to date.
Bicycle counts, routing data is generally spotty. Counts done for vehicles may not capture actual bike peaks or times.
The department’s bicycle asset data is incomplete and/or outdated, making bicycle analyses less accurate or applicable.
It is difficult to obtain - some local and state agencies have installed bike counters which is very helpful but also expensive.
Acceptable
Often do not have time/cost to collect very detailed geometric data for long corridors.
Bike lanes are not applicable to our conditions.
Maine has historically only had limited collection of bike–ped data and therefore we traditionally respond on a case-by-case basis. We had explored a statewide program about 4 years ago, but it was eliminated because of budget constraints.
Funding is always an issue when designing/maintaining bike facilities.
Data availability - use Stava data to show high use corridors, some routes or municipalities collect count data that is available to state agencies. We also have ability to classify bike at traffic signals with detection equipment. Cost/Effort - Stava data is readily available. The other count data take time to set up, retrieve and then analyze.
We have limited data available. In rural areas we typically design for motor vehicles and check design criteria for bikes unless developing a detached multi-use trail. We incorporate local agency bike/ped plans and make connections to transit, so those are data sources most often used.
Bicycle surveys are difficult to design and implement. Strava or other crowdsourced data is becoming more available and complete for relatively low cost.
In Spain, there is no data available on traffic vs. users in rural environments.
We typically have used GIS data from OSM which is of low quality for cycling infrastructure but very cheap and easy to process.
Bicyclist attributes. Open question
The comments are not edited.
Comments:
Might need to think about how important it is to distinguish design users. Shouldn’t we be striving to design for all users? Why are bicyclists different than pedestrians or the vehicle classification when it comes to design?
Also, can’t create stereotypes that might classify users. High school students could ride a route all the time and become Tier 1 cyclists where a great athlete who thinks they can ride a bicycle but is not very smart when it comes to traffic issues could be Type 3. A poor person could be Type 1, where a rich person with a fancy bike could be Type 3.
Only importance I put here was height because that affects sight distance.
Rural cyclists are mainly recreational, but some may also commute on a regular basis changing their behavior as opposed who don’t. Amount of riding time per year would be a better factor than trip purpose.
We should be designing for all ages and abilities, not just the highly confident cyclists. Age is tricky as we would not typically see an unaccompanied minor operating on a rural stretch,
Any public road should be open and accessible to any users of any experience, equipment, trip purpose, solo or in group. And WHY THE F is use of helmet even listed? That is irrelevant.
I selected the characteristics should not be used because it would be extremally difficult to collect the data.
They cannot be said to categorically affect how a user will desire safe infrastructure.
Comfort varies with experience, age, gender, and familiarity with the route. Bicycling in groups make create lateral and longitudinal interferences, which may affect comfort too.
Helmet Use is not relevant in rural contexts. Paint will not protect riders from poor driving decisions made by motor vehicle operators and a plastic helmet will not prevent a 55mph vehicle from catastrophically damaging a human body. Safe system principals… assume humans make errors and work to prevent those errors. Time to recognize another human on the road, good traction to allow better control of the vehicle, better lines of sight… and so on.
Gender and physical characteristics are not relevant. Some riders are slower and others faster. Some more risk averse. But not enough to matter here.
Note that AGE is relevant… children 6-16 are less able to judge motor vehicle speeds and ride less predictably. Accommodate with wider shoulders or bike lanes.
A helmet only does so much to protect a cyclist, so the presence of a helmet shouldn’t impact roadway design.
Wouldn’t consider cycling in a group necessarily for design more if that lead to bicycle trip frequently or higher bike users’ volumes, not for peloton groups (rare/occasional). Use of helmet difficult to assess. Use of lights, first all bikes should have lights just like vehicles have head and taillights, should consider overall lighting needs of the system. Physical characteristics such as weight/height not sure why a characteristic to consider, if it was abilities (e.g. people with mobilities, cognitive issues) may want to consider.
Height and weight do not necessarily separate the population out in a very meaningful way unlike age, gender, and years of cycling.
Type of bicycle.
“Use of lights” is a behavior that can be easily influenced/addressed through education and safety programs. Same comment for “use of helmet.”
From an engineering standpoint, if bicycles frequently use a facility, then designs should accommodate a broad range of vehicle or person characteristics. Using data that can be easily obtained is ideal.
Because they do not reflect on the safety of the user or surrounding users
For publicly funded projects, pathways should be accessible to most users regardless of the type of the bicycle used, the person’s physical characteristics and their gender. The age is somewhat important but that should be covered in design standards (no steep slopes, etc.)
Any of these criteria can vary widely within any given cyclist group type (experience level) as for the peleton question, that is too skewed toward “pro” type riders
Size of the group is not an important factor, nor is the type of bike being used. What SHOULD be included: Characteristics should include all ages and abilities - the experience, years of cycling could mean two separate things depending on the person rating. They could think it is important if the years of experience is low or could rate it high if years of experience is high… With more women biking and with ebikes, many people are extending their ability and willingness to bike - I do think those are important factors. Unfortunately, a woman biking alone in a rural area may not feel safe.
I don’t see where gender or height/weight is relevant. Experience and overall physical fitness of the users is far more important.
Important for design purposes.
Well for the Physical characteristics, Gender, and Age, I don’t think those should be looked at because bicycle infrastructure should be designed for all users.
I think that experience level in terms of “years of cycling” is an inaccurate measure, someone may be biking for 50 years and not be comfortable on certain facilities, whereas someone else could be a new cyclist and have much higher risk tolerance.
Bike facilities should be designed for all bike users regardless of age, gender, experience, or safety equipment.
Gender, physical characteristics.
I don’t see the connection with Physical characteristics and gender for designing the facility.
Thinking primarily about general or roadway or transportation facilities - some things should not be considered such as gender (unless designing bathrooms or other ancillary facilities) or other physical features height or weight). Some characteristics are the responsibility of the rider (use of lights, helmet, type of bike). Only specific facilities may want to consider user types (school routes, retirement community, recreational or vacation areas) but in general, facilities should accommodate all users.
Final comments. Open question
The comments are not edited.
Comments:
Additional consideration of bike signal operations, bi-directional travel opportunities, access to destinations, predictive safety analysis.
Developing an interactive tool that is flexible to accompany the guide will be useful.
The HCM should explore the trade-off between providing increased shoulder width for bicyclists and increased motor vehicle speeds after shoulder widening is complete. While this may create a more comfortable operating space for bicyclists, it could have effect of increasing crash severity.
TxDOT has recently provided updated Bicycle Accommodation Design Guidance that has a wider variety of alternatives available.
Having access to good data is most important. Prevailing speed, traffic volumes, and shoulder width are most important. When there is good input data, our model works very well. We are still working on establishing BLTS as a performance metric and project selection tool.
Presence of rumble strips and debris.
Would like bicycle quality of service to address sight distance on rural corridors. Specifically, roadways with 40+ mph speed limits that have less than 12’ lanes and/or no shoulder. Current methodology is evaluating these corridors with LOS C or better and/or low traffic stress indicating that they would be ideal for the average recreational bicycle user. Only the most experienced bicycle users, often in groups, will use these roadways due to the mixed traffic condition.
Both are part of the TransAmerica Trail.
Rural Corridors with High Bicycle Volume Proposed by Respondents