Developing a Guide for Rural Highways: Reliability and Quality of Service Evaluation Methods (2024)
Chapter: Appendix G: Bicycle Quality of Service on Rural Highways, Survey of Bicyclists
Appendix G: Bicycle Quality of Service on Rural Highways, Survey of Bicyclists
Complete results from the models described here can be obtained from the authors with reasonable request.
Introduction
Objective
The user survey aims to identify the drives and constraints on rural cycling, either for commuting or leisure, for different user types. The results will indicate which variables are more relevant to users to cycle (or not) on rural highways. Based on the results, we will recommend future research on improving and revising existing HCM’s BLOS evaluation and Green Book design guidance to accommodate users’ revealed preferences.
Survey Structure
The survey was designed in LimeSurvey and contained the following main sections:
- Introduction and welcome
- Bicyclist segmentation
- Choice tasks:
- Instructions for rural highway scenarios
- Rural highway scenarios (first four choice tasks)
- Rural highway scenarios (second four choice tasks)
- User type specific questions:
- Leisure cycling experience on rural highways
- Typical cycling experience
- Closing
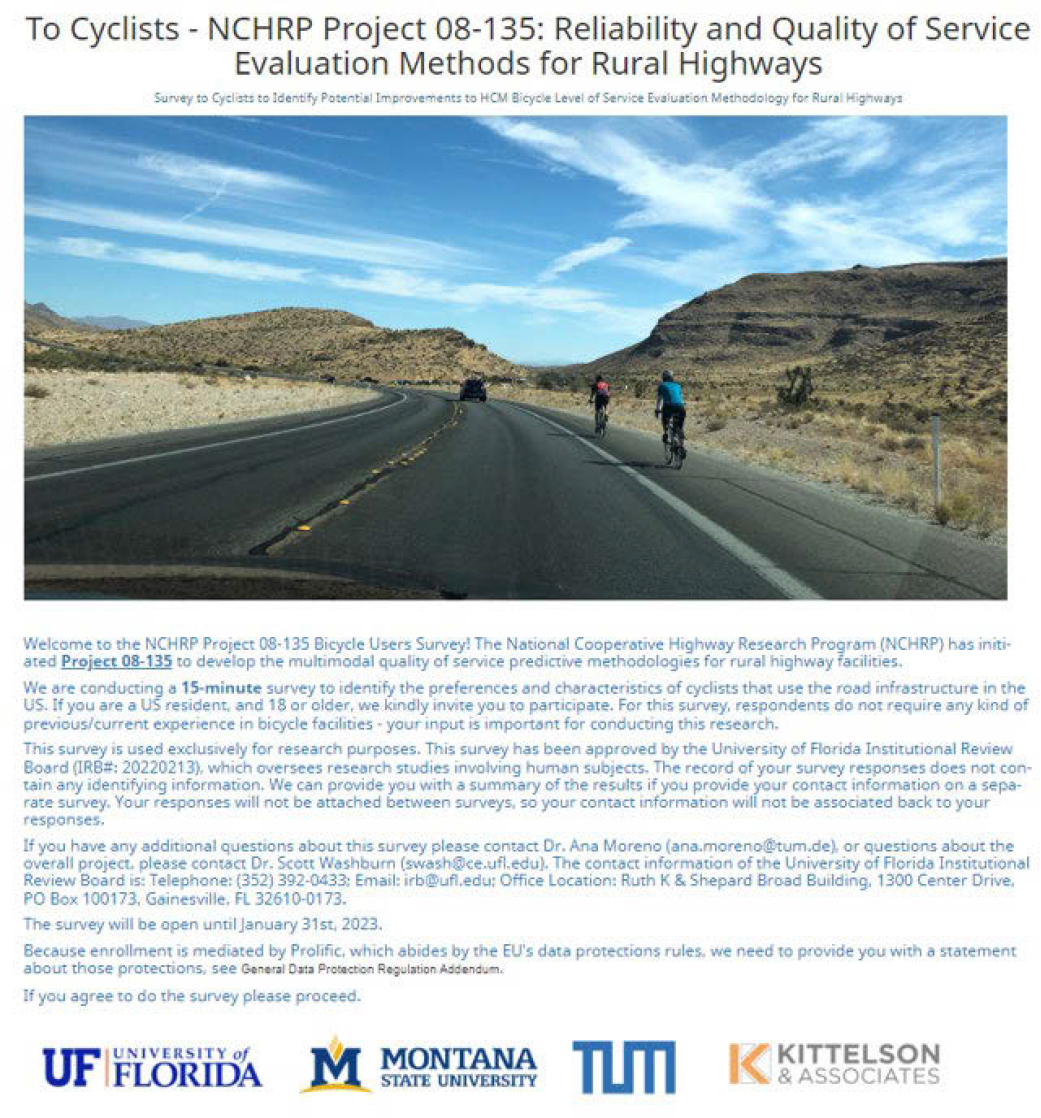
The first section has the introductory message to the respondent that includes the purpose of the survey, the research project, the research team, and their contact information. We also included the expected time to complete the survey. The survey is targeted at bicycle users. The welcome message includes the age and US resident explicitly: We are conducting a 15-minute survey to identify the preferences and characteristics of cyclists that use the road infrastructure in the US. If you are a US resident, and 18 or older, we kindly invite you to participate. For this survey, respondents do not require any kind of previous/current experience in bicycle facilities - your input is important for conducting this research.
It was also indicated that the survey was used exclusively for research purposes and approved by the University of Florida Institutional Review Board. Further, it was explicit that the record of survey responses will not contain any identifying information. Survey respondents had the option to provide their contact information on a separate survey, and the responses of both surveys cannot be attached. Therefore, the contact information cannot be associated with the primary survey responses.
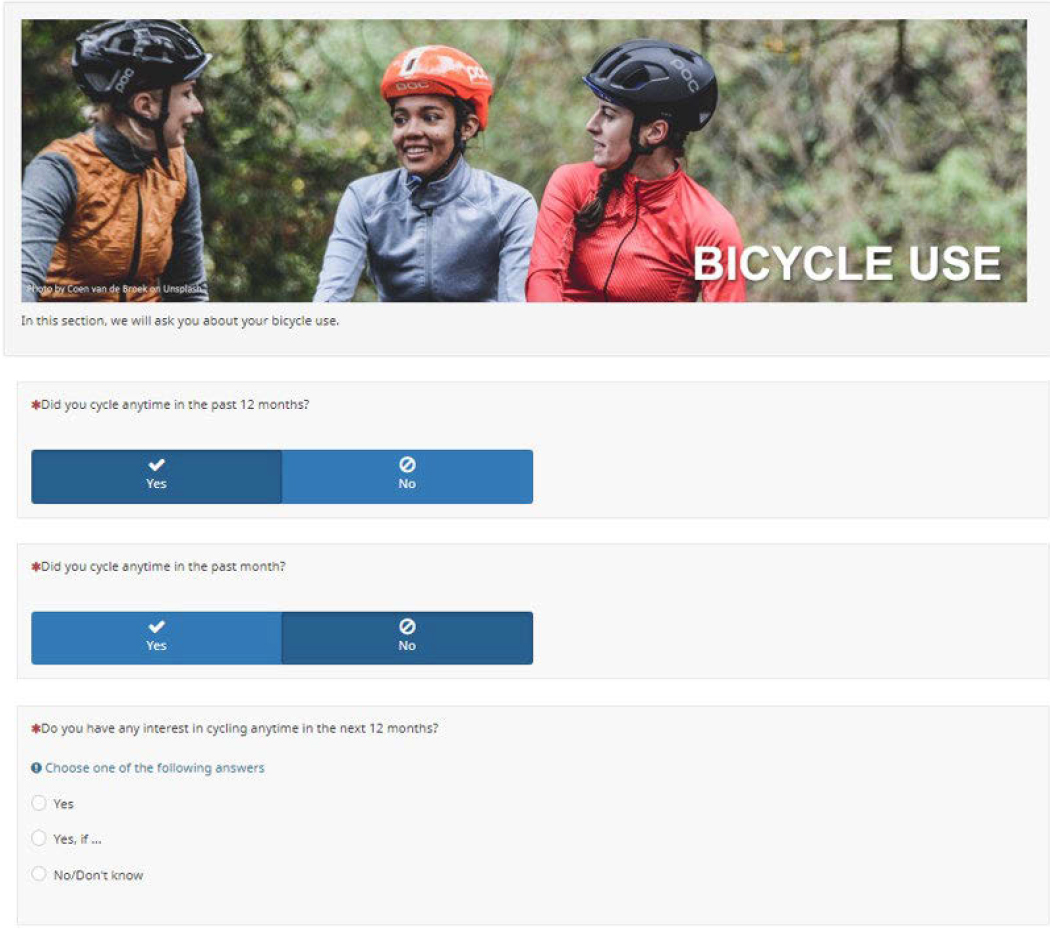
The second section follows a rule-based decision tree from Félix et al. (2016). In this seminal paper, they propose typologies of urban cyclists and market segmentation methods. The purpose of this section is to classify the respondents based on their cycling experience, as non-cyclist, potential cyclist, or regular cyclist. Regular cyclists have cycled anytime in the past 12 months for commuting or leisure, cycled in the past month for commuting, and will consider cycling again in the next month. Potential cyclists answered “no” to some of the previous questions but expressed their interest in cycling anytime in the next 12 months. Finally, non-cyclists indicated they are not interested in cycling anytime in the next 12 months.
The bicyclist segmentation was used to direct the respondents to the next sections, as follows:
- “Non-cyclist”: closing section. Choice tasks, as well as user type specific questions are not presented.
- “Potential cyclist” or “regular cyclist”:
- If they cycled on rural highways for leisure: rural highway leisure cycling experience.
- If they had not cycle on rural highways for leisure: typical cycling experience.
The third section started with the instructions for the choice tasks. This first page contains one screenshot of an example choice task and guides the respondent on how it should be completed.

On the next page, the respondent had four choice tasks. Respondents were asked to imagine riding a bicycle on a rural road in each choice task. Then, four images with different cycling conditions were. The respondent needed to choose the Which cycling conditions would you feel serves better your needs as a bicyclist. Only one image per task could be selected. If they do not feel like riding in any of them, they could select “None of them”.
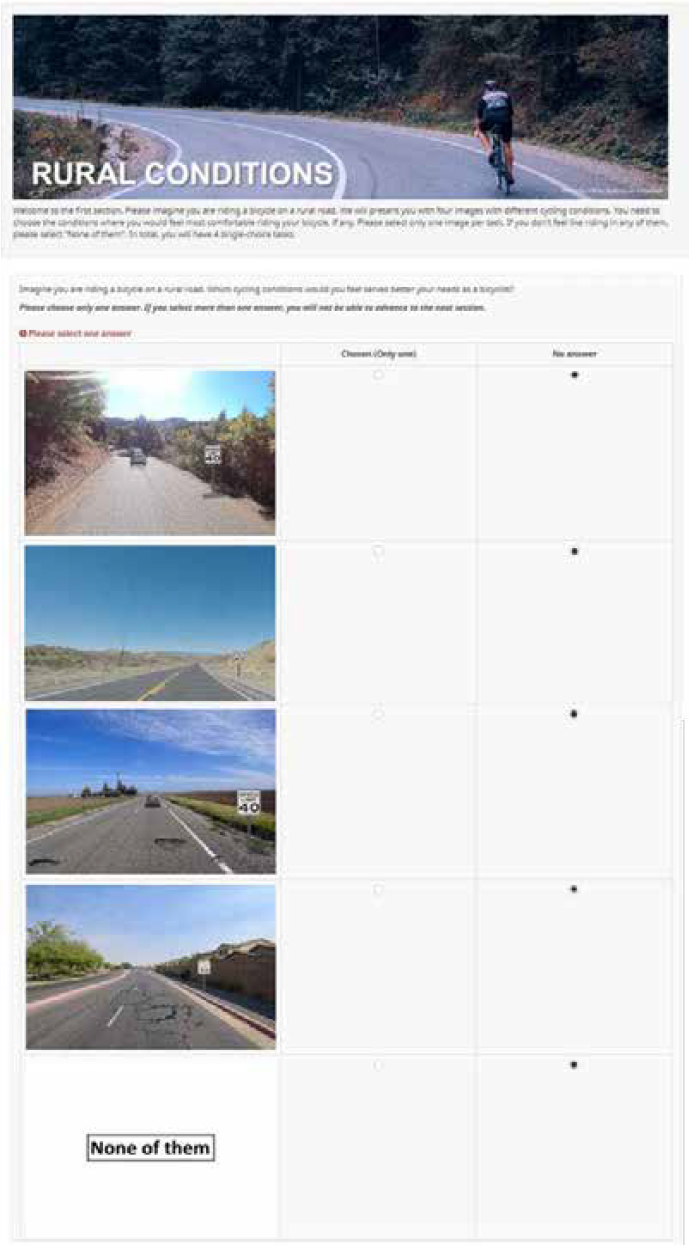
A total of 16 images were generated with varying speed limits, presence of shoulder, grade, context classification, automobile traffic volumes, and pavement quality. All 16 images were presented to the respondents in four separate choice tasks. However, choice tasks were randomly generated to minimize the bias in the model. After completing the four choice tasks, respondents enter another page with a second set of four choice tasks. This second set of choice tasks was
introduced to increase the sample size of responses while keeping the time of the overall survey relatively short.
Specifically, the following attributes and attribute levels are considered:
Table G-1. Attributes and attributes level of the choice tasks

The fractional design was applied to reduce the potential number of alternatives to present from 324 to 16 (4 choice tasks with four options each). The final set of other options is summarized in the following table.
Table G-2. Attributes of the choice task scenarios

The fourth section collects more details on their cycling experience. For respondents classified as “leisure rural cyclists,” collected information on their typical cycling leisure rides include:
- Time of the day.
- Season(s) of the year.
- Cycling under adverse weather conditions.
- Type of bicycle(s).
- Is any of the bicycles selected electric assisted?
- Comments.
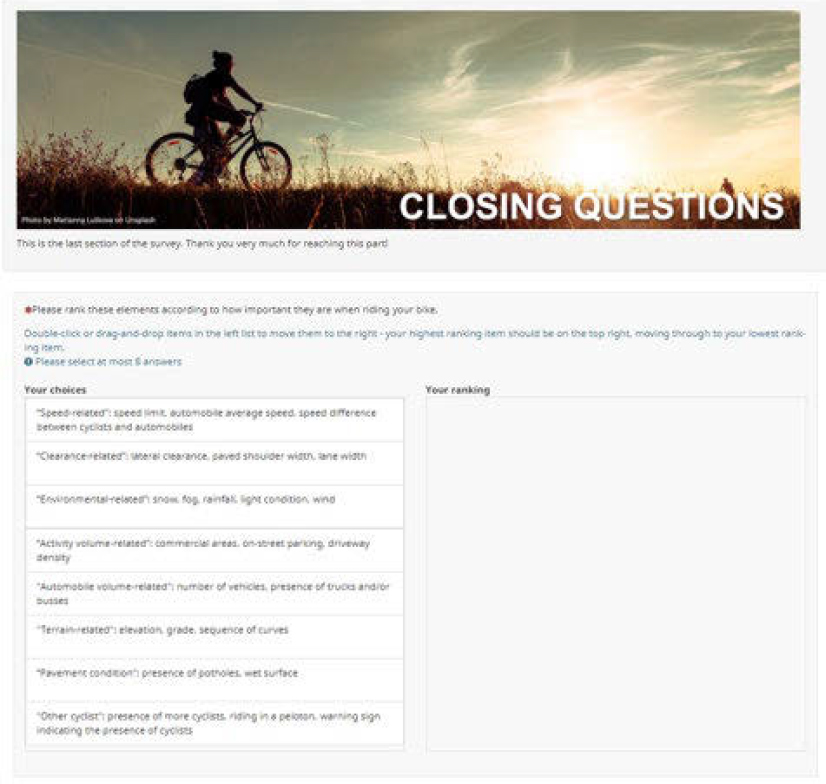
The closing section starts with a ranking task. In this task, respondents must order the different groups of variables based on how important they are when riding their bicycles. This question was also adapted from the practitioners’ survey and included the following elements:
- “Speed-related”: speed limit, automobile average speed, speed difference between cyclists and automobiles
- “Clearance-related”: lateral clearance, paved shoulder width, lane width
- “Environmental-related”: snow, fog, rainfall, light condition, wind
- “Activity volume-related”: commercial areas, on-street parking, driveway density
- “Automobile volume-related”: number of vehicles, presence of trucks and/or buses
- “Terrain-related”: elevation, grade, sequence of curves
- “Pavement condition”: presence of potholes, wet surface
- “Other cyclist”: presence of more cyclists, riding in a peloton, warning sign indicating the presence of cyclists.
The second question in the closing section consisted of stated cycling comfort levels at different cycling environments. The scenarios were developed following the description of Dill and Mc Neil (2016) that was used to classify cyclists by their LTS. The original typology was developed by Geller (2008) and was based on the individuals’ stated comfort level to ride in different bicycle infrastructures. Specifically, they included:
- A path or trail separate from the street.
- A quiet, residential street with traffic speeds of 20–25 miles per hour.
- A quiet, residential street with a 20 mile-per-hour speed limit, bicycle route markings, wide speed humps, and other things that slow down and discourage car traffic.
- A major urban or suburban street with four lanes, on-street parking, traffic speeds of 30–35 miles per hour, and no bike lane.
- A major urban or suburban street with four lanes, on-street parking, traffic speeds of 30–35 miles per hour, with a striped bike lane.
- A major urban or suburban street with four lanes, on-street parking, traffic speeds of 30–35 miles per hour, with a wide bike lane physically separated from traffic by a raised curb, planters, or parked cars.
To reduce the survey time, the descriptions of bicycle infrastructure were replaced by cross sections and adapted to have all the different configurations with bike lanes, striped bike lanes, and no bike lanes on two-lane streets and major four-lane streets. A total of nine bicycle infrastructure scenarios were presented, as follows:
- Path or trail separate from the street.
- Bike lane on two-lane street, on-street parking.
- Bike lane on major street with four lanes, on-street parking.
- Striped bike lane on two-lane street, on-street parking.
- Striped bike lane on major street with two lanes in each direction, a center divider, on-street parking.
- Striped bike lane on major street with four lanes, on-street parking.
- No bike lane on two-lane street, on-street parking.
- No bike lane on major street with two lanes in each direction, center divider, on-street parking.
- No bike lane on major street with four lanes, on-street parking.
Respondents were presented with cross sections of different bicycle infrastructures and were asked How comfortable would you cycle in the following scenarios. Four answers were allowed: Very uncomfortable - Uncomfortable - Comfortable - Very comfortable.
Finally, we include sociodemographic questions regarding gender, age, income, and how they found out about the survey. In the end, it is possible to leave further comments, and contact data in a separate study in case they want to know more about the research.
Distribution
A pretest was conducted with the research team members and panel members to refine overall understanding, time management, and variables included. Afterward, it was submitted to the University of Florida Institutional Review Board (UF-IRB), which oversees research studies involving human subjects. UF-IRB approved the survey in November 2022.
The survey is targeted to bicycle users and will be distributed to the American League of Cyclists and any other cyclist associations; also, the survey was distributed through social platforms such as Facebook groups, LinkedIn groups, Twitter, and University Transportation Centers (UTC). Although the survey is not intended for practitioners, it was shared on the same distribution channels as the practitioners’ survey to increase its reach within their communities. The survey was distributed through the following channels:
- State DOT bicycle and pedestrian coordinators.
- Members and friends of the TRB Committee on Highway Capacity and Quality of Service (ACP40).
- Members and friends of the TRB Committee on Bicycle Transportation (ACH20).
- Members and friends of the TRB Committee on Performance Effects of Geometric Design (AKD10).
- Bicyclist associations.
- UTCs.
- LinkedIn.
- Twitter.
- Facebook.
Descriptive Analysis of the Sample
Sample Size and Geographical Distribution
A total of 1650 persons entered the survey and 1049 completed the survey (63.57 percent of respondents).
Two hundred twenty-six persons left the survey in the welcome section. After the welcome section, respondents were asked about their cycling experience in the last month and year to segment the responses between regular, potential, and no cyclists. One hundred sixty left the survey after this section. Afterwards, 157 persons did not complete the choice tasks, and only 58 respondents left during the specific questions on cycling experience.
Table G-3. Number of responses by the last section of the survey

Almost all respondents lived in the United States (1032 respondents), with the notable exception of 13 responses from Germany (4 responses), France (1 response), Netherlands (1 response), and Togo (1 response). A total of four persons did not include their country of residence. Given that the analysis is focused on the United States, only 1032 complete responses from individuals living in the United States are used.
Table G-4. Country of residence

Responses from 51 states were received. The highest number of responses by state is 95, from California, followed by Pennsylvania (92 responses), Michigan (85 responses), Illinois (80 responses), and North Carolina (58 responses).
Absolute values were divided by the number of inhabitants in 2015 to obtain the density of responses per state. The six states with more responses per inhabitant are Montana (26.14 responses per million inhabitants), Vermont (17.57 responses per million inhabitants), Alaska (14.9 responses per million inhabitants), Wisconsin (10.05 responses per million inhabitants),
Wisconsin (10.05 responses per million inhabitants) and Wisconsin (10.05 responses per million inhabitants).
Sociodemographic
The respondents are primarily males (N = 701, 67.93%), aged 60 or more (N = 513, 49.71%), with high annual household income (N = 460, 44.57%) and commuting by car (N = 422, 40.89%) or bicycle (N = 174, 16.86%). Many respondents do not commute for work or education (N = 345, 33.43%), which relates to the high share of individuals over 60. Only 21.71% of the respondents were younger than 45 years old.
Table G-5. Survey descriptive statistics - gender.

Table G-6. Survey descriptive statistics – age.

Table G-7. Survey descriptive statistics – household income.

Table G-8. Survey descriptive statistics – main commute mode.

Most of the respondents found the survey via email (N = 424, 41.09%) or social media (N = 196, 18.99%), with Facebook as the most used channel (N = 160, 15.5%). Distribution on Twitter and LinkedIn had a lower impact, with 20 and 16 respondents, respectively (3.49% of responses). Interestingly, 167 of participants (16.18%) were referred to the survey from a colleague.

Cycling Frequency
In the first section of the survey, respondents were asked about their cycling experience in the last year and month and if they would consider cycling again in those time frames. The questions were designed to classify the respondents into three groups:
- Regular cyclist
- Potential cyclist
- Non-cyclist
The classification from Félix et al. (2009) uses the following logic.

However, this classification does not account for seasonality. Based on the frequency of bicycle use those potential cyclists indicated, we re-defined the categories as follows:
- All-year-round cyclist. Cyclists were previously classified as “regular cyclists”.
- Seasonal cyclist. Cyclists were previously classified as “potential cyclists” who typically cycle one or more times per week.
- Potential cyclist. Cyclists were previously classified as “potential cyclists” who typically cycle less than once per week.
- Non-cyclist. Cyclists were previously classified as “non-cyclists”.
Most respondents were all-year-round (N = 685, 66.38%) or seasonal cyclists (N = 200, 19.38%). Only 72 and 68 individuals were classified as non-cyclists (6.98%) or potential cyclists (6.59%). Non-cyclists were males over 60 (N = More than 60, 24%) and females between 46 and 60 years old (N = 46 - 60, 15%).
Table G-10. Cyclist type by seasonal cycling frequency
All-year-round cyclists were mainly men (75.33%), contrasting with 22.34% of females. Gender distribution was more balanced on other cyclist types: 57% males and 38% females. There were no significant variations in the age distributions for regular and potential cyclists and non-cyclists.
Table G-11. Cyclist type by seasonal cycling frequency – gender

Table G-12. Cyclist type by seasonal cycling frequency – age

Not surprisingly, all-year-round cyclists commuted more by bicycle (23.21%) than potential cyclists (6%) and non-cyclists (0%); and used more E-Bicycles (2.63% compared to 0.5% and
0%). However, the differences between all-year-round and seasonal cyclists were more minor. The main commute mode for potential cyclists and non-cyclists was auto: 50% and 63.24%, respectively.
Table G-13. Cyclist type by seasonal cycling frequency – main commute mode

All-year-round, seasonal, and potential cyclists were asked about their typical bicycle trip. Most regular cyclists cycled at least three times per week or once per week, and less than 2% cycled less than once per month. Not surprisingly, seasonal, and potential cyclists cycled less than regular cyclists. Initially, almost 75% of potential cyclists cycled at least once per week, as all individuals who did not cycle in the last month were classified as potential cyclists. The survey was conducted in December and January, which could have affected the cycling experience of the previous month and neglected seasonality.
This suggests that the rule-based decision tree cycling experience on the last year and month may not be too accurate for areas where cycling may be less frequent in winter. Surveying in another season of the year may lead to different results, as one respondent indicated in the open question: “One thing these surveys do not consider or measure very well is seasonal variability. While I ride nearly 100% of the time in summer, I tend to drive much more often in the peak of winter”.
Therefore, seasonal cyclists were segmented from potential cyclists if they cycled at least once per week for their typical cycle. The following table summarizes that the highest difference between all-year-round cyclists and others is winter: less than 6% of seasonal and potential cyclists’ cycle in winter, compared to 70.66% of all-year-round cyclists.
Table G-14. Cyclist type by seasonal cycling frequency – frequency
Table G-15. Cyclist type by seasonal cycling frequency – seasons

Regarding the time of week, most cyclists cycle on Saturdays and Sundays (between 65 and 80%). High frequencies were also observed for workdays, off-peak hours, for all-year-round and seasonal cyclists. Among cyclist types, the group that cycled most during peak hours were all-year-round cyclists (43.1%), compared to 29.5% of seasonal cyclists and 17.7% of potential cyclists—around one-quarter of all-year-round cyclists cycled during nighttime.
Table G-16. Cyclist type by seasonal cycling frequency – day of week and time period

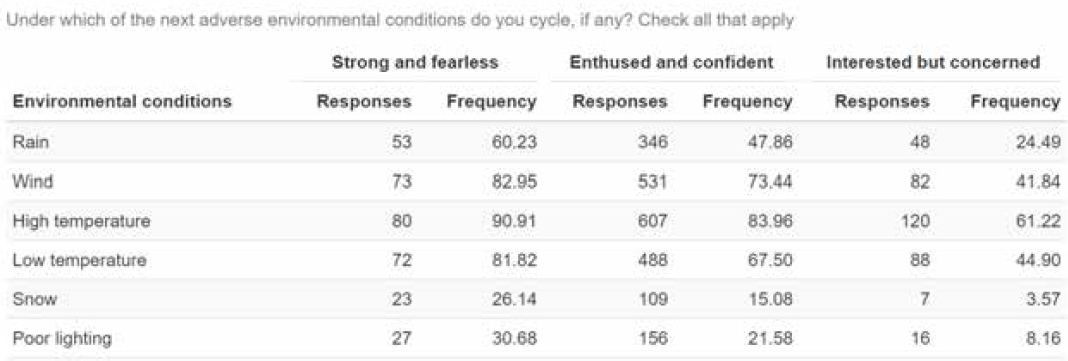
Weather conditions showed the highest differences among cyclist types. Specifically, we observed that all-year-round cyclists were more comfortable with all adverse environmental conditions compared to seasonal and potential cyclists: all-year-round cyclists cycled between two and 10 times more than potential cyclists under adverse environmental conditions. For
example, 19.71% of all-year-round cyclists cycle with snow, compared to 2.5% of seasonal cyclists and 1.47% of potential cyclists. The highest differences were for fog (25.11% vs. 10% and 5.88%), rain (49.93% vs. 41% and 22.06%), and wind (74.74% vs. 64.5% and 30.88%).
Table G-17. Cyclist type by seasonal cycling frequency – weather conditions

Stated Cyclist Type
At the closing section, participants were asked to select which phrase would describe themselves better as a cyclist:
- No way, no how.
- Interested but concerned.
- Enthused and confident.
- Strong and fearless.
The four phrases align with the four cyclist types that are considered in the LTS theory.
Most of the participants (N = 723, 70.06%) considered that “enthused and confident” described them best, followed by “interested but concerned” (N = 196, 18.99%). Eighty-eight participants described themselves as “strong and fearless” (8.53%). The distribution differs from the general population of cyclists described by Geller (2006) and Dill and McNeil (2013), on where the shares of “strong and fearless,” “enthused and confident,” and “interested but concerned” were equal to 4, 9 and 56%, respectively. The survey sample over-represented individuals described as “enthused and confident,” which could be caused by the focus on cyclists who ride on rural highways. For those individuals, the confidence level is expected to be higher than the overall population of cyclists.
Table G-18. Stated cyclist type - distribution.

Women are most likely to describe themselves as “interested but concerned,” with a share of 47.45% in the category. Other categories are dominated by males, with shares between 72.34% and 76.14%. Age distributions are distinct for each type of cyclist. “Enthused and confident” and “interested but concerned” cyclists are dominated by individuals over 60 (52.84% and 44.9%), followed by persons between 46 and 60 years old (26.83% and 23.98%). The age distribution is like the overall age distribution of the entire sample. However, strong, and fearless presents a different distribution, with a higher share of persons aged 45 and less (30.68%) than for the overall sample (21.8%).
Table G-19. Stated cyclist type – gender.
Table G-20. Stated cyclist type – age.

The most used mode for “strong and fearless” cyclists is bicycle (30.68%), compared to auto for “enthused and confident” (37.9%) and “interested but concerned” (58.16%). For those cyclists, only 18.67% and 5.61% commute by bicycle. “Strong and fearless” also has the highest use of ebikes, with 3.41%, and the least number of persons that do not commute for work or education (23.86%).
Table G-21. Stated cyclist type – main commute mode.
We also compared the share of cyclists that cycled in the different seasons, times of the week, and under adverse environmental conditions. It could be observed that cycling frequencies were consistently higher for “strong and fearless” cyclists compared to other groups. Further, the differences between “strong and fearless” and “enthused and confident” were more minor than between “enthused and confident” and “interested but concerned”. The highest difference was found for cycling in winter, with a drop from 65% (for “strong and fearless”) to 29.1% (for “interested but concerned”). As indicated before, the difference between “enthused and confident” was more minor (53.1%).
The time of week patterns did not present significant differences, only for the share of nighttime rides (between 13.8 and 35.2%) and peak hour rides (between 26.02 and 61.36%).
As for cycling frequency, cycling under adverse environmental conditions significantly differed across groups. “Strong and fearless” were generally more comfortable cycling in adverse weather than others, followed closely by “enthused and confident.” The highest differences in percentage were observed in snow: “strong and fearless” cycled 70% more than “enthused and confident” (26% compared to 15%) and seven times more “interested but concerned” (26% compared to 3.6%). Cycling under fog was also limited to “interested but concerned.” The environmental conditions most tolerated by cyclists were high temperatures, wind, and low temperatures. Only 60% of “strong and fearless” cycled when raining (compared to 24.5% of interested but concerned).
Time of week patterns were similar across comfort levels, with higher shares on Saturday, Sunday, and workday, off-peak hours.


Table G-25. Stated cyclist type – frequency.
Comparison Between Cycling Frequency and Stated Cyclist Type
Lastly, a comparison between the two classifications was performed. It could be observed that almost all the individuals who indicated agreement with being defined as “strong and fearless” were all-year-round cyclists (86.4%), followed by seasonal cyclists (6.8%). The share of potential and non-cyclists was below 3%. On the other hand, most enthused and confident cyclists were classified as all-year-round (70.9%) or seasonal (20.2%). Not surprisingly, interested but concerned cyclists presented more significant shares of potential and non-cyclists. However, most of them could be classified as all-year-round or seasonal cyclists.
Table G-26. Comparison between cycling frequency and stated cyclist type.

Choice Tasks
In this survey section, choice tasks were presented to the participants. In each choice task, respondents were asked to imagine that he/she is riding a bicycle on a rural road, and four images were presented to them. They needed to select the image with the cycling conditions that served better their needs as bicyclists, if any. Specifically, the question was: Imagine you are riding a bicycle on a rural road. Which cycling conditions would you feel serves better your needs as a bicyclist? Please choose only one answer. If they do not feel like riding in any of them, they could select “None of them.”
A total of 16 combinations of speed limit, presence of shoulder, grade, context classification, automobile traffic volume, and pavement quality were presented to the participants.
Preliminary Analysis
Preliminary analysis consisted of comparing the frequency of a specific element being presented to participants and being selected by participants. Firstly, an individual analysis by element was carried out, followed by an analysis of all the scenarios.
Individual analysis by element included the number of times each category was selected and the number of times it was presented to participants. Fractional design produced an uneven distribution of types; therefore, analyzing the absolute number of responses may need to be more accurate. Thus, the absolute and relative differences between the number of selected and presented responses were computed.
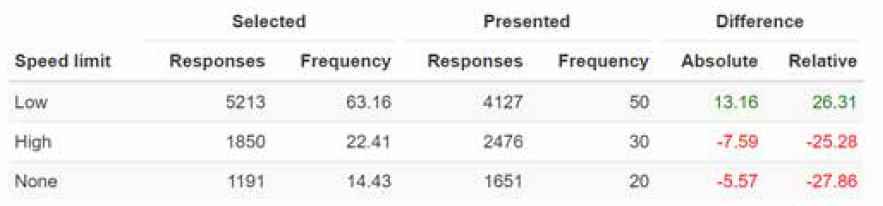
Speed limit
Participants were presented with scenarios with two different speed limits: low or high. Specific speed limit depended on the context classification:
- High (55 mph in rural, 45 mph in rural–town and 30 mph in suburban)
- Low (40 mph in rural, 30 mph in rural–town and 20 mph in suburban)
Not surprisingly, most respondents selected scenarios with low speed limit (N = 5213, 63.16%), compared to scenarios with high speed limit (N = 1850, 22.41%). However, there were more scenarios with low speed limit in the choice set due to the fractional design. Therefore, analyzing the absolute number of responses may be misleading, and the difference between the number of selected and presented responses should be used instead. The low speed limit was selected 13.16 percent points more than presented to the participants (an increase of 26.31%). The high speed limit was strongly affected, with a 25.28% difference between the selected and presented.
Table G-27. Percentage of times selected by speed limit.
Grade
Two variations of grade were used: high and low grade. Images with high grades had more challenging scenery, with more trees on the sides to represent rolling terrain, while images with low grades presented flat conditions.
The two categories were presented the same number of times (N = 3302, 40%); however, scenarios with low grades were selected more (47.36%) than scenarios with high grades (38.21%). Participants represented a higher propensity of choosing scenarios with low grades (7.36 percent point difference) and slightly lower propensity of selecting scenarios with high grade (-1.79 percent point difference).
Table G-28. Percentage of times selected by grade.

Automobile traffic volume
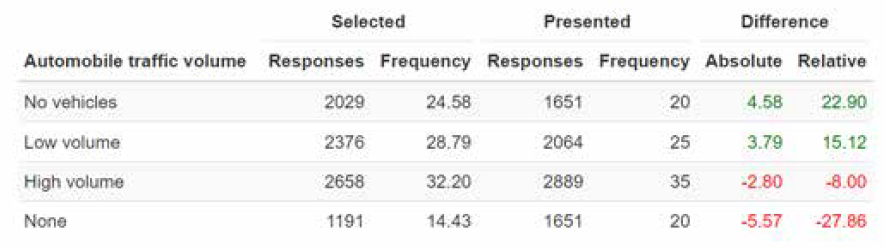
Three different categories of automobile traffic volume were presented in the scenarios:
- No traffic volume (image without vehicles)
- Low volume (image with one or two vehicles)
- High volume (image with more than three vehicles close to the cyclist)
The results of this element were also intuitive: the higher the automobile traffic volume, the lower the propensity of being selected: -2.8 percent point difference for high volume, compared to 3.79 percent point difference for no vehicles. As for speed limit, the distribution of the three categories was uneven, and therefore, the analysis of the absolute number of responses may be misleading. High volume was selected more times (N = 2658) than no vehicles (N =2029).
Table G-29. Percentage of times selected by automobile traffic volume.
Shoulder width
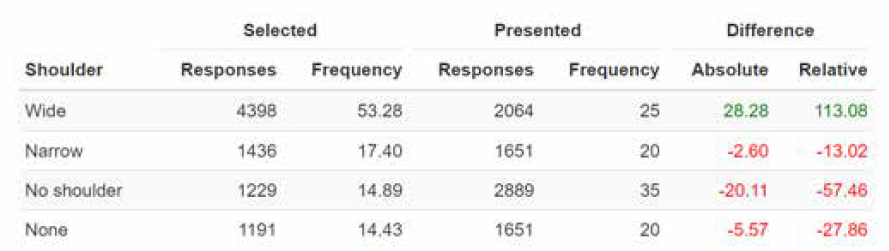
Three different configurations of shoulder were generated:
- No shoulder
- Narrow shoulder
- Wide shoulder
Wide shoulder scenarios outnumbered other categories: they were selected by 4,398 (53.28%), compared to being presented 2,064 times (25%). This represented an absolute difference of 28.28 percent points, the highest difference across all individual elements.
On the other hand, having no shoulder presented one of the highest negative differences across all individual elements, with a -20.11 percent point difference (-57.46 relative difference). The narrow shoulder had a slightly lower propensity of being selected (-2.6 percent point difference).
Table G-30. Percentage of times selected by presence of shoulder and shoulder width.
Pavement conditions
Pavement conditions were divided into three categories:
- Good (evidence of rutting and fine cracks)
- Acceptable (rutting and extensive patching)
- Deteriorated (large potholes and deep cracks)
Like shoulder width, one of the categories outnumbered the others. Good pavement conditions had a high propensity of being selected, with a difference between selected and presented equal to 14.22 percent points (40.64%). On the other hand, deteriorated pavement conditions had little propensity of being selected: -8.78 percent point difference (-43.91). Participants selected fewer scenarios with acceptable pavement conditions (N = 2074, 25.13%), with only a 0.13 percent point difference.
This is the second highest (positive and negative) differences across all elements.
Table G-31. Percentage of times selected by pavement quality.

Context classification
Finally, the differences in context classification were analyzed. Three different context classifications were included: rural, rural–town, and suburban. Even though suburban segments are not usually considered rural highways, they were included in the sample to determine whether rural conditions differ substantially from more urbanized suburban settings.
The results indicate that suburban and rural–town context classifications were more likely to be selected, with absolute differences equal to 7.31 percent points (36.52) and 3.8 percent points (12.68), respectively. Conversely, rural context presented a negative difference, like -5.54 (- 18.46%). It should be noted that this difference was not the highest negative across all elements. Therefore, other factors might strongly influence the participants' choices.
Table G-32. Percentage of times selected by context classification.

Combination of elements
After analyzing each element individually, all scenarios were compared to each other. The following table indicates the frequency with which each scenario was selected and its attributes.
The most frequent scenario was number 14, which was selected 1386 times (16.79%). This scenario had a low speed limit (20 mph), low grade, wide shoulder, low traffic volume, good pavement conditions, and suburban context. It was selected three times more than presented (16.79% compared to 5%). Other scenarios that were set more times than given include scenarios number 10 (11.93%), 8 (10.23%), 3 (9.64%), 13 (8.29%), 1 (5.8%), and 7 (5.22%). These scenarios mainly were suburban or rural–town settings, with wide shoulders, low speed limits, and good pavement conditions. Nevertheless, some combinations also presented high speed limits, no shoulders, rural conditions, and the range of traffic volumes.
On the other side of the spectrum, the least selected scenario was number 11, which presented a high speed limit (30 mph), high grade, no shoulder, low traffic volume, deteriorated pavement, and rural–town context. Surprisingly, this scenario was selected by some participants (N = 13, 0.16%). Participants' three least selected scenarios (scenarios 4, 15, and 11) had in common that no shoulder was present, and that speed limit was high. However, they varied in the other elements: grade (low and high), traffic volume (low and high), pavement conditions (acceptable and deteriorated), and context classification (rural, suburban, and rural–town). These scenarios were selected less than 1.2%.
It should be noted that the second most selected scenario was “None of them” (N = 1191, 14.43%). This scenario was presented to the participants 20% of the time, once for each task choice scenario.
Table G-33. Percentage of times selected by scenario.

Choice Modeling
This section describes the statistical analysis that was carried out to evaluate each element's contribution to each scenario's utility. A binary logit model was used to estimate the utility of each component. This model predicts the probability of the scenario being selected (yes or no), given a set of independent variables. The alternative “no” was selected as the reference level.
The independent variables considered in the model were the attributes of the scenarios (speed limit, grade, automobile traffic volume, shoulder width, pavement conditions, context classification) and the individual characteristics of the participants (type of cyclist by cycling frequency and stated cyclist type, age, gender, income, commute mode). Correlation among independent variables was tested, and only variables that were not highly correlated (50% or less) were included in the model.
Stepwise selection was carried out to reduce the number of independent variables. The final model had a pseudo R2 equal to 39.7%. Only statistically significant variables at 95% confidence
were included in the model (p-value below 0.05). The model parameters' coefficients, standard error, t-test, and p-values are summarized in the following table.
Table G-34. Choice model – statistical summary

All six attributes of the scenarios (speed limit, grade, automobile traffic volume, shoulder width, pavement conditions, and context classification), the interaction between context classification and the presence of shoulder, and two attributes of the participants (stated cyclist type and age) were statistically significant. The signs of the coefficients and values were plausible and agreed with analyzing individual elements.
The model's coefficients reflect the change in the log-odds of the selected scenario associated with a one-unit change in that variable. Positive coefficients indicate that the predictor variable is associated with an increase in the probability of being selected, while negative coefficients indicate a decrease. The magnitude of the coefficient indicates the strength of the relationship
between the predictor variable and the outcome. Odds ratios were also calculated to provide a more intuitive interpretation of the coefficients. This parameter is defined as the ratio of the odds of the outcome occurring for a one-unit increase in the predictor variable compared to the odds for a one-unit decrease. An odds ratio greater than 1 indicates that the predictor variable is associated with increased odds of being selected, while an odds ratio of less than 1 indicates a decrease. For interaction terms, a negative coefficient indicates that the direction of the effect is opposite for different groups.
The presence of a shoulder had the highest impact on the probability of being selected: including a narrow or wide shoulder increased the log-odds of being chosen by 0.53 and 2.26, respectively. This represents an odds ratio of 1.7 and 9.6, respectively. This indicates that if a narrow shoulder was present, the odds of being selected increased by a factor of 1.7 compared to not having a shoulder. When having a wide shoulder, the estimated odds of selecting that scenario were 9.6 times higher than for scenarios without a shoulder.
The interaction between shoulder and context class was significant, indicating that the effect of having a shoulder on the likelihood of selecting to cycle in the scenario depended on context class. Still, the direction of the product was the opposite for rural and rural–town contexts. Specifically, as the interaction term is negative, it suggests that rural areas without shoulders were less likely to be selected compared to rural–town areas without shoulders. However, for scenarios with shoulders, the effect of context was weaker, indicating that context was less of a factor if shoulders were present. Similar results were produced between rural and suburban context classes, although the differences were lower than between rural and rural–town contexts.
Scenarios in rural towns were more likely to be selected than those in rural contexts by a factor of 1.9 (log-odds of 0.68). The difference between rural and suburban conditions was slightly more significant. Interestingly, the difference between rural towns and suburban contexts was minor. However, the interactions between context classification and shoulder presence were significantly different.
Two other important variables were automobile traffic volume and pavement conditions. Automobile traffic volume had negative coefficients, indicating that scenarios with more traffic were less likely to be selected by respondents than those with no traffic. Similarly, good pavement increased the log-odds by 0.84 compared to deteriorated pavement (factor of 2.3). The differences between acceptable and deteriorated pavement conditions were lower, with a log-odds difference of 0.18 (factor of 1.2).
Surprisingly, the coefficient for high grades was positive. This indicated that scenarios with higher grades were more likely to be selected than those with lower grades. However, the individual grade analysis showed respondents preferred low-grade scenarios more frequently. This difference between the model estimation and preliminary analysis could be caused because scenarios with low grades were chosen due to other elements and not precise grades. Grades could have been interpreted differently by participants and used as a proxy for scenery quality. Images with high grade corresponded to scenery with trees and rolling terrain, compared to images with low grade in flat terrain, which could be perceived as monotonous (and therefore less attractive) to cycle.
Lastly, enthused and confident individuals were more likely to select a scenario, compared to selecting “none of them” and individuals who were strong and fearless. As expected, the
likelihood of being selected was higher for strong and fearless than for enthused and confident. Interactions between the cyclist type and scenario elements were tested but were not statistically significant. This indicated that the effect of the elements did not depend on cyclist types but rather that the more confident groups generally had a more substantial likelihood of selecting to cycle in each scenario. Age was also statistically significant: individuals aged 60 or older had an increased chance of selecting the scenario compared to individuals younger than 60. Other sociodemographic attributes were not statistically significant.
Ranking of Elements
Preliminary Analysis
In the first question of the closing section, respondents were asked to rank these elements according to how important they are when riding your bike. Specifically, eight groups of factors were presented:
- “Speed-related”: speed limit, automobile average speed, speed difference between cyclists and automobiles.
- “Clearance-related”: lateral clearance, paved shoulder width, lane width.
- “Environmental-related”: snow, fog, rainfall, light condition, wind.
- “Activity volume-related”: commercial areas, on-street parking, driveway density.
- “Automobile volume-related”: number of vehicles, presence of trucks and/or buses.
- “Terrain-related”: elevation, grade, sequence of curves.
- “Pavement condition”: presence of potholes, wet surface.
- “Other cyclist”: presence of more cyclists, riding in group, warning sign indicating the presence of cyclists.
Firstly, we analyzed the frequency of each response. To facilitate the visualization, we merged the responses in four ranks: “1st – most important or 2nd”, “3rd or 4th”, 5th or 6th” and “7th or 8th – least important”, and ordered the elements based on their median rank.
Clearance-related variables, which include shoulder width or lane width, were the most critical variables, followed by automobile volume-related (e.g., number of vehicles, presence of trucks) and speed-related (e.g., speed limit, automobile average speed). Most respondents ranked them as “1st or 2nd” (between 40% and 60%). The next group of variables was activity volume-related, such as commercial areas or driveway density and pavement condition. The two groups of variables received 1st to 4th rank by almost half of the respondents. The third cluster of variables is environmental-related, with more responses in the second half of the rank (5th to 8th) than in the first half (1st to 4th). This group includes adverse weather conditions. Finally, the least important groups of variables were terrain-related and other cyclists. We found that most responses were equal to “7th or 8th”, although, for 20% of the respondents, they ranked among the four most important variables.

Secondly, all variables were compared and arranged by median and mean values in descending order. The aggregated summary included IQR as a measure of dispersion. IQR represents the range of the 50% central responses. The higher the IQR, the more dispersion on central values. This metric was preferred over standard deviation because Likert scales are ordered variables, and answers are not normally distributed around a central value.
The analysis of the median and IQR shows similar trends. Most respondents indicated agreement with the idea that clearance-related is the most critical variable when riding their bicycle (median = 2, IQR = 2), followed closely by automobile volume-related and speed-related variables (median = 2, IQR <= 3). Neutral opinions were found for activity volume-related, pavement condition, and environmental-related, with a median value equal to 5 (IQR >= 3). However, there was a high dispersion in the responses, especially for environmental-related variables (IQR = 4). Most respondents indicated that the least important variables why cycling are terrain-related, such as elevation or grade, and the presence of other cyclists (median = 7, IQR = 2).
Table G-35. Ranking – summary of statistics

Model Estimation
In this last section, a multinomial logit model was used to estimate the ranked choices of the different elements. Given a set of independent variables, this model predicts the probabilities of the first-ranked variables. The set of independent variables considered for the model are the sociodemographic attributes of respondents (age, gender, income), their cycling behavior (main commute mode, cycling on rural highways), type of cyclist by cycling frequency (regular, potential, or non-cyclist) and their stated cyclist type (strong and fearless, enthused and confident, interested but concerned).
One of the alternatives is selected as reference level to estimate a multinomial logit model. We chose “Other cyclists” as the reference level in this case due to the lower ranking. Therefore, parameter estimates are relative to the expected difference between each level (e.g., “Clearance-related”) and “Other cyclists.” The parameter estimates of the resulting model are summarized in the following table.
Table G-36. Ranking model – statistics summary

Alternative specific constants (ASC) capture the average effect on the utility of all factors not included in the model. The model predictions are driven by the ASCs, as ASCs (greater than 0.84) are higher than most individual-specific variables in the range of -0.8 to 0.7. This suggests that there are unobserved factors on the independent variables that affect the difference between “other cyclists” and the other groups of variables. Specifically, the multinomial logit for clearance-related relative to other cyclists is 2.56 units higher, given that all other predictor variables in the model are constant. The second variable group is volume-related and speed-related, with ASCs between 2.24 and 2.01. The third variable group is activity volume and pavement quality, with ASC between 1.27 and 1.35. Their ASC is slightly higher than environment and terrain, with ASC between 0.84 and 1.08.
As for the impact of individual-specific variables, the significant attributes are age (equal or over 60), bicycle commuting, cycling for leisure on rural roads, the stated cyclist type, and whether the respondent is a regular cyclist. Specifically, individuals over 60 have a negative volume-related and speed-related coefficient, indicating that respondents are likelier to rank them lower than others. On the other hand, they are more likely to rank higher clearance-related and environment-related variables. Individuals who commute by bicycle tend to rank higher in clearance, volume, and speed, while they do not influence other variables. Interestingly, participants who cycle on rural roads provide a higher rank to the environment, and strong and fearless, and enthused and confident cyclists are less challenged by terrain. Finally, all-year-round regular cyclists rank lower in clearance, pavement quality, environment, and terrain than cyclists or non-cyclists.
Stated Cycling Comfort by Urban Bicycle Infrastructure
The second question in the closing section stated cycling comfort levels in different cycling environments. Respondents were presented with nine cross sections of different bicycle infrastructures and were asked How comfortable would you cycle in the following scenarios. Four answers were allowed: Very uncomfortable - Uncomfortable - Comfortable - Very comfortable.
The preliminary analysis of the results included an individual analysis of the frequency of each response by stated cyclist type (interested but concerned, enthused and confident, strong and fearless). Afterward, the mean comfort level at the different infrastructures was compared. Lastly, a statistical analysis was carried out.
Preliminary Analysis
Individual analysis
The following figures show the proposed bicycle infrastructure and the results by stated cyclist type. The figure shows in the x axis the percentage of responses by each category. Labels with the number of responses by category were added as well. The interested but concerned group generally felt less comfortable than the other two groups. Strong and fearless group felt the most comfortable in most environments, and the difference to enthused and confident group were smaller than the difference between enthused and confident group and interested but concerned group. The comfort level decreased as the infrastructure lacked dedicated bike infrastructure or increased the number of traffic lanes.
In path or trails, separated from motorized traffic, 98% of respondents felt were very comfortable or comfortable. A few respondents (less than 3 per stated cyclist type) indicated that they felt uncomfortable or very uncomfortable.

The number of very uncomfortable and uncomfortable responses increased on the infrastructure scenario with a bicycle lane on a two-lane street: 32% of interested but concerned, 15% of enthused and confident, and 10% of strong and fearless expressed their discomfort. Nevertheless, the percentage of very uncomfortable was below 4%.


Increasing the number of lanes from two to four increased the level of discomfort by 11-12 percent points to interested but concerned (from 32 to 45%) and to enthused and confident (from 15% to 26%) and by 7 percent points to strong and fearless (from 10 to 17%). In this environment, more than half of the interested but concerned were comfortable.

The following environment replaced the bicycle lane with a striped bike lane next to motorized traffic. This change increased even more the discomfort of respondents. Specifically, more individuals from the interested but concerned group expressed discomfort (68%) than comfort (32%), and half of the individuals from the enthused and confident group were uncomfortable or very uncomfortable (50%). For strong and fearless, the percentage of comfortable and very comfortable was more than half.

Modifying the configuration from two lanes to two lanes per direction with a center divider increased around 4 percent points the discomfort for the enthused and confident group and strong and fearless group. In this environment, more than half of those enthused and confident were uncomfortable or very uncomfortable (58%), compared to a third of strong and fearless (38%). The effect was more significant for those interested but concerned, whose level of discomfort increased by 8 percent points, from 68 to 76%.

Removing the center divider increased slightly the level of discomfort, by around 4 percent points for all groups. The strong and fearless group had more responses, comfortable or very comfortable (62%) than uncomfortable (28%) or very uncomfortable (10%). The percentage of responses as very uncomfortable increased to one-third (33%) on interested but concerned and to one-sixth (17%) on enthused and confident.


Removing the bicycle lane substantially increased the share of respondents who felt uncomfortable. Specifically, 83% of interested but concerned responded very uncomfortable or uncomfortable, closely followed by 75% of enthused and confident. For the first time, more than half of strong and fearless expressed discomfort in an environment (55%).

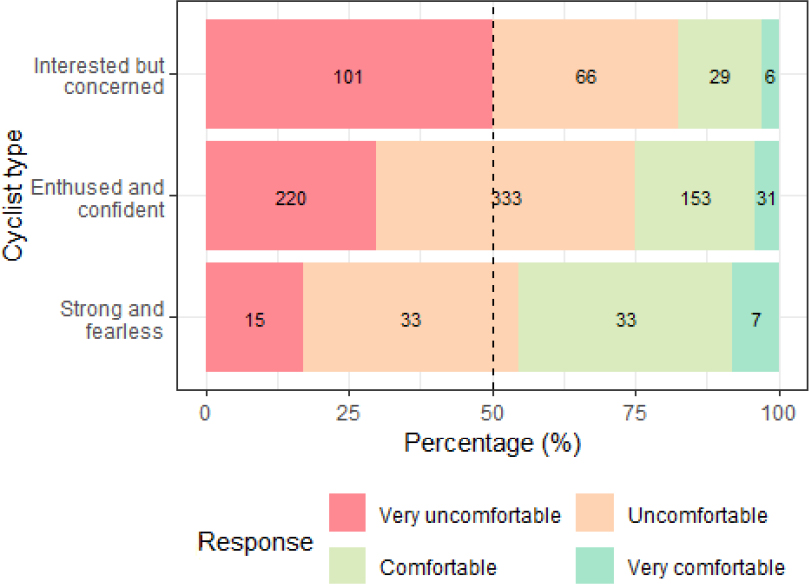
As in the case of the striped bike lane, modifying the configuration from two lanes to two lanes per direction with a center divider did not alter the results significantly for all groups, with an increase between 3 and 5 percent points on the level of discomfort.

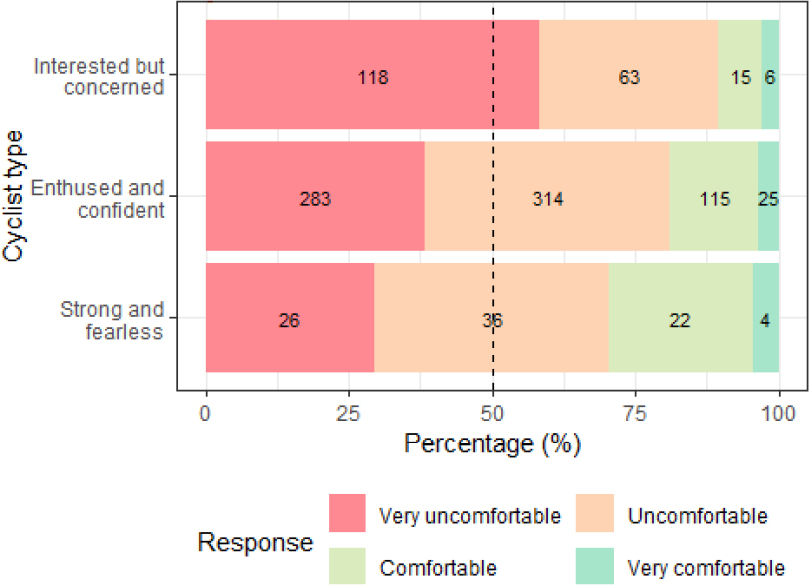
Minor differences were found between a major street with four lanes and a major road with two lanes per direction and a center divider. The increase in discomfort was around 1% for all groups. Notably, 72% of strong and fearless felt uncomfortable or very uncomfortable, of which 33% were very uncomfortable.


Comparison
After the individual analysis of the responses, mean comfort levels were calculated and compared across bicycling environments. The results on mean comfort level agreed with the individual analysis: strong and fearless presented a higher level of comfort by environment, followed by enthused and confident. Interested but concerned had the least mean comfort level across groups. This result agrees with the LTS theory.
The highest differences were produced due to the presence of a bicycle lane and its typology. Environments with trails were very comfortable for all users. Bike lane environments were the only additional ones that produced a positive mean comfort level for the interested but concerned group and the enthused and confident group. Once striped bike lanes were introduced, the mean comfort level decreased significantly for the interested but concerned group, with values around - 0.5 (uncomfortable). The decrease is lower for enthused and confident, who presented values close to zero (somehow uncomfortable). Strong and fearless, on the other hand, still showed a positive mean comfort level. Without bike lanes, all users had a negative mean comfort level.
Minor differences in the mean comfort level could be observed due to the number of lanes and the presence of a center divider. Generally, increasing the number of traffic lanes decreased the comfort level, with the differences more pronounced with bike and striped bike lanes. Removing the center divider slightly decreased the mean comfort level, with differences below 0.05.

The same comparison was made by type of cyclist by cycling frequency. There cannot be observed a clear distinction by type of cyclist. On bike lanes, the mean comfort level of regular cyclists was higher than that of potential cyclists and non-cyclists. However, this trend was reversed in environments with no bike lanes. This inclusive result can reinforce this classification's misuse in a winter survey.

Model Estimation
Lastly, an ordered logit model was used to analyze ordered categorical response variables. The response variable is assumed to have an inherent ordering or ranking, such as in the question: very uncomfortable, uncomfortable, comfortable, and very comfortable. This model estimates the probability that a response falls into each category based on a set of independent variables.
Like the previous statistical analyses, the independent variables considered in the model were the attributes of the scenarios (bicycle lane configuration, number of lanes, presence of center divider) and the individual characteristics of the participants (type of cyclist by cycling frequency and stated cyclist type, age, gender, income, commute mode). Correlation among independent variables was tested, and only variables that were not highly correlated (50% or less) were included in the model.
The following table summarizes the final model. Only statistically significant variables at the 95% confidence interval were included. The fraction of correct choice predictions is 51.5%.

The coefficients of the variables represent the change in the log-odds of being in a higher category (e.g., uncomfortable instead of comfortable) for a one-unit change in the explanatory variable. A positive coefficient indicates that an increase in the explanatory variable is associated
with an increase in the log-odds of being in a higher category. A negative coefficient indicates that an increase in the explanatory variable is associated with a decrease in the log-odds of being in a higher category.
The bicycle infrastructure presented the highest impact on the level of comfort: the log-odds of being in a higher comfort category (i.e., moving from very uncomfortable to uncomfortable or from uncomfortable to comfortable) increased by 5.7 if the bicycle lane was segregated (path or trail), and by 2.79 if there was a bicycle lane. For striped bike lanes, the increase was more moderated (by 1.3). The interpretation of the center divider and number of lanes also made sense, although their magnitude was more moderated.
The stated cyclist type was also significant. This variable was modeled as a linear variable, as observed in comparing mean comfort values. The variable was equal to 0 for no way, no how, 0.33 for interested but concerned, 0.67 for enthused and confident, and 1.0 for strong and fearless. Being enthused and confident increased the log-odds by 1.51 (equal to 0.67 times 2.25), while strong and fearless were more comfortable by 2.25, compared to no way, no how.
Other sociodemographic attributes were also significant in this model. Females were generally more uncomfortable than males, as well as individuals younger than 31. Interestingly, commuters by bicycle tend to be more uncomfortable with a given environment than by transit or walking.
Open Question
Respondents could provide their comments on the last page of the survey in a free-text box. More than 400 respondents introduced specific remarks. With the text, we generated a word cloud with the top 90 most mentioned words, as follows.

Open question responses
We can observe that the words mentioned more than 100 times were, in descending order: roads, shoulder, rural, bike, traffic, cyclists, drivers, cycling, speed, lane, and rumble strips. Also, there were mentions of pavement, debris, or gravel, as in the following excerpt of comments:
“Most of the rural highways around here are higher speed like 55 mph and very little shoulder….. mostly try to avoid them and choose more of a county type road in a more rural farmland area with car speeds more in the 30-45 mile an hour range. Although little shoulder, they are very low volume. I like rural areas for riding… and mostly try to avoid the highways or the thoroughfares.. I think a blinking light and a reflective vest really help…. and a mirror…. I keep a close look on cars approaching me from behind (especially if little to no shoulder) and give myself 2 feet from the edge and then try move over a little as they pass.”
“I rode my bicycle about 3,500 miles this year, including a trip all the way around Lake Michigan. Some of my riding was on bike paths, and some was on urban/suburban streets, but the majority was on rural roads. The most important safety feature to me is a wide shoulder, or other way to feel separated from motor vehicle traffic. I am comfortable riding on roads with little or no shoulder as long as traffic is light and visibility is good. ”
“Since 2010, I’ve completed six bicycle tours of between 200-600 miles, crossing through 5 US states (MN, WI, IN, IL, MI, VT) and two Canadian Provinces (ON, QC). Personally, the biggest barrier to feeling safe/comfortable on rural roads is a lack of separation between a vehicle and myself [e.g., either no shoulder, or a small shoulder (2’-3’)], even on low-speed roads (35 or 40-mph road). I’d prefer to ride on a 55-mph road if it either had a 6’ shoulder or had a 3’ shoulder and rumble strips that separated the vehicle travel lane and the shoulder. Overall, I am most uncomfortable when I feel like drivers may be thinking that I am riding in “their” space or “very close” to their space. By having a large enough shoulder to ride where I can ride on the far right of, I feel that I’m completely out of the driver’s space. Additionally, although I may be close a driver’s space when riding on a 3’-wide shoulder, if there are rumble strips in between the travel lane and shoulder, it is more definitive that the shoulder belongs to me/a cyclist. I can also be more relaxed because I’m less concerned I will be hit from behind. ”
“I train where I live, in the suburbs. I ride long distance in rural areas. I don’t ride in cities. I prefer a shoulder that is at least 3 feet clean space. If rumble strips, the shoulder must maintain that 3 feet of usable space and be cleaned. If it’s full of debris and pebbles (usually caused by the rumble strip that wasn’t cleaned well), then I’m forced to ride on the road. If it’s a very low volume road, like many rural roads in the UP, then I don’t need a shoulder at all. To me, volume is the most important element of determining where shoulder work is necessary. It’s also important to provide “routes” or “connections” for bikers in rural areas. Bikers can travel hundreds of miles and a state needs to be aware of the most likely and safest passages (roads) bikers will use to get from A to B, then to C and D. etc. ”
“I mainly cycle on multi-use trail systems. Cycling on rural roads scares me a little as I often cycle alone and I’m afraid I won’t be seen by drivers. I prefer wide shoulders with lots of clearance to feel safe. ”
“We need shoulders to support those that ride for fun, leisure and exercise or training. I am not comfortable riding on a shoulder or in the lane if vehicles are going faster than 40MPH. I prefer separated pathways and if traffic is slow and cooperating, the lane. ”
“My primary concerns are pavement quality and road width (could be travel lane width(s) or shoulder width). Somewhat less important are traffic volume and % of trucks. Assuming satisfactory pavement quality, I would prefer a wide road with heavy traffic over a narrow road with light or occasional traffic. ”
“The four Geller categories are bogus because each of them combines two different characteristics which are not necessarily related. I am old, not a strong rider but I am fearless, because I am skillful. Enthused and confident? Many bicycling advocates are enthused, but not confident. Interested but concerned? many are concerned, but not interested (they always worry about my safety), and vice versa (they would ride if it were more convenient). No way, no how: this is a slang expression describing aversion but in fact there are people from whom there is no way, due to disability, and others for whom there is no how, due to inconvenience. By using the slang expression, Geller leaves out both of these important deterrents to bicycling. ”
All comments are listed in the appendix. Comments are not edited.
Discussion
Quality of Service for Rural Cyclists
Clearance, automobile traffic volume, and speed
The elements that survey respondents felt were most important when riding their bicycles were clearance, automobile traffic volume, and speed. Among them, clearance was the most relevant in the three analyses. Clearance-related elements presented the largest log odds in the stated rank of elements, the presence of the shoulder and its width had the highest impact on the probability of being selected in one scenario in the choice task, and bicycle infrastructure produced the highest log-odds to move to a higher comfort category in the stated cycling comfort evaluation. All-year-round regular cyclists provided lower importance to clearance than other cyclists, confirming that this group may cycle in more challenging conditions, with higher bicycling frequency throughout the year and under adverse environmental conditions. Furthermore, wide shoulder and lateral clearance were among the most mentioned terms in the final comments. Moreover, the effect of having a shoulder was larger for rural context class compared to rural–town and suburban. The differences between rural and suburban contexts were more minor than between rural and rural–town contexts. This suggests that the relative importance of clearance depends on context classification. Therefore, the analysis procedure for shared and bicycle lanes (paved shoulders) should be distinct, as their sensitivity to variables differs. The results of this survey validated the conclusions from the practitioner survey: respondents felt that the assessment of quality of service by rural bicyclists would differ in shared and bicycle lanes.
Automobile traffic volume-related and speed-related were the second most important group of variables. Automobile traffic volume was slightly more likely to be ranked more critical than speeds. Also, the log-odds were higher, indicating that scenarios with more traffic were less likely to be selected by respondents compared to scenarios with no traffic in a more pronounced way than scenarios with high-speed limit compared to scenarios with low speed limit. It should be noted that the respondents who commute by bicycle ranked higher volume and speed than other respondents, suggesting that frequent cyclists were more aware of the impact of these variables on their comfort. Survey respondents included multiple comments regarding speed and volume. Mainly, they indicated that high speeds were tolerable on routes with very low volume and wide shoulders.
The three top elements agree with previous research and the practitioners' survey. In the practitioners' survey, the aspects that survey respondents felt that bicyclists are most sensitive to in assessing the quality of service on rural highways were related to speed, clearance, automobile
traffic volume, and pavement conditions. They all affect safety conditions, some of which are either design elements or automobile traffic characteristics, which were ranked as the most critical variable groups by practitioners. More specifically, speed limit, lateral clearance, directional automobile volume, snow, fog, and rainfall were believed to be very sensitive to assessing bicyclists' service quality in shared lanes.
In their analysis of bicyclists' perceived risk when overtaken by motor vehicles on rural highways, Llorca et al. (2017) concluded that lateral clearance was the most significant factor. They pointed out that lateral clearance and speed correlated better with average risk perception as a proxy to measure aerodynamic forces between overtaking. When compared with the US HCM (TRB 2022) analysis procedure for the bicycle mode, the results largely agree with the five main criteria to evaluate performance: average effective width of the outside through lane, motorized vehicle volumes, motorized vehicle speeds, heavy vehicle volumes, and pavement conditions. Further, HCM-LOS is highly sensitive to shoulder width and heavy vehicle percentage (around 2 LOS letter grades) and moderately sensitive to lane width (around 1 LOS letter grade). However, field data comprised less than 2% of heavy vehicle percentages.
On the other hand, most bicycle facility design guidelines use motor vehicle volume and speed limit to determine a preferred bikeway type and required clearance (FHWA, 2019; ODOT, 2020; MnDOT, 2007; WSDOT, 2015). Generally, the higher the speed and traffic volume of a road, the more protective the recommended bikeway, either by segregating the facility or increasing its width. FHWA Bikeway Selection Guide (2019) recommends shared or striped bike lanes for the lowest speeds and volumes, while bike lanes are recommended for low speeds and low to moderate volumes. For rural highways, it is recommended to have shared lanes, paved shoulders, and shared use paths. Shoulder width was a key element to accommodate bicyclists, and guidance was provided to select shoulder width based on the posted speed limit and traffic volume (ADT). Similar criteria are used in design guidelines from some state DOTs, with recommendations of shoulder widths depending on expected traffic volume and posted speed limit (MnDOT, 2007), facility type based on ADT and motor vehicle target speed (WSDOT, 2015) or LTS-based criteria based on ADT, shoulder width and posted speed limit (ODOT, 2020). It should be noted that in the case of rural facilities with a posted speed limit below 45 mph, the ODOT Multimodal analysis manual recommends using the methodology for urban segments based on the number of lanes, ADT, functional class, and posted or prevailing speed.
Pavement conditions and context classification
The other two core elements for respondents to select to cycle in each scenario were pavement conditions and context classification. Respondents ranked these two elements fourth and fifth in the explicit ranking, although their coefficients in the choice model were even higher than for traffic volume and speed limit.
More specifically, scenarios with deteriorated pavement, such as large potholes and deep cracks, were less likely to be selected than scenarios with acceptable or good pavement conditions. This agrees with the practitioner survey, as most respondents indicated agreement with the statement that rural cyclists perceptions of quality of service were very sensitive to pavement conditions in shared lanes and sensitive to bicycle lanes. The HCM-LOS is moderately sensitive to pavement conditions (difference around 1 LOS letter grade). Nevertheless, other design guidelines do not include pavement conditions under the criteria or as a consideration to modify segment
rideability. A notable exception is the ODOT Multimodal analysis manual that indicates that the presence of debris in the shoulder and/or poorly placed rumble strips may limit or prevent shoulder use and suggests that it should be coded as no shoulder if long-term debris is present in the shoulder (ODOT, 2015). This aligns with the comments to the user survey, where multiple respondents indicated rumble strips, gravel and debris as main issues while cycling on rural roads.
The impact of context classification was evaluated in the choice tasks. The experimental design included scenarios on rural, rural–town and suburban context to derive differences between suburban and more “pure” rural contexts. The impact of context classification was significant: rural conditions were less likely to be selected than rural–town and suburban conditions. However, the difference between rural–town and suburban contexts was lower than between rural and rural–town. This suggests that the current HCM analysis procedure for rural highways, which was adopted from arterials, may be debatable; and that different thresholds should be proposed for rural and rural–town context. In the current HCM, context classes are not accounted for, and the only element that related to activity-volume is percent of on-street parking. The HCM-LOS is moderately sensitive to on-street parking (around 1 LOS letter grades), which aligns responses of practitioners to the influence on with the moderate sensitivity of practitioners' responses to on-street parking, commercial areas.
Terrain and environmental conditions
Surprisingly, terrain-related elements, such as elevation, grade, or sequence of curves, ranked low. Furthermore, the results of the choice task for grade were mixed. While the individual analysis showed a lower propensity to select high-grade scenarios, the estimated binomial logit model indicated that the higher the grade, the higher the log-odds of choosing that scenario, given that all other attributes remained constant. This could be explained as grade was not explicitly mentioned in the scenarios and may not have been well distinguished by respondents and used as a proxy of scenery attractiveness: scenarios with high grade usually had rolling terrain with trees, compared to scenarios with low grade that were flat in semi-desertic conditions. Therefore, respondents could have interpreted grade as more pleasant scenery rather than challenging terrain and low-grade scenarios, which could be perceived as monotonous (and therefore less attractive) to cycle. On the other hand, interested, more confident cyclists (either enthused and confident or strong and fearless) provided lower importance in the ranking to terrain and all-year-round regular cyclists.
This result does not agree with the practitioner survey, where grade, sight distance, and curvature were believed to be sensitive to the quality of service for rural cyclists, in the respondents’ opinion. Furthermore, field studies indicated that grade length and radii of horizontal curves play an essential role in bicyclists’ speed selection (Llorca et al., 2015) and comfort level (Noel et al., 2003). The Oregon DOT Multimodal analysis manual indicates that a “high frequency of sharper curves and short vertical transitions can increase stress, especially on roadways with less than 6’ shoulders. Engineering judgment may be needed to determine what impact this will have on the BLTS level on a particular segment” (ODOT, 2020).
Environmental conditions received mixed opinions. At the same time, some respondents found environmental conditions among the most essential elements when cycling; the majority ranked them in the bottom half. The practitioner survey responses were also divided about
environmental conditions: the influence on perceived quality of service of environmental-related elements was very sensitive, but environmental conditions were considered within the least important groups. The latter aligns with the current evaluation methodologies (HCM, LTS, BCI), where environmental conditions are not accounted for. Moreover, weather conditions may not be available to most agencies and administrations and including them in the analysis should be considered with caution. Also, the typical bicycle trip characteristics showed that even all-year-round cyclists do not cycle much under adverse weather conditions, with a third of all-year-round cyclists cycling in the rain and less than 16% cycling with snow or fog. The frequencies of potential or seasonal regular cyclists are even lower, with less than 3% cycling with snow or fog and 12% with rain.
Types of Cyclists
This survey used two classifications of cyclists: 1) cyclist type by cycling frequency and 2) stated cyclist type. The first classification follows the logic from Félix et al. (2017) that uses past cycling frequency (whether they cycled in the last year and month) and if they consider cycling again in the next month/year to classify them. Three classes are distinguished: regular cyclists, potential cyclists, and non-cyclists. The second classification is based on the stated level of confidence and follows the four types of cyclists defined by Geller (2006) and refined by Dill and McNeil (2016): no way no how, interested but concerned, enthused and confident, and strong and fearless. Survey respondents were asked which one of them defined better as cyclist.
Interestingly, cycling frequency captured more differences in the ranks of the elements. All-year-round cyclists ranked lower clearance, pavement quality, environment, and terrain than seasonal regular cyclists, potential cyclists, or non-cyclists. This is consistent with a higher tolerance to cycle under adverse weather conditions, which can indicate more experience and higher cycling skills. These criteria are used by the new edition of the AASHTO Green Book (2018) to segment design cyclists: comfort level, bicycling skill, and experience.
Individuals who stated to be enthused and confident were more likely to select to cycle in each scenario, compared to selecting “none of them,” and individuals who were strong and fearless. It can be observed that the likelihood of strong and fearless was higher than for enthused and confident, as expected. However, the highest difference was between interested but concerned and enthused and confident. Furthermore, the sensitivity to the attributes of the scenario was equal across all groups, as interaction terms were not statistically significant. Cycling frequency was not statistically significant, indicating that, for the choice task, stated cyclist types were a better predictor to evaluate the likelihood of cycling in each scenario.
Stated cyclist types aligned better with the reported comfort level in different cycling environments. More specifically, the results show apparent differences by stated cyclist type, with an increased level of comfort for the enthused and confident group compared to the interested but concerned group and for the strong and fearless group compared to the enthused and confident group. This difference was linear. Contrarily, cyclist types by cycling frequency provided mixed results: while regular cyclists were more comfortable in bike lanes and trails, non-cyclists were more comfortable in environments without bike lanes. Moreover, the differences among groups were minor and could result from the low sample size of non-cyclists. In this sense, the classification by confidence level better captures the comfort of cyclists while cycling in urban environments in contrast with their cycling frequency.
The distribution of cyclists was compared to the results from Dill and McNeil (2016). While Dill and McNeil (2016) represented the entire spectrum of cyclists in urban areas, this study targeted cyclists on rural highways. Most of the respondents were enthused and confident cyclists.
Afterward, we compared the gender and commute mode distribution across the cyclist groups. To avoid the original bias resulting from the sampling process, we first calculated the percentage of being in each cyclist type for each category (e.g., male and female) under that variable and then compared the difference between different sociodemographic categories across cyclist types.
The percentage of males in the strong and fearless group and enthused and confident group was larger than females in both surveys, while other categories were the opposite. However, the gap between males and females in each category was more apparent in this survey. This could be explained by cycling on rural roads more appealing to males than females. In the survey, the percentage of strong and fearless and enthused and confident cyclists was larger than in other modes, while walking dominated the survey from Dill and McNeil. For the other two categories, the percentage of bicycles is much smaller than other modes in this survey, but only a little smaller than other modes in 2015’s survey. One possible reason could be that people living in metropolitan areas usually have shorter commute distances. This also indicates that the cyclist type significantly impacts commute mode for those who cycle on rural roads.
After comparing the sample distribution, the level of comfort from survey respondents was compared with the level of comfort collected by Dill and Mc Neil (2016) and the proposed LTS-based criteria from Furth et al. (2016). In their work, Furth et al. (2016) proposed that scenarios with trails, bike lanes, or striped bike lanes in residential streets are compatible with interested but concerned cyclists, while scenarios with striped bike lanes in major streets or scenarios without bike lanes in residential streets would be compatible with enthused and confident cyclists. Major streets without bike lanes would only be compatible with strong and fearless cyclists. The following table collects the percentage of respondents that indicated that a given scenario was comfortable or very comfortable for them by stated cyclist type.

In the current survey, the percentage of respondents being comfortable with a scenario decreased as the scenario reduced the cycling facilities and increased the number of lanes. The results were consistent across all cyclist groups. However, in the results from Dill and McNeil, the trends were unclear: the percentage of strong and fearless cyclists comfortable on trails was lower than that in striped bike lanes in major arterials. Furthermore, in scenarios with bike lanes, the percentage of comfortable responses was higher for enthused and confident than for strong and fearless. The criteria by Furth et al. (2016) agrees with which scenarios were comfortable for at least 50% of cyclists: scenarios without bike lanes in major arterials were comfortable for 100% of strong and fearless, but for 40% of enthused and confident. Similarly, scenarios without bike lanes were compatible with enthused and confident but not interested but concerned. This survey reflects other results: while most of interested but concerned were comfortable in scenarios with a bike lane, only one-third was comfortable in minor streets with striped bike lanes. Moreover, between 42% and 50% of enthused and confident were comfortable in scenarios with striped bike lanes; compared to 84% to 100% in the study from Dill and McNeil. Similarly, their strong and fearless cyclists were more comfortable in major arterials with four lanes, but in the current survey, only 28% to 45% were comfortable.
The differences suggest that the criteria for the LTS in urban areas should be revisited for rural cyclists. Rural bicyclists may be more aware and likely to tolerate higher stress levels than urban cyclists. On the other hand, rural bicyclists may not be used to cycling in low-speed environments, where traffic disruptions may be more frequent and therefore may generate higher stress levels, as one participant indicated in the open question: “PS: those StreetMix scenarios aren’t very rural. Given the size of those buildings, one is in a large city and roads are going to
be busy. Even with a protected bike lane, I would still feel uncomfortable due to the volume of traffic and all of the distracting stimuli assaulting the drivers and leaving less cognitive room for them to be looking out for me. Hence all my answers are” “very uncomfortable”.
“The four Geller categories are bogus because each of them combines two different characteristics which are not necessarily related. I am old, not a strong rider but I am fearless, because I am skillful. Enthused and confident? Many bicycling advocates are enthused, but not confident. Interested but concerned? many are concerned, but not interested (they always worry about my safety), and vice versa (they would ride if it were more convenient). No way, no how: this is a slang expression describing aversion but in fact there are people from whom there is no way, due to disability, and others for whom there is no how, due to inconvenience. By using the slang expression, Geller leaves out both of these important deterrents to bicycling.”
“I’m a vehicular cyclists and feel comfortable riding with traffic however I find myself less enthusiastic about riding on roads since the Covid19 pandemic. I have been leading multi-day bicycle tours for 20 years and have observed that traffic is traveling faster and faster on rural roads previously with low traffic volumes. Increased speed and traffic volume has made me look at rural roads more critically when considering a rural route for a bicycle tour. I judge roads, rural or otherwise, by my comfort level and more importantly the comfort level of my participants/guest.”
Conclusions
An online survey was conducted to identify the drives and constraints on rural cycling for commuting or leisure for different user types. More than 1000 complete responses were collected across the United States. The results suggest which variables are more relevant to users to cycle (or not) on rural highways and which are highly valued. Moreover, it collected cycling comfort levels in different cycling urban environments. The influence of individual-specific attributes, such as age, gender, income, commute mode, or cyclist type, on the results was tested. For these, two classifications of cyclist types were used in the analysis: by cycling frequency and by stated cycling comfort (or level of traffic stress-based). Results were compared with previous research and design guidelines.
The main conclusions of the study are:
- Respondents felt that the most important element for them to cycle on a rural highway was related to lateral clearance, paved shoulder width, or lane width. The presence of a shoulder had the highest impact on the odds of cycling in each scenario, with an increase of 1.7 for narrow shoulders and 9.6 for wide shoulders. Furthermore, the strength of this effect was different by context class: rural areas without shoulders were less likely to be selected compared to rural–town areas without shoulders. This result validates the conclusions from the practitioner survey, in which respondents felt that bicyclists would have different sensitivity to context class in shared lanes than in paved shoulders. Responses also expressed that shoulders are rideable when clear of debris, gravel, or obstacles and that rumble strips make it difficult to navigate on the shoulder when debris is present.
- The analyses revealed a high sensitivity to speed and automobile traffic volume. These results are consistent with the practitioner survey, previous studies, and design guidelines, which indicate that the two main criteria for selecting specific bicycle infrastructure and its
- Equally important were pavement conditions and context classification (or activity-volume-related elements). While bicyclists ranked them with lower relative importance than clearance, speed, or traffic volume, the choice experiments revealed a significant negative impact of deteriorated pavement and rural context on the cycling odds in each scenario. While the differences between acceptable and good pavement conditions were substantial, the differences between rural–town and suburban contexts were more minor than between rural and rural–town contexts.
- There is a division of opinions about the influence of terrain and environment-related variables. A substantial number of respondents ranked the environment among the most important elements, while an equal number of users stated that they were the least important. A general agreement was on ranking other cyclists as the least important elements. Terrain-related elements, such as elevation, grade, or sequence of curves, ranked low. However, scenarios with higher grade presented higher odds of being cycled on. High grade could have been associated with more beautiful scenery in rolling terrain and, therefore, less monotonous and more attractive to cycle for leisure.
- Stated cyclist type classification aligned better with declared comfort levels at different urban cycling environments than the cycling frequency classification. Compared to the interested but concerned group, enthused and confident cyclists showed increased comfort, while strong and fearless cyclists declared the highest comfort levels. For rural scenarios, interested but concerned cyclists were less likely to select to cycle than the other two groups; however, there needed to be more apparent differences between enthused and confident cyclists and strong and fearless cyclists.
- Even though most respondents classified themselves as “enthused and confident” or “strong and fearless,” a relatively high share of “interested but concerned” answered the survey and cycled on rural highways.
- Classifying cyclists by cycling frequency can be misleading if seasonal variations are not considered. Potential cyclists cycled less than regular cyclists, but two-thirds of them cycled at least once a week on their typical bicycle trip. The survey was launched in winter, and seasonal regular cyclists were labeled potential cyclists. The main differences between regular and potential cyclists were found in response to which adverse environmental conditions they cycle. Cycling frequency was insignificant in evaluating the comfort level in different cycling environments. However, all-year-round cyclists presented different sensitivity to which elements they considered the most important while riding, with relatively lower importance of clearance, pavement quality, environment, and terrain.
width are ADT and posted speed limit. High speed limits could be tolerated by cyclists if automobile traffic is very low, reinforcing the importance of a combined analysis of speed and traffic volume.
The conclusions of the study are limited to the designed questionnaire and the collected responses. The survey was targeted at individuals who cycle on rural highways, and therefore, the extrapolation of these results to the overall cycling population or urban cyclists in specific geographical areas should be undertaken with caution. Based on these conclusions, the recommendations of the study are:
- HCM bicycle analysis procedure should be revisited for rural highways, as the perception of cyclists differs from urban segments. BLOS scores by context classification (rural, rural–town) and facility type (shared lanes, paved shoulder) should be distinct, as their sensitivity to variables differed. For that, subjective comfort levels should be collected at least based on shoulder width, speed, automobile traffic volume, presence of heavy vehicles, pavement conditions, and context classification. Other aspects include maintenance of paved shoulders, grades, or intersections. Grades should be represented with caution, as they could be misinterpreted by scenery quality. It is recommended to derive criteria following the HCM-LOS approach to provide more sensitivity to infrastructure changes.
- LTS bicycle analysis procedure should be revisited for rural highways. LTS criteria should account for clearance and traffic volume and could include the effect of speed, pavement quality, and terrain. Sensitivity to elements seemed to be equal across all groups, and the more confident groups generally had a more significant likelihood of selecting to cycle in each scenario. More research is required to validate LTS-based design criteria with user comfort perception and to choose the most appropriate target user(s).
- For bicycle operational analyses on rural highways, with an increased project complexity and detail level, the HCM analysis procedure is preferred. This method is sensitive to more variables; therefore, specific countermeasures' impact is covered (e.g., increasing bicycle lane width). LTS could also be used, although the results may be less sensitive to improvements beyond changes to facility type, automobile running speed, or automobile traffic volume.
- For planning applications, such as regional transport planning or transportation system plans, the LTS approach is preferred. These applications may not require a specific analysis of the facility but rather an overview of which users would be served to identify key locations where the bicycle network should be improved. For such applications, the LTS is preferred. The HCM analysis procedure should not be used, as data availability would be limited.
- More research is needed to define target bicycle users, identify their main characteristics, and evaluate their comfort level in different environments. Both classifications by confidence and frequency could be combined. Seasonal variations must be considered when classifying cyclists by their frequency. The most representative bicyclist user for rural highways, and therefore target user, is “enthused and confident.” For some sites where moderate bicycle volumes are expected, the target bicycle user should be “interested but concerned.”
This research points to the need for future discussions on the role of bicycle user segmentation for operational analyses and the need for a planning methodology. If the HCM analysis procedure aligns with the current LTS-based design criteria, different LOS thresholds should be considered for bicycle users. The most important characteristics have been identified, but specific criteria and thresholds still need to be defined. On the other hand, a planning methodology for bicycle mode based on the LTS should be developed based on users’ perceptions and incorporated into NCHRP Report 825: Planning and Preliminary Engineering Applications Guide to the Highway Capacity Manual (Dowling et al. 2016). Even though this
effort was intended for rural highways, it could also provide a sound basis for a potential review of cycling performance evaluation on urban streets.
Supplementary Appendix
Final Comments. Open Question
The comments are not edited.
Further comments on bicycle use in rural areas. You might like to comment on your cycling experience, your experience with other vehicles on the road and/or road conditions, points of interest, safety issues, etc. If you are not a cyclist, you can tell us what must change, or needs to improve for you to start cycling in rural areas.
Comments
- Distances are far between destinations in rural areas, but the need for safe active transportation infrastructure is still necessary. Vision Zero/Safe Systems requires separating vulnerable users from fast traffic.
- I am VP of my 300-member cycling club and we mostly agree that riding on high speed rural routes can be comfortable when we are riding together and visible as a group. I am also the bicycle policy manager for the DOT, so I understand our challenges with ROW acquisition when we may think to widen a rural route and add shoulders. We try to cooperate with county engineers who do not want to take on maintenance of off-street bicycle accommodations along state routes. Where we can install shoulders, we try to do so, especially in and within 1 mile of municipal boundaries.
- When cycling in rural areas there are typically higher vehicle speeds. In these instances, I prefer to ride my bike in a separated bicycle facility - either vertically separated or horizontally separated.
- I am an avid mountain biker. I typically take my mt bike on a bike rack to a trailhead. I bike a little over 2 miles to work, mostly in a bike lane. I avoid biking around town in the heavier traffic areas. Slower speeds in town and a better-connected bike network are needed in town. I am unlikely to bike on the road outside of town, though may consider it if there are wide shoulders and low volume roads.
- There is a 55-mph street by me with rumble strips. The rumble strips weave back and forth and make it nearly impossible to ride on the shoulder. Vehicle drivers see the shoulder, but it is harder for them to see the weaving rumble strips; so, they tend to be more annoyed that I am riding in the travel lane.
- If there are no separated trails or bike lanes, I am comfortable on low volume roads < 5000 with 4 feet or more of shoulders. On higher speed highways, I am comfortable on shoulders of 6 to 8 feet.
- Too many aggressive drivers (urban and rural) limit where we, as a family, feel safe riding. Unless there are routes that can incorporate a large chunk of separated bike lanes or trails we don’t ride there as a family. Even wide sidewalks adjacent to busy roads make me nervous as our young riders could easily end up riding off the curb into the street.
- I was more confident riding on roads around Lake Champlain, VT/NY. I am afraid of beer bottles and disrespectful drivers in some rural areas in Virginia. We need a culture change.
- In truly rural areas on roads with low ADT, sharing a dirt road, or wide shoulders on a paved road, I find acceptable. As traffic volumes increase, a separated, shared-use path within the ROW is the way to go!
- The main thing I need is a clean shoulder, 2 to 4 feet is optimal, but I can deal with 2 feet if it is a clean line. Rumble strips between the shoulder and traffic are a nice add as well.
- a big concern is distracted drivers (cell phone use). Sufficient shoulders are very important but need to (try) to clean debris (broken glass) so that the biker doesn’t divert into the driving lane.
- We need more bike lanes everywhere—cities and rural areas. Many roads in my area are not safe for cyclists yet our tourism board promotes cycling in our area.
- the available info in this survey for the images of roads on which you would feel most comfortable riding lacked information on vehicle volume. For example, we have plenty of roads around my small town that are 55 MPH but have very low volumes. I feel comfortable riding in the travel lanes on these roads (for leisure) because I can hear cars coming from far away, they normally have the entire road to pass me with, and they usually move way over for riders. Low vehicle volumes also make avoiding potholes easy. The StreetMix diagrams in another part of the survey struck me as odd. Several of the diagrams showed four-lane streets. There are no four-lane streets anywhere in my county, much less in/near my city. The diagrams didn’t strike me as rural though I’m aware that rural areas exist with four-lane roads. They also left out critical info such as vehicle speeds and volumes on which many riders base their decisions about where to ride. Your survey chose not to display any advisory bike lane treatments. This is a rural treatment rapidly growing in popularity and makes many of the two-lane configurations much more comfortable for riders.
- In rural areas, I think large shoulders are the biggest single factor for me.
- Most of the rural highways around here are higher speed like 55 mph and very little shoulder….. mostly try to avoid them and choose more of a county type road in a more rural farmland area with car speeds more in the 30-45 mile an hour range. Although little shoulder, they are very low volume. I like rural areas for riding… and mostly try to avoid the highways or the thoroughfares. I think a blinking light and a reflective vest really help…. and a mirror…. I keep a close look on cars approaching me from behind (especially if little to no shoulder) and give myself 2 feet from the edge and then try move over a little as they pass.
- Your photos of different rural settings were very poor. The pavement quality and speed limit signs were not well conceived. The survey left a lot to be desired.
- We are randoneers. RUSA.org, I have had discussions with the Denver city bike advocates and fought with them about placement of bike facilities. Even completed the DOT course for bike infrastructure. Denver misused the funds in my opinion. There is a complete database of where people ride and commute. This data can be found at Zwift, Ridewith GPS and others. So far, I have not seen anyone using this data. Please be different.
- My daily commute is on a rural highway with no shoulder. There are places where the white line is crumbling away from the edge of the road. There is a high volume of truck
- In my area there are a lot of people in rural areas that do not like cyclists. They will drop tacks on the road, drive as close as they possibly can while brushing you with a mirror, some people have even gone as far as dumping downy laundry fabric softener on me. Most of the rural roads around my area have no shoulder, winding roads, and speeding cars.
- Motorists are distracted and unconcerned with non-automotive traffic.
- We have very nice pavement quality in Ky for the most part. Spoils you if/when you travel to other areas; and realize how nice you have it at home.
- Gravel, potholes, and lack of shoulders wide enough for cyclists as well as signage of bikes on rural roads (and suburban roads!) are real concerns nearly everywhere across the United States. Vehicles do not realize, value nor appreciate us cyclists and often purposely “terrorize” us with poor driving behavior. With the Climate Crisis upon us, and just the growth in the recreational cycling, more needs to be done to educate the public on basic knowledge necessary as they share the road with cyclists. Thank you.
- I prefer to ride on rural or semi-rural roads that have little traffic. Bike/pedestrian trails are great but not necessary. Organized rides are also nice but not necessary.
- I feel that it would help if more emphasis was placed on keeping existing shoulders cleaner and free of debris in rural areas.
- Cycle ion winter in Texas - in Illinois other seasons.
- Any new road work should consider cycling safety.
- I use dedicated trails.
- I rode my bicycle about 3,500 miles this year, including a trip all the way around Lake Michigan. Some of my riding was on bike paths, and some was on urban/suburban streets, but the majority was on rural roads. The most important safety feature to me is a wide shoulder, or other way to feel separated from motor vehicle traffic. I am comfortable riding on roads with little or no shoulder if traffic is light, and visibility is good.
- Too many distracted drivers. Cell phone users. Overly aggressive drivers.
- Rural road cycling in KY is great in some parts of the state. Motorist awareness is my greatest concern.
- The vast majority or roadways in Illinois were not built with the bicyclist or pedestrian in mind. They were built for people to jump in their cars and go someplace, fast. In rural areas, I worry most about being seen by drivers, the speed and volume of traffic, and preferably a separate parallel (to traffic) pathway or a large shoulder to separate me from traffic. One safety issue I encounter frequently with wide shoulders is the debris kicked onto the shoulder by traffic, including glass, trash, and rocks/stones.
- Probably the biggest concern when riding on a highway shoulder is that many times the shoulders are full of road debris and are not cleared.
- Roads in central Kentucky are generally in good shape and drivers are courteous and cautious in passing.
- I bicycle most weekends of bike trails in suburban or rural areas. I avoid street biking if possible, because of the stress levels. To many people driving vehicles with more things
traffic. I feel safer with flashing lights front and back and I think the “locals” look out for me. I’d be MUCH more comfortable with a bike path.
- Rural areas with wide shoulders are often quite comfortable to bike in. I find that the bigger problem is often getting there. The transition areas can be hard for cyclists.
- I feel very comfortable on farm roads where the local population knows me and my patterns. Then the only ones to worry about are the non-locals or the commercial trucks. In other roads I prefer wide aprons to the road due to the erratic driving habits as well as some of the deliberate targeting of riders I have experienced and seen. While IL has some good laws the worst drivers that are the most offensive normally have tags from Florida or an Eastern state.
- Having a 4” ft. wide or more paved shoulder is the best. However, drivers using mobile devices or otherwise distracted can still be dangerous to bikers because they can drift onto the shoulder. That’s were a physical separation like a curb is beneficial. Using “No Turn when Pedestrians/Cyclists are Present” at intersections is very beneficial. Reducing the speed difference between a cyclist and a driver is very important where roadways are narrower or without a shoulder.
- Township highway departments installing rumble strips in shoulders forcing cyclists into the highway traffic lane.
- MDOT needs to find a way to have J style turns for motorized vehicles and still have through paths for pedestrians and cyclists. There are some stretches of road where MDOT has put J turns in for miles on heavily used M roads and nonmotorized is forced to ride, or walk, substantial distances to a cross street that lacks the J turn configuration.
- All the photo images depict less than idea cycling conditions in my experience and from my perspective. 20 mph roads better, but other infrastructure improvements needed to help make the images more bicycle friendly. None of the photo images appears to have any bicyclist-centric design; all were created primarily or exclusively for people in cars. They were not for people on bikes, unless, in limited ones, as an afterthought, and they are not at all effective. They are images of car roads, that’s it.
- Ranking elements by how important they are when riding my bike is confusing, and ambiguous to me. Elevation, grade, and sequence of curves is “important” because it makes riding more interesting, and I am MORE likely to ride in those places. Speed-related concerns are “important” because fast cars make riding scarier and more dangerous and make me LESS likely to choose an area to ride. I tried to answer just in terms of safety.
- The further I get from the city, the more I worry about large farm dogs and yahoos in pickups.
- Generally, in Illinois drivers speed. Most are considered of cyclists, but it is still dangerous. I try in ride on least traveled roads and in a group.
- You may want to run your survey through spell check. I spotted at least two typos, e.g. “interested” has “t” in it (describe yourself as a cyclist question). The other was early on, but I’m afraid if I go back to find it, I’ll lose the results I’ve already input.
- I’m a ride leader for a local cycling club. I prefer to lead my rides on low traffic neighborhood streets and dedicated multi-use trails. I’ve been hit by a car while riding and had numerous close calls with cars. While I can ride with confidence in a lot of situations, I would never lead my group in those situations. I want them to feel safe and have fun.
on their minds that watching out for bicycles. If there is a wide shoulder next to a road, it does not bother me.
- Since 2010, I’ve completed six bicycle tours of between 200-600 miles, crossing through 5 US states (MN, WI, IN, IL, MI, VT) and two Canadian Provinces (ON, QC). Personally, the biggest barrier to feeling safe/comfortable on rural roads is a lack of separation between a vehicle and myself [e.g., either no shoulder, or a small shoulder (2-3 feet)], even on low-speed roads (35 or 40-mph road). I’d prefer to ride on a 55-mph road if it either had a 6’ shoulder or had a 3’ shoulder and rumble strips that separated the vehicle travel lane and the shoulder. Overall, I am most uncomfortable when I feel like drivers may be thinking that I am riding in “their” space or “very close” to their space. By having a large enough shoulder to ride where I can ride on the far right of, I feel that I’m completely out of the driver’s space. Additionally, although I may be close a driver’s space when riding on a 3’-wide shoulder, if there are rumble strips in between the travel lane and shoulder, it is more definitive that the shoulder belongs to me/a cyclist. I can also be more relaxed because I’m less concerned, I will be hit from behind.
- I’ve noticed that often our rural off-road paths do not have enough interest and investment to keep them maintained and in good riding condition. I find I relax significantly when I reach an area that has a good shoulder so I can move out of the main traffic lane and yet still have good maneuverability to avoid hazards in the shoulder and return to the main lane if needed. Those rumble strip things on a narrow road with a narrow shoulder are my enemy - there is no safe place to ride with them. In our area we face the choice of either using narrow paved roads with higher amounts of fast traffic or quieter roads but with gravel surface. Drivers in our area seem to be courteous when they see me out - I think they are used to slow-moving vehicles because of the amount of farm equipment.
- I am a long-time cyclist who has ridden in all environments. I cycle for fun and exercise. I most enjoy low traffic rural roads, but I ride most often on suburban side streets where I am confident. I don’t ride on designated bike paths very much, usually only as a connector to get past expressways and other barriers. Bike paths can be dull, especially when they have a corridor of trees and bushes. If there is a shoulder, I am OK on highways, even if car/truck traffic is going fast. I think there should be a requirement with all new road construction or repaving to provide a minimum width paved shoulder, say 4 feet wide.
- I’m more of a runner but will ride my bike when injured or alongside my daughters when they are on a long run where I can’t keep up. Otherwise, I prefer to ride on nonmotorized trails.
- I ride a lot in rural areas for pleasure, but not for commuting. I can be on a rural road in less than 15 minutes’ bike from my house which is in an urban/suburban area. Most rural roads are 55mph with little to no shoulder. I choose only roads that are as low traffic as I can find. For urban riding, I will ride on the sidewalk if there’s no bike lane and the road is more than two car travel lanes wide (our sidewalks are less used than they should be.) I ride with (my) children.
- I’ve lived both in Kentucky and Oregon, and sadly, the biggest detriment to my experiences as a cyclist on rural roads is drivers. In both states, when cycling on rural roads that have no shoulder or dedicated cycling lane, drivers are exceedingly impatient with cyclists being on rural roads at all. My experiences were worse in the south than in Oregon, but I have still had far too many experiences with drivers in Oregon passing either too close or when they shouldn’t pass at all.
- I used to love cycling rural roads in Kentucky, but the senseless fury I experienced from drivers in that area pushed me away from continuing. My move to Portland was partly motivated by the knowledge that the cycling infrastructure out here is far more developed. Having separated bicycle paths that are exclusively dedicated to cyclists and pedestrians is a game-changer. If a separate path for bikes isn’t feasible, having a wide shoulder on the road is necessary. When cyclists take the lane, drivers get mad, no matter the cyclist’s reasoning. Keeping us out of the path of vehicles is the best way for cyclists to have the best experiences they can.
- I mainly cycle on multi-use trail systems. Cycling on rural roads scares me a little as I often cycle alone and I’m afraid I won’t be seen by drivers. I prefer wide shoulders with lots of clearance to feel safe.
- When choosing pictures, I chose the widest shoulder. However, most roads where I live have no shoulder or are less than 2 feet. I still bike them, partly because I don’t have other options and partly because the traffic on them is nominal enough that it is rare that two cars are passing one another at the point that I am located at a given time. I get excited though whenever roads are widened with shoulder or better yet, a pathway is added!
- Cycling in rural areas presents challenges due to the relative infrequency of conflict, and thus unexpected, unpredicted conflict. The attraction can also be the downside. Bike paths are usually perceived as a safer alternative. But often not as engaging over time. The risks are worth the benefits. One change to the legal structure would be to make stop signs into yield signs for bicycles. Watch trails, intersections and you’ll see much of the time that stops are done when necessary for traffic but become defect yield signs when possible.
- rural road paved shoulders with full-width rumble strips are intentionally designed to place cyclists in the traffic lane. They DO NOT DETER ME from riding on that road, but they result in a dangerous situation. Narrow rumble strips between the traffic lane and the well-paved shoulder, such as on the painted stripe, are ideal warning/buffers and should be encouraged.
- Tools like photo radar, cameras at intersections, and the European Intelligent Speed Assistance always assure compliance with road regulations. Drivers kill cyclists with few consequences, as vehicle insurance takes care of the liability.
- Motor vehicles are increasingly passing closer and at higher speeds. I’ve mostly stopped biking rural roads due to the increased risk.
- I’ve been cycling on the road for over 10 years, and while it generally appears that higher speed and volume is the biggest concern, lately I find that cross traffic and access management is more of a concern. Even in a low-speed residential area, frequent driveways can be a hazard to a rider with backing traffic. I’ve had close calls from turning traffic but have grown accustomed to riding parallel to traffic even at high speeds on a rural highway. Lateral clearance is critical for safety and comfort as a rider and helps make rural riding on a low volume highway a pleasure. A narrow winding mountain road is navigable as well if the speeds are lower. I’m willing to “take the lane” when needed, and traveling downhill I feel I nearly match the car speeds if the posted speed limit is around 30.
- I train where I live, in the suburbs. I ride long distance in rural areas. I don’t ride in cities. I prefer a shoulder that is at least 3 feet clean space. If mumble strips, the shoulder must
- Sight lines and speed differential are by far the most influential factors for my perception of safety on rural roadways. I frequently have close calls being overtaken on high-speed rural roadways with poor sight lines; drivers are impatient and will pass when it is not safe to do so.
- Like riding mostly on paved trails. Being in MI, the trails are getting a little tough due to weather. I’ll ride on rural roads with a decent shoulder.
- Bicyclists on rural roads are a hazard to both the automobile driver and the bicyclist. Bicyclists need to pay their fair share as a privilege to use the roads.
- I do not feel comfortable biking in rural areas because of the speed of cars and the lack of physical infrastructure separating fast moving vehicles from bicyclists. On my commute to work, it is not necessarily rural, but the speed of cars and large trucks concerns me.
- Protective barriers
- I commuted by bike in both metropolitan area and small cities as well as toured by bike for 20 years. Multi-day bike tours have included riding on shoulder of rural interstates when there was no other choice (I-8 in southern AZ) and two-lane highways. My main variables for riding a bicycle in rural areas are whether the traffic volumes are low and width of paved shoulder. I have ridden in separate paths, bur prefer roads and streets as multi-use paths are too often clogged with pedestrians, joggers, and folks with strollers. I’d prefer to keep at quick clip on a city street. For rural separated paths, they are often poorly maintained and present more hazards (leaves, potholes, gravel, etc.) than benefits.
- Additional designated bike paths and lanes in dense areas. Rural roads should ensure adequate shoulder margins and maintenance of those margins (clearing rocks and debris).
- I live in Helena, MT, and would love to have a safe way to use rural roads to bike to nearby towns like Lincoln, Avon, or Townsend. I moved to Helena from the Washington DC area about 3 years ago, and when I lived there, I biked everywhere all the time. It’s been a huge adjustment and makes me very sad that we don’t have safe infrastructure to bike around here, urban or rural.
- Speed limits and traffic calming on rural routes like Route 10 in NH are lacking yet these roads COULD accommodate many more cyclists and WOULD be extremely popular if more width, lower MPH, and road diets were implemented. Right now, only, if at all, skilled cyclists dare to use the only north–south route options between communities in our area and that’s a huge, missed opportunity for safety, multimodal transportation, and economic development. Not every route as an option nearby for an alternative off-road facility due to terrain etc. so road designs and standards MUST change.
- Rural areas need wider shoulders or designated bicycle lanes. So many people just do not have patience with bicyclist.
- Safer and smoother roads. Chip and seal roads are generally dangerous for cyclists until the loose stones are gone or imbedded into the road.
maintain that 3 feet of usable space and be cleaned. If it’s full of debris and pebbles (usually caused by the mumble strip that wasn’t cleaned well), then I’m forced to ride on the road. If it’s a very low volume road, like many rural roads in the UP, then I don’t need a shoulder at all. To me, volume is the most important element of determining where shoulder work is necessary. It’s also important to provide “routes” or “connections” for bikers in rural areas. Bikers can travel hundreds of miles and a state needs to be aware of the most likely and safest passages (roads) bikers will use to get from A to B, then to C and D. etc.
- All rural road projects need to take alternative modes - cycling, walking—into account, and make space for them, including bike lanes, and/or bike/pedestrian pathways.
- High speed limits are a huge deterrent and very scary. It’s frustrating that shoulders are added to give room to people on bikes, but then drivers drive faster. With high speed roads, separate facilities are needed, particularly for roads connecting to important destinations, including parks, hiking trails, docks, as well as retail and job centers. It is super frustrating that kids can move around independently due to road safety. This has a outsized burden on women, as they tend to do the lion’s share of caregiving.
- I get annoyed with motorists pass another oncoming vehicle when they can clearly see – yes with me waiving – that I am head-on to them in the opposite direction lane.
- I am growing more concerned about distracted drivers. We have terrain issues here that hide a bicycle over a vertical curve and drivers must be ready and vigilant for everyone to be safe. I have had a couple of concerning close passes by vehicles.
- As a cyclist, I don’t like having to yield to ALL other traffic on the roadways (motor vehicles, motorcycles, ag vehicles, horse-drawn, runners, pedestrians, pets, etc.), and particularly at intersections. I especially feel threatened by significant numbers of motorists who demonstrate an attitude that cyclists have no place on the roads (for example, by forcing cyclists off into the grass along the roads, or into cars parked along the roadside). Many motorists generally give cyclists less respect than even the little respect given to pedestrians. Roads with no usable “shoulder” area that cyclists can use as a “bail-out zone” are extra dangerous. Road shoulders (that cyclists are generally relegated to use) usually have large quantities of road debris that damage tires and potentially throw a cyclist off-balance. Even in-village roadways (with 30 MPH speed limits and “parking” lanes) are risky to cycle on, and open highways often are worse due to higher vehicle speeds along with narrower and more uneven shoulder areas for cyclists.
- Having places to securely lock a bicycle to at a destination is key in all environments.
- I ride mainly gravel roads in rural areas. These by their very nature are low volume and low speed for vehicles, so incredible for cycling. The gravel makes wet conditions not an issue either.
- There need to be more trails and on-street protected bike lanes for me to consider cycling more in rural areas.
- We need shoulders to support those that ride for fun, leisure and exercise or training. I am not comfortable riding on a shoulder or in the lane if vehicles are going faster than 40MPH. I prefer separated pathways and if traffic is slow and cooperating, the lane.
- I have toured fearlessly over 10,000 miles but don’t ride in rural areas as often so prefer straight roads with low traffic and large shoulders. The older I get the more I prefer to ride with others when I’m more than several miles from home.
- None currently.
- I am a road cyclist but primarily ride on multi-use paths now. I am worried about drivers who are texting. I would like more multi-use paths in our area. Large shoulders and bike lanes adjacent to the road are still susceptible to distracted drivers.
- We have a lot of trucks pulling sand boxes for the oil and gas industry, and the oil/gas workers speed on the rural roads and don’t get much separation from cyclists. I have a friend who was hit by a truck and was in a coma for 6 months, and still hasn’t fully
- this survey was a bit confusing. there were duplicate graphics on the “do I feel comfortable” section. the importance where I dragged the answer did not make it clear if the importance was how I decided to ride on a particular road.
- I have been cycling in mixed traffic for much of my life. I mostly ride on the road and generally complete 7000+ miles per year. I used to commute 20 miles round trip on mostly rural, high-speed roads with little to no shoulder. Now I work from home and most of my rides are for recreation/fitness, but still on rural, high-speed roads, with shoulder. Once per month, I a “century” ride where I look for different long-distance routes. I look for roads that offer good scenery for most of my rides, so the rides are about more than just fitness. I try to select roads that are in good condition and that have lower traffic volumes, though I accept higher volume roads when I am trying to connect a given route. Road maintenance matters because my average speed is 18-20 mph and there is little time to respond to roadway hazards and sometimes the only response is to move into a travel lane. I have been hit by motorists six times and safety is something I think about a lot. Some motorists pass too close to me and others put themselves in danger by moving into oncoming traffic where it is unwise to do so. I prefer drivers that slow down and pass with 3 or more feet of space. Hearing a driver’s engine slow makes me feel confident that they are looking out for my safety. One of my biggest safety concerns is drivers turning from one high speed road to another and cutting the corner to do so. It happens frequently and I was severely injured as a result on one occasion.
- The vast majority of bike riding I’ve done over my life has been on rural roads or on streets in the small city in which I live, in traffic going 35 mph or less. Adequate road shoulders are important for me. Most drivers keep the vehicle between the lines. (Of course, some don’t, and I know of individuals who have been struck and killed even riding within the road shoulders.) Traffic lanes in popular places such as national parks need to be wide enough to accommodate giant mirrors on giant pickups, and I’d very much prefer warning signs in those areas. I know I must be extra vigilant in areas with lots of driveways and car parking because most drivers are not looking for bicycles when they pull out. I love dedicated bike paths, but I know they are quite expensive to build; for me, an 8-foot shoulder feels just about as safe.
- For the interested but concerned cyclists, paved shoulders make all the distance in rural areas, especially in areas with vehicle traffic each direction. Often when sidewalks are available I’ll take those even if they are not a multi-use path.
- Rural areas tend not to have the planning/administrative capacity to implement cycling safety improvements. How can state or federal support improve this?
- Distracted drivers are a huge concern.
- We have few shoulders in our rural area. Our town recently put up signs, “Bicycles may take the full lane” which I really appreciate. It caused a kerfuffle on our town web page until it was explained to drivers: that we can, when needed, take the lane but otherwise shouldn’t be doing so, and how it helps cars be safer, too, when we can see dangers they can’t, such as risks to passing). We were already doing it but feels like the signs make us safer.
- Cyclists who don’t move into single file quickly enrage local drivers and I understand that anger; those cyclists are usually younger (and entitled) males.
recovered 2 years later. If I can’t find a multi-use path, I ride my mountain bike on the trails in the woods.
- Trails dedicated to nonmotorized travel is the ideal. Next best are public roadways with sufficient shoulders or dedicated bike lanes to promote cyclist safety.
- Most highways in my area have heavy truck traffic and high speeds. I must intentionally find a trail to ride my bike. My town is small enough that I can walk almost everywhere. I would love to see more trails separated from vehicles to provide recreational opportunities. I think all waterways should have a minimum 50 ft buffer with a walking/biking trail.
- Most rural roads in our area are two lanes with no shoulder. Some rural state highways now also have edge rumbles, which force cyclists farther into the traffic lane since there is no shoulder in most cases. Newer 4-lane rural roads typically have a 5-foot shoulder with a 1-foot-wide rumble strip separator. These are more comfortable, but traffic on these roads typically moves 65-70 mph, including 18-wheel heavy trucks, and the shoulders often have a lot of debris, so riding on them is decidedly uncomfortable, and our group avoids them. The ideal rural road for us is simply one that has good pavement but very little automotive traffic. Second-best is a moderately-traveled road with a usable (4-feet-wide or greater) shoulder.
- Do not sealcoat bike lanes or shoulders where bikes are present. Since this section of the pavement do not see vehicular traffic, the pavement does not deteriorate at the same level as the travel lanes. Sealcoats are unsafe for bicyclists and are a total waste of money for the poor taxpayer.
- I have been riding recreationally about 200 mi/month for over a year in rural areas around Athens, GA. There are typically no bike lanes. Rural drivers are nearly all courteous. It’s the very occasional exception of discourteous / aggressive drivers that make it dangerous. Rail to trail conversions is great but generally do not allow faster riding speeds favored by road bikers. Group riding is safest, and I’d organized informally over social media. Living in a rural area riding to shop or visit people is not practical.
- My cycling in rural areas has been relatively positive. My best times have been where there is little traffic with slower speed limits and wide shoulders. I have also encountered traffic that would rather not have you there and has attempted to push you off the road. So wide shoulders are probably one of the best assets.
- I look for those “no trucks” signs… not because there won’t be trucks, but because it means a thru road even a small extra pavement width makes a big difference. So does low traffic volume. I always wear a visibility vest. There have been numerous bike fatalities in my area.
- I am a “bike camp” graduate who has learned in sessions with very experienced riders and has who ridden in bike club pelotons and solo in many rural areas. I am an experienced vehicular cyclist who has biked 1000’s of miles on rural and suburban roads, less in urban areas, in many states. Choices and descriptions using the word “comfortable” that are often used in surveys like this, and the classifications such as “strong and fearless,” make it harder for me to choose because they fail to consider the need to be always alert, regardless of the situation. I feel being fearless is foolish, yet I ride “in traffic” and even at night when necessary. That said, I hope you are successful with your purposes, because I feel the rural road agencies in my area design “improvements” in their roads to maximize motor vehicle speed and traffic capacity volumes in an imbalanced way that comes at the expense of safety for all legal road users.
- I do not feel safe in a bicycle lane that is between moving traffic and parked vehicles because you would be inclined to dart into moving traffic if a parked car-door suddenly opens. I prefer the bicycling lanes to be next to the walking sidewalks.
- There are issues with biking lane connectivity in our area. Some roads have decent biking space/lanes, but then those roads connect to others that are not as safe.
- I’m 70 years old, ride my bike every day to work when there’s not snow on the ground. From spring through fall, I cycle on rural roads 2-3 times per week for 14 miles with a time under an hour. I train to go on offered sponsored long bike events (50 to 75 mile). In my area (Modoc County), few roads have paved shoulders. This factor alone reduces the number of potential cyclists because of this problem.
- Seeing cyclists on rural 20-foot-wide roads terrifies me. I need lots of space away from cars preferably where my speed is close to the car’s speed.
- I’d like to see more rural roads have more of a shoulder where more distance separation can be achieved between cyclists and motorists.
- I cycle on rural roads mostly and prefer roads with low volume of vehicles and trucks. I prefer rural roads with shoulders, but I cycle on ones with little if any shoulders. I also ride my bike in the city on bike/ped paths and on the streets. It is nice to have a dedicated lane for bicycles.
- I now live in Massachusetts, but lived in San Diego County, California for the last year. I noticed that almost uniformly, rural roads in California feel significantly more dangerous to cycle on due to higher speeds, poor cycling facilities, and aggressive driver behavior. For this to change, California needs to dispense with the 85% percentile rule and begin significantly lowering speed limits. Rural areas should also think about building some traffic calming features in rural roads and providing bicycle facilities where possible.
- Consider the Boulder County Transportation Master Plan and its network, multimodal, and connectivity-based vision for accessing work, services, and play on a rural, unincorporated roads and how that addresses the costs of safety and the opportunities of livability as well as transportation’s relation to our biggest challenges.
- I find dedicated trails boring and do not go to the destination I choose. But the recreation cyclist the lack of north–south facilities in Brevard County is long overdue. Finding bike lanes in Florida unmaintained and littered with debris and then they randomly ending of a facility forcing me into the flow of the traffic makes me adopt lane control methods of riding. Also find the A1A corridor in Brevard County dangerous and won’t use. To have a 3- to 4-foot bike lane and 8-foot car lanes does not provide the proper 3 feet of passing distance to me as a vulnerable user. Also, Highway 404 prioritizes car travel over vulnerable users…and seeing lots of car wrecks, speeding and killing sand hill cranes…and the wide “sidewalk” is annoying to ride when you run 100 psi tire. And the crossing over I-95 is very dangerous for even the most experienced cyclist…. FDOT needs to be ashamed of this project. And let’s not forget the drainage grates on US 404 that are not properly designed and fitted to allow a bike rider to safely traverse…
- Commuted for years in Boston in the 70s, took up mountain biking in Vermont, ride everyplace and on everything, prefer very long rides.
- Driver education and more traffic law enforcement
- Conscious, careful choice of road conditions, traffic density/speed breeds familiarity which breeds confidence and hence safety.
- My primary concerns are pavement quality and road width (could be travel lane width(s) or shoulder width). Somewhat less important are traffic volume and % of trucks. Assuming satisfactory pavement quality, I would prefer a wide road with heavy traffic over a narrow road with light or occasional traffic.
- Drivers who have little interest in the safety or welfare of cyclists and or knowledge of the state law regarding cyclist’s legal rights and practices are the most dangerous on rural roads. Fast service vehicles with trailers is another hazard. Little to no adherence to road signage or markings is another problem.
- my comments come from a fearless cyclist. very few of the options create a safe environment for non-skilled and fearless vulnerable road users.
- My experience of cycling in rural areas has primarily been around Roanoke, VA. Typical rural cycling routes in this area rarely include any cyclist-specific infrastructure, with signs being the most common infrastructure due to the presence of US Bike Route 76. Shoulders are rarely wide enough or consistent enough to be viable for cycling although the 2-foot shoulder on the route that I identified is often used due to the speed and volume of car traffic on that segment. The segment connects to several other cycling routes and is the subject of this blog post: https://www.bikingwithken.com/blog/the-bane-of-bradshaw/
- Concerns: Distracted drivers; Bottlenecks at bridges or overpasses; road drainage grate grids often spaced too far apart, or in wrong direction, thus tire safety hazard. Thank you!

- The four Geller categories are bogus because each of them combines two different characteristics which are not necessarily related. I am old, not a strong rider but I am fearless, because I am skillful. Enthused and confident? Many bicycling advocates are enthused, but not confident. Interested but concerned? many are concerned, but not interested (they always worry about my safety), and vice versa (they would ride if it were more convenient). No way, no how: this is a slang expression describing aversion but in fact there are people from whom there is no way, due to disability, and others for whom there is no how, due to inconvenience. By using the slang expression, Geller leaves out both important deterrents to bicycling.
- Also, the examples of road and path environments shown are clearly urban, not rural, and the ones with door zone bike lanes show bicyclists riding in the door zone bike lanes. What is that supposed to have to do with rural riding and what results are to be expected – that many people feel safe in fact what is a deadly unsafe situation?
- Ranking of environmental characteristics includes lane width but not number of lanes, presence of rideable shoulders or bike lanes, which would significantly affect the answer.
- Road width, maintenance, and speed
- I feel comfortable on most rural road, with caution. I never ride without a mirror or Garmin radar to keep track of traffic. I ride over 6,000 miles a year.
- I cycle only on rural roads or in a park. The roads have no extra width or bicycle lanes. I would like to identify one road near me with dedicated bike lanes. I would also like cars to slow down when overtaking bicyclists–don’t know if a law would help, or simple politeness.
- The first multi-choice “pick the image that you’re most comfortable with” question didn’t work on mobile.
- Left hand bike lanes (even protected lanes; right hand lanes too for that matter but to a slightly lesser extent) on one-way streets are a death trap, motorists virtually never look for cyclists when turning through those lanes.
- Three- to four-foot paved shoulders not including rumble strips are highly suitable. Please, no more super street concepts which create barriers to cyclists crossing highways. Such designs should include a means for cyclists to pass over or through the barriers which prevent motorists from making left turns at the point of street junction.
- The vehicle traffic has become very congested in our town. We have had rapid growth with slow infrastructure improvements especially in the way of pedestrian safety. I will not ride my bike on Huffine (US 191) in Bozeman, MT even though the shoulders are sufficiently wide, the vehicle traffic is not at all pedestrian friendly. Likewise, I will not drive downtown because the main street is already very congested with moving traffic and parked vehicles on both sides of the street leaving cyclists to ride with the vehicle traffic which is also not pedestrian friendly.
- 75 years old, cyclist for 25 years, average about 2000 miles/year (but declining over last 3-5 years). Have done several multi-day (up to 5) trips over the years.
- Engage local governmental groups and police to aide and assist with traffic design and controls. Engage all local bike groups and business to become advocates and offer ways to make changes that help bikers.
- Rural areas, including state parks and forests are being impacted by ebikes. The rate of posted speed is maybe 20 mph now with peddle assists. Ebikers tend to bike as if they were in their car because they are not used to being a biker and do not know about/use common biking courtesy.
- Granite curbs along roadways and bike lanes are a deadly barrier that prevents cyclists from veering aways from dangerous traffic. Curbs also prevent a cyclist to have option to avoid obstacles and hazards such as glass and potholes in the bike lane or edge of roadway.
- I bike in cities across the country, I bike on mountain trails and in winter. I bike during busy commuting hours. Granite curbs are a guaranteed high-risk when biking near traffic. A cyclist’s life is between traffic and a granite curb. There is no escape option.
- Driver education about cycling is very important.
- I did not like any of the “rural road” examples given. I found few to none of them ideal for rural cycling. Narrow roads, built for lower speeds and low traffic volumes are the most ideal, whether they be paved or not.
- Also, these questions should have been written by someone whose first language is ENGLISH!
- I don’t think the survey shows the most desirable roads my friends and I tend to bike. I am fortunate to live in an area with lots of rural roads. The go-to road is one that has very light car traffic most don’t have shoulders. On roads with heavier motor vehicle traffic, I look for shoulders. There are many roads with heavy motor vehicle traffic and wide shoulders. Unfortunately, many of the roads have poorly maintained shoulders and debris creep forcing me out into the traffic lanes. And, then there’s rumble strips! Poorly placed edge line rumble strips can make a rideable road unrideable (i.e. local road 743 between Hershey and Elizabethtown) Add, turn lanes that end shoulders with no consideration for bikers (or walkers). What needs to be changed is a mindset among traffic planners that their other road users besides motor vehicles and their needs must be considered in ALL
- Wider shoulders that are maintained with no rumble strip, or extended shoulders where there is a rumble strip. Cyclists need accessible roads where there are natural barriers such as rivers and bridges that accommodate cyclists.
- Having a shoulder with a white line is so important for cyclists!
- I feel strongly that the goal should be like the proven design in Europe including paved paths separated from the road. And where that’s not possible, then paved shoulder at least 3ft wide.
- I found this survey rather odd. I could not tell if there were edge line rumbles in a couple of the photos. If yes, then this would ruin the safety of biking on these shoulders. Too often in PA, edge line rumbles of various widths and depths were installed on state roads, often more rural. Penn DOT is supposed not to do this anymore but mistakes are still made such as in Lebanon County PA.
- Cycling tourism especially necessitates safer rural roads because while we locals know the roads and what to expect re loss of shoulder or bad rumbles, or upcoming lack of visibility of oncoming traffic, visitors will not be prepared. We have biked considerably including from our home to Key West. Going through roads in a state like Georgia with logging trucks and no shoulders demanded our “endurance” to get through another bad section of Adventure Cycling route.
Your reasons why I bike do not include fitness/health. Leisure doesn’t suffice. We have also biked in New Zealand, Europe, throughout the United States and often while conditions are poor re the roads, motorists’ awareness and appreciation of cyclists who need to share the roads is most important. Acceptance of cyclists by motorists who have little understanding of what is required for safe cycling can make a big difference no matter the conditions of the roads in rural areas. Read the article, BROKEN, Bicycling, January 2008 issue. RAAM participants, if that race is still ongoing, could provide lots of information. - Having completed a month-long, self-contained tour of the Olympic Peninsula and the entire Pacific Coast in Sep/Oct and a two-week self-contained tour of the central California valley and coast I’ve spent a lot of hours on rural highways and roads this year especially. Oddly enough, the “close calls” I had with motor vehicles was not with logging trucks or semi-truck/trailer rigs, it was with rental RV drivers who have no idea how big a vehicle they are driving. Also, drivers who don’t know that they need to obey the “3 foot” law when passing bicyclists in Washington, Oregon and California. All in all, road conditions are the least of my worries. Lack of driver education and driver courtesy are a more pressing concern. Rather than improve highway shoulders, striping, etc. I’d like to see money spent on educating drivers about bicycle safety.
- I’ve found the road doesn’t matter so much as the drivers themselves. Many drivers are distracted, some are intentionally aggressive and buzz cyclists- in those cases it doesn’t matter how much shoulder you might have. There needs to be better education for drivers about how to interact with cyclists, education about the laws and rights that cyclists have, and strong consequences/enforcement for drivers who act aggressively toward cyclists. There is a different area of my state with “3 feet, it’s the law” billboards and I would love for those to be everywhere.
road decisions. PennDOT verbalizes all the right things but when construction occurs it’s usually the same as in the past. There are wins for active transportation users but usually it’s because of pressure. Active user accommodations should be automatic.
- I find it odd that the various scenarios in which you want me to say how comfortable I would be riding my bike (the Streetmix pictures) are not rural at all but instead are multilane roads with on-street parking and sidewalks. None of the actual pictures you had me choose between were remotely similar. Having been riding thousands of miles per years for 40 years, I find that the width of usable shoulder, the existence of a “fog line” at the right side of the traffic lane(s), and the amount of motor vehicle traffic are the most important variables. But I must add that I avoid riding in the dark, fog, snow, or heavy rain almost entirely.
- Roads with double yellow lines tell me that motor vehicles will be going fast. Speed differential makes me uncomfortable. (I especially hate double yellow lines in NEIGHBORHOOD STREETS, whether rural, suburban, or urban.) I tend to avoid rural bicycling because of speed differentials. Now that distracted driving is prevalent, even a bike lane or shoulder (i.e. no vertical barrier or landscaped space) does not increase my comfort much on a high-speed road.
- Lifelong cyclist. More comfortable than most in traffic but I do have a family and have lost friends to car-bicycle accidents, so I do think about it. I ride with lights in the daytime. Prefer rural low traffic roads and enjoy a shoulder when available.
- Unfortunately, as a female, the dangers are both from distracted drivers and heckling men. Rarely are there paved shoulders that provide enough safety from the former. And only in a group do I feel personally safe. Rail to trail options are my go-to. Grateful for the Silver Comet Trail. Need safer options.
- I like riding in rural areas. Generally, the roads do not have space for cyclists. There is limited signage on rural roads pertaining to cyclists. Its dangerous on rural roads due to the high speed of motorists. When riding solo on rural roads, I am vulnerable to harassment. Thanks for asking.
- I recently retired and moved to a rural area. I am a skilled rider and local cycling instructor. My biggest issue so far is my county (Butler) has no animal leash law so I have had some terrifying encounters with loose dogs. The deputy I spoke to said unless I was injured or killed there was nothing they could do. These animals go into the public road to attack me, impeding my legal right to use the road to travel on. I must choose lesser used roads to avoid the high speed, insanely dangerous two-lane paved roads that have high speed limits and no shoulder and drivers who are distracted and/or impaired.
- In my preferred areas of cycling rural Georgia, one of my biggest concerns is the posted speed is often 55 mph. Much too fast.
- Roads with 50+ mph speed limits and lots of traffic are the worst for cycling. Rural roads with low traffic and no shoulder are fine for cycling. Suburban roads with 35 mph speed limit and multiple lanes are fine if there is enough traffic to keep the speed around 35 mph. Rural roads with the occasional pothole and very light traffic are fine for cycling. Two lane roads with a rideable shoulder (that are free of debris, free of potholes) with a speed limit below 50 mph are fine.
- I have been riding for over 45 years. I have completed multiple cross-country loaded touring cycle camping trips. I average 4k - 5k miles per year.
- Low speed low volume roads are best. But narrow lane width helps on other conditions.
- I’ve ridden across the United States on my bicycle (Maine to California) and found dedicated bike paths to be the most enjoyable. Especially, rail trails since they are usually providing direct access to real destinations. Bike paths that add several miles to a trip vs
- We’ll never be able to make most roads comfortable to the casual bicyclist. There will only every be a small segment of the population who are willing or who desire to ride on paved roads with vehicular traffic. The most comfortable rural roads for me are low volume dirt/gravel roads.
- I do cycle now on rural roads, and I live in a rural area. I would cycle a lot more on rural roads if we made significant changes to how we approach infrastructure.
- Having also biked in other countries, I am aware of what more functional options for cycling in rural areas could look like. Most people in the United States can’t even imagine truly reasonable conditions. We need more parallel, low-traffic/low-stress routes. That does not just mean separated trails or side paths. Nor does it just happen (in other countries) without an effort. But it does mean recalibrating motor vehicle transportation to reduce the number of through routes for cars, while maintaining and increasing through-routes for bikes, pedestrians, transit, and emergency vehicles.
- Motor vehicles should be used for high-speed, long-distance travel on separated facilities and at their destinations they should shift to low-speed, shared facilities. The idea that we should be willing to ride a bike on a high-speed road if the pavement is simply wider and smoother is just perpetuating old, bad ideas (and reflects the limited range of experience of US cyclists and what they are willing to put up with). If there is no alternative through route that would allow only the motor vehicles seeking a particular destination to divert inward at that point, then ALL motor vehicles should be slowed to 20mph or below (not a marked 20mph that people just drive 35 in). This would be relevant in all small towns or villages that currently have rural highways/state roads running through them. It would also be relevant within 5 miles of any such residential/commercial core.
- In addition to these recommendations for any slightly more populated areas within rural regions, there should also be adjustments to the standard road design practice beyond 5 miles from settled sites. Rural roads through less populated areas should for the most part be served by separated cycle facilities even if all the infrastructure still operates within the existing roadway footprint. In other words, rural motor vehicle roads should not be widened in the name of providing better accommodation for cycling. This winds up with a rural version of induced demand, whereby the road is improved, and the vehicle use
car travel may be enjoyable for leisure but won’t do much to reduce reliance on cars. I also found driver experience and respect for cyclists to be a more important factor than the actual infrastructure in many cases. For example, I traveled through Kansas almost exclusively via US 36, which did not have great clearances for cycling, however, I found drivers to be more attentive and respectful of my presence on the road than anywhere else I have ever ridden. While I took great care to watch my back and be cautious to stay safe, I found the stretch quite enjoyable. Lower speed limits can help, but often make little difference if drivers think they are too low, they will often drive faster and more recklessly, especially when they encounter cyclists that they may see as just another hindrance. Careful placement of rumble strips is another important consideration. To allow for safe cycling, there needs to be enough space to the right of the strip for safe biking, without having to frequently cross the strip. There should be breaks in the strip to allow for safe crossing for bikes as well. In areas with few options for providing adequate clearance, such as tunnels, I found buttons that activate a signal alerting drivers of the presence of cyclists do help.
- If this (narrowed roadways, without forgiving shoulders) is seen as too dangerous for drivers, vehicle speeds must be reduced to safe levels through automation and governors. The governors could either kick in uniformly to maintain reasonable speeds for the conditions/location or they could include sensors and only reduce speeds in the presence of other vehicles or cyclists. In either case, if it is thought that such a system would result in dangerous decelerations of motor vehicles, that just serves to prove the point that drivers are regularly going too fast for anyone else’s safety but their own.
- Bicycle lanes with adequate width should be the norm. Cars and cyclist need to safely coexist.
- Even more than the road conditions, amount of vehicular traffic, and weather, the most concerning aspect of bicycling is other bicyclists not warning they are passing, passing on the right, going through STOP signs and through the red interval of the traffic signal.
- wider berms or bicycle lanes would help provide a safer environment for those who are considering road riding, more trails, and better conditions for those who are not and prefer the safety of being away from roads and vehicles.
- There must be destinations to cycle to and bike parking at the destination.
- Daily use urban/suburban. Recreation riding dirt road and two track.
- Speed is the biggest issue for me. I appreciate when a driver gives me space when overtaking, but if they approach at a high speed, pass at a high speed, or accelerate while passing, it feels very unsafe. High speeds indicate to me that someone values their travel time more than my life and that I am inconveniencing them with my bicycling. Though cycling in rural areas is perceived to be unpopular, drivers need to be aware of cyclists’ rights in driver education and reminded of this at every chance.
- The biggest stressor in my cycling experience are aggressive drivers who think that having a car tire touch the middle yellow lines of lanes is a moving vehicle violation. I’ve had people tell me that they can’t move over in their lane b/c they don’t want to risk a ticket—so instead, they risk hitting cyclists. Truck traffic in rural areas is especially dangerous. I think that making roads safer for bicycles involves changing the mindset of drivers.
- Make the survey mobile friendly.
- My biggest concerns are the speed of cars and proximity of cyclists to cars with nothing protecting the cyclists. There are areas where I live that have bike lanes, but I avoid them because the cars going by are too fast, and I feel unsafe. A painted line does not protect cyclists. There are areas where I bike where the bike lane is right next to parked vehicles. I must be careful biking past them because I have cars trying to pass on my left, but I have people getting out of their cars on my right. It doesn’t make much sense.
- In the more rural areas outside of town, cars speed with no concern for the speed limit. A speed limit sign does not determine how fast cars go; the design of the street does.
- I am thankful that I live in a state that allows cyclists to bike on the sidewalk. If I didn’t, there would be no way I would be cycling on most of the streets, and I live in an area that’s considered bicycle friendly, but there are so many areas that have no sidewalks, so I typically avoid those spots if the cars are too fast.
- Hello and thanks for running this survey.
ratchets up to meet the same BLTS as previously. Instead of an increase in traffic volume however, it would likely translate into increased speeds.
- My husband and I bike tour a lot, and we ride in all conditions presented. Often, it’s not a matter of whether I like a particular road, often it’s that I don’t have a choice to “like” or “not like” a type of road because of the route chosen. In a way, I have to “like” or “accept” whatever surface I’m on to navigate it the best I can. So it is with that mindset that I took this survey.
- The worst conditions encountered were South Carolina rumble strips in the shoulder, often forcing us into traffic. Rumble strips likely save motorists lives but put cyclists in danger.
- I am currently not a cyclist, but part of my job is advocating for safer bicycle routes. Our county has a master trails plan that connects all the towns with a multi-use bicycle trails system. Some of the plan includes off road trails. I would be more likely to ride if there were off road trails or a barrier between the cyclists and motorists.
- Traffic volume is the most important comfort factor for me when cycling on rural roads. If there is a low volume of cars/trucks, then my comfort on rural roads is high. Speed is next for me. A low volume road with a 55mph speed limit is going to be lower comfort for me than a medium volume road with a 35mph speed limit.
- On rural roads, shoulders don’t make much of a difference to me unless the speeds are high, 55mph+. I generally ride in the middle to middle/right part of the lane to be visible to cars that come up behind me on rural roads.
- I almost always ride with organized groups on very well-established bike routes. i.e., routes that are very often used by organized groups.
- I would appreciate wider or any paved shoulders on roads in general within reason especially when a road is being improved and the space is available. I believe it is very important for law enforcement to monitor cyclist’s adherence to traffic laws.
- The Farm to Market roads in Texas were ideal. There was a wide and well-maintained shoulder so that slow traffic could pull over and let other traffic by. For example, a farmer hauling a load of cattle. They made for excellent riding.
- Separate riders and drivers. It’s the best way to get people feeling safe. Alternatively, slow drivers down with physical traffic calming. Speeding vehicles are extremely threatening.
- Biggest issue in rural areas is shoulder debris.
- Best part of rural roads is drivers have freedom to avoid you (shift lanes early and clearly to pass)
- I feel most comfortable when biking on well-maintained wide shoulders beside low-volume rural roads.
- Ride legally visibly and predictably. Unprotected bike lanes give many a false sense of security.
- Education for motorists.
- We do travel quite a bit with our bikes. We enjoy riding in states that have a minimum passing distance, like 3-4 ft; states that have a bottle bill (less litter), roads with less traffic. Also, another observation is that police will rarely ticket drivers for hitting or harassing cyclists. We’ve had incidents where the driver cut us off, even hit my wife, and the driver was not ticketed even though they were clearly in the wrong. Better enforcement of existing laws would help. And I would add to that enforcement of traffic laws against cyclists also, who run red lights & stop signs, and ride on the wrong side of the road.
- Safety is always an issue. From cars targeting you to people simply unaware of what’s around them causing dangerous situations. For me, the best scenario would be protected paths that are wide enough for all users and that passing is safer for all.
- I cycle 4,000-7,500 miles per year. In Texas cycling is on the road/street with vehicles to give cyclists at least 3 feet clearance. On nearly every ride a vehicle comes within a foot of my handlebars. In some cases, I have been able to ask the driver why. It is intentional and they find fault with me being there even though there are street signs cyclist may use the full lane. This is on four lane (two lanes in each direction) suburban streets with speed limits no faster than 40 MPH. With two lanes in each direction, I ride in the right hand third of the right lane. If I ride too far to the right, drivers will attempt to drive between me and cars in the adjacent lane. There is a total lack of enforcement of the traffic laws affecting cycling, even when there has been physical harm to the cyclist.
- I use both a rear-view mirror AND a radar unit to remain aware of traffic and other cyclists. It helps to have these. They are useful no matter how safe the designated path is. That said, the radar is the MOST important addition I’ve made in the last 30 years for overall safety.
- Laws that no one follows, like you must give a full lane to pass a bike, in our area just to dangerous to practice that. Roads are very light on traffic but narrow. I would rather have a 3-foot rule that was enforced.
- I live in rural Appalachia and have bicycled through most of the northern United States. It is often impossible to get from one place to another via bike without risking your life. I have family in the Netherlands that live auto free and bike for all their needs. When I visit I do the same, taking my granddaughter to school on a bike, grocery shopping, and traveling within the country on a bike. We need to emulate their bike infrastructure. We have laws that require highway projects utilizing federal funds to commit a certain percentage to pedestrian and bike infrastructure. In Ohio most of the funds have gone to wealthy communities even when the project that generated the funds was through a poorer community. Poor communities where people often have no options other than biking or walking have the worst infrastructure for those activities.
- I ride on the 3-ft margin in 95% of the time. I take the lane when need be. Distance rider average per year of 7000. Paved trails are fun. No sand or gravel only paved roads. Never sidewalks, children, dogs, and adults are not looking for a cyclist going 22mph. FL law requires drivers to pass minimum 3 ft. Not enforced or done by 80% of FL drivers. Worst drivers in the nation. Close call several times with RV having their stairs down. Training now for the southern tier ride in March 2023 across the southern eight states of the United States.
- I would like to see more regional trail systems and collaborative support for their maintenance. Minneapolis has a great system of off-road trails used for commuting purposes. the state of Oregon has some land use limitations, but it really comes down to funding and staffing for maintenance including snow removal. This is my biggest priority to how we could make rural bicycling safer and more accessible.
- I enjoy riding in rural areas, although I always ride in a group of two or more and stay on the defensive and always plan for a situation when I need to get off the road. I am always aware of possible road conditions (gravel, pot holes, etc.), and the following which occur more than I can count—drivers who pass without giving riders 3 feet, drivers passing riders when there is a no passing or double no passing line, drivers who pass riders on a
- I like a white line with about 18 inches of bike lane or with signage saying bicycle has full use of lane.
- Having wide shoulders with no parked cars is important, but keeping the shoulders swept clean is important also. Wide shoulders are useless if they are littered with rocks and debris.
- I feel at ease when there is sufficient width to the road so that both cyclists and motorists do not compete for space. Following that, having sufficient width bike lanes on both sides of the road is ideal. Having barriers between cyclists and motorists is even better. Barring that, educating both cyclists and motorists on how to best contend with each other has to be improved.
- I’ve been biking for more than 55 years and have been taking long-distance bicycle trips for more than 50 years. Though I also drive a car, I have been bicycling almost daily for decades. Though I typically avoid biking at night or in snow and ice, I enjoy biking in almost any other condition. My favorite rides are with my wife and/or friends on quiet country roads in the United States or abroad. My wife and I biked across the United States on our tandem, mostly on quiet country roads. It was fabulous!
- I do not like shared bike/pedestrian pathways- unsafe w/dogs, toddlers, etc. I also do not like roadway bike paths that have the parked cars to the left of bike travel- unsafe for the cars & bicyclists! Roadway “shards” are also unsafe if a cyclist must go around an obstacle or pothole in the bike riding pathway/shoulder. We NEED good shoulder/ride ways, clearly lined AND paved.
- 1-better speed enforcement 2-better bike lane enforcement 3-shoulders everywhere
- Wide shoulders kept free of debris are always appreciated. Traffic laws should be part of driver education and enforced, particularly 3-foot laws. Police should be taught how to properly investigate bike/car accidents and how to apply the laws.
- Speed limit enforcement- proper rumble strip placement- pull offs to let traffic pass.
- 3 to 4’ shoulders for roads 45mph and above. Rumble strips should only be 4” wide, included in the width of the fog line, gaps (10’ min) along length to allow transitioning to traffic lane from shoulder at speed, not more than 1” deep. More “Share the Road” signs, maybe with QR codes referencing state statues to instruct bikers and drivers alike.
- It is important to make sure the cyclist can be seen and the cyclist can see traffic easily. At times the bike paths make it very difficult for the cyclist to be able to see traffic on the left side thus being at risk from getting cutoff or hit by a car turning right. Also, law enforcement needs to step up and enforce the rules for both cyclists and automobiles. It is not uncommon when the cyclist is hit the vehicle driver is NOT cited. I think most law enforcement has the opinion make the roads safe for a cyclist is not worth the time and effort.
- I have reduced the number of casual or work trips, because of no shoulder on my rural road. I have been clipped by a vehicles mirror. I only use sections of the highway that have a shoulder. This tends to be in the city limits of the tiny town nearest me. The road
curve when they have no clue if a car is approaching from other directions, drivers who pass riders on a hill and have no clue if a car is approaching. A friend and I were almost taken out last summer by a car passing on a hill and ignoring the no passing line markings—a car was coming the other direction and we bailed off the shoulder. All I can say is guardian angel—blessing we were not hit.
- Dogs are a big problem in rural areas.
- I bike to work and I find bike paths and/or dedicated bike lanes really make a difference. When I cycle in rural areas, I rarely ride state routes and stick to backroads or dirt roads due to lower traffic volume.
- separated bike lanes are the safest.
- I used to commute to work on my island and visit my Mom in Seattle, taking the ferry, all by bicycle. I used to ride in any weather but snow and ice. Now retired I am more selective on when and where I ride but still run many errands via bike.
- Since there are no allowances for cyclists on 99% of the roads, I ride on the road close to the white line. If there were a 4 ft Burm to bike that would allow automobiles to pass however do not like the fact, they would pass at 55 mph. More signs to advise motorists that bikes are legal to ride and passing cyclists need to be 4 ft. More education is needed for them to slow down, move to the other lane when clear with plenty of space between them and cyclist.
- Include the importance of all the rules of the road regarding cyclist and drivers sharing the road in every Motor Vehicle Licensing Training manual.
- Small shoulders with rumble strips are a big problem in many areas, especially on roads with moderate/high traffic volume.
- I’ve changed from mostly road biking to gravel. Safer overall to ride on empty rural roads for long hauls. In town I try to ride on residential roads mostly and avoid busier roads as much as possible. We live in a college town and need better bike infrastructure, e.g., protected lanes not just sharrows!
- As a female, I do not ride solo unless I’m comfortable with the road conditions and the type of cyclists will be there. I have concerns with motorists and the likelihood of cyclists helping if there is a problem.
- Condition of bike lanes. Often dirty, riddled with debris. Sometimes no bike lane.
- My club has mapped many rides on great roads in our rural area of SE Ohio on Ride with GPS. Check out rides starting with BBC in Ohio.
- I’ve commuted from a rural residence to work in a small city for over 20 years. Typical issues are related to mixing with traffic in other modes of travel. . . all it takes is one wrong move on my part, one driver mistake, or an inattentive pedestrian to cause a problem. I tend to ride early or late in the word day to miss the higher peak traffic volumes. I will also take streets with less vehicle traffic, compared to bike lanes on streets with more traffic and on-street parking. Bike commuting is tough with the lack of separated cycling infrastructure . . . being too slow when mixing with vehicles on the street and too fast for mixing with pedestrians on sidewalks and pathways. Riding in a predictable way, thinking ahead, being visible, and a maintaining patience have kept me and others safe over the years. My ride to work is a quiet time for prayer and makes me feel more human, a part of the world around me. I’m able to greet other riders, pedestrians, and wave at the occasional friendly driver. I do drive when needed and feel more rushed on those days. I think it’s common to be late when you drive, so it makes you in a rush as soon as you start driving. Even minor delays are an annoyance. This is something I can feel when riding a bicycle, but I usually plan to leave enough time to get to my destination on schedule. It also feels good to not get stuck in traffic or a long line at
has only gotten busier, which has significantly reduced the number of my trips. It is rare to see a cyclist on the roadway today, because of the safety factor.
- For cycling to be safe it needs to be the whole system. Having one road that is safe but accessible only by dangerous routes is not very effective.
- For micro mobility to work the whole network of routes needs to be built out, just as we did for cars.
- 10 pedestrians and cyclists will be killed today in the United States by automobile drivers (not the cars, the drivers of the cars). What you do is important.
- Most frustrating are rural roads where infrastructure (space, breakdown lanes) comes and goes every so often. Local govt wants to encourage cycling, but these types of roads are scary for all involved. (Drivers and cyclists)
- In addition to commuting by bicycle daily in six different states, I have traveled over 7500 miles by bicycle in over 20 states and five countries (including a 4,000-mile trip across the United States and a 1,000-mile trip down the west coast), worked in a bike shop, and currently work in the cycling industry.
- The older I get, the bigger cars get, and the more vicious drivers get, the more I look for ways to move away from the United States to a country where it’s less deadly to bike. I wish the United States would regulate car size, regulate the speed at which cars are capable of driving, and fund fully separated and protected bicycle infrastructure.
- I found that the questions in this survey tended toward assuming that rural cycling is mostly for leisure. there are many people living in rural areas of this country without cars.
- I prefer to cycle on rural two-lane county or township roads, preferably with a berm, pavement in good condition, and low traffic. I often must ride on streets or highways to get to the rural roads. I personally do not feel safe riding on city streets, even though friends I ride with often ride city streets. I try to avoid riding on two-lane highways where the speed is 45 mph or greater unless there is a wide berm. Some favorite rural roads have become very uncomfortable to ride after the county resurfaced the road with chip and seal and left a very rough surface. In other cases, the chip and seal were fine as soon as the loose gravel was gone. I do not understand why some roads are left with such a rough, bone-jarring surface.
- The Adventure Cycling Association maps of the Northern Tier Route should not be sold. It is super dangerous and some of the map sections have not been updated since 2017. They should not be allowed to sell such outdated maps. Their maps and routes should be updated every year and stop selling outdated dangerous routes.
- It’s been proven that most motor vehicle operators “don’t really see” anything other than other four-wheeled vehicles. Being avid cyclists and motorbike riders, my brother and I ride hyper-defensively as though nobody sees us. We also wear bright colored clothing and have lights. He bicycle commutes to work a little less than I do but has to ride more at rush hour and has been hit twice it 2yrs. We’ve also had stopped vehicles pull out right in from of us even after making eye contact.
- Heavy enforcement of leash laws. Heavy enforcement of accidents involving aggressive redneck drivers who hate cyclists.
a traffic light. I will ride occasionally out of my way to avoid traffic, for a change of scenery, or to use separated trails/pathways. But with a family, I have less available time to take side-trips. Cycling is a convenient way to fit a moderate amount of exercise into my routine. And I’ve saved thousands of dollars in our gas budget over the years, reducing wear and tear on the car, using that mileage for longer trips where a vehicle is more efficient than around town.
- a major issue is unenforced and unmonitored speeds on rural and urban roadways that have evolved from the COVID period, when law enforcement were reluctant to stop motorists and the traffic was significantly reduced so motorists could exceed speed limits by 20 to 30 mph (compared to about 10 or 15). So now on a road that used to be reasonable even in heavier traffic (with berms) was ok can now be dangerous since in a 50mph zone you will now see auto traffic traveling at 70 or even 80 mph—and the math on spotting an oncoming car at high speeds has gone from many seconds or a minute to much less (a cyclist can see no cars coming, look up and see a high-speed car that simply was not there a few seconds ago—no time to react!)
- I have been an avid cyclist for over 20 years. In 2014 my husband and I rode bikes across the United States. I no longer think that I could do that safely given the current driving trends. This year, In May, I had a friend on a rural road killed by a distracted driver. She was experienced and training for a race in Italy (Teresa Rose). I no longer am interested in riding on the rural roads. I have done some cycling on gravel roads, but believe the paved roads shared by vehicles are no longer safe. I have many friends who continue to ride on the paved roads and am fearful for their safety. I will no longer ride on the roads and am thinking of selling my road bicycle. Protected lanes with barriers are the only option for improved safety of road cyclists.
- trails are the best—wish they were everywhere.
- Not a big fan of drivers not slowing down when passing or meeting. Especially on rural roads with loose gravel.
- There are limited shoulders, no cyclist signs, few if any bike lanes, city talks a good line but does little to encourage biking.
- I’m most uncomfortable cycling up a steep hill, where the “shoulder” disappears when the road curves make it difficult to see traffic in either direction.
- An adequate shoulder goes a long way toward making a rural road ride more comfortable. Absent that, then very low traffic volume helps. Otherwise, I’ll try to avoid a road that has decent volume and no shoulder.
- We have much experience riding bicycles in Europe. Their cycling infrastructure is years ahead of what is found in the United States. Netherlands uses roundabouts extensively and incorporates cycle paths to ensure riders can safely navigate through intersections. In addition, they use underpasses and overpasses for pedestrians and cyclists to ensure safe crossing of busy roads. It also benefits drivers! In Germany, we would challenge you to pick two towns randomly. More than likely there is a bike path connecting the two towns. The United States needs more rural dedicated bike paths!
- I really like low-traffic and gravel roads in rural areas, but since I live in an urban area, these are a novelty and not roads I use for transportation. While bike is my primary transportation method, my rides in rural areas are almost always for recreation, so I don’t mind some “more challenging” conditions (hills, gravel, no lighting, etc.), though safety is still a priority.
- I am a confident and experienced rider, and I feel safest riding in protected bike lanes or on low speed, low-traffic streets. l ride mostly for commuting to work and running errands, and I ride both my own classic pedal bike and bike share ebikes because my city is very hilly. I choose to ride because biking helps me know my city (and my neighbors) more intimately than driving isolated in a car, biking helps me save money on gas and
- The worst parts of biking in my city are the drivers. Giant SUVs and pickup trucks, speeding, running red lights, and using street parking areas to pass on the right all put me and other road users in mortal danger. “Awareness” campaigns have been proven ineffective at changing behavior. I wish the NHTSA and the EPA would limit vehicle size, and the DOTs focus their time and budgets on building safer, slower streets that prioritize people who walk, bike, or take transit.
- Rumble strips before stop signs can cause cyclists to crash Rumble strips along highway shoulders can cause cyclists to crash.
- Most drivers treat cyclists politely and are careful around them. A few are very aggressive and even threatening toward cyclists. These people are a hazard to vulnerable road users.
- The more shoulders the better! And please me rumble strips in the shoulders.
- Better driver education. Most issues are either with drivers passing dangerously, either not allowing sufficient passing room, or passing against oncoming traffic.
- A lot of these questions either show non-rural conditions or non-rural scenarios. My rural rides in Illinois are usually on unmarked narrow roads with a 55mph speed limit. The traffic density is so low that the risk is near zero. Conversely, I used to ride on the shoulders of interstates in the desolate areas of Arizona (i.e. on I-8 near Yuma). The traffic density was still very low, and the shoulder was wide, so no problem. Before I retired, I commuted for 17 years on a narrow road with a 55mph limit and a fair bit of traffic. That was a higher risk, and a helmet mirror, good lighting, and vigilance were important to survival.
- My biggest concern is distracted vehicle drivers. I do not like vehicles with heavily tinted windows as cannot see if the driver sees me. 99 percent of drivers are very courteous the one percent who are not most likely have issues with someone else and just focus it on the cyclist. I also feel that there are some cyclists who are not courteous and piss off vehicles causing drivers to not like all cyclists.
- I do ride on County roads with moderate traffic and gravel shoulder. Work to avoid busier times. Would prefer a wide paved shoulder at a minimum. If I interpreted the scenes presented above, several have parked cars, concern is seeing doors opening.
- These questions didn’t get at the nuance of cycling regularly in actual rural areas, and very few of the photos look like where I live and bike. It also didn’t allow for changes in answers for type of bike or passengers or type of trip. E.g., I have a very different risk tolerance when I’m biking by myself vs with a kiddo in tow or if he’s biking by himself. For the latter, I’d need fully separated bike lanes for the whole route. We have poor biking infrastructure in my town, and essentially nothing between towns. If there were separated bike paths between towns, I’d likely get an ebike and significantly reduce car trips to visit friends, do other errands, etc. None of your photos suggested grade separated bike paths.
- Also, please remember that “bike infrastructure” is really car infrastructure.
- Winter path maintenance–or lack thereof –is a major problem. Assuming there is a path, of course.
- The biggest issue in rural areas is the hostility towards cyclists. It often seems like a culture war out there if you’re a cyclist, even on roads with wide shoulders.
other vehicle expenses, reduces my negative impact on our environment, and I enjoy the challenge of grocery shopping on my bike or pedaling in my office attire.
- I live in a rural community with state highways and roads running through towns. The areas are so car-centric that any talk of even trying to start a bike-share program is met with more concerns about the car traffic flow than the biker’s safety. I’m not a cyclist but a community advocate. I have been involved for several years with a community interested in a bike share and issues include where to place bikes due to high traffic state roads in the community. There are very few traffic calming measures taken.
- Rumble strips are also a problem when they are on the white line.
- Most of the time biking on a rural area is okay b/c there isn’t a lot of traffic but the traffic you do encounter will be ignorant assholes that for some reason get really offended that you are biking even though you aren’t bothering them.
- In a group it is okay, and we’ve learned the roads and areas we can go
- In the San Francisco East Bay, there is much rural area intertwined with suburban and even urban areas in proximity, and highways and roads throughout. The biggest problem is many rural roads see high traffic and are highway on/off ramps or are used as highway bypass when the highways are congested. This results in many car drivers driving too fast and aggressively on what would elsewhere be sleepy rural roads. Provisions for bike lanes are making some progress but it’s far from adequate, cars still rule here.
- In the more developed areas, there’s an urban-suburban mix in many places, and the infrastructure is old and inadequate, car-centric. Municipalities have attempted to ameliorate and add bike safety features, but they’re mostly band-aids, and what needs to be done is a rethink of the pedestrian/bike/transit/car mixed use, with segregation like they do in the Netherlands. For examples, see the Not Just Bikes channel on YouTube.
- When I’ve lived in urban or suburban areas and work within a 35-minute ride to work, I prefer to bike. I tend to bike to work more when my work hours can get me at least one direction in daylight and will make use of sidewalks when they have ramps at corners if there aren’t safer routes. When living in urban/suburban areas I also aim to do errands/grocery shop/go out for dinner by bike. I specifically selected a mountain bike while living in New England as there is so often grit on the roads long into warm weather, adding to potholes, ice, etc. Having it outfitted with multiple rechargeable lights and panniers has made cycling more practical and safer. Despite being mansplained to (yeah, this has happened many times over the years in many cities and states!) about how heavy my bike it by male for-speed cyclists, I’m delighted that I get more options out of my bike! I’ve had the luxury of being able to arrive sweaty (ok, I don’t sweat too much) and with “bad hair” for work– those two things have impacted others, in particular women and those with middle- to high-paying jobs. When I’ve lived and worked in rural areas, I have biked primarily for fun/exercise on a day off. What would make it better? Dedicated paved paths are critical (preferable permeable pavement as part of why I cycle is environmental. Well-maintained tightly packed gravel or dirt is next best)- riding with cars, even if divided by lightweight barriers, is hazardous! Paths for cyclists are ok when shared by walkers/runners/dog walkers if they aren’t crowded. For high-commute areas, lighting and lock spots are important; too much light or light after 10 pm/midnight is not good for the wildlife and causes light pollution, and too much vegetation down at bike height can sometimes be a hazard (I understand others, especially women and BIPOC folks have commented to me that they are afraid in urban areas of being grabbed when there are “hiding spots.” I have only been on the lookout for whips from bushes I pass,
- I prefer low-volume traffic or a wide-shoulder or dedicated bike path.
- Most motorists are very friendly and give bicyclists enough room (3 ft+) when passing. We wave at passing automobiles, give farm & heavy construction vehicles the road when they pass. We try to apply the golden rule. Cyclists and pedestrians need education too, (some are rude) on how to walk and ride on roadways. Police are more receptive than years ago.
- I live in a rural setting and avoid city cycling unless necessary. While rural roads have their time-worn, structurally neglected issues (potholes, chipped shoulders, no cell service), the real issue are the city drivers who take shortcuts between cities, thinking they can shave a few minutes. I’ve been hit while riding in a rural area. Destroyed my bike and I was in the hospital for a good stretch. The best we can do is wear more visible colors, have blinking/strobing lights, and have thorough signage in cycled areas.
- Lack of speed enforcement/adherence and distracted driving are my biggest safety concerns.
- In high volume car traffic, space for cycling is critical. Shoulders, bike paths or lanes are essential.
- In the area I moved to a couple years ago many of the rural roads have very limited sight lines and absolutely no shoulder making them unsafe to ride.
- I would note that although I commute primarily by car, if the roads were safer with bike lanes, alternate routes for highways, etc., I would commute by bicycle. My husband commuted to work on his bicycle 28 miles roundtrip for over 20 years. He had to ride (legal in Alaska) along the shoulder of a 60mph highway to go from our town to where he worked. He was hit by a passenger truck traveling at highway speeds in October and died 5 weeks later because of his injuries this year. If there were safer commute options, this would not have happened. Every cyclist has a right to the road and many of us would ride more with safer features. He rode in all conditions and was an outstanding example of a safe rider with high visibility and wide reflective vest, high visibility helmet, front and rear lights, and a mirror on his helmet. Merge lanes are a problem, lighting is important. I would like to ensure cyclists have safe options to ride that don’t result in unnecessary loss of life.
- Main factors for my comfort are motorist traffic volume, speed, and their patience. Their patience seems to go down when traffic volumes are high. Additionally, presence of large trucks on rural roads degrades bicyclist comfort.
- Bike lanes often just become unmaintained shoulders full of debris that make them unrideable. A proper bike lane should be regularly swept and ideally have a concrete curb to prevent cars from drifting into it. I have seen these in rural Thailand, it’s incredible we don’t have them in the United States.
- All new roads that are repaved need shoulders for cycling. It is not much extra pavement but makes a big difference. Also, the rumble strips on the white line need gaps for bikes to get on and off the shoulder.
- The main problem where I live is the general lack of any side road availability. The roads near me are mostly two-lane roads with no shoulders to bike on and with frequent twists and turns, cars can be right on top of you before they are able to see you and slow down. I
especially poison ivy, or that it may block me from a passing car). Too few trees are also a major issue, limiting riding after about 10:30 am in many regions in warm weather.
- We don’t cycle on the road anymore except during races where police officers are actively monitoring the traffic and helping to keep us safe. I cycle indoors only now due to the terrible traffic that has become common around the area we live. It’s too congested, and too many people are disrespectful when they drive with cyclists on the roads. And as much as I love to bike, it’s not worth the risk anymore. When we move, we’re moving to a much more rural area with far less traffic, and plan to bike outdoors again during good weather.
- conditions are very bad on Oahu Hawaii. We now have better commuter routes, but our rural areas have narrow or no shoulders to ride.
- I live in a rural area and for the most part the cars are respectful, and the roads are good. I ride alone mainly because in the past riding in packs tends to create a sense of entitlement to the road…. cyclists can be disrespectful to the rules of the road. I avoid suburban or busy areas because cyclists are mostly considered to be in the way of the motorist. Bike lanes in Michigan are essentially non-existent. If there were more bike lanes and cycling was more encouraged/accepted as a form of transportation, I would use the bike more often for transportation.
- West of Ann Arbor, Michigan has some reasonable “rural” road that will allow for 30- to 50-mile rides. The drivers seem to be considerate towards riders, there are exceptions. The roads are in reasonable shape. I do use the constructed trails extensively, however at times they are not very safe when wet, and high pedestrian traffic.
- Several areas of Michigan have excellent road, especially hugging the coastlines. Would like to see improvement in that area.
- My primary goal when riding in rural areas is to find dirt/gravel roads with minimal traffic. Wide tires with low rolling resistance make gravel bikes almost as fast as regular road bikes. People do not pay attention and every time I am riding on a paved road, there is a big risk of being hit by a car.
I ride long distances with many rides over a 100 miles per day every year. Two years ago, I rode from the Detroit suburbs to the Upper Peninsula, around the perimeter of the UP and then back to Detroit for a total of 1,800 miles in 15 days. Three years ago, I rode from San Diego, CA to Jacksonville, FL along the Adventure Cycling Association’s Southern Tier Route. More rural routes with rails-to-trails and dirt roads are preferred compared to wider shoulders. - Texting/distracted driving is a real concern. Nonmotorized pathways separated from cars are best scenarios.
- Car Bike Technology cars knowing a bike is ahead.
- Good sight lines and a reasonable width to the right of the fog line (i.e. shoulder width) are keys for safety. No shoulder and/or poor sight lines (curvy and/or abrupt elevation changes) create danger. I found it interesting that in the last section (showing diagrams of various road designs for parking, sidewalks, medians, etc.) has little if anything to do with RURAL riding, where nearly all roads are two lanes without parking or medians. These scenes may have applicability for suburban or urban areas but nor country roads.
- I have been cycling for leisure and competitively for 45 years. My biggest fear is that many drivers today are distracted, if not very distracted. I have witnessed four cycling
mostly keep to local highways with large shoulder areas so I can see and be seen while biking.
- I think vehicle speed and frequency are the two things that determine my routes overall. I ride all the time and for exercise, recreation, and transportation, but I evaluate roads based on whether I would feel comfortable taking a new rider along with me.
- Car traffic on Rural roads in our area has steadily increased over the last 10 years as land has been developed and more homes have been built. Cycling on these roads is getting to be more difficult, even during early weekend mornings. Having dedicated bike lanes or bike paths would be very helpful to ensure cyclists’ safety,
- Wide shoulder with lane departure awareness features is ideal.
- When riding along highways/roads with paved shoulders, having the rumble strip close to the fog line is preferrable to having a rumble strip take up most of the space in the shoulder. This allows the cyclist to use the shoulder and provides more space between cars and bikes for increased safety.
- I prefer mountain biking on trails, away from traffic altogether. I would like to be able to ride from home to cycling destinations, but the roads near me are not very safe for cyclists, so I end up driving to a ride, or compromising my ride quality by riding around neighborhood roads while trying to limit my exposure to the higher-speed and low-clearance roads.
- Riding on higher speed roads with narrow/no paved shoulder or bike lane lends itself to discomfort every time a vehicle approaches from the rear.
- I’ve biked across the country and on a lot of roads that were not designed for cyclists. What I’ve experienced is that incidents are drastically reduced when there is space for everyone on a roadway—i.e. if a car comes up behind me and can simply pass without having to slow (whether because I’m in a wide shoulder or there isn’t oncoming traffic), they will do so; but if they have to wait in order to pass safely, that’s when I’ve experienced grumpy drivers and road rage. In my ideal world, all rural roads would be built and maintained with a wide, clean, smooth, paved shoulder—at least 4 feet—so that all users can simply be accommodated. Unless the roadway goes through a busy area, I think cycle tracks or side paths are unnecessary for most rural roads. Roads that are designed without any pavement markings or lane lines make excellent bike routes, and in those cases, a marked shoulder is unnecessary, but I would love to see regular signs alerting motorists to the presence of cyclists and their right to ride in lane.
- My absolute favorite rural roads are gravel roads with nearly no traffic. Sometimes I get passed by two cars and an ATV in an hour. After that, I prefer un-striped minor roads, followed by roads with a rideable shoulder. Shoulder is more important to me on uphill sections where I’m slower.
- Separated facilities are not included in this survey yet are very important and must be the type of facility going forward.
- Bike lanes separated from auto traffic by a physical barrier would be best.
- One of the things I consider when riding in any community is becoming familiar with the road and traffic conditions. Another is group riding. There is safety in larger numbers of riders.
- Wider, clean shoulders. Bushes and greenery cut back off shoulders.
- No public policy priority on multimodal transportation.
deaths due to drivers not looking out for cyclists. This, I believe, is the greatest risk to the lives of cyclists that use public roads for cycling.
- In our area, there are no real considerations for cyclists from either the road planners, motor vehicular traffic, or most drivers. Most drivers tend to be somewhat distracted either by phone text, or just unaware or antagonistic of cyclists. There are no bike lanes, very few safe shoulders, and an abundance of uncontrolled dogs that do bite. (I have personal experience.)
- They need wider shoulders on most of the rural roads in our area to feel safe about cycling. They also need to educate people about cars moving 3 feet over, if possible, for cyclists when passing them.
- Prefer gravel roads.
- In my state of Pennsylvania, most roads that are marked over 30 mph are (for me) too fast-moving vehicular traffic for me to feel comfortable being alongside them in traffic. Even in rural settings, if it is a state designated route, I would never feel comfortable riding in that situation, as our state DOT prioritizes vehicular traffic over any other, and that includes towns with main streets as state routes.
- I’ve ridden over 250,000 miles on rural roads in North Carolina, and I’ve seen everything, including hostile drivers. Wider lanes and shoulders would help a lot, as well as better education of drivers in the rights of cyclists on public roads.
- The most important thing to me is the ability to have separation from the cars, especially on curving or busy roads. People are frequently too hurried to slow and wait for a safe time to pass on hilly or curving areas, or areas with a lot of traffic.
- There’s also an issue with some rural residents being anti-cycling and harassing cyclists while they ride. Thankfully it is not common, but it does happen. Also distracted driving is a huge problem in all areas—rural, urban, and suburban areas.
- I’ve ridden on many rural roads, but the speeding drivers and dangerous vehicle design are making it more dangerous. It was always dangerous, but drivers are worse, and vehicles have no safety features for anyone outside of the vehicle. Distracted driving is prevalent as are antagonistic attitudes towards nonmotorized users. Car ads are brainwashing people every day. There are no ads for bikes, walkers, or transit.
- I picked a portion of Hillsborough Road just north of Carrboro, NC, because that road is heavily used by recreational cyclists and badly needs separated bike lanes in both directions. Otherwise, someone is going to get hurt.
- I have participated in group ride across several states, as well as self-supported multi-day rides, primarily in rural areas. I have decided that this activity is too hazardous, and I will only ride on gravel/paved trails, where there are no cars. There is an element present these days among pickup truck and SUV drivers that are antagonistic towards bicyclists.
- I ride urban in my small city (under 20,000, no stoplights) for errands, commuted to/from work on trails and highway before the pandemic, rural to get away from (most of) the cars and breathe. Surprisingly drivers in my area are largely well-behaved.
- Wondering why you have no options that show separated bikeways—off-street multi-use pathways Both are safe, convenient, comfortable options for rural roadways. Similar comfort level to 20mph/low volume neighborhood streets.
- I prefer both separated and off-street pathways along rural roadways and go out of my direct route to ride them.
- It seems the data will be skewed since survey respondents do not have an opportunity to say they prefer the safest options: separated and off-street bikeways.
- I ride 1200-1500 miles per year. I would like to be able to use my bike for transportation to run errands, visit friends–but the streets just beyond my housing area are not safe. I cannot comfortably ride the one mile to the grocery store because of vehicular traffic despite being physically fit enough to ride 40 miles on a single ride.
- I typically look for long stretches of country road with little use except for the people who live there. I never ride on double yellow roads. I look more at the road itself for speed indicators than speed limit because cars will do the same. If its relatively uninhabited, cars feel comfortable to pass and there’s a nice view, that’s my ideal road. All my worst experiences with cars have been in populated neighborhoods.
- Bike paths or multi-use paths are my preferred way to cycle.
- America needs to incorporate more separated bikeways and off-street bike paths along rural highway corridors like what is done throughout Western Europe and Scandinavia. Cycling on America’s rural highways is very stressful by comparison because the cyclist must share infrastructure with fast moving vehicles.
- At least a couple of feet of well-maintained pavement to the right of the white line. If the roadway requires rumble strips on the right shoulder, put them on the same line as the white line. The more space the better of course. Would really be nice if they could be blown off or swept off from time-to-time.
- Thank you so much, the riding community really appreciates your efforts, Steve.
- Some road users take unnecessary risks to pass cyclists (passing over hills or along blind corners), and they don’t seem to realize how fast a bicycle can go which puts other road users at risk. I have a close call at least once per month because of this.
- I’m a very experienced cyclist with several bikes; a bike racer and collector. I have been very active in promoting cycling regionally.
- I have been riding since I was able walk. Rural roads aren’t typically an issue for me unless they are high speed and high traffic.
- I feel extremely fortunate to have rural roads that I can, for the most part, safely ride. There is only one small section that doesn’t have an asphalt shoulder and the worst part it’s on a curvy uphill section. With development increasing in our rural area, the need for speed enforcement is paramount. As well I feel there is a need to promote, if it’s mandated in the state, the laws defining what buffer space is required for vehicles passing bicyclists. In Michigan it’s 3’, we have an abundance of vehicles with mirrors that stick far out from the vehicle itself. So even if the vehicle buffer is 3’, the mirror is much closer and much more of a hazard if driver can’t determine what 3’ looks like from the seat.
- Roads should have shoulders so that when cars pass, cyclists can maneuver to safety if needed. I view it as the drivers are more scared than the cyclists. So many people freak when a car is coming, and they are also passing a cyclist. That’s when the cyclist can get buzzed, or worse. Generally rural roads have lower volume, but often the residents speed so there should be a safety outlet such as a shoulder.
- My fear on busy streets would be bad drivers that veer into a bike lane.
- The Fargo/West Fargo area of North Dakota is surrounded by rural highways (county roads). To get a long, uninterrupted ride in I must get on county roads or the interstate (in North Dakota, Minnesota does not allow interstate riding). I generally ride on the county roads. Some in Cass County have six-foot paved shoulders. Some of the shoulders are in excellent condition some are ok but not excellent. Cass County 81 which I referenced in
- I use the rail trail that is near my house which is where I feel most comfortable cycling. I ride on the road to get there which does not have that much traffic on it, but it can sometimes be hard to tell if a car will be coming around a bend or over the hill and there is really no shoulder to use. My ride is short, but low visibility of cyclists in rural areas is one of my main concerns when riding on the road.
- I believe my interactions with other road users, namely motorists, have improved in rural areas in the past few years, but have largely stayed the same in the city. I enjoy rural riding when traffic is light.
- I prefer roads with wide shoulders. This gives me the option to stay further from passing cars. Roads with narrow or no shoulder usually have bad pavement along the edges which causes me to ride further into the lane of traffic.
- rumble strips on road edges are hazardous for cyclists.
- Prefer some shoulder, low traffic and speed, NO rumble strips.
- I am a lifelong cyclist and commuted by bicycle in urban areas for many years. I am retired and take 1 to 2 long distance bicycle tours each year covering hundreds of miles. I ride aggressively and demand space on the roadway by my actions but recognize most cyclists will not ride unless more protective facilities are provided.
- Most drivers are aware and courteous unless you ask them to change speed to wait to pass. I have seldom had a bad experience with drivers passing me with no oncoming traffic, but only the exceptional driver will slow down and wait to pass when there is oncoming traffic, even if that means substantially violating the 3-foot law and putting me at rick. Sometimes they will move over to pass when there is no sightline (around curves and over hills) almost hitting the oncoming driver. Sometimes even law enforcement is either unaware of the 3-foot law (a survey of our Grand Junction police department demonstrated this) or fail to observe it. There are always the few antagonistic drivers that take affront to bicycles on their road and intentionally put you at risk. From my point of view enforcement of bicycle safety laws, such as the 3-foot law is spotty at best and complaints are met with “Can you identify the driver?”.
- We’re lucky in Wisconsin to have numerous backroads which are quiet, paved, and scenic, especially in the Driftless. When I bike in other states, I’m often biking in faster, denser traffic. I don’t enjoy it nearly as much, even though there’s usually a shoulder. I don’t like gravel roads… you get covered with dust when passed by cars/trucks.
- I’m a pretty experienced route planner; I use RideWithGPS. A great biking experience is along the north shore of Lake Superior in Minnesota. There’s a bike path for a significant part of it (which is slowly growing) and a couple of other parts (near Duluth and Canada) are on quiet roads. But there are some parts where there’s only a one-foot shoulder and lots of tourist traffic.
my mapping earlier in the survey has a degraded paved shoulder that is less than 6 feet in width. City and County planning allowed a softball complex to be built north of Fargo and created a very dangerous situation in which motorists use a section of highway 81 to get to the softball field complex but did not make improvements to this section of county roadway before or while the 28-diamond softball complex was built, and usage began. I imagine no survey was done to see how Cass County Road 81 is used by bicyclists prior to approving the plans for the softball field complex. A definite disconnect between city/county planning and users of this roadway.
- Worst rural biking experience ever: pedaling on a busy Minnesota highway which had just been repaved, but they ran out of money to pave the shoulder.
- Another thing which discourages me from biking on rural roads is dogs which are loose. They almost always charge after us.
- If you want to understand bike traffic density, check out Strava Metro. Better bike road cultures exist in areas where communities communicate through signage, that bikes are on the roads and need space. We see this in unlikely places like the hill county west of Austin Texas, for example. We also feel much safer pretty much everywhere in Europe where attitudes are more tolerant toward cyclists than in most areas of the United States.
- More bike lanes, paths and city planning for bicycles.
- Biggest hazard: negligent motorized vehicle drivers. Second biggest: unrestrained aggressive dogs. I live in a rural area, so that is where I ride. When we travel, we take folding bikes and look for bike paths, Riverwalk etc.
- Wider shoulders, lack of potholes, lower automobile speed limits are all key to improving rural cycling. And people need to stop texting/using their phones while driving.
- Clean, 3 feet shoulders that are FREE FROM DEBRIS in rural areas are very nice. Of course, I LOVE separate bike paths and would drive out of my way to ride them, versus on regular rural roads. Trucks passing at high speeds make me very nervous, as does heavy traffic.
- Need to improve shoulders in the rural areas. Can be scary riding with cars passing less than a foot away.
- rubble strips, lack of shoulders, plus high-speed traffic is very common in rural areas throughout the country. This makes rural bicycle travel extremely dangerous and means loss of revenue from bicycle tourists who are discouraged from traveling through their area.
- My spouse and I completed a 5000+ mile coast-to-coast-and-then-some trip on a tandem bicycle. Our preference was to ride on rural roads. Large shoulders with no rumble strips were the best. Some rural roads had no or narrow shoulders, but they also had almost no traffic, so that was fine. It’s the combination of no shoulders (or shoulders but with rumble strips taking up much of the shoulder, or debris, or unmaintained surfaces) with heavy, fast traffic that are the worst.
- Our at-home cycling (city, population 300,000) is done mostly on multi-use paved trails (we are blessed that our community has LOTS of those) and non-busy streets.
- Love a good shoulder but often, even on the state highways (M-43, M-66, M-37,) they often don’t exist between cities… say M-43 between Hastings and Woodland, MI). Heavy truck traffic makes it hard on the cyclist and the truck driver!
- I am increasing concerned about a driver being able to see clearly because of the air bags now being in the pillar along the windshield. I think visibility has been reduced. I find roads that are narrower and have a worse surface almost feel safer as it slows cars down. Most cars speed and I think speeding gives a driver less time to react if they come around a curve and see a cyclist. Large shoulders are wonderful, and I am constantly depressed that society won’t pay for larger shoulders to accommodate cyclists. I am a long-time cyclist and I increasingly seek out roads that are more remote from population centers, but it is getting tougher as more rural areas in California are developed. Driving is cheap and everyone drives.
- I used to think that, contrary to popular belief, NJ drivers are quite courteous. But in 2021, NJ passed a law requiring motorists to give bicyclist 4 feet of space. Now, all the drivers are crazy! What’s changed? Nothing. Only my perception. Whereas if previously a driver gave me a few feet, I was appreciative. Now I expect (DEMAND!) more!
- It’s important to have access to services (restaurants, convenience stores, hotels, etc.) by bicycle. I love riding rails-to-trails, but there are rarely services nearby. Safe roads and safe places to park your bike are important.
- cycled starting as a teen. Restarted cycling actively in 1997. “Light years” average 4000-5000 miles a year (primarily in a “season” from Mid-March through October’s end). Longer years are in the 5500 to 8000 miles range. Last 2 years cycled two different routes across the nation in a self-supported solo tour.
- I’ve had many more issues with dogs than cars and trucks when riding on rural roads.
- Signage, pavement markings, and buffer zones need to be emphasized indicating bicycle and automobile lanes.
- Shoulder, shoulder, shoulder, shoulder, shoulder, shoulder. With enough lateral distance between cyclists and traffic, I don’t care what the traffic volume or speed is.
- Some of the images in the last section are hard to understand. I think the last three show NO bike lane at all, but I am not sure. You do not include totally segregated lanes in the image selection (i.e., barrier separating from cars)
- More separated bike paths in urban suburban areas and in rural areas where biker volume is high. Good WIDE shoulders on rural roads where bikes and cars need to share the road.
- We need more “share the road” signs.
- Rural roads I bicycle do not have heavy car traffic and they have little to no shoulders. When there is a busy spell of cars on the road, I am a sitting duck if I stay on the road. Wide shoulders, rumble strips separating cars from the shoulders—these are my favorite combination. Of course, rail trails, with only bicycles or pedestrians are wonderful, just not long enough for a day’s ride.
- 75-year-old cyclist who has done a number of multi-day tours including cross country trip in 2008 and 1200 miles trip in New York State in 2021. Within the last 2 years have started using a Class 2 ebike. Over the years I think drivers have gotten better.
- In choosing what roads to ride on from the pictures you provided I had a hard time deciding if any had rumble strips. I feel like some did and this steered me away from choosing those roads. No rumble strips!
- I dislike bike lanes that disappear, put a cyclist to the left of cars, or make it difficult to go straight at an intersection.
- In town, “Idaho stops” should be recognized as supporting bike safety. (Look it up!)
- Roads need wide shoulders, no rumble strip in the shoulder, and clear of debris.
- My state paves almost all roads. Rural roads with medium traffic are easy to find except where roads are closed due to crossing freeways, so traffic is concentrated on a few high-speed crossing roads with cross traffic (ramps) and hills due to overpass slowing me, causing even higher speed differentials.
- I ride mainly gravel roads… as the highways in NW KS are too dangerous to ride, too many trunks and people just don’t want cyclist on the highways out here.
- To me the single biggest factor for safety of all road users especially as cyclists is to have 2 to 3 feet of paved shoulder with a fog line that defines the travel lane and the shoulder. Secondly here in Colorado we have some excellent new laws to protect cyclists especially in rural areas and so motorist need to be aware and required to follow those as well as cyclists. I expect cyclists in rural areas to move off the paved road when stopping and do it in a spot with good sight distance so motorists do not have to wonder what their next move might be I also encourage cyclist to use a rear-view mirror. Even know “share the road” is passé it is still fundamentally a good way to go. I could go on and on but get a gravel bike and ride rural (paved and unpaved) you will love it.
- These cycle byways are good for both health and he environment.
- Rumble strips are awful if they go into the shoulder or bike lane (or even on road if no shoulder). Warning strips are okay if on white line when there is a shoulder, not good in shoulder or bike lane.
- At a certain volume of traffic, lateral road space is critical to both motorists’ and my safety and enjoyment. Below the threshold, sharing the road is not problematic.
- I ride frequently on country roads and urban. Recently ride 3000+ miles across the USA
- Car drivers need to be educated to the rights of cyclists and car drivers’ responsibilities to accommodate bicycles sharing the road
- Road repair and presence of shoulders are critical in rural riding.
- Would ride in light traffic with no bike lane or much shoulder with two-wheeler but haven’t tried it with the trike yet.
- More mandatory education for motorists regarding shared use on rural roads. More local community outreach to educated both cyclists and motorists about shared use.
- Good shoulders and signs indicating cyclists on roads and signs posting safe passing distance. Enforcement of safe passing distance infractions.
- I prefer riding where I can be seen at a distance by vehicles, and there is space for them to safely pass me.
- I have done a lot of bike tours. #1 issue for me is how close to traffic I need to ride/I have been on rural roads with no shoulders and constant traffic from relatively high-speed cars/I do not like expecting to die—which is how I feel when I end up in that situation.
- If rumble strips are used, especially in rural areas, there should be at least a 3-foot paved strip to the outside of the road (right side of two-way road).
- High interest historical routes should be signed, have paved shoulder with 3 feet away from any rumble strips, and frequently patrolled by law enforcement.
- Cycling is so fun! Especially when you’re not in danger of being killed by a car.
- I am very experienced, retired and ride up to 10,000 mi/yr. I acquired a gravel bike last year and ride more of that terrain, also mountainous areas.
- I am a very experienced cyclist throughout all my life. I’ve competed in ultra-marathons, lived without a car for 7 years commuting in the city, and ridden across the USA three times, the last time alone when I was 60.
- Don’t like “share the road” rural areas. Must have Bike Lane or white line.
- I have found in my area that most cars on the rural roads will completely move into the oncoming lane when trying to pass a cyclist, even when it could be to their own
- This past summer I rode across the country on rural roads. For the most part, traffic is not the issue. It is shoulders or lack of shoulders and road and shoulder condition (potholes; debris such as glass, gravel, tire shards; sticks; cracks; barriers such as curbs and guardrails). If there is very little traffic, little or no shoulder is fine. If there is much traffic, especially trucks, RVs or at speed, then a shoulder is more important. Presence and placement of rumble strips can render shoulders unusable or dangerous. Usually, the road is in better condition so I would ride there even if there was a shoulder, and then might dip into the shoulder if a vehicle approached from the rear. Sometimes the shoulder was in better condition than the road. Shoulders are more important when I am going slowly uphill and might need to stop due to debris in the shoulder or fatigue.
- Rural cyclists want awareness from motorists. Urban cyclists want a separate infra from cyclist.
- Mainly, I prefer low traffic and space to ride. Low traffic count is a higher priority. Potholed roads are a no-no. Either I am breaking a wheel, crashing, avoiding potholes, or avoiding vehicles that are avoiding potholes and almost hit me. Bike trails are fine, but not if crowded. Bike lanes are fine, but adjacent parking is not preferable—motorists do not check for bicyclists when opening doors. Road shoulders and/or wide bike lanes without door-zones are ideal. Curvy, hilly, rural roads can be difficult/dangerous—until you get to know them.
- Rumble strips are a cycling nightmare. Shoulders of the road need to be wide (at least 3 feet, preferably 4 ft). In my area, road conditions are horrible. Roads are constantly being dug up to replace culverts. Potholes are rarely filled. On county roads and town roads there are no road shoulders at all. If you want a road shoulder, you have to ride on a state or US highway. Bridges rarely have shoulders, and many have drainage grates in which a bicycle tire can become entrapped. Speed limits are 55 mph even on roads without shoulders. People who drive pickup trucks and large SUVs are the most dangerous drivers on the road. They behave as if they are the only ones entitled to be on the road. Distracted driving has gotten to be totally out of hand. Even though it is illegal to do so, most people still talk with a cell phone held up to their ear. In rural communities there is no law enforcement for speeding or hazardous driving. Law enforcement only shows up after an accident occurs.
- Eliminate rumble strips in shoulders. Murder for cyclists.
- I was almost killed on what I thought was a safe road (no road is safe), so now I ride more gravel as do many cyclists.
- Bicycling on busy, high-speed streets is the worse. Last year my wife and I rode on Adventure Cycling’s Tour of Death Valley. The tour had all the riders pedaling along Interstate 95 between Pahrump, NV, to Beatty, NV, for some 60 miles with a 30-mph headwind. The wind was physically draining, yes. But traveling on a two-lane Interstate Highway with a posted speed limit of 70 mph was ridiculous. For vehicles and semi-trucks would pass the motorist in front of them, they’d pull into the oncoming traffic lane and accelerate to 90mph to complete their pass. While performing their pass, they’d be coming at us (on our bike) with just 5 feet and a painted line between them and us. Totally unacceptable. I wrote to Adventure Cycling and told them how awful the first day
detriment. There are still a few random vehicles that will pass somewhat close or rev their engine when passing.
- Drivers need to be educated above most else. Driver aggression in rural areas is much more of a problem than potholes or even shoulders. Angry rural drivers in HUGEEEEEEEEE trucks are terrifying for cyclists, even a road hardened rider like me, so I can’t imagine anyone slightly more timid putting up with it. It sucks to be coal rolled, honked at, swerved at, yelled at, and have stuff thrown at you—and those are getting off easy compared to some stories I’ve heard. When you talk specifically about RURAL riding, not just general riding safety, this is what sticks out most in my mind, yet a lot of your slides could have been in suburban or urban areas. The biggest issue for me when deciding where to ride in a rural setting is how crazy and bike-hating the general populace is.
- bike paths are okay, only if they’re maintained. Otherwise, I’d rather ride on a road with a good shoulder.
- Separation is the most important consideration on rural highways—wide shoulders. On secondary roads and trails, road surface condition becomes more important because traffic volume and speed is usually lower on secondaries. When road traffic speed approaches 25 mph, bicycle and motorized vehicles are essentially at the same speed.
- Rural riding can also mean using dirt/unpaved roads, which often provide ideal situations for biking. Cars can’t go that fast, and generally those roads are basically unused. Also, rail trails and other off-street bike infrastructure is the top tier of best way to experience rural riding. There is nothing that can surpass it.
- rumble strips on the edge of the lane can be a problem either for when you need to cross them to make a left turn, or if they are in the shoulder, or worse take it up almost entirely. The distance from the center line to the edge of the pavement seems to matter more than how it is divided up by a line- that is, a wide car lane and a narrow shoulder is as good in terms of how close cars pass as a narrow car lane and a wide shoulder. And it is noticeable how much debris builds up on wide shoulders!
- I’m a vehicular cyclist and feel comfortable riding with traffic however I find myself less enthusiastic about riding on roads since the Covid19 pandemic. I have been leading multi-day bicycle tours for 20 years and have observed that traffic is traveling faster and faster on rural roads previously with low traffic volumes. Increased speed and traffic volume has made me look at rural roads more critically when considering a rural route for a bicycle tour. I judge roads, rural or otherwise, by my comfort level and more importantly the comfort level of my participants/guest. Stop with the rumble strips that are wide and continuous, they are dangerous to bicyclists. Instead, decrease the width and have intermittent “breaks” between. Shoulders that are 4-6 feet wide and narrowing of the traffic lanes (slows traffic) on rural roads feels safer however, neither of these solve the distracted driver issue.
- From my experience the width of the shoulder and the quality of the pavement are the two most important aspects for safe cycling in rural and suburban areas.
- Wide shoulders and good drivers are the most important safety concerns for me.
- Highway 93 out of Missoula is the scariest. The shoulder varies and is in poor shape. It would be great if there was a way to go around the area from Whitefish to the Bike Retreat.
of their tour was, yet I saw that they kept that same stretch in their Death Valley Tour later in 2022 and in their 2023 tour. Go figure.
- Prefer paved shoulders on county roads, even if they are just a few wide of asphalt. I ride with the traffic about 2 feet in from the white line.
- “Share the road” signs seem to help a little
- Bicycle lanes or wide shoulders without rumble strips are of utmost importance when selecting a route.
- I often ride rural areas near Nashville, TN. I choose routes mostly based on amount of traffic and condition of pavement (+ shade is nice!), but I am also very used to riding city streets with lots of traffic. I’m lucky to have a lot of local rural routes that feel safe nearby, but that is not the case in many communities. (Urban cycling in Nashville needs much improvement.) I’m a huge fan of Rail-to-Trails Conservancy (because their routes are completely segmented from automotive traffic). Adventure Cycling Association has done a tremendous job mapping many cross-country routes (some unfortunately contain segments that are not as safe as they should be because options are limited.) I would encourage you to work with these two organizations to help improve the gaps in existing routes. I appreciate your efforts to make rural cycling safer!
- I will only ride a bike if conditions are safe, away from cars that could kill me.
- I don’t mind riding on a major highway if it includes a “wide” shoulder and a “rumble strip” that is located on the far-left side of the shoulder. There’s nothing worse than a “rumble strip” that is placed in the middle of the shoulder, which defeats the purpose of the shoulder (at least for bicyclists).
- My bicycle use on rural roads is typically once a year for a week-long organized, fully supported bicycle trip with 800-1200 people. Other than that, I cycle mostly off-road on rail-trails or similar, paved or not, 2 to 3 days a week, spring, summer, fall. In the winter I cycle 2 days a week indoors on a smart trainer. Average total miles in a year is about 1000 mi.
- One concern about rural areas is loose, aggressive, and potentially vicious dogs.
- The biggest factors for me have nothing to do with structure. I will ride just about anywhere. I like a route with an occasional gas station. Other than that, I a pretty easy going.
- Safe riding on shoulders is crucial—“bike routes” where shoulder is designated as such is great! Stopped riding when I lived in MO as there were so few shoulders to ride on, and have had a hard time starting up again after that experience. Looking forward to doing more soon here in WA and cross-country.
- Rumble strips!!! They should be half as deep, half as wide, cut into the white line with 8-foot breaks. This will keep all but the most impaired motorists out of the ditches!!!
- I can identify more rural roads in my area. You allowed me to ID only one.
- No safe bike lanes in my town
- I am very concerned about people driving while drunk and /or high.
- Build roads with wider shoulders and keep them clean. Frequently roads have gravel and debris on the shoulders and are not rideable in my area. Need law enforcement and court system to hold automobile drivers accountable when they hit or kill cyclists. They just have to say, “I didn’t see them” and they automatically get away with murder.
- Aggressive drivers, although in the minority among drivers, are the biggest concern. Many of the rural roads in Western North Carolina have many blind curves. Cars that
- I cycle year-round. Typically, as long as I have a berm, I am OK, As long as there is a reasonable berm away from the rumble strip I am OK as well. Rumble strips with no berm are a nightmare.
- Ideally bicycles and cars should have separate paths, barring that, concrete barricades between them, barring that, striped or painted bicycle lanes with flexible posts, barring that, painted lanes, barring that, a full paved 5’ wide shoulder without rumble strips. I’ve cycled thousands of miles on rural roads and only been terrified a handful of times, but those conditions exist out there. Bicycles ALWAYS lose against cars, and that’s unfortunate for those of us seeking to see the country in a slow, environmentally friendly way.
- Wide shoulders.
- Recently rode from Los Angeles to Melbourne, FL, along the southern tier, 90% rural riding. Many roads with terrible shoulder, poor pavement, and high-speed auto and commercial (semi-truck) traffic. Very anxious to ride in these conditions for 7 weeks. Particularly FM roads in east Texas logging country. Florida had best bike friendly rural roads out of CA, AZ, TX, LA, MS, AL by far. Key to safety is enforcement and public awareness. Drivers should be required to take bicycle awareness test while initially applying and then biannually online after that.
- I hate rumble strips. Anywhere, at any time.
- Separated dedicated bicycle paths should be identified as a design priority. This type of infrastructure best serves all users and community members by providing safe and economic alternative to vehicle trips. This is especially important for rural and suburban communities where there are larger travel distances between services/economic cores and residential areas.
- Do not like rumble strips in the middle of two-lane roads because they make cars less likely to get over. Wide paved shoulders are best with no rumble strip. Lower traffic volume is important.
- Where I live there are choke points with heavy traffic and no bike lanes or shoulders. This makes it hard to leave the city on a bicycle. The alternative routes often involve big climbs. The topography of the area makes it expensive to improve the conditions for bicyclists.
- Rural roads in the south have no shoulders and very few bike lanes, therefore most of my riding is on greenways, rail trails or sidewalks (few existing the south). Drivers in the south are very aggressive towards cyclists and level of distracted drivers extremely high (texting, watching videos, etc.).
- Rumble strips should be as narrow as possible and directly on the white line delineating the edge of the lane leaving as much shoulder as possible available for cyclists. So many of the county roads in my area have decent shoulders but the rumble strips are wide and sometimes don’t even start until a foot into the shoulder. That doesn’t leave much room to maneuver around road debris without riding into the rumble strip (NOT fun) or, even worse, having to swerve into the lane.
- Did not see clear definition of “rural” for this survey. The definition might change my answers as I ride everywhere from downtown big cities to decommissioned logging roads. For safety I prefer a large, smooth shoulder, with rumble strip under lane line not a
pass a cyclists/group of cyclists when there is possible/unseen oncoming traffic is a regular occurrence—this would be the biggest concern.
- State rural numbered roads need shoulders. Many NH rural state numbered roads lack safe or adequate shoulders. No shoulder rumble strips, or at least make a smooth space right of rumble. Better enforcement or education around 3-foot rule. Better education about how to approach and when to pass a cyclist (buzzing cyclists, violation of e-foot rule). Pavement issues at road edge or in shoulder need to be addressed. Bike lanes needed at intersections.
- My general comment as a touring cyclist frequently riding on rural roads is that we prefer to ride on low volume, paved rural roads. In those situations, a shoulder is not too important. As traffic volume increases, then a paved shoulder becomes much more important. Adequate shoulder width for cycling is important. Rumble strips are our worst nightmare. Rumble strips that are right on the white line, with plenty of paved shoulder to the right side of the rumble strip is fine. Rumble strips in the middle of the shoulder are absolutely the worst because there is little space between vehicle traffic and the rumble strip, and little room for error between the rumble strip and the edge of the paved shoulder.
- The street views are hideously simplistic, and the drag-and-drop directions are unclear. I have ridden in cities and towns, as well as rural areas, in the West, Midwest and South. The South, with its emphasis on “freedom” and disdain for adequate policing, scares the hell out of me. I’m considering moving back to the Midwest and sanity.
- I am an avid bicycle commuter and tourist. I ride 100 miles or more per week. I have ridden numerous types of roads/highways in my time. One of your questions was good in that it prioritized what I look for in a route. I would prefer a bike path or road with an extremely limited amount of traffic. It does not need to be wide or in perfect condition although that would be nice. I commute to work about 25 miles each way, twice a week. I started off riding backroads but have since changed to riding on the freeway (legal in this part of Northern California). While the traffic levels are much higher than the backroads, the shoulder is 6 to 8 feet in width, and I only have to pay attention to traffic at the onramps and offramps. These are often several miles apart, so my ride is relaxed. On the backroads, the shoulder varies from non-existent to about 2 feet and traffic, even though there is less, is always a concern. Last on my list of important conditions is the status of the pavement. I consider this less critical than traffic, but if I must constantly dodge potholes and road debris, it subtracts from my enjoyment. I don’t consider the speed of the traffic to be that much of a concern, nor most of the other items on your list.
- Roads need paved shoulders for riding on side. Car drivers need be aware of cyclists.
- Most rural roads have little traffic so that is not an issue. Surface is an issue - chip seal or gravel is a problem. There are times when you find that you must spend some time on a busy, high-speed road with little or no shoulder. That is a problem.
- Cycle often in rural areas. Most have little or no shoulders. Roads should have wide, smooth shoulders for bikes. Also, any roads on designated bike routes should be required to have a marked bike lane.
- On most roads in my rural area there are no shoulder to speak of. It’s a “share” the road only area which really impacts my willingness to ride very often when I’m competing for
foot into the shoulder itself and for the shoulder not being raw chip seal or gravel. Cars should have room to give cyclists space, without a firm barrier on the inside of the lane. Parked cars opening doors are terrifying.
- I tour extensively (4 to 5 months a year). Major areas that concern me are shoulder width, AADT, line of sight, speed difference, lack of warning signs in high danger areas like bridges, tunnels, etc.
- I prefer cycling on gravel roads because traffic tends to go slower and there are fewer vehicles. When I do ride on pavement, I prefer to have some sort of barrier between myself and the auto lanes, even if it is just rumbling strips. On roads where there is high speed traffic (60 mph+) I prefer to avoid if possible.
- You might want to consider access points (driveways, crossroads, etc.) and associated turning movements in your consideration. My guess is that a great number of bicycle/vehicle collisions occur when one or the other is attempting to turn.
- Main issues for me in rural areas are: * Paved Shoulder at least 24” wide with NO rumble strip * Paved Shoulder at least 30” wide with 6” rumble strip to the left of the shoulder. * Low Traffic volumes.
- Traffic violence and inattentive drivers are the biggest threats I face as a cyclist. In urban areas, it’s usually inattentive drivers - people texting and driving, running red lights, encroaching on the unprotected bike lane, etc. In rural areas, I often face drivers laying on their horn because I’m “in the way”, drivers intentionally swerving at me, drivers “rolling coal” on me, or making unsafe passes. For rural roads with higher traffic, lower speed limits and/or wide shoulders helps a lot. Me and others on my cycling team intentionally choose rural roads we know are very low traffic with low travel speeds.
- Too often rumble strips put in otherwise adequate shoulders make bicycle riding on the shoulder impossible.
- Though I don’t mind biking on a rural highway with no shoulder if the traffic volume is low, a 2-to-6-foot shoulder is always nice.
- Separate bike lanes are the safest and most favorable to me.
- Vehicle speed in the rural areas I cycle in is the number one issue that needs to be resolved. There is very little enforcement of speed limits, no signage to speak of, and few public service announcements educating drivers on sharing the road. Roads are in poor condition in many areas of the state, making it harder to enjoy road cycling and stay safe. More connectivity with dedicated bike/ped infrastructure would help, but we do still need to make the roadways safer for all users, by traffic calming, reducing speed limits, and enforcing the rules of the road much more than we currently are.
- Usually, I must navigate busier roads to access the rural ones, and sometimes transport the bike by auto past those areas. I prefer to just ride from home and back which entails all surface riding…. trail, busier road, and rural and reverse. I choose my route to reduce exposure to traffic but am confident enough to handle most roads.
- Love biking but not wild about riding on roads; have had experience of angry drivers giving me the finger for not reason (they were driving in the opposite direction); would prefer to ride separately from cars like the trails in Quebec.
- Most of our roads in PA are narrow and have no shoulders. Shoulders without rumble strips are a plus.
- I will choose low-volume narrow roads over high-speed roads with shoulders. Rural trails are great but need access to businesses and signs indicating nearby services.
my few feet on the roadway with cars and trucks driving 55 mph! I seek out the few off-road trails where I’m near t afraid of being mowed down.
- In the survey, I discounted the speed limit signs because the road type will determine speeds more than the written limit.
- I live in the Finger Lakes area of New York state. There is very little bike infrastructure, but the roads are less traveled, so I feel relatively safe riding in the area. There are fewer alternative roads to take so I am on state highways at times. Some of these higher speed roads lack adequate shoulders, and because these are truck routes, it is unnerving. All rural roads need to have shoulders.
- I ride in the Finger Lakes area of NY state. The rural roads here have no cycling infrastructure, but the traffic volume is so low that I feel much safer than I ever did riding the much busier rural roads in California. On busy roads what I need most is space. Not even a lot. Just keep my out of the motor lane. My bad example: CA 89 near Bernie Falls. No shoulder, fast traffic; it was terrifying. It’s also the Adventure Cycling route out of CA. Slower speed limits are nice, but drivers generally ignore them. Lower motor traffic volume is great, but what can you do other than move to a new area? Just please give my shoulder room or a bike lane in highly trafficked areas.
- Bike safety in rural areas is directly proportional to speed of cars. 20 mph over posted limit is common.
- Side rumble strips on rural roads are a huge issue and your pictures do not really show this. Many states/counties ruin bicycle shoulder use by having wide strips in the middle of what would otherwise be an adequate shoulder. An 18-in. shoulder is adequate IF the rumble strip is no wider than 5 in., are directly under the white line, and have 4-ft beaks ever 5-ft. This allows you to swing out into the main road when you encounter items or bad pavement in the shoulder. Teaching state DOTs how to properly install rumble strips needs to be a key focus of any rural bike roads study. I’ve biked thousands of miles in the United States and Europe, so I know of which I speak.
- I tend to stay on hard packed or asphalt trials. I have been run off the road a few times causing bike damage but thankfully no body damage. Trails need to be more than 20 miles to get the best and safest workout possible.
- Lowering speed limits and widening shoulders would go a long way on a lot of the roads around here. We have some beautiful terrain in the bluegrass, which is already quite heavily used, but safety is the biggest barrier to getting more people out.
- On social media (Reddit, Facebook) there is absolute vitriol coming from (drivers whom I can only assume do not cycle) for cyclists who ride on the country roads, citing that they slow traffic, “appear out of nowhere and are difficult and unsafe to pass”, etc. In addition to creating wider shoulders and lowering speed limits so vehicles may feel more safe/comfortable passing, I feel improving awareness/presence of cycling in these areas may improve acceptance and willingness to share the road. Perhaps it will also encourage more people to come out and join us!
- You didn’t include any scenarios that consider truck traffic. Speeds and volumes are important, but it’s a difference whether you have mostly passenger vehicles passing or a stream of semis or logging trucks.
- I ride about 5000 miles per year. Toured all the West Coast a few times. Toured cross continent once. I ride approximately 125 miles per week on rural and urban roads and streets. Comfortable on both. I have been riding seriously since 1975. Thank God I have not had any serious injuries. One piece of equipment I will always have been a helmet with a mirror. Absolutely necessary!
- Placement of rumble strips is often a danger to cyclists on rural roads. There needs to be adequate room to the right of the rumble strips to safely ride a bicycle.
- Less volume of traffic to me means less stress driving, so the driver is more receptive to bicycles on the shoulder of the road. Higher volume of traffic to me means higher stress driving, so the driver is less receptive to bicycles and other things on the shoulder of the road. I prefer to ride on rural roads. Note I live in northern California, Redding.
- For me the safest situation is when there is either a shoulder or a passing lane allowing cars to pass without too much worry. Next safest situation is on low traffic roads. I’m not afraid to go where there is more traffic, narrow roads, or in town but I try to be super aware of what’s going on around me.
- I live in a small town and usually drive the 2 miles to work, but often bike. It’s all uphill, so getting to work sweaty is my biggest deterrent to bicycle commuting. Rain or snow also tips the scales towards the car. I love any sort of shoulder, especially nowadays with distracted drivers. Something needs to be done about cell phone use in cars. There is no excuse or the amount of calling and texting that drivers do nowadays. Horrible for everyone, not just cyclists.
- Rumble strips (non-compliant) along narrow, rural highways that do not have wide shoulders continue to pose a major problem for cyclists. They force cyclists to ride on the roadway, which often have high vehicle speed limits.
- Vehicle speed is always an issue, unless there is a big wide shoulder or separated path. In Montana riding the Highline across the state was scary. Crazy Montana drivers, not friendly to cyclists, high speeds, rumble strip shoulders with maybe a foot of room to ride. My worst experience when I rode my bike from Maine to Washington using Adventure Cycling’s Northern Tier route. Best place riding on that route from a cyclist standpoint- Highway 20 through North Cascades National Park… nice wide shoulders to ride on… but only in the park, once out, shoulders narrowed up.
- Pickup trucks have the WORST drivers on the road. Most of my problems with cars involve pickup trucks.
- For the road conditions in southern New Mexico its ride with ‘your head on a swivel’. There are not many bicyclists here so being very alert is the only way to ride.
- More and more people are using recumbent trikes that are 33- to 36-” wide. Bike lanes should be wide enough to accommodate them safely. More thought should go into separating cars from bikes. Many states are adopting a 30-in. buffer between bike and cars, yet few bike lanes provide for the buffer. Most lanes just have a painted line.
- I use a combination of an eyeglass mounted rear view mirror, front and rear facing daytime blinking lights and a Varia radar unit. Though not guaranteed 100%, they work well to keep me as safe as possible under the riding conditions I choose.
- One item you didn’t mention is rumble strips. They can be quite dangerous for cyclists if the shoulder is narrow, or if the rumble strip runs down the middle of the shoulder (we saw this in Montana!). Crossing or veering onto a rumble strip can cause a cyclist to crash or to swerve uncontrollably.
- Motorists often lack knowledge that cyclists are legally on the road and have rights. Driver education about how to drive when cyclists are present would be good. More important is adequate shoulders and lower automobile speeds. It is very scary to have cars passing with little or no room. Basic motorist etiquette would really help.
- The criteria for a safe road for cycling should never be the conditions that make an experienced cyclist comfortable. Roads need to be safe for everyone, regardless of their experience level. The question to ask is: would you be comfortable with your hypothetical ten-year-old niece riding on this road? If the answer is “no”, then the road is not safe.
- Vast majority of vehicle drivers are very considerate. Personally, I’ve never had negative issues, but friends of mine have. Dogs or coal-rolling- jerks are a concern, so I often ride armed. I’m more concerned about drivers making mistakes under adverse or chaotic circumstances. Ride aware and defensively as best you can.
- very little, to no, shoulder on rural roads make for uncomfortable riding when traffic is involved.
- I have cycling experience of over 25 years including multi-day tours supported and non-supported in over 15 US states including a 2-month 3,000 unsupported cross country tour.
- Way too many. Start with better prosecution of offending motorists in collision related incidents.
- I’m a huge believer in riding in and with traffic confidently. I believe in education and its benefits for teaching people the correct and safe way to ride with vehicles. I have participated and have been a trainer for Cyclingsavvy (https://cyclingsavvy.org/). Knowledge is the key to safe travels for cyclists as well as vehicle drivers.
- I’ve got to the point where I am very reluctant to share a road with any cars or trucks. Instead I look for dedicated bike/pedestrian paths that do not share a surface with car/truck traffic. Bike lanes with merely a stripe are almost as dangerous as sharing the road, and the debris thrown into that lane makes it a very hazardous ride.
- Often the only rural roads are state roadways. In my state of Georgia, the DOT has increased the number of miles with rumble strips. Rumble strips that are on the fog line and are unrideable for bicyclist. When the shoulders are narrow to none, cyclist are forced into the traffic lane. Rumble strips should be outlawed!
- Road shoulders are often forgotten on rural roads and pavement not maintained. Rumble straps sometimes not placed in a fashion that allows cyclists to ride the shoulders. Shoulders along roadways disappear at bridge crossings. Roads paved with chip seal (MANY rural roads) do not seal shoulders so surface is loose gravel and potentially dangerous depending on kind of bike and tire width.
- I cycle several thousand miles a season in Wisconsin. My biggest concern is distracted driving, and the use of cell phones by drivers.
- Riding a bike on roadways in rural areas - you are typically treated poorly, as if you don’t belong on the roadway. Our community built a rail-trail and when it was completed there were frequent comments asking bikers why they were still biking on the road now that there was a bike–ped trail. Rural attitudes need to change first before walking and biking will be safe.
- Protected bike lanes would make me want to bike more. I tend to avoid biking in the city because I feel less safe. Now I bike on bike trails or in suburban neighborhoods where there are less cars around.
- Good shoulders, low traffic volume
- Off road bike paths are favored
- Distracted drivers are my greatest concern on any road.
- When cycling out of my familiar territory I opt first for paved recreational (no-vehicle) trails, then for low volume roads with wide shoulders and slower speeds.
- Road cycling is scary AND I do it a lot! with caution and safety in group rides i.e. Princeton Freewheelers and well established routes. V interested in creating safety for bicyclists, walkers, and handicap.
- I’ve been on bicycle touring trips of 1 - 3 weeks in length for the past 11 years and ride about 2400 miles per year. If the shoulder is wide enough and there are no rumble strips or if the strips are well located so there is at least 3-4’ to ride in, I’m fine for up to 45 mph traffic. With a shoulder of full lane width, I’m even comfortable with higher-speed traffic. At the same speed, four-lane highways are safer than two-lane highways because cars nearly always move over to give riding room. Rural neighborhoods are often fine if there are no dogs because dogs are unpredictable. The best riding is on a two-lane country road with very little if any traffic and houses set well back from the road.
- I’ve noticed in the past 2 years that with a lack of a centerline road divider, a driver is more inclined to make room when passing you. When there is a centerline many drivers will not cross the line even when the road is straight and there is no oncoming traffic. The exception to that, of course, is on a blind curve or blind hill. For some reason, drivers will cross the centerline without the ability to see oncoming traffic. There is a road that was once a country road (45mph) in my area that, with housing development, has turned from a lonely country road into a main artery into town and two state routes. The local authority reduced the speed to 25mph; however, nobody but a speedy cyclist is moving at 25mph on that road. There is no berm, no sidewalk, and no lights to help with visibility at the intersections on this road. Joggers and walkers have been killed on this road. The township needs to employ some traffic calming techniques to this road.
- A top concern that was not listed for me that prevents me from cycling in rural areas is the fact that the bike lanes are not separated from cars. We commute by bike, often with our child, for almost all trips in a small town with a lot of cycling infrastructure (for the United States at least). We would love to venture out of town to visit natural areas and go camping (e.g.), but it is out of the question because of safety–namely, vehicle speeds and no separation. The lack of separation almost makes a larger shoulder/clear zone more dangerous since it induces speed for drivers. Another concern would be that of driver knowledge and unsafe engineering. Licensing is far too easy in the United States and many drivers have no idea how to behave in relation to people on bikes, rolling, or on foot and there are little to no repercussions for bad behavior. This is of course related to the lack of a culture of road safety as well which creates a feedback loop with the legal system/licensing. Further, roadway design decisions are made with priority for LOS over safety all the time. Slip lanes that make sure drivers don’t have to slow down when turning are an excellent example and pervade all over the country.
- Busy rural highways should have wider shoulders. Lately, in our state, as some highways have been rebuilt, they have been rebuilt with narrower shoulders.
- I am an enthused and confident bicyclist averaging over 100 miles a week year-round. That said, I am picky about where I ride for safety concerns.
- Most important is lower speed limits, roads designed to encourage bike awareness, separation between cars and bikes
- I think we need more questions on the driver’s license exam about cyclist. I also believe cyclist would benefit from understanding the laws that relate to them. A few bad cyclist
- the biggest concern is shoulders, i.e. a safe place to ride. Many of our rural highways do not even have a shoulder to ride on. Super scary!!! Two-lane roads, two vehicles and a bicyclist = danger!
- I don’t know if I’m getting old and timid or the traffic is getting faster and busier, and drivers less tolerant, but rides that were enjoyable a few years ago are no longer so.
- Driver awareness and respect is just as important as speed limits and infrastructure. It’s often much worse to be on a road where drivers don’t give you space even if it’s wider or less traffic or has a slower speed limit than a road where drivers do.
- Road repairs-big time. Having local towns add bike lanes not just state or county! Better drivers Ed in schools about cyclists!
- The worst condition is rumble cuts placed in the middle of the shoulder on new roads
- Ideally a dedicated cycling path separate from vehicle traffic is most comfortable for me, If a road doesn’t have an adequate bike lane I will avoid it unless I am with a group of riders and we “take” the road. I have cycled most of my life and have had close calls with vehicles getting too close trying to pass where there is not adequate room but I have only crashed once due to debris on the road.
- I live and ride mostly in a rural area outside a city. I enjoy country roads that are less traveled and have a wide shoulder. Unfortunately most of the roads I ride have little to no shoulder. For my safety I won’t ride on busy roads. I also don’t ride with more than two other cyclists at one time. The more the cyclists, the more dangerous when a car is passing the group. Drivers get impatient when they have to go slow for an extended period, and then they make bad decisions. Even riding alone I’ve encountered impatient drivers who will pass me on a curve or hill. One drove an oncoming car into a ditch. Another was a Driver’s Ed car with a student driving and the instructor telling him to pass me before the crest of a hill. I know this because I confronted the instructor.
As far as safety, I wear bright clothes. I cycle about 18 inches from the white line to give me a little cushion when passed. If a situation occurs where a driver has to be behind me for over a minute I will pull over and let him pass. I try to be considerate of the drivers. I don’t own the road either. I think cycling safety should be included in Drivers Ed courses from the perspective of the driver as well as the cyclist. - We love to bike tour and day ride in SW Wisconsin. Paved, quiet rural roads are what we love best.
- The route I listed earlier has a problem with crossing IL 47. It should have an actuated crossing beacon, or a roundabout, or at least a center refuge to only cross one lane of traffic at a time. Wait time to cross can be very long.
- Rumble strips are extremely dangerous for bicyclists! Recommend restricting their use or eliminating. The questionable safety benefit to vehicle drivers is not worth the added risk to bicyclists and pedestrians, let alone the cost to install, the increased maintenance, and the reduced lifespan of the surfacing. Also, salt use should be reduced or eliminated on roadways as it makes for much more dangerous roadways (increased slickness) for bicyclists and pedestrians, let alone the increased corrosion and environmental issues.
- 3 feet lateral to a lane painted line is enough to give me comfort
can cause motorist to dislike cyclist on the road. I live in a college town and the college students would benefit from understanding that they need to abide by traffic laws.
- People already drive too fast and are distracted. Need more paths connecting communities and wide bike lanes on shoulders of roads. Rail trails are the best!
- Although I’m very comfortable with all your scenarios, I do wish SC would adopt a program to build new rural roads with bicycle/pedestrian infrastructure structurally segregated from motorists. Existing roads (most used corridors) ought be retrofitted with the same. These separated paths ought run from urban starting point to end of road or where road changes name. The problem distraction is only growing and lack of accountability for those involve in accident/crash related situations unfortunately fosters careless choices to text-while-driving.
- My rural area is known to be hazardous for cyclists. Divers run cyclists off the roads. I only ride in the urban area in which I work.
- I live in a rural area outside the city limits of a small town. I have road-cycled for 7 years with no problems until the last year or so. It seems drivers are more aggressive, especially teenagers with big trucks, and there seems to be no respect for cyclists and no consequences for harassment. I no longer cycle solo on rural roads. I cycle in my neighborhood which fortunately is designed like a two-mile criterium track, but it gets very boring. I also ride in for fundraisers or social events. I am very interested in advocating for a paved rails-to-trails path between my town and the next larger city.
- I have very little comfort in sharing lanes with automobiles. Too many distracted/unconcerned drivers. Luckily in my area there is a very protected path that is shared with pedestrians.
- I had the accident of my life as an avid cyclist last year. I think it was a hit and run but I have no proof as I have no recall for about 2 hrs. around the crash. I was in hospital for 3 1/2 days after a helicopter flight. Fortunately, I have fully recovered. I was treating a blood clot in my left leg for about 4 months which has now cleared. The road I had the accident on was near the Roosevelt Dam, just east of Apache Junction, Arizona. The road I was riding on wasn’t hazardous in my mind. It was a 2-lane with some curves and hills, but I certainly have ridden on much worse roads in probably 60 yrs. now of riding. I’ve had several crashes (they say the average is one crash per 5,000 miles, and I ride that much and more each year). This one scared me though. Stay safe out there!
- I usually cycle during the mid-morning. Urban streets with little to no traffic. I have stopped for a bit as the number of potholes etc. Have resulted in quite a few flat tires.
- One of the worst things I have experienced is rumble strips on a narrow highway shoulder. A prime example is Minnesota State Highway 11 between International Falls and Baudette. When I rode this stretch in 2021 while on a 1,700-mile trip around the state I was dismayed by the very narrow shoulder with a rumble strip that forced me to ride in the traffic lane, keeping a constant watch in my mirror for oncoming vehicles. It was particularly discouraging because the section of highway was relatively new in the past 4 years. And, in that part of the state, there few if any alternatives to the highway.
- Making it clear to drivers that cyclists are present is essential to making it a safer biking environment (using very clear signage, painting, bike lanes, bollards, etc.)
- There should be bike/walk lanes to every school. To all new schools being built and planned for - there’s little need for kids w/in 1 mile or less to be riding a bus - let’s foster a community that walks/rides together.
- When I cycle in rural areas, the thing I appreciate most is the presence of services and restroom facilities, like convenience stores and other businesses. Wide berms and or low traffic and lower speed limits are preferable to other conditions.
- Biggest thing in South Carolina is we have had great roads to ride on for a long time but as too many people move here the change them with lights added, traffic, and even rumble strips on long roadways that have ample space on the safe side of the white lines. This takes away from what we have had and it’s not being replaced with cycling in mind for commuting or sport.
- At times it isn’t so much the road conditions that are a challenge on a bike but the tolerance level of those who drive cars on the road.
- It’s important in rural conditions to avoid unneeded impediments to traffic. Extra, maintained, space helps avoid cyclists becoming a bottleneck. Without maintenance though, it is dangerous to ride in the shoulder, forcing cyclists to take the lane. This could solve many preventable accidents
- I have thousands of miles in the last 20 years. Now I’m a leisurely rider for my enjoyment. I did triathlons and time trial road racing in my past. I’m not a mountain bike rider but I do some trails. I have rode the Silver Comet and Chief Ladiga Trails for several years and love the safety I feel.
- Question 8, ranking of elements, was difficult because there are both attractive and repellent elements. For example, as a cyclist for sport, I am drawn to good pavements, varied terrain and other cyclists and are repelled by urban areas with frequent stop signs and cross traffic; both pavement quality and cross-traffic are important to me, but for opposite reasons. I feel comfortable riding in rural areas, even without designated bike lanes and high speed limits, if the traffic is light and road surface is good. Biggest negative in rural areas is low traffic area with solid yellow lines and motorists who incorrectly believe bicyclists must travel single file (bikes here can travel two abreast in travel lane if they do not impede traffic). Rural areas tend to have people willing to yell at cyclists to ride single file.
- Much depends on the level of traffic. With low traffic, the need to be separated from cars is not so great. I avoid state highways and busy roads in favor of less traveled ways when riding for pleasure or exercise.
- Commuting requires me to mix with urban traffic and my preference is to avoid areas where bikes are pushed into traffic lanes. In extreme situations, I will use the sidewalk.
- Smooth paved bike lanes on the outsides of rural roads are the best way to promote bike safety and enjoyment.
- Adequate and consistently available shoulders or bike lanes are important. I find it frustrating to be riding on a road with a bike lane and then have it (the bike lane) end suddenly.
- I used to ride my bicycle daily before work (when I worked and shift)-I would participate in organized rides and also ride/train for races by myself-riding several hundred miles a week. Within the last few years. There has been a significant increase in motor vehicle traffic in my area-and a noticeable increase in speed and aggression toward cyclists…so I ride inside on a virtual trainer. It is a shame…
- I have a lifetime of riding and have ridden in all the scenarios presented. But that doesn’t mean I was comfortable in all of them, and someone less confident/competent will need better infrastructure than I do to feel comfortable. All the scenarios have their hazards,
- I am avid cyclist and use roads to train for races. I prefer roads over “bike paths”, because walkers (esp. with dogs) and even some cyclists seem oblivious and unpredictable. I’m usually faster than other users, but I try to communicate, slow down to pass, and be predictable in my movements. For this reason, I find vehicle traffic to be safer (more predictable).
- Having wide, well paved shoulders that are clear of gravel and other debris, is critical for high-traffic, high-speed highways. Indeed, for these roads, a rumble strip separating vehicles for the shoulder are a HUGE improvement. Lower volume and lower speed “country roads” do not need a shoulder. Thank you for this survey!
- I generally seek out low-traffic routes, and roads that accommodate cyclists (via bike lanes or more commonly paved shoulders) are a plus. There are roads I avoid due to poor pavement conditions even though they would otherwise be convenient, especially if they have high automobile speeds and/or relatively heavy traffic.
- For leisure, I seek out scenic roads with low traffic and reasonable pavement which are plentiful in my area. I live in an urban area and will cycle for errands, social, and other purposes when there is a good safe route. In recent years my community has made significant investment and progress in bicycle infrastructure allowing me to cycle more and drive less.
- Use of lights (even during daytime) is very important for rider safety.
- Better education of cyclists to understand their responsibilities. I ride 5,000 miles a year and will not ride with a lot of people because they ride down the middle of the lane and ignore signage.
- Distracted drivers are the biggest hazard.
- I do not currently ride much on rural roads because I live in the suburban Denver and there are no rural roads near me. I ride primarily on regional bike paths and streets/roads with designated bike lanes, but also on streets without bike lanes. During other times, I have ridden extensively on rural roads and prefer that to city riding.
- Having separation and lower speeds if cars are near is critical. Cyclists and pedestrians are being killed because there isn’t adequate levels of this on most roads. Especially on rural roads, cars tend to go very fast and there is little separation. Traffic calming, separation with physical strong barriers, and amenities/basic protections should be present for cyclists and pedestrians on all roads that are not restricted, in my opinion. It costs more but we invest so much money into cars as a nation, the least we can do is invest in protecting non-car users.
- I’ve sought out more bike-only trails and mountain biking trails in the last decade. My perception has been that rural roads are becoming less safe due to aggressive/distracted drivers.
- It’s useful to consult “heat maps” to help find bike routes in new areas.
- bike lanes are good, wide ones, a buffer lane is a plus! educating drivers too!
- Limited lines of site is perhaps the issue that most concerns me on rural roads, as I have less control my safety through my own behavior (e.g. - by increasing my visibility or choosing my line on the road). Warning signs for motorists to watch for bikes on such roads may be helpful.
but it’s the combination of the hazards and the rider’s assessment of that combination that sets the rider’s comfort level. For casual users with little experience, separate bike paths/lanes are best, although they come with their own hazards.
- Do not cycle much in Austin, TX, where I live, because there is a “war” between cyclists and drivers here; too many cyclist deaths, in deaths that occur the drivers who cause them are not punished. Every summer I go to Europe and ride a folding bike several hundred to a few thousand miles through several different countries. I also used to do this in the United States (e.g., TX to AK, TX to Labrador, Portland to Glacier Park to Missoula). Have not done this since before COVID.
- make wider bike lanes next to every road so we can ride safely form cars
- Road conditions in NC are terrible for bicycles. Potholes and uneven pavement are everywhere.
- 3 comments: Shoulder, shoulder, shoulder. Not hard, not expensive, Let’s all push to git ’r done.
- I am a cyclist and a bike shop owner. I love cycling and cycle every chance that I have. I would love to commute by bike more often however the main road that I live near has no paved shoulder and is in poor condition. I believe that lacking dedicated bike lanes a wide paved shoulder (3’-4’) would be the next largest enabler of safe transport by bike via rural roads.
- Better education for drivers and cyclists
- I cycle a lot of roads in the county I live in, including cities, rural, and suburbs. I have noticed with the increase in housing development the increase in traffic outside cities. The new development has generally been progressive for bike safety with lanes and lights. Unfortunately, the money going to existing trails or redevelopment on older roads has not kept up. The rural roads seem to suffer the most with decreasing maintenance and upkeep. Potholes and just plain road decay is not being addressed. This along with increased traffic and the shorter patience drivers have for anything/one slowing down their commute has left bicyclists on the short/dangerous end.
- for me, having space on the shoulder/side is the most important thing. good conditions/visibility is a great “nice-to-have.”
- I don’t ride on rural roads because there are at best narrow shoulders in my area, and often none. I would prefer physically separated paths for cars and bikes, but at a minimum I require wide shoulders and good pavement.
- Whenever possible I would choose to avoid share the road bike lanes. Many drivers have trouble sharing the road with other cars, much less a cyclist! Also…the last three illustrations do not depict a cyclist. should I assume they are squished under the cars ;)
- I avoid lanes used by motor traffic, and ride on paved shoulders even if they are dirty or not designated for bicycles.
- Q: What scares you most when riding on a rural road? A: Men under 35 in pick up trucks. I have been encroached upon and coal-rolled and yelled/sworn at. I don’t understand where their anger comes from, but it’s real. I am an experienced rider, but they present far more risk to me than some of the other conditions you have presented. And for higher speeds, I am somewhat comfortable but only when it is a short distance to connect me to the road I really want to be on. However, many rural roads, even with 55 mph speed limit, are very lightly used, and I’m fine with that.
- The rural cycling experience varies greatly by location and context. Distracted, risky and aggressive driving are the #1 issues affecting the rural cycling experience over anything else. People driving who have never cycled in traffic do not usually understand how much lateral clearance to give when passing, or how much they should slow down to pass
- I tend to bike in dense areas or very rural areas because the in between roads are the most nerve wracking. While cycling is more common in Massachusetts than in many other areas, there are also a lot of winding narrow roads in suburban areas with no room for a bike and speedy cars that I try to avoid.
- I bike early and on quiet roads. Gravel is becoming more of my routine because of safety.
- We have zero bikes may use full lane signs on our rural roads. Highway patrol treats us as if we shouldn’t be on the roads. We have witnesses this several times after being run off the road by cars.
- I cycle primarily in suburban St. Louis with occasional bike touring in Missouri and Illinois.. This summer I am planning on touring farther afield, to Wisconsin, Minnesota, and perhaps Indiana. My biggest concerns are:
- high volume roads without adequate separation for bikes, e.g., 45 MPH, two lanes in each direction, no bike lane at all. I won’t ride on roads like that, opting for the sidewalk instead, even if it is a narrow sidewalk.
- rude/aggressive drivers, folks who will intentionally close-pass (even when then have room to move left, away from me), who honk to scare me, shout at me, etc.
- Most rural roads have no physical separation between bicyclists and cars. Shoulders are frequently filled with debris that makes riding on shoulders unsafe. Shoulders are never cleared of snow. Rural road speed limits are frequently high, and drivers frequently exceed the speed limit on rural roads, which have fewer cars than urban roads of the same dimensions and characteristics.
- Safety for cyclists is largely a function of traffic volume and geometry. On low volume rural roads (< 100 ADT), a one foot shoulder maybe sufficient. As the volume and speed increase, the width of shoulder needs to increase. I ride on a lot of rural roads with no shoulder, but also very little traffic. But minimum shoulder for a County collector should be 2 feet and minimum for a rural state highway should be 4 feet. I realize that is a costly proposal, so it might make sense to focus those standards on an established “network” for cyclists.
- I know that it’s difficult to create a survey and you need a particular focus, but I was surprised that in the bike type section, gravel or all-purpose or adventure bikes weren’t included. I imagine that the aim is to gather ammunition for leverage to gain support toward road improvements that would help bicyclists, but a lot of us ride on a variety of surfaces and gravel bikes fill the bill.
- Obviously a clean wide shoulder is preferred, however if traffic volumes are very low sharing the road with cars is not too intimidating. While I will ride on rural roads periodically, my preference is a high quality limestone or paved trail, or a protected bike lane in an urban/suburban area. However riding a rural road, gives you the opportunity to be a little less isolated than a rural trail in some cases which is nice (for safety or in case of trouble).
if the conditions are too constrained. Impatience with waiting for a safe time to pass results in tailgating, close passing, or unpredictable behavior. Enhancements to the road shoulder or building side paths can help alleviate these issues, but education and enforcement are also pieces that need to be considered. Cycling routes through calmer back roads are usually preferred and can be comfortable to ride with few enhancements needed.
- I rode my bike across the country in 2015, from DC to Seattle, adapting the Northern Tier route from the Adventure Cycling Association. I found that my comfort depended entirely on the volume and speed of motor vehicle traffic. Rural riding where volume is very low does not necessarily require separation and rural riding where speed is very low does not necessarily require separation. If volume is high OR speed is high, I would feel most comfortable with separation. If volume is high AND speed is high, I won’t ride there if I can help it. Ideal separation to make bicycling safe and comfortable for all users would be an off-street multi-use trail, but a wide shoulder with rumble strip separation provided enough comfort for an enthused and confident bicyclist (me) in most situations. Wide shoulders without rumble strip separation and no/narrow shoulders were not adequate to make me feel safe.
- In this survey, I identified the worst segment in my ride across the country: US-2 in Montana between Wolf Point and Cut Bank. This segment included high volumes and high speeds with large vehicles (freight trucks), and drivers routinely engaged in reckless behavior. Additionally, policing on this stretch made it so bicyclists could not practice behavior that would keep them safe: my group was given traffic tickets outside Chinook, Montana for riding two-abreast in the lane to try to promote safe passing behavior in motorists behind us.
- I like to travel by bicycle for my vacations so often find myself cycling in unfamiliar locations. I’d love more signs alerting motorists of the presence of cyclists on popular cycling roads. Or enforced safe passing distance laws and properly place rumble strips leaving me a shoulder to ride in.
- I am more comfortable biking on vacation when visiting more liberal areas which is to say smaller vehicles. The giant pedestrian killing passenger trucks so common in some parts of the United States and the associated ego and points if you run the cyclist off the road (yelled at me once) are a huge turn off… The biggest reason I don’t bike more is that the police in most of my country utterly fail to enforce the motor vehicle laws.
- Problems with Automobiles and trucks sharing the road. Have had drivers “Roll Coal”, Tailgate, beep, or get to close when passing too often.
- Rough, poorly maintained country road will ruin my bike tires, cause flat tires, and make the biker swerve to avoid road hazards sometimes into traffic. A reasonable paved shoulder allows safer biking on highways. High traffic volume with high speeds are not safe.
- Many rural areas have roads with no/minimal shoulder, and the cyclists’ safety is heavily dependent upon the driving skills and attention to driving, or the lack thereof, of the drivers they share that road with. Additionally, some locations with adequate shoulders, have wide, sometimes continuous, rumble strips, making the remaining portion of shoulder narrow and hazardous. There has been very recent roadwork, both here in CA and in MT where I visit, that has made cycling more hazardous than it was before construction. Another issue I encounter frequently is the debris that remains after car crashes, usually remaining for long periods before it is either cleaned up, or knocked into the weeds by passing traffic. I could go on.
- Most important for traveling on rural roads is having a shoulder wide enough to set you away from the vehicles, especially if sharing road with vehicle speeds above 45 mph. Condition of roads is also important.
- Avid cyclist on the road for 40 years. More concerned now with cell phone use and aggressive drivers, so I cycle on bike trails more than roads these days.
- Rural areas in Florida have high speeds and insufficient roadways to accommodate bicyclists. On some roads, there is a rumble strip in an unfit (narrow) shoulder and this is unsafe for bicyclists. Many rural county roads have no shoulder at all, and speeds are 45+. With the growth happening in Florida in rural areas, this is even more dangerous for those who must ride on these roads.
- New Mexico has a bad habit of using partial paving on rural roads. So when there is a shoulder, it is often inhospitable to bicycling due to the poor quality of the roadway shoulders. This can be especially problematic given the high speeds, long distances that make motorists zone out, and the possible presence of rumble strips not placed properly.
- All resurfaced and new construction roads should contain a bicycle lane. Substandard road [less than 14 feet] should have a paved shoulder [escape route]. Florida should adopt the Idaho Bicycle Stop Law. I am Past President of the BPAC of Broward County, LAB LCI. and maintain a front/rear camera. Toured in Colorado, Miami/Key West, Vermont.
- I ride bike usually at urban area. The most issue that I occur is bike lane not continuous and tight width of the bike lane.
- I enjoy cycling on rural and low volume roadways. In our state this tends to be wealthy communities as well which maintain rural roadway with excellent pavement condition. Rural roadways inevitably end up being narrow so poor pavement condition is difficult to navigate.
- Not all bike paths are better. Many are slower, and inefficient when compared to a bike lane on side of the road or street. Bike lanes frequently include the following obstacles/restrictions: Curbs that require a dismount to get over, sharp drops and rises and/or stop signs whenever they cross a driveway or other road entrance for cars, etc.. I often encounter bike paths that cross a significant obstacle, such as those listed, every few hundred yards, while the road where the cars go has no similar obstacles. Also, bike paths are generally less well maintained as the streets, both in terms of paving upkeep and sweeping/clearing debris.
- Since the 1980s I have ridden many 10s of thousands of miles, raced in road cycling and cross-country mountain bike races, participated in various challenge cycling events, and have been hit by a car once (the driver failed to stop/yield at a stop sign). It is my view that the use of cell phones while driving is currently the leading cause of crashes, and the consequences will only get worse before serious attempts are made to control the behavior; this is by a large margin my greatest concern for personal injury while out riding my bike!
- Rural residents seem to be very car-centric, which is understandable; however, it’s almost anti-bike attitude.
- I will ride anywhere but I prefer cycling in rural areas. The main rural concern is road conditions, whereas is urban areas the main concern is the type of traffic and its speed, and how protected cyclists are from the cars. I think motorists need more education on sharing the road but also realize that will be difficult to accomplish. A better method would be to change the environment to make it safer for cyclists and vehicles to share the roads.
- The images for the question “How comfortable would you cycle in the following scenarios?” don’t reflect rural roads, in my opinion. I am accustomed to riding on single or two-lane roads with relatively limited traffic. When most people encounter me on the roads, they are respectful in that they give me plenty of space and slow down. I am much more concerned about unleashed dogs chasing me on rural roads than I am the traffic or road conditions. It is the opposite when I cycle in urban areas (i.e.., I’m much more concerned about traffic and road conditions).
- I used to road bike for exercise when I lived somewhere with low volume lower speed rural routes outside my town. Now where I live the road biking is mostly on high speed rural highways with narrow shoulders so I have stopped road biking. I still bike commute but when we moved here we picked a neighborhood based on the comfort level of the bike route to work, which is mostly a mix of separated trail and two lane urban streets with relatively slow (albeit heavy) traffic.
- One thing these surveys do not consider or measure very well is seasonal variability. While I ride nearly 100% of the time in summer, I tend to drive much more often in the peak of winter.
- We are in desperate need of dedicated bike lanes and/or good roads and incentives for riding over driving.
- From a rider’s perspective, rural roads often suffer from high design speeds for cars (posted speed doesn’t matter if drivers can comfortably go 50-60mph) and narrow shoulders. While those same roads can benefit from lower traffic volumes, this is increasingly not the case within easy cycling distance of me, as single-family housing continues to consume rural land. I will say that, in my experience, rural drivers tend to pass me with more room. That said, being passed at 50+ mph is never comfortable. Having cycled internationally, the best rural cycling infrastructure that I’ve encountered was in the Netherlands, where I had a multi-use path completely separated from the road - I could cycle from town to town without ever worrying about being run over by an inattentive driver. Comparing this to rural (and often non-rural) roads here, where there’s no accommodation for anyone outside of a vehicle, is frustrating. Relatedly, while painted bike lanes may be a relatively cheap and easy solution on the implementation side of things, in my experience they don’t really improve the comfort or safety of the rider. The visual mode-separation that the painted lane provides seems to unconsciously encourage drivers to pass closer, since I “have my own space”. To that end, physical separation from cars will always make a safer and more comfortable riding experience no matter where I ride. Further, while poor road condition is annoying, it’s almost not worth mentioning compared to mode-separation, from a comfort and safety perspective
- The configuration of rumble strips are an issue on cycling on rural state highways in Indiana. Some state highways are not ridable due to rumble strips taking up most of the shoulder.
- Wide road shoulders feel safest in rural areas. Where there is no shoulder, this invites aggression from drivers - mainly men in pick up trucks. I have noticed this in several different states where I ride. With better infrastructure, there needs to be consistent law enforcement. The United States does not feel safe, as a cyclist, in general.
- Would like to consider unintended effects of things like centerline rumble strips (discourages motorists from moving over when overtaking cyclists) and missing painted
- More education about how cyclists use the road legally
- The factors one considers when cycling in a rural area create an n-space within which one carves out spaces which are “comfortable enough” and “not comfortable”. For example, the pictures used in this survey show poor pavement conditions to, I assume, gather information about how riders feel about pavement condition. The pictures used showed cracked pavement in the road but not on the shoulder. That makes a huge difference. If I know there is enough volume where I am largely confined to riding in the shoulder, then pavement condition in the shoulder is a big deal. But the rural roads I ride on tend to be low-volume enough where I have the freedom to ride in the shoulder or in the road most of the time. That provides a lot more leeway to avoid rotten pavement. I don’t believe the pictures used in this survey are going to be able to capture the subtleties of that mental n-space most people consult when choosing to ride or choosing a route to ride. I tend to choose low-volume roads over almost everything else. I often ride 2-lane, 55 MPH roads in my area because I’ll get a car coming by once every 5-10 minutes or so and (almost) never two cars in opposing directions at the same time. Drivers are overwhelmingly considerate here and move into the other lane when passing at high speeds. This makes for a relatively low-stress ride (for me) despite being on a 55 MPH road. PS those Street Mix scenarios aren’t very rural. Given the size of those buildings, one is in a large city and roads are going to be busy. Even with a protected bike lane, I would still feel uncomfortable due to the volume of traffic and all the distracting stimuli assaulting the drivers and leaving less cognitive room for them to be looking out for me. Hence all my answers are “very uncomfortable”.
- Even when I go biking on a designated bike route on a rural road/highway (Natchez Trace Parkway), it feels like there is no respect for cyclists. There is no enforcement of the speed limit so cars wiz by aggressively. I feel very comfortable on rural residential/neighborhood roads because they don’t have much volume and the speeds are typically low. Typically on a rural highway with high speeds and lots of lanes, if there’s a sidewalk or shoulder, I’ll ride in that.
- Other concerns I run into frequently on rural roads are dogs, access to pit stops (gas stations, convenience stores etc.), aggressive/hostile drivers (buzzing), and inconsistent shoulders (difficult to string together a 50 or so mile route without riding on some dangerous road).
- Driver knowledge is problematic, most Tennesseans do not know that it is legal (and required) for a bike to use a road and follow traffic laws. Road width, speed and volume of cars, and lane protection are huge deterrents for road use, especially when people have large SUVs and Trucks with limited visibility. Most rural roads do not connect to any destinations unless it is a ‘stored’, in which the number of business curb cutouts make it unsafe for bikes, since the number of inattentive entering/exiting vehicles is a safety hazard.
- I rode on rural roads much more in the past but with increased vehicular traffic, distracted drivers, and increased speeding I do not ride on rural roads recreationally. I ride greenways, quiet city streets and mountain bike trails.
- having a space dedicated for bikes is the most important thing. We shouldn’t be riding in high-speed traffic without aa area specially for bikes
fog/shoulder lines (increases vehicle speed, poor vehicle lane position, difficulty selecting lane/shoulder position in inclement weather).
- The conditions of the rural roads in my area are ok for cycling. There is a lack of shoulder on all the roads and speed is not always enforced. There is also an issue of dogs that will chase you since most people with dogs in our rural area do not keep them contained.
- At a certain vehicle speed and volume, shoulders in good condition and width became critical for feeling safe. On a low volume road, shoulders become less relevant.
- I think that it is important for vehicle drivers to be aware of all roadway users and am comfortable on rural roads which are frequently used by cyclists. Most comfortable on roads with proper signage and road markings.
- I really dislike cars buzzing past me at 55+ MPH. I’ll do it if I must, but I don’t enjoy it. Will seek alternative route that doesn’t have fast moving highway traffic.
- I avoid roads with heavy traffic and/or a lot of trucks. Prefer bike lanes but many start/end without warning. Narrow paved shoulders can be dangerous in rural areas with leg trucks with extended mirrors. Have commuted to work by bike in past… scared my husband (also a cyclist) to death when I did.
- I rarely ride on rural roads on which BOTH of the following are true: (1) speed limit is >35 AND (2) there isn’t a shoulder that is paved at least 6 feet wide.
- Maintenance is key.
- I live in a rural area southeast of Tampa, FL, adjacent to a large suburban area. The main issue facing cyclists is the lack of consistent bicycle lanes on the roads that lead out of suburban area into the rural area. Most of the cycling routes take Boyette Road South to the Balm area to access more rural roads with less car traffic. The other option is to take SR640 southeast from Lithia, FL to access rural roads found adjacent to and east of CR39. Both CR39 and SR640 have large amounts (comparatively speaking) of truck traffic due to the phosphate and farming industries near both of those roads. While they both have adequate bike lanes, they are used mainly on Sundays due to there being less traffic on that day. Boyette road is used as a large group ride route at least 4 days a week but, is becoming less popular because of the increased traffic volume on that road.
- Trash cans on the shoulders. Parking in Class 2 bike lanes. Poor maintenance on shoulders compared to traffic lanes. Bicycle facilities built and then not maintained.
- I live in a suburban area. I used to live in Minneapolis, which had very good biking infrastructure. I would like to continue commuting by bike in my current Georgia suburb, but the road outside my home is full of fast-moving cars and low-visibility curves.
- Rural areas in Arizona specially the ones in South to the Border need more Share the Road signs at least to start building resilience among the community builds confidence in people to star riding bikes and driver to start understanding cycling culture. Nogales, Arizona will need more of this….people of my city want to ride more bikes but need at least more share the road signs.
- Speed and volume of motorized traffic as well as the degree of separation from that motorized traffic are the most critical aspects of a trip in any setting (rural, suburban, urban). In my experience cycling on rural roads, there is a huge difference in passing behavior, with some motorists trying to pass safely while others are very intimidating. Because of that, separation is critical.
- In my state, many rural roads have shoulders that could be safe for cycling, but government agencies claim no responsibility for nor desire to maintain such shoulders for cycling. Debris, potholes, vibration ribs, poor pavement surfaces and other safety hazards
- Interconnected routes where it’s safe for cyclists is key. Keeping off the busy roads, but still moving on safe and direct routes is greatness!!
- My main concern on rural highways is having a bit of shoulder to work with. Two-way traffic on 55mph roads where the pavement ends just a few inches outside the painted line is always a bit unnerving. Getting potholes filled early in the spring and maintaining good road condition is also high priority.
- I like to use rural roads for fully loaded tours. I live in a rural area, so all my fun rides always use them. I have commuted by bike in the past in an urban area but work from home now.
- The only way to feel safe is to design and build for safety. This requires separated lanes. Not paint. I have ridden in LA for a decade and a half, and in a small town for the same. I prefer to walk now given how dangerous rural “roads” are – which is difficult to parse: Road? Driver? Culture? Size of Vehicle? Speed of Vehicle? These are all factors that make a rural community of 10,000 far more dangerous than a city of 8 million.
- The air pressure of a passing car or truck at high speed is possibly the most uncomfortable feeling one can imagine. I will bike many miles out of my way to avoid high-traffic rural roads.
- I track bike fatalities in southern Wisconsin. In the past 20 years, there’ve been 10 fatalities on rural roads: three bicyclists on rural road is hit by car from behind; two bicyclists on rural road are hit by drunk/stoned driver (one rear end, one head on); 2 bicyclists on path hit while crossing a rural road; one bicyclist hits pothole on steep descent (no car involved); 1 bicyclist hit by car as she entered a main road from a side road; and one ebike whiskey throttle sends bicyclist into path of oncoming car.
- In my area wide shoulders, bike routes, and dedicated bike paths begin and end abruptly leaving bicyclists to navigate less than ideal stretches of road.
- I regularly cycle from home through rural areas, for training/sport purposes and adventure. I typically look for roads with paved surfaces (as I ride a road bike mostly), with light traffic and adequate shoulders. I prefer smooth roads but am okay with roads that have potholes or cracks, if those do not extend to the part of the road where I ride (i.e., the shoulder or right edge of the road). Riding paths that are separate from motor vehicle traffic, such as dedicated bike paths, are preferred.
- I feel like paved roads should always be required to have a minimum 3 foot /1 meter shoulder. I feel safer riding gravel roads since those have fewer cars, at lower speeds. Drivers that “roll coal” at cyclists, pedestrians or other drivers should be ticketed for aggressive driving. I think drivers’ safety classes and testing need to include more training on how to drive around cyclists safely and politely. I appreciate the Italian approach where a driver is automatically assumed to be at fault in any car-bike collision. I do not like the common US approach of obsessing over whether a cyclist was wearing a helmet. A helmet will not protect the rest of my body if I’m struck by a careless or aggressive driver. I’d like to see every stoplight with a controlled pedestrian crossing use a leading pedestrian interval to all pedestrians to cross safely before any cars are allowed to move. Drivers making a right turn too often assume they have the right of way even over pedestrians, or aren’t expecting anyone to cross the street, even when the pedestrian
render many shoulders dangerous and discouraging for cyclists and often force us to ride in the main lanes of auto traffic.
- Adding paved shoulders to narrow two-lane roads seems most practical here in the mountains. Dedicated bike facilities tend to rile up the haters.
- The wider the shoulder the better. Rumble strips help with confidence. I’ve cycled on busy roads with speeds above 45 confidently because the shoulders were paved, side, and had rumble strips. I’ve cycled lower speed limit roads that were nightmares because there was no shoulder and vehicles felt way too close for comfort.
has a crossing signal and has the right of way. The primary focus of US road design should not be on the LOS for drivers, but instead on the safety of nonmotorized users.


