Developing a Guide for Rural Highways: Reliability and Quality of Service Evaluation Methods (2024)
Chapter: Appendix E: Highway Facility LOS Calculation
Appendix E: Highway Facility LOS Calculation
Facility LOS
The rural highway analysis methodology retains the current service measures specific to each segment type for segment LOS determination, as follows:
- density for multilane highways
- follower density for two-lane highways
- control delay for intersections (signalized, stop-control, roundabout)
- average speed for urban streets
Thus, segment LOS is determined per the existing HCM methods, as described in Part 3 of the Guide.
Due to the lack of a common service measure across rural highway segment types, the facility LOS determination cannot be accomplished by using an aggregation method of the segment service measure values. Instead, the primary facility LOS determination is accomplished through an aggregation of the segment-level LOS values. As previously mentioned, the rural highway analysis is direction specific; that is, results are specific to a single direction, not both directions combined.
The facility-level LOS is estimated using the following four steps.
- Apply the guidance developed in this project to perform facility segmentation, i.e., partitioning the facility into its distinct segments.
- Apply the current HCM LOS methodologies for the different facility segments, estimating the performance measure and the corresponding LOS for each segment.
- Convert each segment LOS ranking to a numeric value, using a continuous scale, based on the specific service measure numeric scale.
- Aggregate the segment LOS numerical values, weighted by travel time, into an overall facility-level LOS numerical value. Convert the facility LOS numerical value to the corresponding letter ranking.
A discussion of these steps follows.
Step 1: Facility segmentation
Segment the rural facility according to the procedures documented in the previous section.
Step 2: Apply LOS procedures for facility segments
The LOS is estimated for all facility segments using the respective HCM procedures. The respective service measure value as well as the LOS are determined in this step.
It should be noted that the Guide does not make specific recommendations regarding the collection or determination of traffic demand volumes and associated parameters (e.g., PHF). Procedures and methods for obtaining traffic data and determining specific values for analysis purposes vary widely across agencies. Thus, this aspect of Step 2 is left solely to agency discretion. It is recognized, however, that it may be necessary or reasonable to implement some simplifying
approximations for this process, given the accuracy/precision compromises made in other areas of the analysis methodology to make it tractable for such long roadway routes.
Step 3: Convert each segment service measure value to LOS numeric value
Because of disparate service measures across facility segments (density, follower density, control delay, travel speed), and the range of uncertainty involved with the step-function nature of LOS, we propose a modification to the LOS value for the purpose of aggregating into a facility value.
This modification consists of treating the LOS as a continuous variable, with the exact value determined using the segment-specific service measure. To address the different ranges assigned for various levels of service, these ranges are normalized to represent a 1.0 increment each on the LOS scale. Figure E-1 through Figure E-6 show how the service measure LOS scale is converted to a continuous LOS numeric value for the different types of facility segments. For example, in Figure E-1, the lower ‘Density’ scale corresponds to the HCM LOS density thresholds used for multilane highways. The upper scale is the LOS continuous scale used in this methodology to evaluate the quality of service. In this case, the density range for any LOS (e.g., 18 to 26 for LOS C) corresponds to a 1.0 increment between 2.0 and 3.0 on the LOS upper scale. Intermediate values are calculated using linear interpolation. So, if the density on a multilane highway is 20 pc/mi/lane, then it corresponds to 2.25 on the continuous LOS scale, calculated as follows.
| [E.1] |
This approach provides the ability to perform a quantitative aggregation of the LOS values across segment types that do not have a consistent service measure into a facility LOS value.
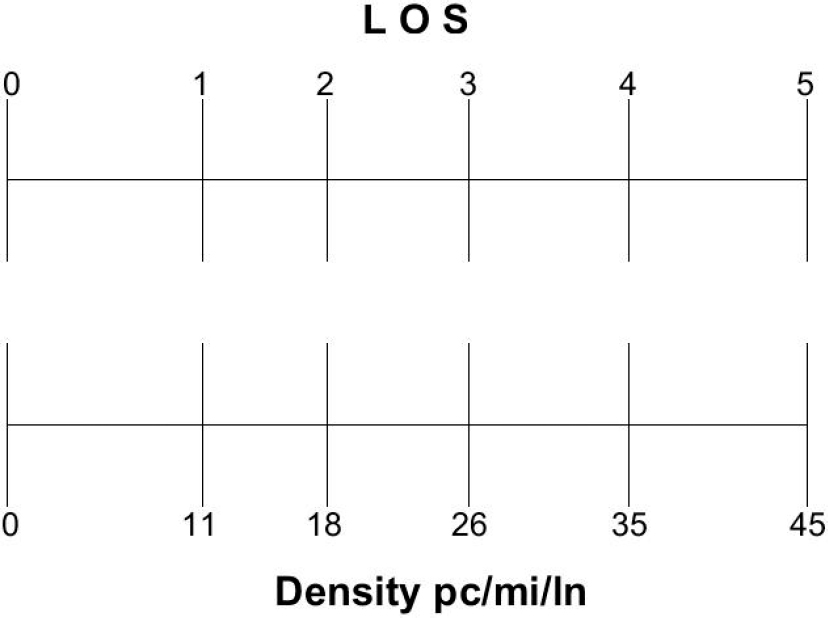
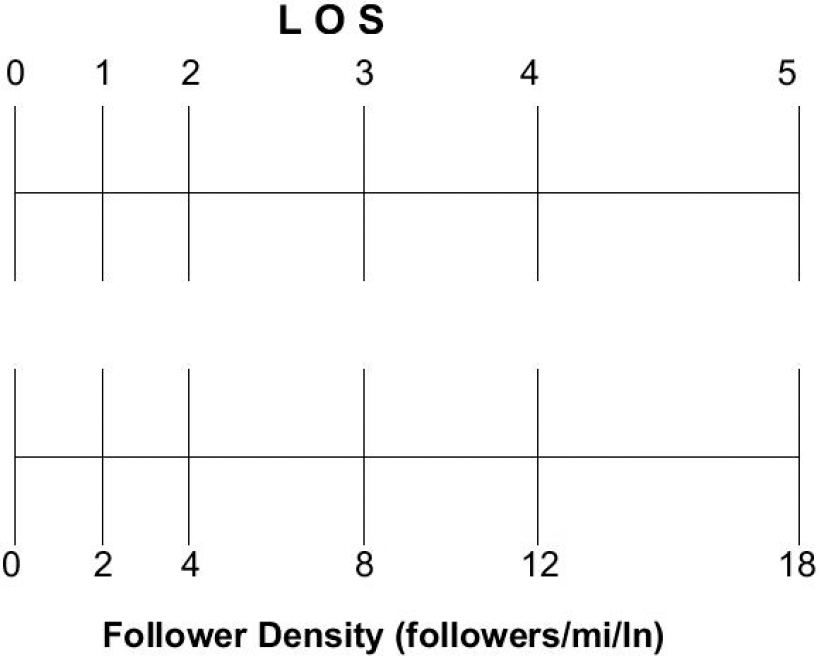
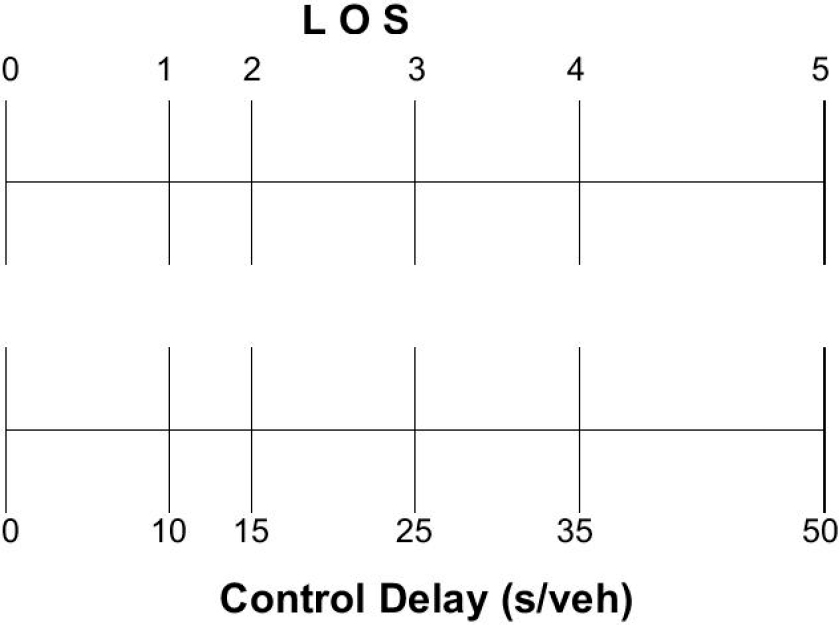
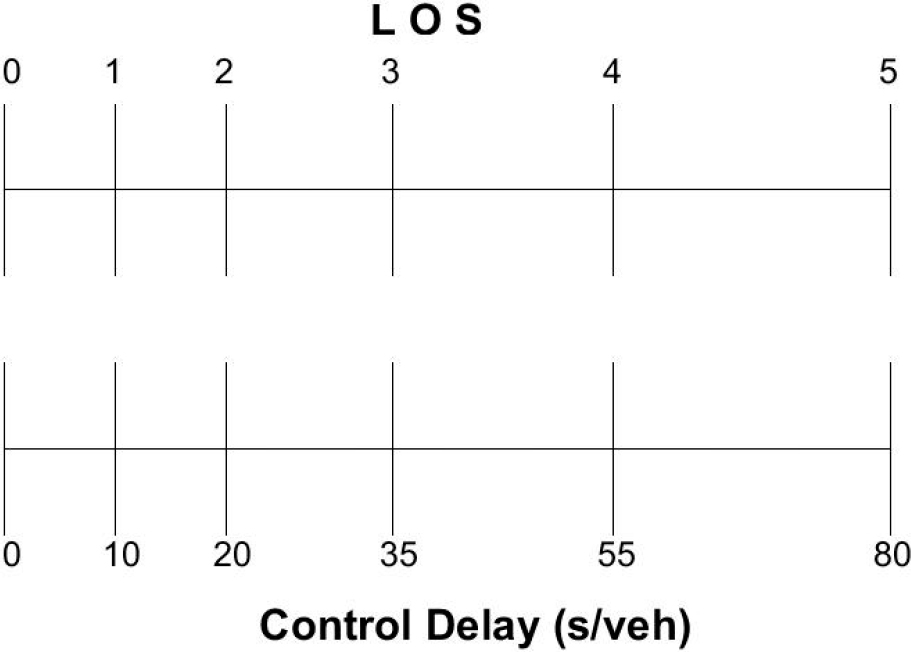
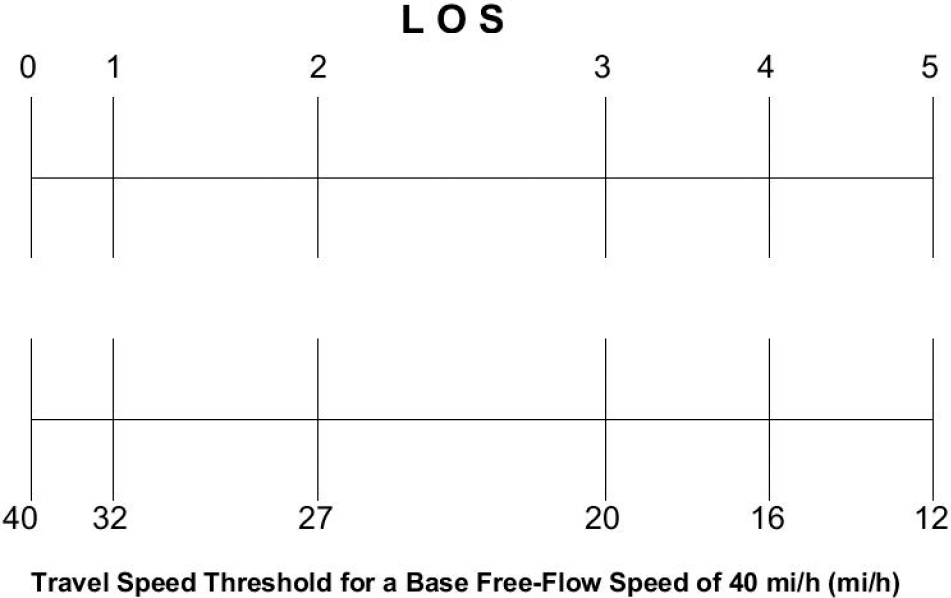
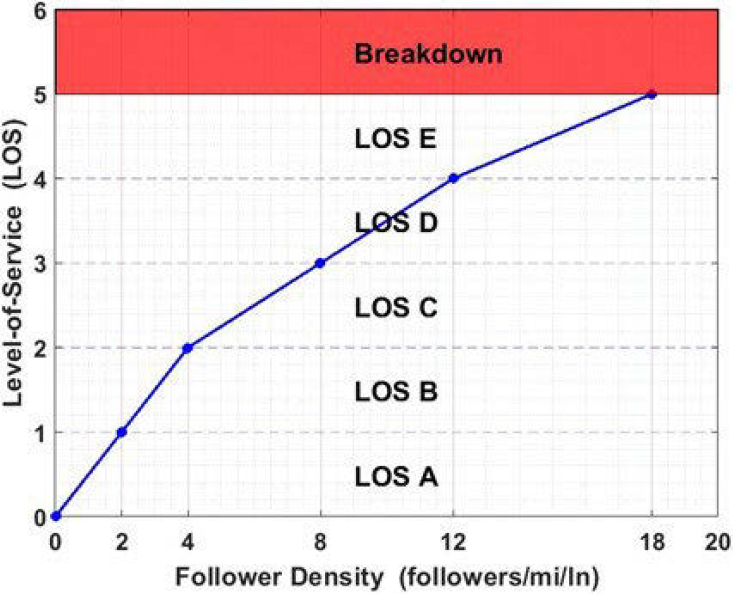
Figure E-6 illustrates the continuous LOS function for two-lane highway segments using the follower density service measure. Functions for the other segment types are developed in a similar manner. The LOS numeric value, referred to hereafter as LOS score, for a two-lane highway segment with a follower density of six followers/mi/ln would be 2.5, for example.
Step 4: Calculate the facility-level LOS
The results from step 3 are used in estimating the quality of service on the rural facility using a composite LOS for the rural corridor in question.
Two approaches for this aggregation were considered.
Option 1
The segment LOS scores, weighted by travel time, are averaged to arrive at the facility LOS. Weighting by travel time is more realistic with driver perceptions than using a straight arithmetic average of segment LOS scores, or even weighting by segment length. The calculation for the facility LOS is given by the following three equations.
| [E.2] |
Where:
LOSFac = Facility LOS score
LOSscorei = Numeric LOS score for segment i
n = Number of segments in the facility
PropTravelTimei = Proportion of travel time for segment i relative to the total travel time
for the facility, calculated as follows.
| [E.3] |
It is also proposed that the facility LOS should be sensitive to the consistency, or lack thereof, of LOS from one segment to another along the length of the facility. For example, a facility that consists of multiple segments all operating at LOS C except for one or two segments operating at LOS B or D, is preferable from the quality-of-service perspective than the same facility with the same composite LOS but with frequent changes in segment levels of service. A proposed measure to capture the fluctuation in segment-level LOS both in frequency and magnitude is the LOS constancy, defined by the following equation.
| [E-4] |
Where:
LOSConstancy = Consistency of LOS while traversing successive facility segments
LOSvaluei = LOS for segment i
LOSvaluei−1 = LOS for segment i − 1 (upstream of segment i)
The lower the LOS Constancy value, the less overall variability in LOS values across the facility segments. Thus, generally, lower values are indicative of a more desirable operational condition. While the standard deviation (or variance) captures the variability in LOS, the LOS constancy captures not only the variability in LOS, but also the frequency of the change. This is explained in the following hypothetical example using the values in Table E-1. To simplify the example, LOS was expressed as a discrete variable (using a continuous variable will provide a more precise estimation).
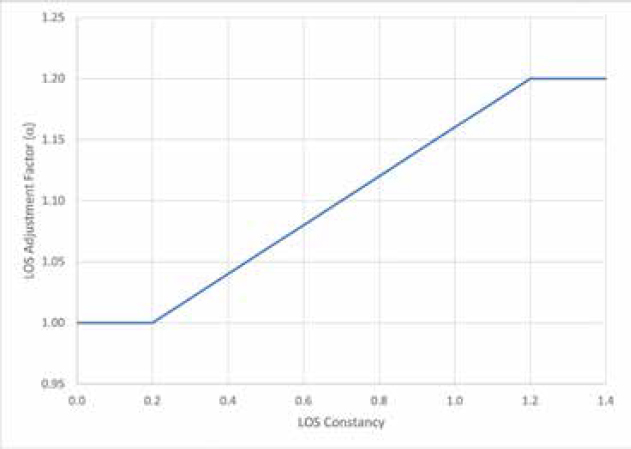
This aspect of the facility-level quality of service is incorporated in the analysis by adjusting the composite facility-level LOS using an adjustment factor, in the form of multiplier, to account for LOS Constancy along the facility. This adjustment factor is determined using a scale (1.0 to 1.2) and is a function of the consistency of segment LOS values as motorists traverse the facility in each direction. This multiplier adjustment factor α is set according to Table E-2 and is also illustrated in Figure E-7.
Table E-1 LOS Constanc Exam le Calculations
| Component | LOS (Letter) | LOS (Value) | LOS Change | Component | LOS (Letter) | LOS (Value) | LOS Change | |
| 1 | B | 1 | --- | 1 | C | 2 | --- | |
| 2 | B | 1 | 0 | 2 | C | 2 | 0 | |
| 3 | B | 1 | 0 | 3 | B | 1 | -1 | |
| 4 | C | 2 | 1 | 4 | C | 2 | 1 | |
| 5 | C | 2 | 0 | 5 | B | 1 | -1 | |
| 6 | C | 2 | 0 | 6 | D | 3 | 2 | |
| 7 | C | 2 | 0 | 7 | C | 2 | -1 | |
| 8 | C | 2 | 0 | 8 | D | 3 | 1 | |
| 9 | C | 2 | 0 | 9 | C | 2 | -1 | |
| 10 | C | 2 | 0 | 10 | B | 1 | -1 | |
| 11 | D | 3 | 1 | 11 | C | 2 | 1 | |
| 12 | D | 3 | 0 | 12 | D | 3 | 1 | |
| 13 | D | 3 | 0 | 13 | C | 2 | -1 | |
| 14 | D | 3 | 0 | 14 | D | 3 | 1 | |
Table E-2. LOS Constancy Adjustment Value
| Adjustment Factor Value (α) | LOS Constancy Value |
|---|---|
| α = 1.0 | LOS constancy ≤ 0.2 |
| α = 0.96 + 0.2 × LOS Constancy Value | 0.2 < LOS Constancy < 1.0 |
| α = 1.2 | LOS Constancy ≥ 1.0 |
Option 2
Again, the segment LOS scores are weighted by travel time. The key distinction in this approach from Option 1 is how segment LOS variability is factored into the calculation of overall facility LOS. The facility LOS score calculation for this approach is as follows.
Calculate the segment travel time weights,
| [E-5] |
Where:
TTi = Travel time for segment i
TTSeg = Average segment travel time for all segments in the facility
n = Number of segments in the facility
Calculate the facility LOS score,
| [E-6] |
Where:
LOSFac = Facility LOS score
LOSscorei = Numeric LOS score for segment i
Note that the sum of the travel time weights (the denominator value of the above equation) should also be equal to n (number of segments in facility). Thus, the denominator of this equation could be simplified to just use n.
This calculation is similar in concept to the calculation of a standard deviation for weighted values. However, rather than calculating the deviation of segment LOS scores relative to the segment mean LOS score, it is referenced to a value of zero, which corresponds to the best LOS A score. This calculation simultaneously accounts for weighting the segment LOS scores by travel time and the variability of segment LOS scores across the facility. For a facility with all segment LOS scores equal, the facility LOS score will simplify to just the mean of the travel time weighted segment LOS scores (also equal to an individual segment LOS score), considered to be the base LOS score. For facilities with variability in segment LOS scores, the resulting facility LOS score will typically range from 5-20% higher than the base LOS score.
Based on numerical experimentation with a variety of facility compositions and segment levels of service, it was found that the differences in facility LOS scores are generally very small. Although the calculation process for Option 2 is more efficient than that for Option 1, Option 1 was chosen for implementation because it would be easier to understand for the practitioner.


