Developing a Guide for Rural Highways: Reliability and Quality of Service Evaluation Methods (2024)
Chapter: Appendix A: Literature Review and Current Practices
Appendix A: Literature Review and Current Practices
Introduction
A comprehensive review of the literature was conducted to identify studies relevant to the focus of this project. Such studies were reviewed to determine if there were elements that could inform the direction of this project. It should be noted that while there is a considerable body of research focused on various performance measures and the analysis of essentially homogeneous lengths of highway, the body of literature is quite limited with respect to extended lengths of highway with significantly varied segment types. This appendix provides a summary of these studies. This section is organized to identify studies relevant to the following topic areas:
- Facility-Level Service Measures for Motorized Vehicles
- Rural Highway Segmentation
- Segment Bottleneck Treatments
- Reliability for Motorized Vehicles
- Quality/LOS for Bicycles
Facility-Level Service Measures for Motorized Vehicles
This section discusses material that is relevant to the topic of performance measure selection at the highway facility level.
NCHRP Project 17-65
NCHRP Project 17-65, Improved Analysis of Two-Lane Highway Capacity and Operational Performance, (National Academies of Sciences, Engineering, and Medicine, 2018) resulted in a new two-lane highway analysis chapter (Chapter 15) for the Highway Capacity Manual (HCM7) (TRB 2022).
In this project, a single, new, service measure was introduced—follower density. Follower density is density multiplied by the percentage of vehicles in a following status. Because of the unique characteristics of two-lane highways and the wide range of platooning characteristics that can result for any given level of traffic demand, follower density more accurately captures the quality of operating conditions than density alone. Follower density has also gained appeal in some other countries (e.g., South Africa, Spain, Brazil, Japan).
Additionally, improvements were made to the estimation of the other significant variables in the calculation of follower density, namely, average speed and percent followers. A more realistic speed-flow relationship, versus the previous linear form, was developed. This new relationship is non-linear in form and consistent with findings from other countries. The specified mathematical function for this relationship works for both passing lane and non-passing lane segment types (one has a concave shape and the other a convex shape). The threshold value for percent followers was reduced from the previous value of 3.0 seconds to 2.5 seconds. This new value was found to better identify following status when the combination of headway and speed were considered for trailing vehicles.
- A major revision was the establishment of an analysis framework that was more amenable to a facility-level analysis approach than the previous analysis methodology. This framework provides for subdividing an extended length of two-lane highway into multiple contiguous segments of different types (passing constrained, passing zone, passing/climbing lane) that can be analyzed individually and collectively. The
following calculation [Eq. 1] was proposed for assessing the LOS of two-lane highway facility. This calculation applies only to two-lane highways without influence from traffic control devices (e.g., traffic signal, roundabout, or STOP sign controlling highway traffic).
| [A-1] |
Where:
FDF = average follower density for the facility in the analysis direction (followers/mi).
FDi = follower density, or adjusted follower density, for segment i in the analysis direction (followers/mi); and
Li = actual segment length for segment i (mi).
FDF is used with Exhibit 15-6 (HCM7 Chapter 15) to determine the facility LOS.
German Highway Capacity Manual (HBS, 2015)
The German Highway Capacity Manual “Handbuch für die Bemessung von Straßenverkehrsanlagen (HBS)” (FGSV, 2015) has methodologies to assess the quality of service on rural highways at the segment level and facility level. Rural highway facilities could be composed of highway segments (two-lane, three-lane [aka 2+1 highway] and/or multilane highway) and intersections (signalized, non-signalized and/or roundabouts).
For highway routes, density (i.e., flow rate/average speed of passenger cars) is used as the service measure. Different speed-flow relationships are determined for each highway route; and the relationships depend on the geometric attributes that influence traffic operations at each specific segment. For two-lane highways, vertical and horizontal alignment classes are used, while number of passing lanes and vertical alignment class are proposed for three-lane highways. Two-lane and three-lane highways have the same set of density thresholds to determine levels of service. In case of multilane highways, speed-flow relationships depend on speed limit and the set of thresholds has higher density values. While German researchers involved with the HBS have acknowledged that follower density is a more informative performance measure for two-lane highways, it was decided to use the single measure of density across all facilities for the purpose of simplifying comparisons between facility types. Delay is used as the service measure for intersections (signalized, non-signalized, roundabouts) at rural highway routes. Signalized and non-signalized intersections (including roundabouts) have a different set of delay thresholds to evaluate LOS.
South African National Roads Agency Limited
South Africa employs a common service measure, follower density, across all uninterrupted-flow segment types (for two-lane highways, multilane highways, and freeways). The criteria for classifying follower status (for quantifying percent followers) are as follows:
- Following gap must be shorter than 3 seconds and
- Speed differential must be either negative or smaller than +20 km/h. The speed differential is defined as the speed of the leading vehicle minus the speed of the following vehicle.
For consistency, these same criteria are used across all uninterrupted-flow segment types.
Rural Highway Segmentation
This section discusses material that is relevant to the topic of developing guidance for the segmentation of rural highways.
NCHRP Project 17-65
One of the key advancements of the new two-lane highway analysis methodology developed from NCHRP Project 17-65 (Washburn et al. 2018) versus the previous HCM methodology is an analysis framework more amenable to a facility-level analysis. Segments can be analyzed individually, and multiple contiguous segments (in the same direction) may be combined to analyze a longer section with varying characteristics as a facility. Two-lane highway segment types are defined as follows:
- Passing Zone: Length of two-lane highway for which passing in the oncoming lane is permitted, and the length and location of such passing zone provides reasonable accommodation of passing maneuvers under certain traffic conditions.
- Passing Lane: This segment type consists of an added lane in the same direction as the analysis direction, with the intent to break up platoons that have formed upstream by allowing faster vehicles to pass slower vehicles.
- Passing Constrained: Length of two-lane highway in which passing in the oncoming lane is either prohibited or effectively negligible due to lack of utilization of passing zone(s). The latter might be due to insufficient sight distance and indicates an area where passing should be formally prohibited.
This project developed methods for adjusting the performance measures on segments downstream of a passing lane, but not for other types of upstream segments. This project did not address the issue of the effects of intersections on two-lane highway performance measures.
Influence Area of Intersections Within Highway Route
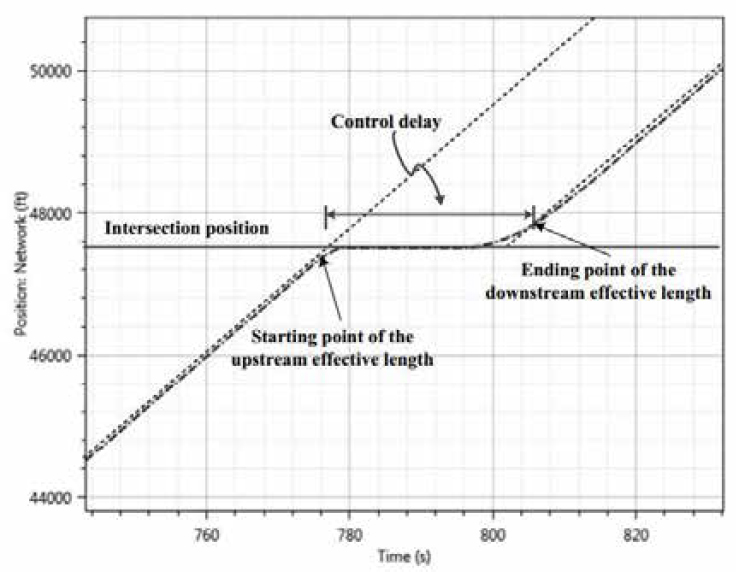
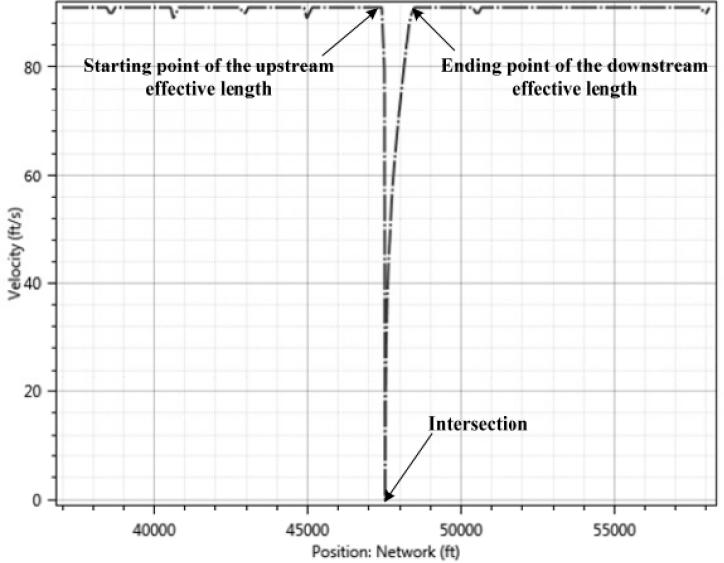
Yu and Washburn (2009) and Li and Washburn (2014) proposed a method to address the impact of signalized intersections on two-lane highway operations. In this approach, intersections are treated as a segment of the highway rather than a point location and the effective influence area upstream and downstream of the signal is determined, as illustrated in Figure A-1 and Figure A-2.
Percent delay (PD) was chosen as the two-lane highway facility performance measure because it can be applied to all possible situations encountered on a two-lane highway facility. PD is the ratio of delay to free-flowing travel time which gives more information about the operational conditions than total delay alone because it compares unfavorable time spent traveling to favorable time spent traveling.
NCHRP 3-100: Evaluating the Performance of Corridors with Roundabouts
Team member Kittelson & Associates completed NCHRP Report 772: Evaluating the Performance of Corridors with Roundabouts, which includes field evaluations of nine roundabout corridors, and provides performance measurements and evaluation methods to comprehensively evaluate the performance of a series of roundabouts in a corridor. The evaluation method is compatible with
the framework in the Urban Streets chapter of the 2010 HCM. The project also includes a corridor comparison framework that practitioners can use to objectively compare the performance of a corridor using roundabouts, traffic signals, and/or stop-controlled intersections.
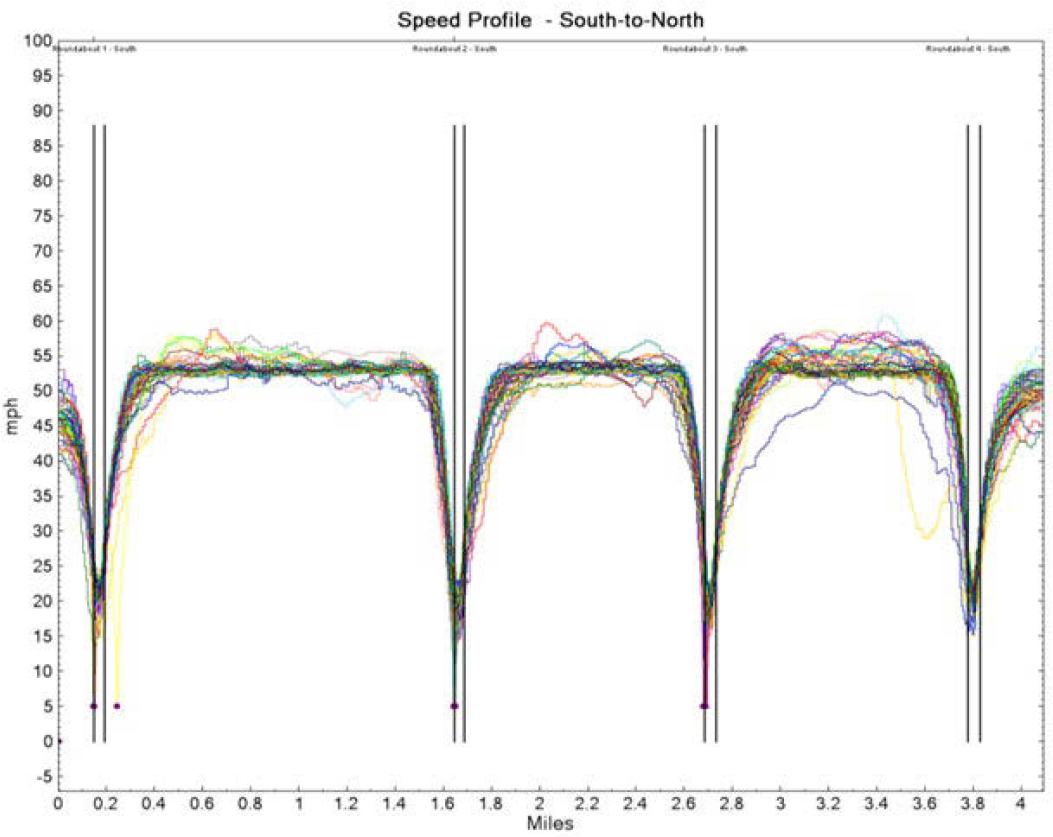
As part of NCHRP Project 3-100, Kittelson & Associates collected high-resolution trajectory data to support the identification of roundabout influence areas. Figure A-3 clearly shows how speeds drop in the vicinity of roundabout locations along a rural stretch of SR-539 in Washington State.
German Highway Capacity Manual (HBS, 2015)
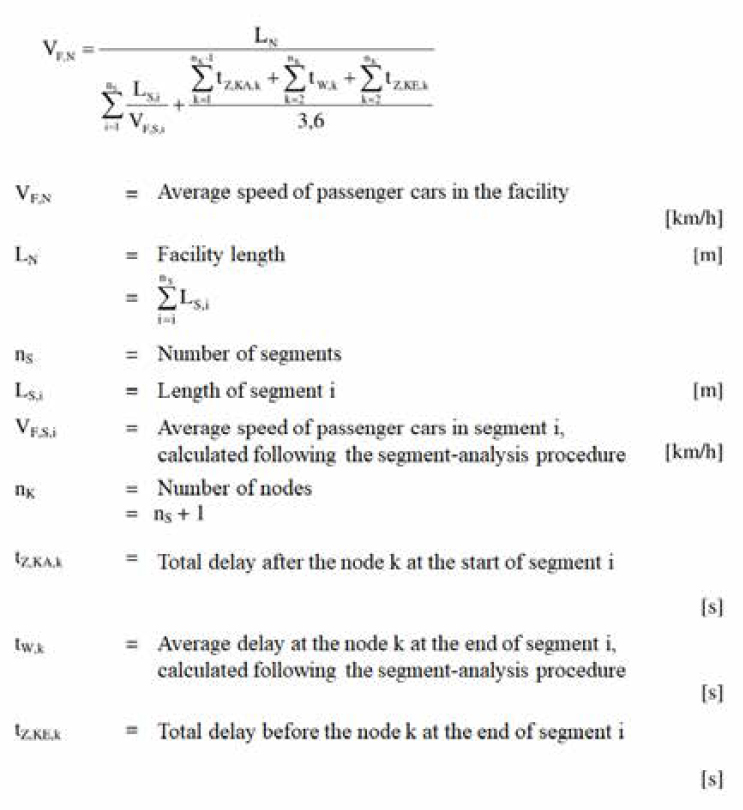
For facility-level analysis, which can include intersections, speed index is selected as the service measure. The speed index is calculated as the ratio of the average speed along the facility to the target average speed for the facility category. Four rural facility categories are defined based on their functionality: interstate, inter-regional, regional, and local facilities, following the context and functional classification for freeways, highways and streets as defined in the German Guidelines for an Integrated Network Design “Richtlinien für integrierte Netzgestaltung” (FGSV,
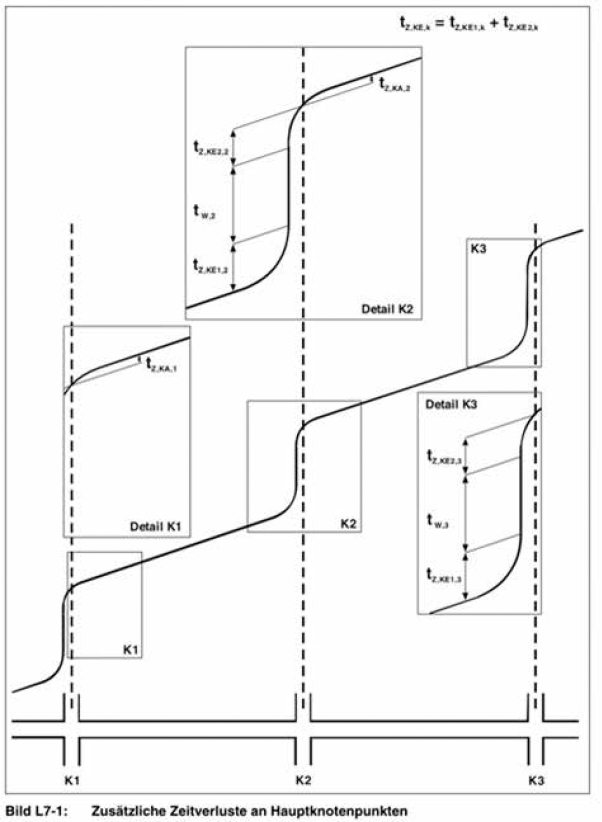
2008). The same context and functional classification are used for geometric design of rural highways per the German Green Book “Richtlinien für die Anlage von Landstraßen” (FGSV, 2012). To obtain the average speed, the facility length is divided by the time required to travel along the whole facility. Specifically, they use average speed of passenger cars at the highway routes and their respective length, delay at intersections (K2 in Figure A-4) and delays at the beginning (K1 in Figure A-4) and the end of each highway route (K3 in Figure A-4). This process is illustrated in the following two figures.
The HBS does not contain a method for reliability analysis.
South African National Roads Agency Limited
South Africa does not have an explicit facility-level methodology for highways. The common service measure, as mentioned above, does facilitate easier comparison between segment types and provides for some possibility of analyzing a combination of contiguous segments of varying types. Their analysis methods do not address the consideration of intersections intermixed with uninterrupted-flow segments.
Reliability for Motorized Vehicles
As discussed in Appendix A, there were two different contexts in which the term ‘reliability’ was discussed during the kick-off meeting. The research team discussed the concept in the same context as it is used in the HCM. Some oversight panel members discussed the concept of reliability in terms of assessing how different geometric treatments affect operations, such as the configuration of driveways that connect to the highway and inclusion of left-/right-turn bays for turning off the highway. The following subsection section focuses on the latter context.
Reliability in the Context of Segment Bottleneck Treatments
For some background relevant to this context, the previous version of HCM Chapter 15 (Two-Lane Highways) included an appendix (Design and Operational Treatments) that discussed turnouts, shoulder use, wide cross sections, intersection turn lanes, and two-way left-turn lanes. This material was essentially duplicated from a report by Harwood and Hoban (1987). This material, unfortunately, largely provides a qualitative overview of the impact of these treatments on two-lane highway operations. Because of the general lack of quantitative guidance and age of the material, this appendix was omitted from the new HCM Chapter 15 developed from NCHRP Project 17-65.
There have been several NCHRP-funded projects that examined driveway and turn lane design issues for highway corridors; however, these studies are generally focused on geometric design and safety elements. Operational issues are largely discussed only in qualitative terms. A summary of these studies follows.
Bonneson and Fontaine (2001) developed an engineering study guide for evaluating intersection improvements, as part of NCHRP Project 3-58. The objectives of the guide are “(1) to define the steps involved in an engineering study of a problem intersection and (2) to provide guidelines for using capacity analysis or simulation to determine the most effective alternative on the basis of operational considerations.” This guide provides several warrants to assist with identifying when turn lanes may be appropriate, and if so, how much storage they should provide. Warrants are also provided to assist in identifying the appropriate type of intersection (signalized, stop-controlled, roundabout).
Fitzpatrick et al. (2014) examined design guidance for intersection auxiliary lanes. This work was performed under NCHRP Project 3-102. The results of this project expand on guidance provided in the AASHTO Green Book and highlights information regarding bypass lanes, channelized right-turn lanes, deceleration and taper length, design and capacity of multiple left-turn lanes, and alternative intersection designs.
Fitzpatrick et al. (2013) developed guidance for the selection and design of left-turn accommodations at unsignalized intersections, as part of NCHRP Project 3-91. The report includes 11 case studies of typical situations that illustrate the use of the guidance.
Gattis et al. (2010) developed a design guide as a by-product of the research for NCHRP Project 15-35, “Geometric Design of Driveways.” This guide provides recommendations for the geometric design of driveways that consider standard engineering practice and accessibility needs and provide for safe and efficient travel on the affected roadway. The research included a literature review, a survey of street and highway departments, and field studies leading to an improved understanding of the state of the practice. This guide presents changes to that state of practice based on the evolving requirements for driveways.
The report includes driveway-related terms and definitions, an examination of basic geometric controls, a summary of access spacing principles, and detailed discussions of various geometric design elements. This publication complements documents such as the AASHTO Policy on the Geometric Design of Streets and Highways and the Access Management Manual. This guide is intended for use in both the public and private sectors.
Kikuchi and Chakroborty (1991) examined warrant criteria for justifying a left-turn lane on a major two-lane roadway that intersects a minor roadway, in a ‘T’ configuration. Three criteria were considered: (a) probability that one or more waiting through vehicles are present on the approach; (b) delay (average delay to the "caught" through vehicles, average delay to all through vehicles, and delay savings due to the left-turn lane); and (c) degradation of the LOS. Volume
combinations (through, left-turn, and opposing flow) that would justify a left-turn lane under each of the criteria are presented.
Other References
The following references may be applicable to the simplified planning approach for reliability discussed in Appendix A. If the oversight panel chooses to go in that direction, we will examine these references in more detail.
Introduction to the National Performance Management Research Data Set (NPMRDS). (Aug. 2013) FHWA Office of Operations and Resource Center and John A. Volpe National Transportation Systems Center, US Department of Transportation, and Nokia Company HERE. https://connectdot.connectsolutions.com/p27329s6h9l/.
Kaushik, Kartik, Sharifi, Elham, Young, Stanley Ernest. (Jan. 2015) “Computing Performance Measures with National Performance Management Research Data Set.” Transportation Research Record, vol. 2529, no. 1, pp. 10–26, doi:10.3141/2529-02.
ABSTRACT: The NPMRDS was procured by the FHWA Office of Operations in 2013. NPMRDS initially served as a research data set for sponsored programs, but rights to use the data set were secured for state departments of transportation and metropolitan planning organizations in anticipation of the performance measure requirements of the Moving Ahead for Progress in the 21st Century Act. NPMRDS is a form of commercial GPS probe data; that is, the traffic conditions are derived from vehicles that periodically self-report speed, position, and heading with GPS electronics. NPMRDS differs from commercially available data feeds in that FHWA specified that no smoothing, outlier detection, or imputation of traffic data be performed. As a result, NPMRDS contains unique characteristics for statistical distribution of reported travel times. These are characteristics such that traditional processing techniques are ineffective in obtaining accurate performance measures. This paper proposes a method for handling the challenges posed by NPMRDS and computing meaningful performance measures from it. The paper first exposes the challenges in processing NPMRDS data and defines a method for overcoming the challenges. The paper compares the results from the proposed method with traffic data from commercial probe data sources and a reference reidentification data source at two case study locations. The case studies indicate that this paper successfully shows the ability to capture performance measures from NPMRDS more accurately with techniques originally developed to accurately reflect travel time and travel time reliability on interrupted-flow facilities.
W. Zhao, E. McCormack, D.J. Dailey, E. Scharnhorst. (2013) “Using truck probe GPS data to identify and rank roadway bottlenecks.” Journal of Transportation Engineering, ASCE. vol. 139, pp. 1-7. DOI: 10.1061/(ASCE)TE.1943-5436.0000444.
ABSTRACT: This paper describes the development of a systematic methodology for identifying and ranking bottlenecks using probe data collected by commercial global positioning system fleet management devices mounted on trucks. These data are processed in a geographic information system and assigned to a roadway network to provide performance measures for individual segments. The authors hypothesized that truck speed distributions on these segments can be represented by either a unimodal or bimodal probability density function and proposed a new reliability measure for evaluating roadway
performance. Travel performance was classified into three categories: unreliable, reliably fast, and reliably slow. A mixture of two Gaussian distributions was identified as the best fit for the overall distribution of truck speed data. Roadway bottlenecks were ranked based on both the reliability and congestion measurements. The method was used to evaluate the performance of Washington state roadway segments and proved efficient at identifying and ranking truck bottlenecks.
Zhen Chen, Wei David Fan. (2020) “Analyzing travel time distribution based on different travel time reliability patterns using probe vehicle data.” International Journal of Transportation Science and Technology. Volume 9, Issue 1, Pages 64-75, ISSN 2046-0430, https://doi.org/10.1016/j.ijtst.2019.10.001.http://www.sciencedirect.com/science/article/pii/S2046043019301121
ABSTRACT: Travel time distribution (TTD) has been widely used to represent the traffic conditions on freeways and help to analyze travel time reliability (TTR). The goal of this study is to develop a systematic approach to analyzing TTD on different types of roadway segments along a corridor. By examining the historical TTR pattern using planning time index, four typical segments are identified and selected first. The distributions of travel time are then analyzed under different time of day, day of week, segment location and weather. The goodness-of-fit tests of different distributions are then conducted, and the results indicate that Burr distribution can provide highest acceptance rate with the consideration of different times of day and days of week. The results also indicate that Burr distribution can provide highest acceptance rate with the consideration of different weather conditions. This study can provide the insightful information about TTD characteristics under different scenarios, and the results can also help transportation planners make informed decisions.
George F. List, Billy Williams, Nagui Rouphail, Rob Hranac, Tiffany Barkley, Eric Mai, Armand Ciccarelli, Lee Rodegerdts, Katie Pincus, Brandon Nevers, Alan F. Karr, Xuesong Zhou, Jeffrey Wojtowicz, Joseph Schofer, and Asad Khattak. (2014) Establishing Monitoring Programs for Travel Time Reliability. TRB’s Second Strategic Highway Research Program (SHRP 2) Report S2-L02-RR-1. Transportation Research Board, Washington, DC. 120 pages. DOI: 10.17226/22612. https://www.nap.edu/catalog/22612/establishing-monitoring-programs-for-travel-time-reliability
ABSTRACT: This report documents the research of the L02 project, Establishing Monitoring Programs for Travel Time Reliability. The main work product from the project is the Guide to Establishing Monitoring Programs for Travel Time Reliability. The Guide discusses how to develop and use a travel time reliability monitoring system (TTRMS). (Accompanying the Guide is a brief, stand-alone document that provides suggestions for communicating information about time travel reliability using maps, figures, and tables. The document, Handbook for Communicating Travel Time Reliability Through Graphics and Tables, and the Guide are available at http://www.trb.org/Main/Blurbs/168764.aspx.) The purpose of this report is to describe the process that led to the development of the Guide and the Handbook.
A TTRMS can help operating agencies monitor system performance, understand the impacts of the various factors that influence travel time, and provide credible information to the system users about what TTR to expect. With this information, operating agencies
can make better decisions about what actions to take to help improve reliability. At the time this research was performed, most transportation agencies did not have these capabilities.
One of the most important findings of the L02 project is that reliability is best described by creating holistic pictures such as probability density functions (PDFs) and their associated cumulative density functions (CDFs). Thus, rather than characterize reliability in mathematical terms, graphs of the PDFs and CDFs make it easy for one to visualize reliability and various regimes consisting of different combinations of congestion levels and types of nonrecurring events (e.g., incidents, weather, and work zones).
The research began with a survey of the state of the art and state of the practice in TTRMS worldwide. The team then focused on the TTRMS, and its primary functions listed above. Finally, the team sought to validate the TTRMS concept by building prototypes of elements of the TTRMS in five locations: San Diego, Sacramento and Lake Tahoe, Northern Virginia, Atlanta, and New York City. Systems that can be used to develop distributions of travel times over long periods, for both highway segments and travel from origins to destinations, will be the foundation for analysis and decisions that improve reliability.
Quality/Level of Service for Bicycles
This section discusses material that is relevant to the topic of quality and/or LOS for bicycles in rural highways. Three approaches to evaluate the quality of service for bicycles are included: Bicycle LOS (BLOS), Bicycle Compatibility Index (BCI) and Level of Traffic Stress (LTS). An overview of BLOS in urban and rural areas is provided by Kazemzadeh et al. (2020).
Bicycle Level of Service (BLOS)
The most common approach to evaluate the LOS for bicycles is the BLOS, first proposed by Botma (1995) in the Dutch Manual on Bicycle Infrastructure. This measure of quality was developed adapting the US-HCM concept of LOS for bicycles. After considering mean speed, density or percent of bicyclists following, the selected performance measure was hindrance. This measure uses frequencies of events between bicyclists and other facility users to arrive at various levels of service.
In the United States, Allen et al. (1998) recommended the frequency of events (passings and meetings) for uninterrupted off-street bicycle facilities. Hindrance depended on bicycle traffic volume in the same and opposite direction. For on-street bicycle facilities, they suggest complementing the frequency of events with the impact of prevailing geometric and traffic conditions on the average and standard deviation of bicycle speeds.
BLOS is the performance measure for bicycle operations used in the HCM (TRB 2015). Specifically, Chapter 15 presents a method for evaluating bicycle operations on two-lane and multilane highways, which is applicable to bicycle operations in a shared lane, bicycle lane or paved shoulder. The analysis procedure for bicycle operations at urban streets is presented in Chapters 16 and 18 and bicycle operations on exclusive or shared-use paths separate from the highway are included in Chapter 24, Off-Street Pedestrian and Bicycle Facilities.
The performance measure for BLOS for two-lane and multilane highway segments is the BLOS score. BLOS score is calculated applying a linear regression model developed by Petritsch et al. (2007). BLOS depends on:
- Average effective width of the outside through lane,
- Motorized vehicle volumes,
- Motorized vehicle speeds,
- Heavy vehicle volumes and,
- Pavement conditions.
LOS A is determined for BLOS score lower or equal to 1.5, while LOS F is determined for BLOS score higher than 5.5.
The required data to calculate BLOS include land and shoulder width, speed limit, number of directional through lanes, pavement condition (FHWA 5-point scale), hourly motor vehicle demand, directional volume split, peak hour factor, percent of heavy vehicles and percent of segment with occupied on highway parking. It should be noted that the ranges of values used in the development of the BLOS for arterials may differ from the conditions on some rural two-lane highways and multilane highways, as posted speed varied from 25 to 50 mph and motorized vehicle volumes were up to 36,000 annual average daily traffic, with percent of heavy vehicles between 0 and 2%. The results of applying the methodology outside that range of values should be considered with caution.
To develop the methodology, Petritsch et al. (2007) used 700 real-time observations from bicyclists riding a 20-mile course along 12 arterial roadway sections in Tampa, Florida. Participants scored each arterial section from A to F based on “the letter grade that best describes how well they feel each section served their needs as a bicyclist”. Traffic conditions on the roadways were collected using pneumatic tubes and later assigned to each specific cyclist and section in 15-minute intervals. The 63 participants ranged from recreational cyclists to high-end cyclists and bicycle commuters. A linear regression model was estimated for the segment score and depended on average effective width of the outside through lane, motorized vehicle volumes, motorized vehicle speeds, heavy vehicle volumes and pavement conditions. To aggregate the segment BLOS in facility LOS, Petritsch et al. (2007) computed both the distance-weighted average segment bicycle LOS and the number of unsignalized intersections per mile along the facility.
The traveler perception model builds upon the work of Landis et al. (1997). They used 150 cyclists in actual urban traffic and roadway conditions, in a looped course of 30 road segments along collectors, arterials and some local streets. The model from Landis et al. (1997) used the posted speed limit as surrogate for actual motorized vehicle speeds and included as significant variables trip generation intensity of the land use and frequency per mile of noncontrolled vehicular access. A key finding was the importance of pavement surface conditions and striping of bicycle lanes for quality of service for bicyclists.
Subsequent works included BLOS at arterials (Jensen, 2007; Kang and Lee, 2012), roundabouts (Jensen, 2007), intersections (Jensen, 2013), networks (Zolnik et al., 2007) and tools for identifying bicycle route suitability based on BLOS (Lowry and Callister, 2012; Lowry et al., 2012).
Oregon DOT re-estimated the HCM method from the original video clip data and simplified the independent variables of the full HCM method because the full HCM methods are data intensive. The variables that were significant are: number of through traffic lanes per direction, bike lane or paved shoulder present, posted speed limit and unsignalized conflicts (Oregon DOT, 2020). For high-level plans, they indicate that LTS can be used instead of BLOS for a quick assessment of system connectivity because it requires less input data and calculations.
Bicycle Compatibility Index (BCI)
The BCI was developed by Harkey et al. (1998) for urban and suburban segments and adapted to rural conditions by Jones and Carlson (2003).
The FHWA BCI was developed from the perspectives of bicyclists and incorporates “the variables that bicyclists typically use to assess how compatible a roadway segment is for bicycle travel” (Harkey et al., 1998). The methodology consisted of video recordings of numerous roadway segments that were reproduced to participants. A total of 202 cyclists from Olympia, WA, Austin, TX and Chapel Hill, NC, participated on the video survey. For each video, participants provided the comfort level ratings in a 6-point scale. Specifically, they were asked how comfortable they would feel as a bicyclist considering the number of vehicles on the roadway, the speed of the traffic, the space available to ride a bicycle and their overall comfort level. A linear regression model was estimated with the scores. The most influential variable was the presence of a bicycle lane, followed by the width of the bicycle lane or paved shoulder. Increasing the traffic volume or motor vehicle speeds, or the presence of on-street parking decreased the level of comfort for the bicyclists. Bicycle LOS criteria were established based on BCI for all bicyclists and by bicyclist group (casual recreational, experienced recreational or experienced commuter).
Jones and Carlson (2003) built upon the work of Harkey et al. (1998) to develop the Rural Bicycle Compatibility Index (RBCI). An online survey was used to distribute video recordings of rural highways in Nebraska under different traffic conditions (vehicle and truck traffic volume) and geometric conditions (with and without shoulder). Videos were recorded from an instrumented vehicle that drove at 10 mph, with the camera position located approximately where a bicyclist might locate on the roadway. 101 bicyclists completed the survey. As Harkey et al. (1998), three groups of bicyclists were defined: experienced commuter, experienced recreational and casual recreational. The results indicate that the overall comfort level rating depended on the shoulder width and the flow rate of heavy vehicles. Other variables, such as intersection density, observed 85th percentile speed, traffic volumes or number of lanes, were not statistically significant. Experienced and casual riders provided different mean comfort level ratings, being experienced riders more comfortable than casual riders for the same conditions.
La Mondia and Moore (2015) applied the BCI to Auburn, Alabama and compared the BCI levels with perceived bike route suitability for different types of cyclists and roadway characteristics. The results indicate a high disconnection between BCI, and those segments ranked “highly suitable”. The results may indicate that bicycle BCI may not be transferable and that there are other characteristics that affect the perception of the bicycle network.
The level of experience was also found significant on commuter bicyclist’ route preferences (Stinson and Bhat, 2002) and cyclists’ perceived safety (Griswold et al., 2017).
LTS
The LTS adapted by Mekuria et al. (2012) and Furth et al. (2016) to the US conditions and is gaining interest among practitioners and planners and has been applied to design bicycle facilities by FHWA (Schultheiss et al., 2019), AASHTO (draft 2020) and some state DOTs, among other local agencies.
LTS is based on the Dutch roadway standards (CROW, 2017). The CROW Design Manual for Bicycle Traffic defines four types of bicyclists: “no way, no how” (around 33% of the population), “interested but concerned” (around 60%), “enthused and confident” (7% of population) and “strong and fearless” (less than 1%). Each level of LTS is defined as the maximum tolerance for traffic stress that a type of bicyclist has. In this sense, the guidelines propose four
LTS, one for each three interested cyclists and one for children. LTS definitions, as indicated by Furth et al. (2016), are:
- LTS1: tolerable to child bicyclists. Little attention to traffic is demanded from cyclists and the facilities are attractive for relaxing bike rides. In mixed traffic, there is low-speed differential with motor vehicles and demands only occasional interactions with them.
- LTS2: tolerable to “interested but concerned”. “Demands more attention than might be expected from children and presents little traffic stress”.
- LTS3: tolerable to “enthused and confident”. “Offers cyclists and exclusive cycling zone requiring little negotiation with motor traffic, but in close proximity to moderately high-speed traffic”.
- LTS4: tolerable to “strong and fearless”. “Requires riding near to high-speed traffic, or regularly negotiating with moderate-speed traffic or making dangerous crossings”.
For mixed traffic, Furth et al. (2016) proposed LTS-based on the speed limit, the number of through lanes per direction and no marked centerline and average daily traffic (ADT). Only roadways with no marked centerline, ADT lower or equal to 3,000 veh/day and speed limit up to 25 mph were classified as LTS1. In the latest review of criteria from 2017, mixed traffic criteria were divided by the number of lanes, effective ADT and prevailing speed (http://www.northeastern.edu/peter.furth/wp-content/uploads/2014/05/LTS-Tables-v2-June1.pdf). Criteria are proposed for all facility types.
FHWA included LTS on the latest Bikeway Selection Guide (Schultheiss et al., 2019), which also accounts for the context classification of AASHTO. Comfort, in terms of minimizing stress, anxiety and safety concerns for the target design user, is one of the main principles of the Guide. Three types of bicyclists are defined: highly confident bicyclist (4 – 7% of the total population), somewhat confident bicyclist (5 – 9% of the total population) and interested but concerned bicyclist (51 – 56% of the total population). At rural context, the typical bicyclist type first in the first two categories. The Guide proposes shoulder widths (0 – 10') to accommodate cyclists based on motorized vehicle speeds (25 – 60 mph) and traffic volumes (500 – 20,000 veh/day).
Design users and similar concepts lay the foundation of the draft AASHTO Guide for the Development of Bicycle Facilities. For rural highways, there are proposed shoulder recommendations, transition recommendations and rumble strip spacing, location and gap guidance (Onta, 2018). Massachusetts DOT (2015), Oregon DOT, Washington State DOT (2015), also consider design users in a similar classification.
The Multimodal Analysis of Oregon DOT uses LTS segment criteria. It is indicated that “LTS could be used at a system level to identify key locations, which then can be analyzed further using Multimodal Level of Service (MMLOS)”. For MMSLOS, it refers to a simplified calculation based on the HCM BLOS. For LTS rural applications, it indicates that rural bicyclists must be more aware and is likely higher stress tolerant than their urban counterpart. It distinguishes two rural applications depending on speed limit. For highways with posted or operating speeds less than 45 mph, the original methodology of urban applications can be used. For highways with posted or operating speeds higher than 45 mph, there are specific segment criteria. The criteria depend on paved shoulder width and daily volume. For each cross-tabulation, one LTS is provided. For example, LTS R2 is targeted at rural segments with paved shoulder width narrower than 4 ft and less than 400 veh/day; and for segments with paved shoulders wider than 6 ft and traffic volume up to 7,000 veh/day.
Similarly, the Washington State Active Transportation Plan (2020) explicitly mentions LTS. It is used throughout evaluation, prioritization, and measurement—network gaps are identified as any route with LTS 3 and 4 in a census-designated population center. Network gaps are subsequently evaluated with safety, equity, and potential demand criteria. The scoring is adapted from the LTS methodology developed by Oregon DOT. Distinct approaches are provided for high-speed rural roads and population centers. Roadway qualities use posted speed, number of travel lanes, and presence of bike lane to evaluate traveling conditions for bicyclists.
Ferenchak et al. (2020) validated LTS for children based on video surveys. They asked parents if they would allow their children to cycle along different roadway segments in Denver, CO. LTS were classified using the criteria from Furth (2017). Twenty segments were included with varying the number of lanes, posted speed limits, presence of bike lanes and vehicle volumes. A total of 924 complete responses were collected. The results indicate that the LTS score correlates well with biking allowance for children.
Other Information
- Oregon DOT Multimodal analysis – Explicit mention to Bicycle LTS on segments, the following factors are considered: preferred bicycle facility type, shoulder presence/width, outside travel land width, grade, pavement condition, obstructions, on-street parking, travel lanes and speed of motorized traffic. Have LTS definition + considerations for rural cyclists to be more aware and probably accepting higher stress than urban riders.
- MassDOT Separated bike lane planning and design guide 2015 – Includes user types. “MassDOT requires an analysis of applicable design criteria for outside shoulder width for all projects. In urban areas with constrained right-of-way, separated bike lanes with or without on-street parking fulfill some shoulder functions including bicycle use, drainage, lateral support of pavement, and, in street and sidewalk buffer areas, snow storage. Therefore, an additional shoulder is not required provided that a design exception is obtained. However, in suburban and rural areas with fewer right-of-way constraints and higher motor vehicle speeds, a paved shoulder may be necessary in addition to a separated bike lane. For shoulder function and width criteria, refer to section 5.3.3.1 of the PD&DG.”
- WSDOT Traffic Manual - https://www.wsdot.wa.gov/publications/manuals/fulltext/m5102/traffic.pdf - Explicit mention of LTS in a rural context, with cross references to both the Design Manual chapter 1520 and Active Transportation Plan
- WSDOT Design Manual – https://wsdot.wa.gov/publications/manuals/fulltext/M2201/M22-0120Complete.pdf:
- Chapter 1130 (2021) Explicit mention of Bicycle LTS, and incorporates the WSDOT Active Transportation Plan for guidance on Level of Traffic Stress for Development Services
- Chapter 1520 (2021) bicycle facility selection charts by user types, with ADT and motor vehicle target speed. For example, for “interested but concerned cyclists” they recommend shared user facility for speeds higher than 50 mph – all ADT, and higher than 40 mph – ADT greater than 4000 veh/day.
- WSDOT Active Transportation Plan (2020) - https://wsdot.wa.gov/sites/default/files/2021-12/ATP-2020-and-Beyond.pdf - Explicit mention of LTS. Used throughout in evaluation, prioritization, and measurement.
- MnDOT Bikeway facility design manual (2007) – in three user types as advanced, basic and children. Consideration of geometric and operation factors: traffic volume, motor vehicle speed, roadway cross-section, road functional classification, on-street parking, intersections and driveways, right-of-way constraints, vehicle turn lane configuration, number of traffic lanes, topography, traffic composition, bus routes, peak hour traffic volume, average daily bike volume, bike characteristics. Selection for rural – shoulder width or shared lane, minimum widths depending on motor vehicle speed and ADT.
- NJDOT Bicycle Compatible Roadways and Bikeways: “In rural settings, bicycle lanes are not usually necessary to designate preferential use. On higher volume roadways, wide shoulders offer bicyclists a safe and comfortable riding area. On low volume roadways, bicyclists prefer the appearance of a narrow, low speed country road.”. In rural areas, bikeways should be at shoulders with 4-8 ft width, depending on speed and AADT. No mention of user types.
- New York State DOT, Highway Design Manual 2015 – chapter 17: in rural areas, minimum 4-ft shoulder. No design users.
- WisDOT: Wisconsin Bicycle Transportation Plan 2020 – no design users. “Method to assess road conditions for bicycling is based primarily on pavement width and volume of traffic, but also considered, as secondary factors, percent and volume of truck traffic, passing opportunities and pavement quality” - Note: this is in line with the HCM BLOS.
- Maryland State Highway Administration 2015 – bicycle policy and design guidelines – no mention of user types, warrants for rural routes.
Network gaps are identified as any route with LTS 3 and 4 in a census-designated population center.


