Developing a Guide for Rural Highways: Reliability and Quality of Service Evaluation Methods (2024)
Chapter: Appendix D: Intersection Influence Area
Appendix D: Intersection Influence Area
On interrupted-flow facilities such as urban street networks and non-freeway rural facilities, the need for the major street through movement to slow down or stop at signalized, roundabout, or AWSC intersections impacts traffic operations along the connecting highway segments. In practice, intersections are represented as point locations in a link-node network configuration; however, its operational effects extend for some distance on the connecting upstream (entry) and downstream (exit) approaches, thus affecting the operational performance of highway segments in the proximity of intersections. Specifically, vehicles may need to stop or slow down as they approach the intersection and then accelerate to the downstream segment running speed as they exit the intersection. Understanding the spatial extent of intersection impacts on connecting approaches is important for an accurate evaluation of operational performance along facilities consisting of multiple segments and junctions. For facility-level analysis, the quality-of-service assessment should not only include the physical intersection area, but also the lengths along all approaches that are affected by the intersection, commonly known as the “influence area” or “effective length.”.
This section summarizes the results of the analysis of vehicle probe data, for the purpose of identifying the influence areas of intersections. The number of study sites for each type of intersection and available data sources are summarized in Table D-1.
Table D-1. Total number of study sites with attributes
| Intersection Control | Data Type | # of Sites | Directions (EB–WB or NB–SB) | Samples | Data Resolution (Hz) |
|---|---|---|---|---|---|
| Signal | Trajectory | 4 | Both | 4×2=8 | 1/3 |
| Stop | Trajectory | 7 | One | 7×1=7 | 1/3 |
| Roundabout | Trajectory | 3 | Both | 10 | 1 |
Signalized Intersection Site Locations
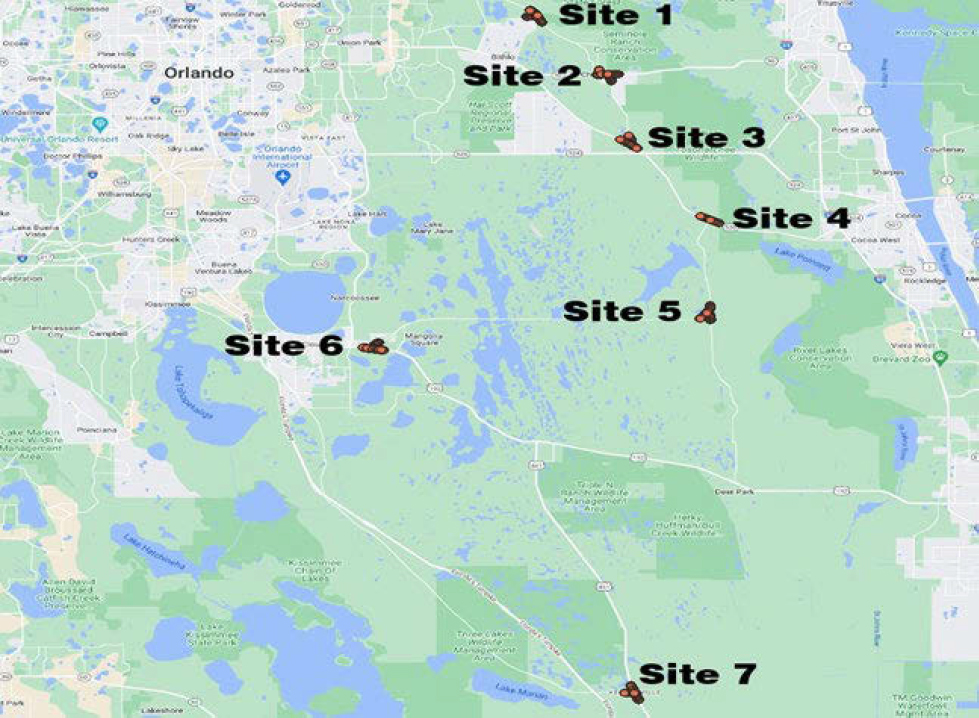
Data were obtained for a total of four signalized intersection sites, along rural highways, in central Florida (black dots in Figure D-1).
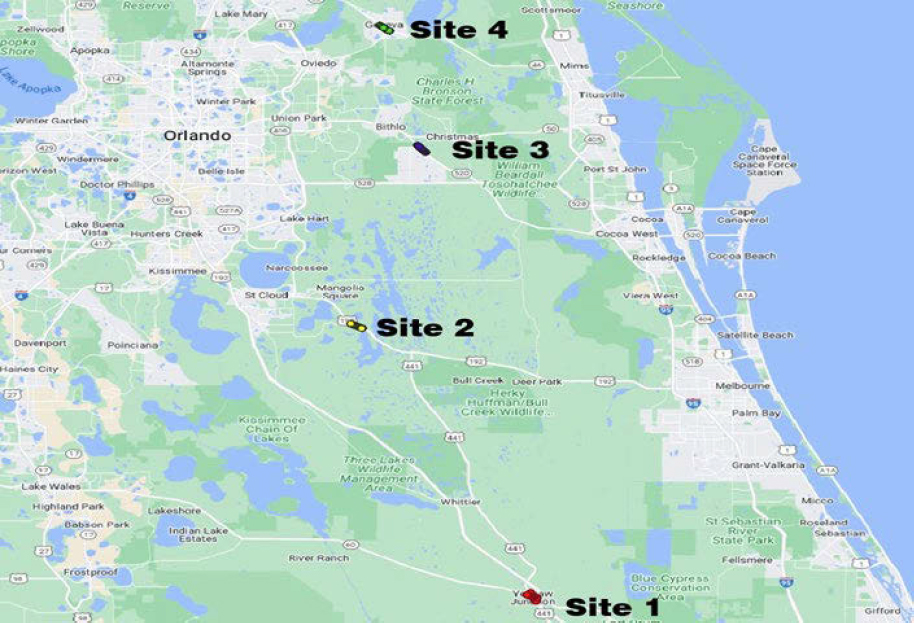
Source: Map data ©2022 Google
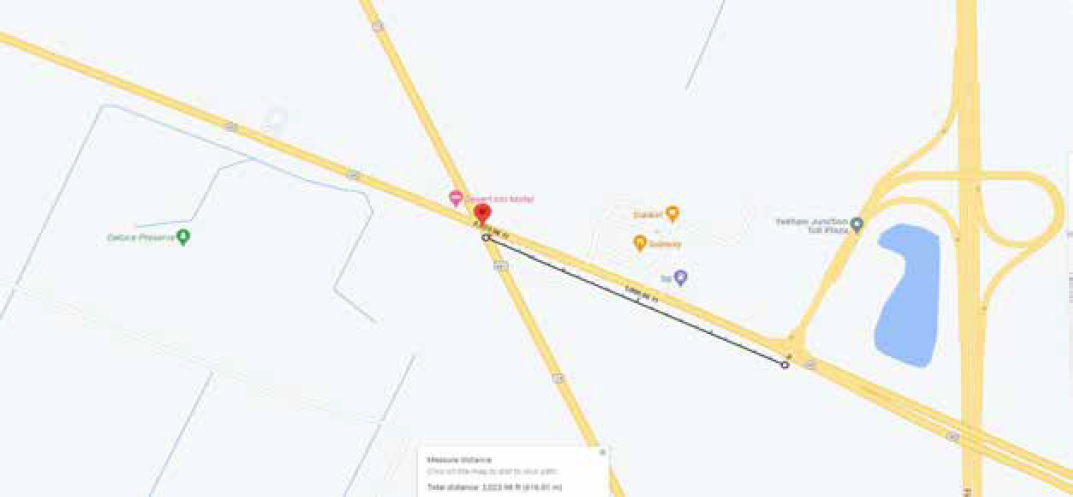
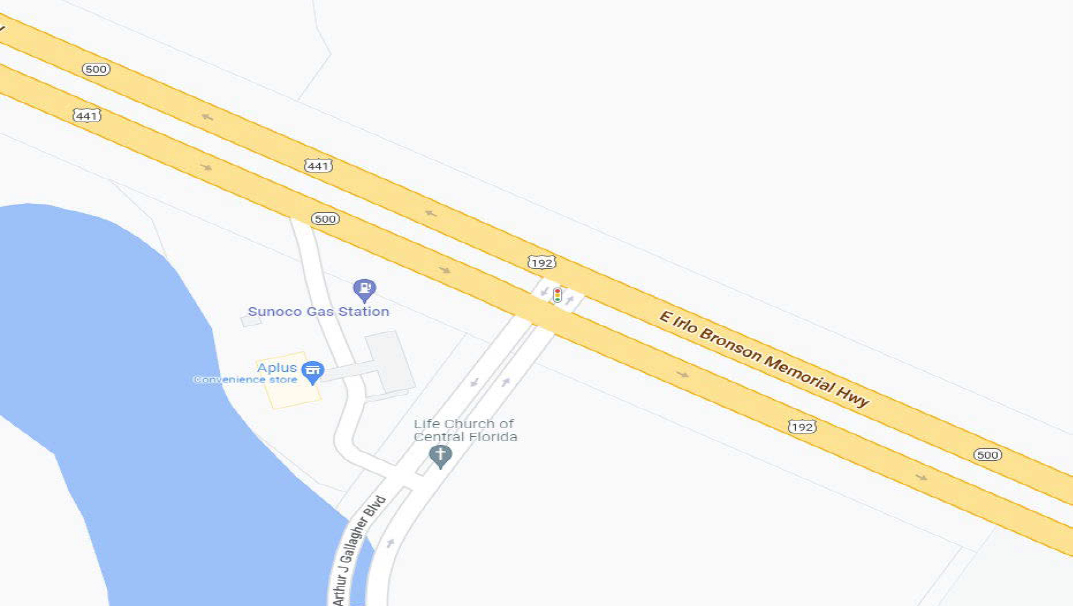
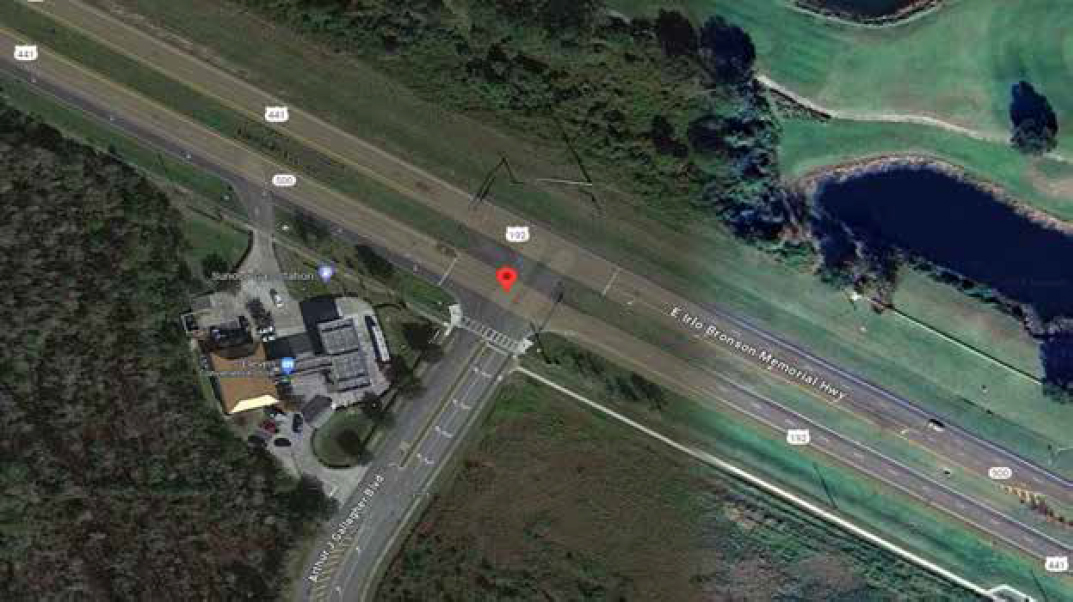
Site 1
Yeehaw Junction (High Truck Percentage)
27.69972777777778, -80.90434444444445
Intersection Attributes
- East–West – State Road 60 (Major)
- Speed limit 45 mph in vicinity of intersection
- Two-lane highway and no passing zone, no left/right-turn bays
- Junction for toll highway – located downstream of EB Rte-60
- Seems high traffic of heavy vehicles on East-West corridor
- North–South – Hwy 441 (Minor)
- Speed limit: 50 mph in vicinity of intersection
- Two-lane highway, no left/right-turn bays
Source: Map data ©2022 Google

Source: Map data ©2024 Google
Site 2
Bronson Memorial Hwy and Arthur Gallagher Blvd
Multilane Highway – 441 Hwy
28.1918640616823, -81.15464257237842
Intersection Attributes
- T – signalized intersection
- Major road is multilane highway
- 2 through lanes and one right-turn lane for EB (also bicycle lane)
- It is in a school zone
- Speed limit: 55 mph
Source: Map data ©2022 Google
Source: Map data ©2024 Google
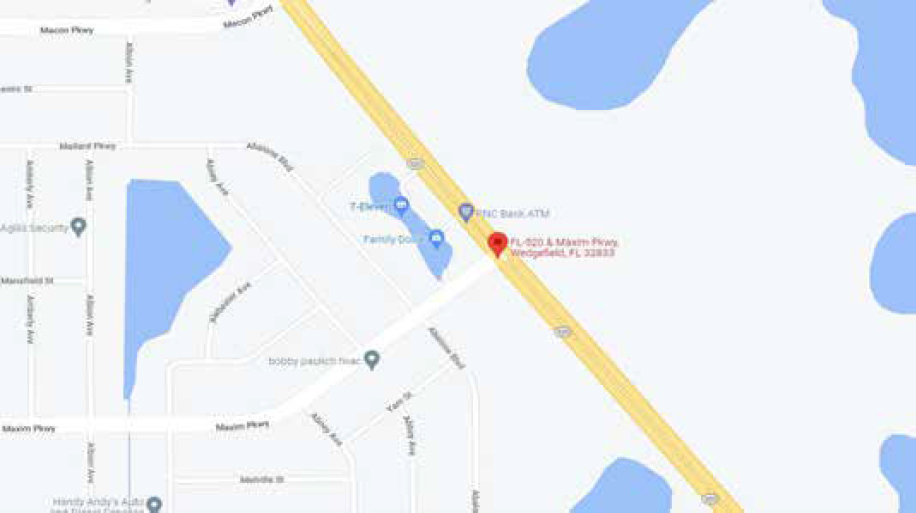
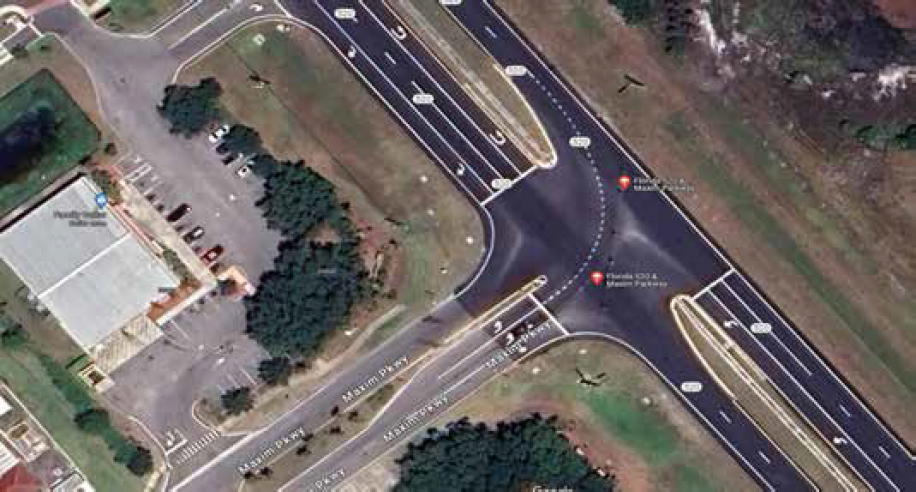
Site 3
SR-520 and Maxim Parkway Intersection
28.51394398998677, -81.0622791774354
Intersection Attributes
- Multilane divided highway
- Signalized ‘T’ intersection
- Speed limit: 55 mph in vicinity of intersection
- 2 through lanes, left and U-turn lane on EB approach
- 2 through lanes, left-turn lane on WB approach
Source: Map data ©2022 Google
Source: Map data ©2024 Google
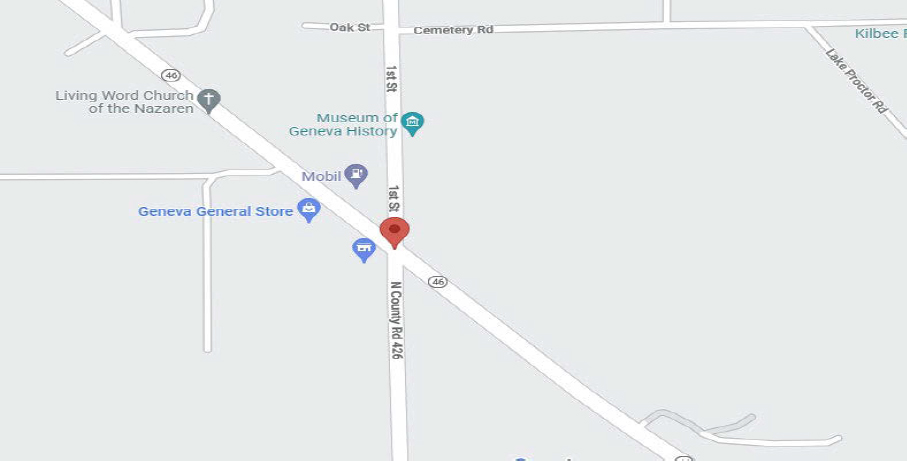
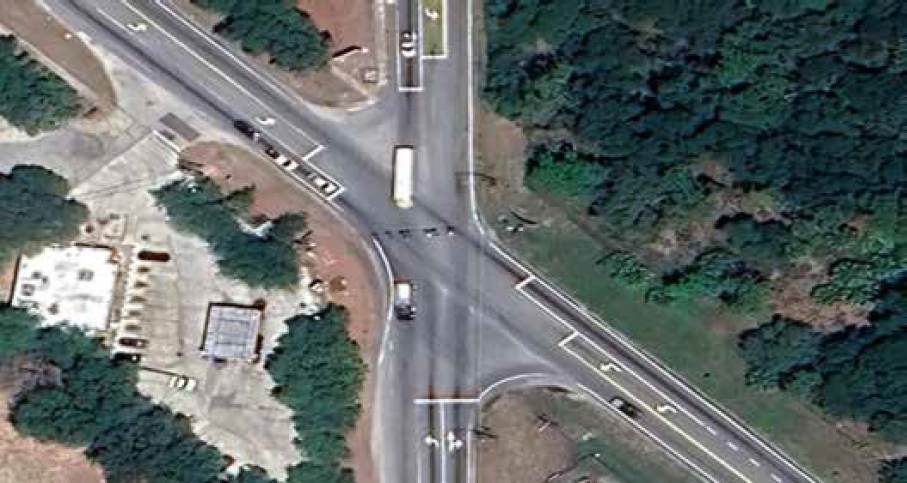
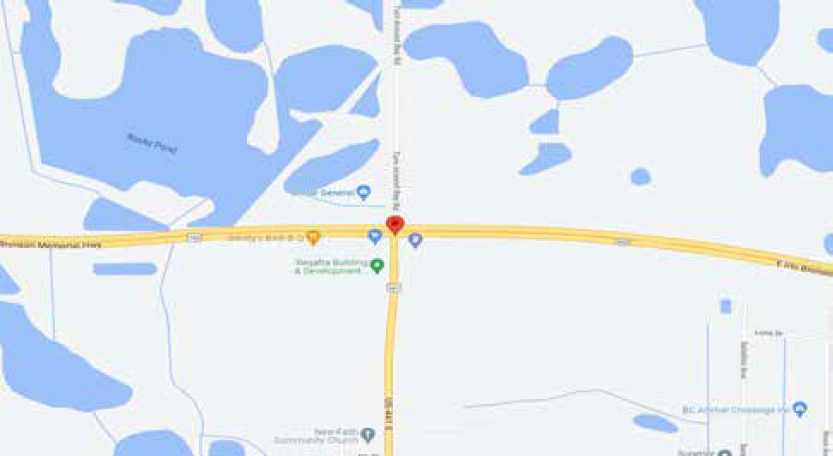
Site 4
CR-426 and FL-46, Geneva, FL
28.73337621159619, -81.11514690240303
Intersection Attributes
- Major two-lane highway, FL-46, intersection with 1st Street (minor)
- Skewed Intersection
- Gas stations and driveways in the vicinity of intersection
- Major street has a dedicated left-turn lane and a shared though-right lane.
- Speed limit on major street is 55 mph, but reduced to 45 mph at 1500 ft upstream of the intersection.
Source: Map data ©2022 Google
Source: Map data ©2024 Google
Stop-Controlled Intersection Site Locations
Data were obtained for a total of seven stop-control intersection sites, along rural highways, in central Florida (orange dots in Figure D-10).
Source: Map data ©2022 Google
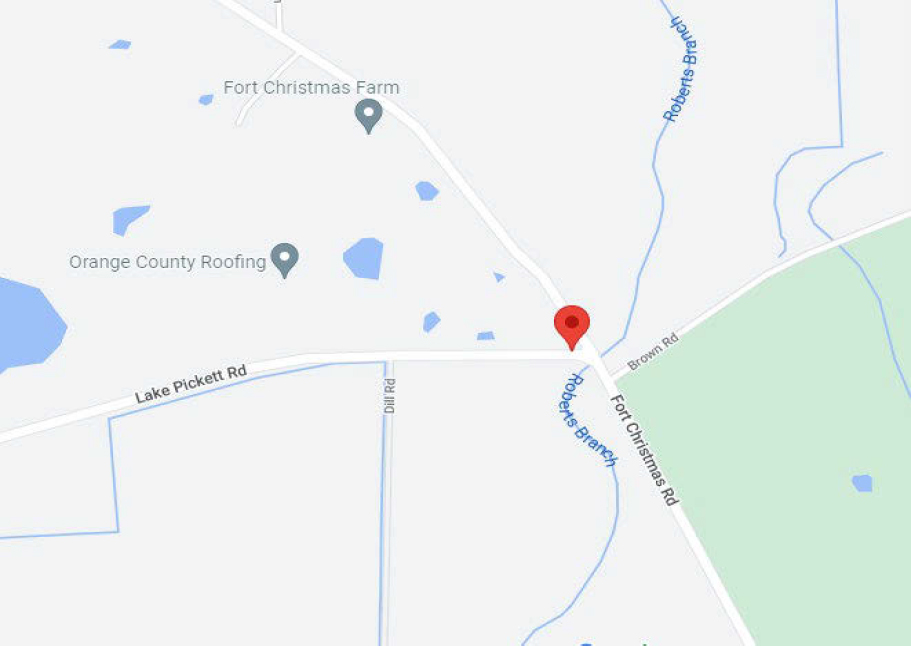
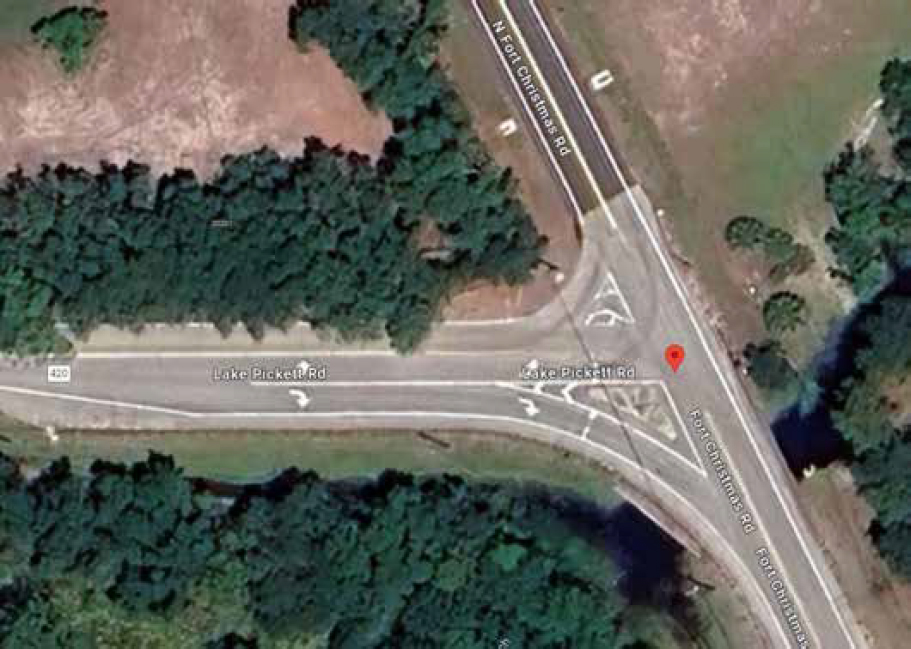
Site 1
Lake Pickett Road at N Fort Christmas Road, FL
28.59868562737476, -81.07542409814873
Intersection Attributes
- Stop-controlled T–intersection.
- Dedicated left and right-turn lanes.
- Posted speed limit 45 mph.
Source: Map data ©2022 Google
Source: Map data ©2024 Google
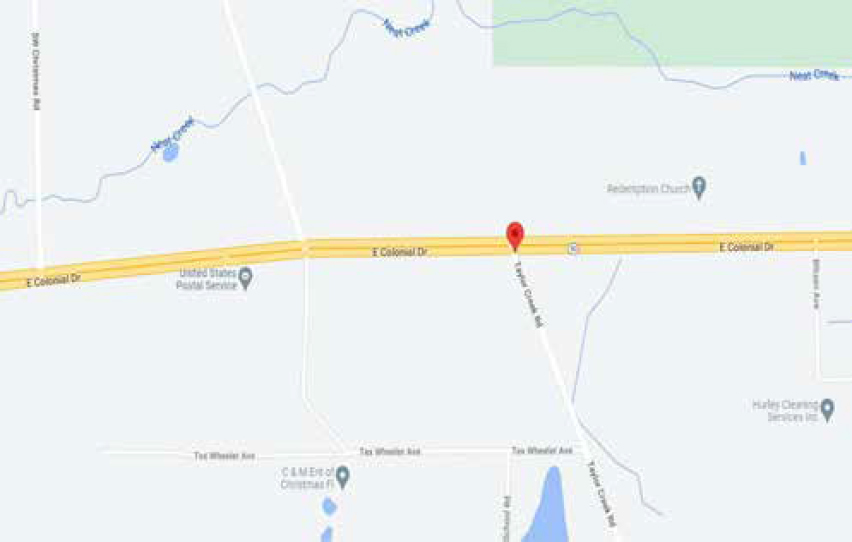
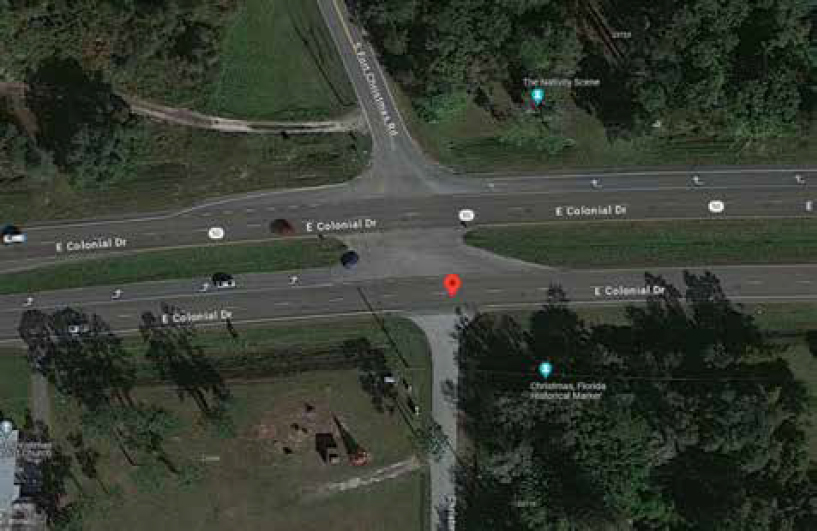
Site 2
Taylor Creek Road at E Colonial Drive
28.53655356333482, -81.01220531644309
Intersection Attributes
- Stop-controlled T–intersection.
- Posted speed limit 35 mph.
- Major highway is multilane divided highway.
Source: Map data ©2022 Google

Source: Map data ©2024 Google
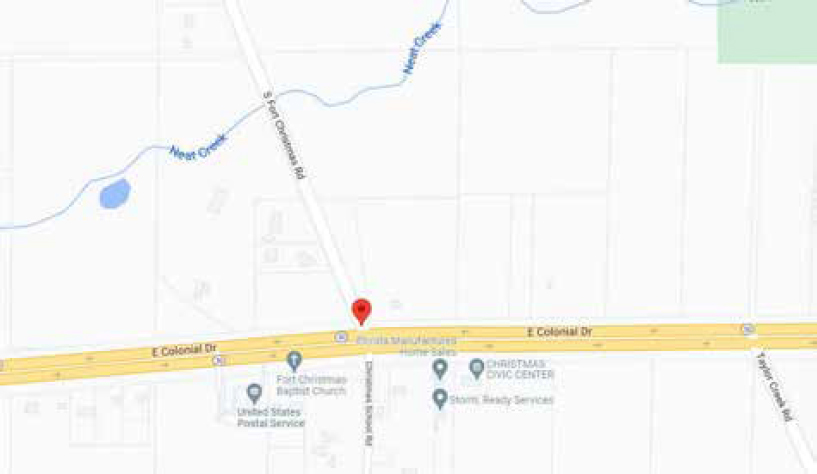
Site 3
S Fort Christmas Road at E Colonial Drive
28.53683001935565, -81.01789051145427
Intersection Attributes
- Stop-controlled T–intersection.
- Posted speed limit 45 mph.
- Major highway is multilane divided highway.
Source: Map data ©2022 Google
Source: Map data ©2024 Google
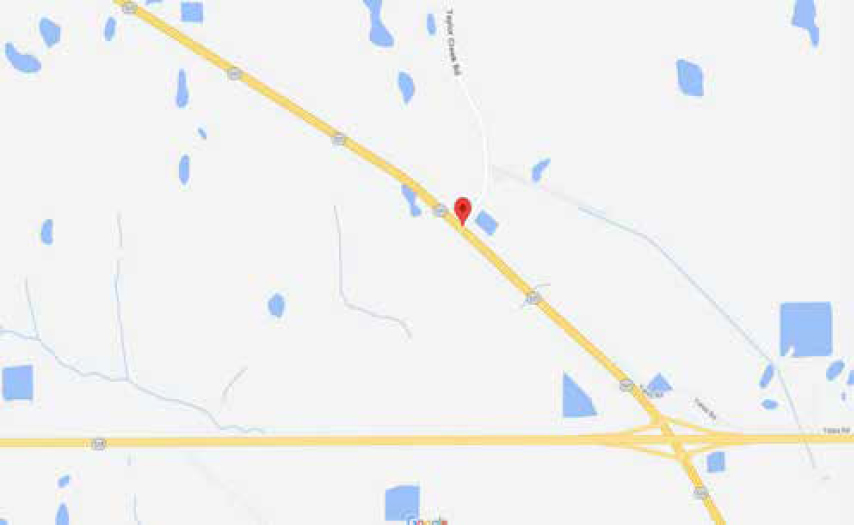
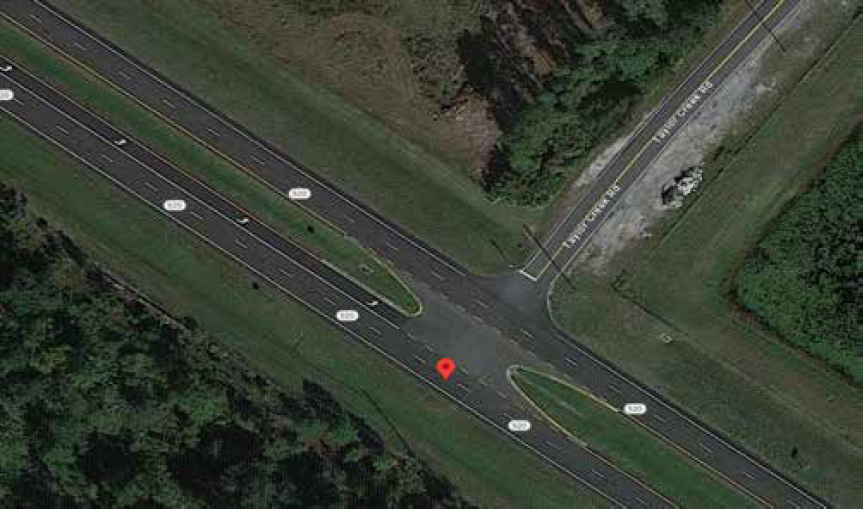
Site 4
Taylor Creek Road at FL–520
28.462825456163536, -80.99278804104223
Intersection Attributes
- Stop-controlled T–intersection.
- Posted speed limit 35 mph.
- Major highway is multilane divided highway.
Source: Map data ©2022 Google
Source: Map data ©2024 Google
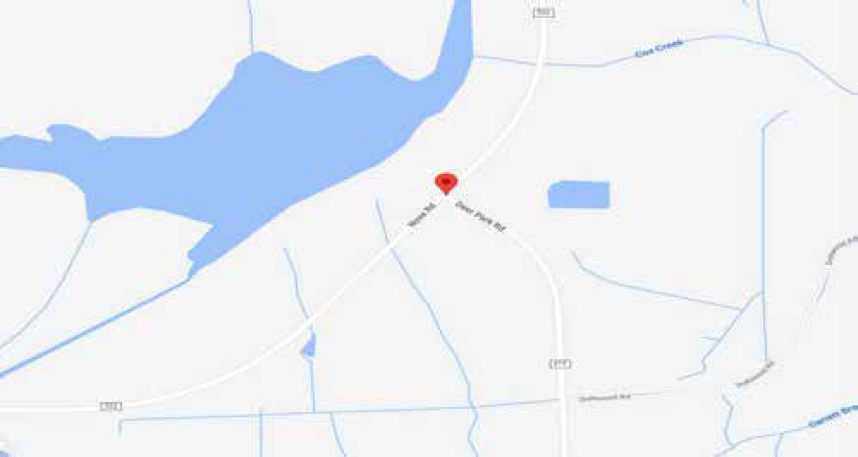
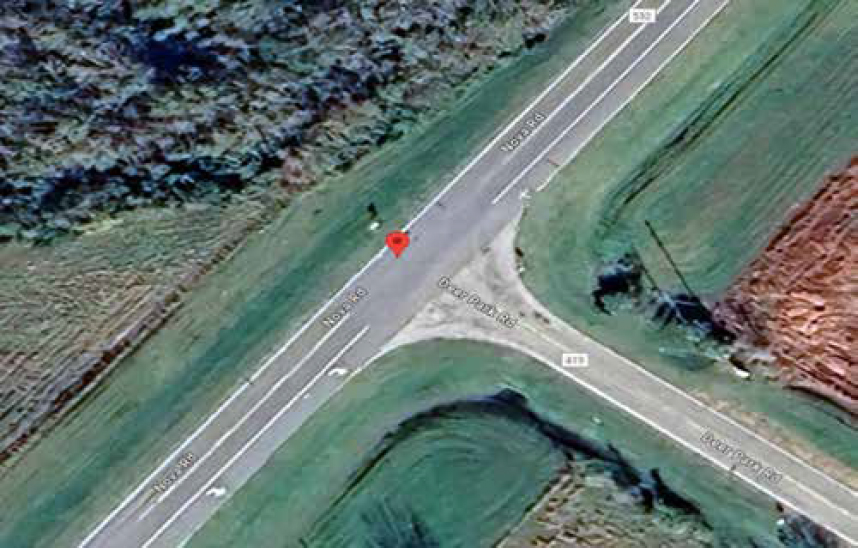
Site 5
Deer Park Road at Nova Road
28.282567428223185, -80.92317557563702
Intersection Attributes
- Stop-controlled T–intersection.
- Posted speed limit 55 mph.
- Major highway is two-lane undivided highway.
Source: Map data ©2022 Google
Source: Map data ©2024 Google
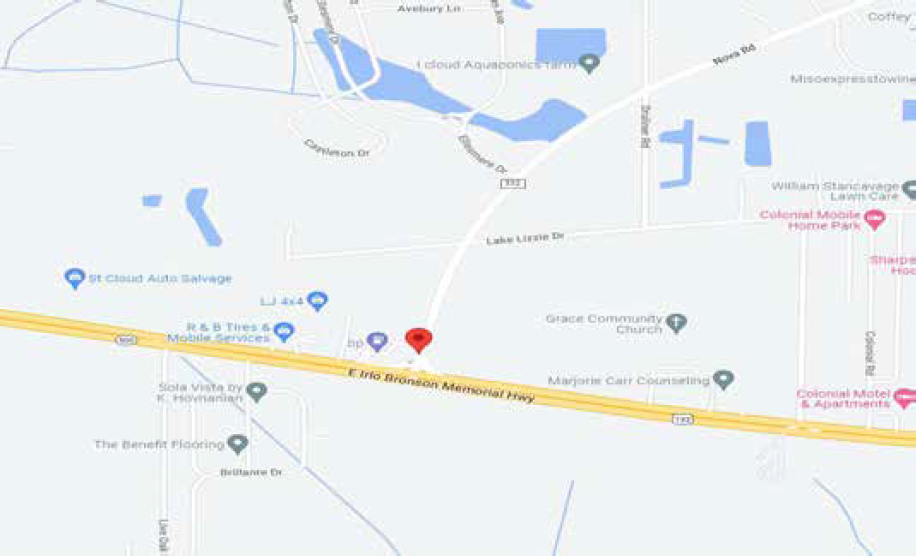
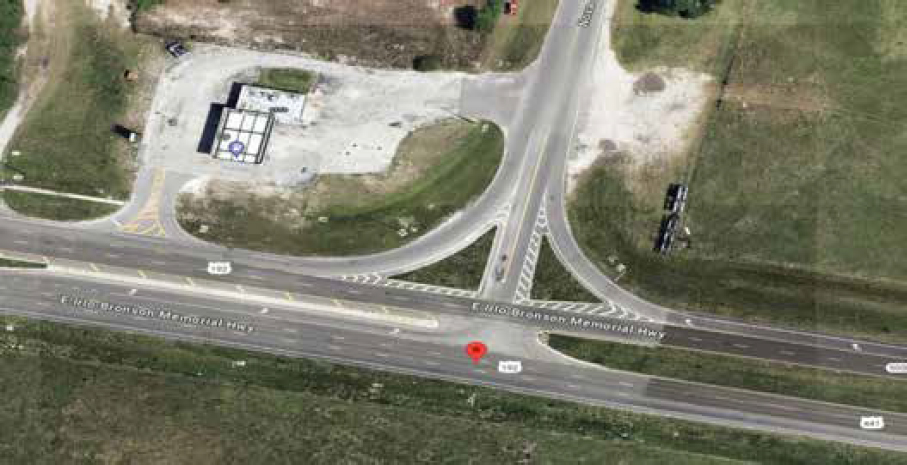
Site 6
Nova Road at E. Irlo Bronson Memorial Hwy
28.243980091596192, -81.22311904061856
Intersection Attributes
- Stop-controlled T–intersection.
- Posted speed limit 55 mph.
- Major highway is multilane divided highway.
- Dedicated right-turn and left-turn lanes on minor.
Source: Map data ©2022 Google
Source: Map data ©2024 Google
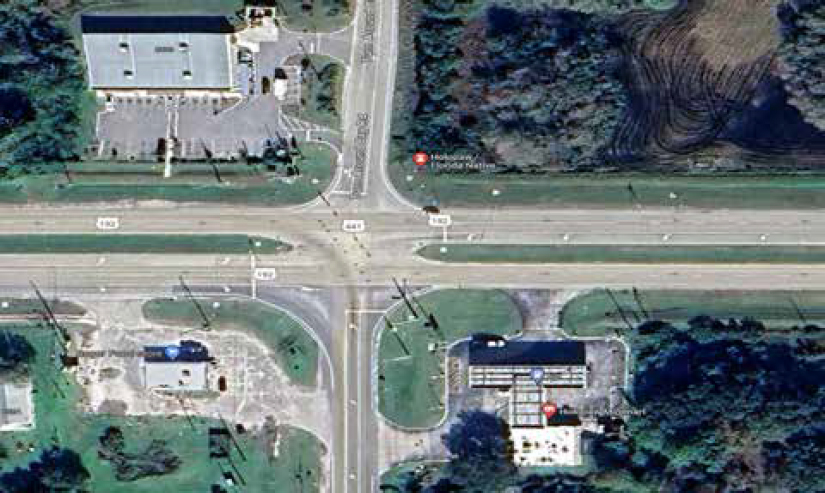
Site 7
Holopaw Road (US-441 S) at E. Irlo Bronson Memorial Hwy
28.14485532027373, -81.07610174716476
Intersection Attributes
- Stop-controlled T–intersection.
- Posted speed limit 55 mph.
- Major two highways meet (US-441 S with US-192)
- Dedicated right-turn and left-turn lanes on minor.
Source: Map data ©2022 Google
Source: Map data ©2024 Google
Roundabout Intersection Corridor Locations
Test car trajectories data were obtained from NCHRP Project 3-100. Following are the three study sites:
- Corridor I: SR–539 in Whatcom County, Washington
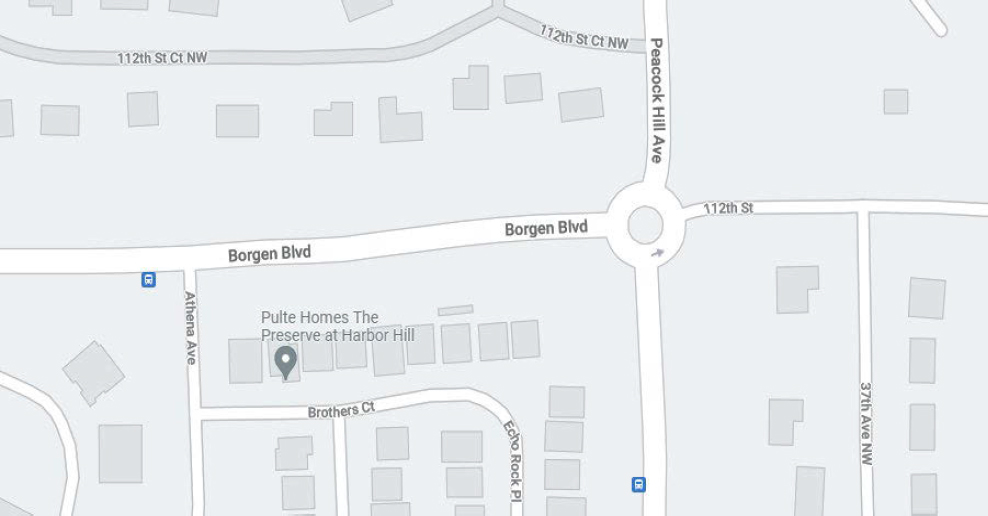
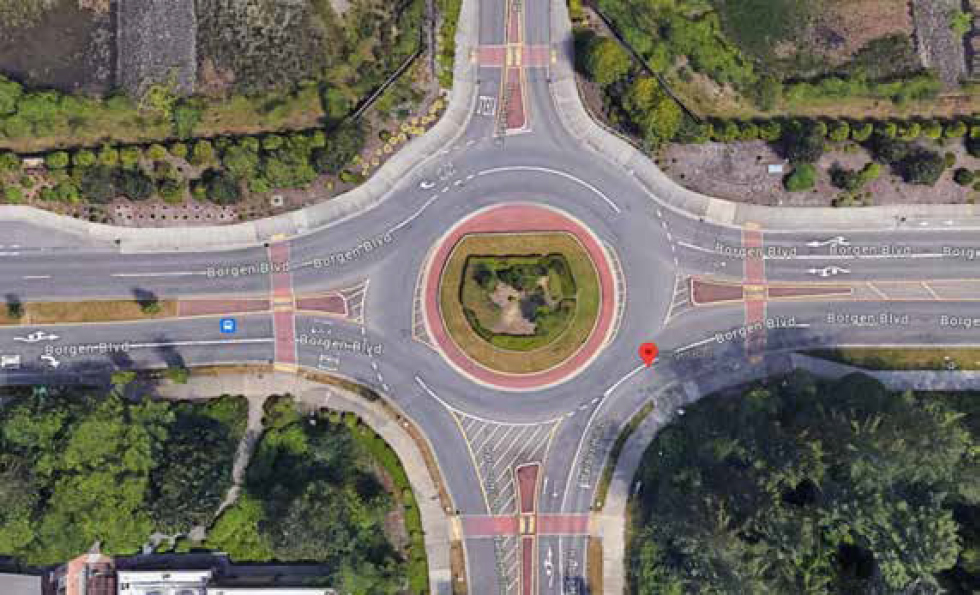
- Corridor II: Borgen Boulevard in Gig Harbor, Washington
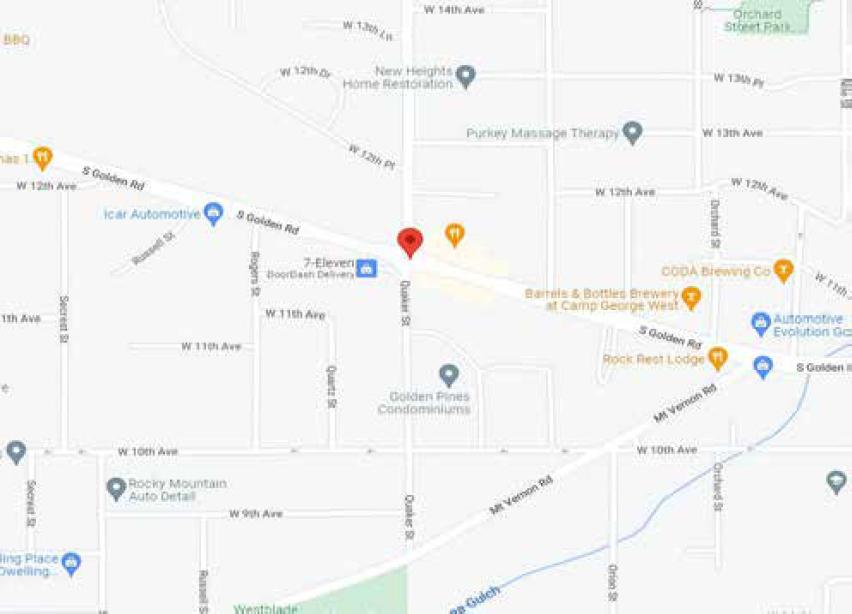
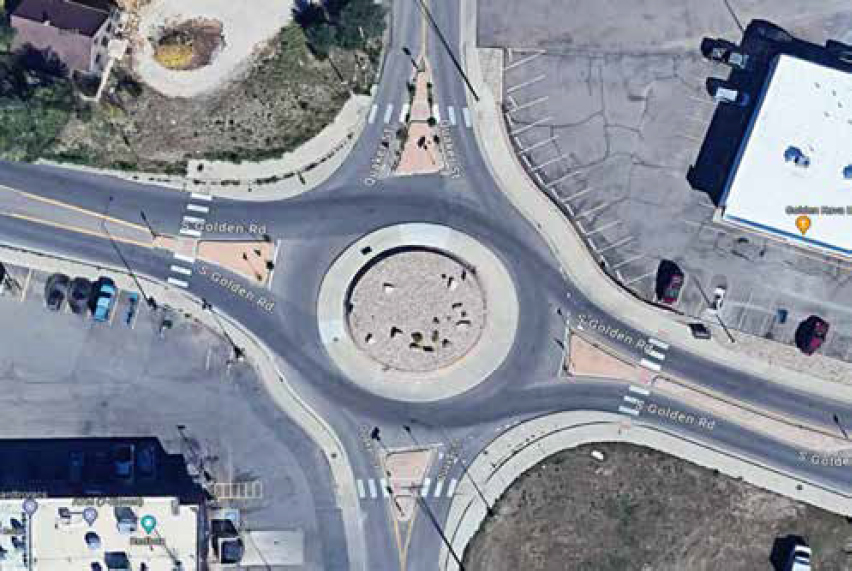
- Corridor III: Golden Road in Golden, Colorado
Table D-2. Roundabout sites attributes
| Site No. | Road Name | # of Rbts | Arterial # of Lanes | Rbt Lanes | Rbt Diameter (ft) [m] | Posted Speed Limit (mph) [km/h] | Corridor Length (mi) [km] | Area Type |
|---|---|---|---|---|---|---|---|---|
| 1 | SR 539 | 4 | 4 | 2 | 175 [55] | 50 [80] | 3.7 [5.95] | Rural / Suburban |
| 2 | Borgen Boulevard | 4 | 4 | 2 | 175 [55] | 35 [55] | 1.4 [2.25] | Suburban |
| 3 | Golden Road | 5 | 4 | 2 | 175 [55] | 35 [55] | 1.0 [1.61] | Suburban |
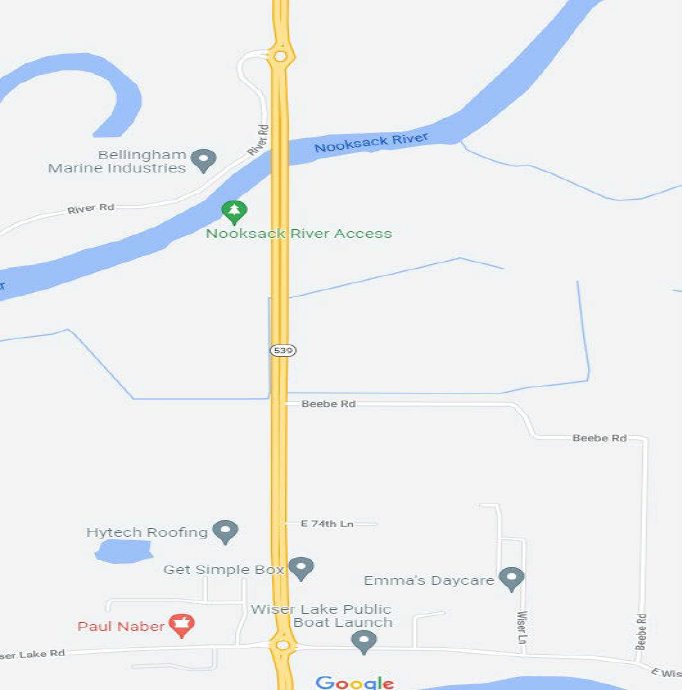
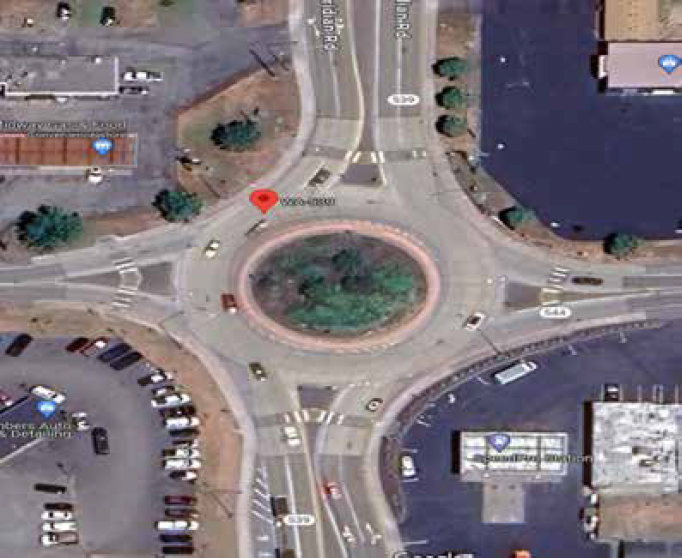
Corridor 1
SR-539 in Whatcom County, Washington
48.923033794705546, -122.48568849413243
Source: Map data ©2022 Google
Source: Map data ©2024 Google
Corridor 2
Borgen Boulevard in Gig Harbor, Washington
47.3598891345255, -122.58960710025757
Source: Map data ©2022 Google
Source: Map data ©2024 Google
Corridor 3
Golden Road in Golden, Colorado
39.73532167732723, -105.18428984502994
Source: Map data ©2022 Google
Source: Map data ©2024 Google
Analysis
Data Attributes
- GPS trajectory data: 1 GPS point every 3 seconds – used for signalized and stop-controlled intersections.
- Test Car GPS trajectory data: 1 GPS point every one second – used for roundabouts.
- Trajectory data advantages: larger dataset and 11 different sites.
- Test car data advantages: more than 100 runs on each corridor and three corridors in two different states.
- Both datasets are comprised of
- Veh ID,
- Speed in km/h,
- Time stamp with date,
- Latitude/longitude,
- Heading angle.
Pre-Processing of Data
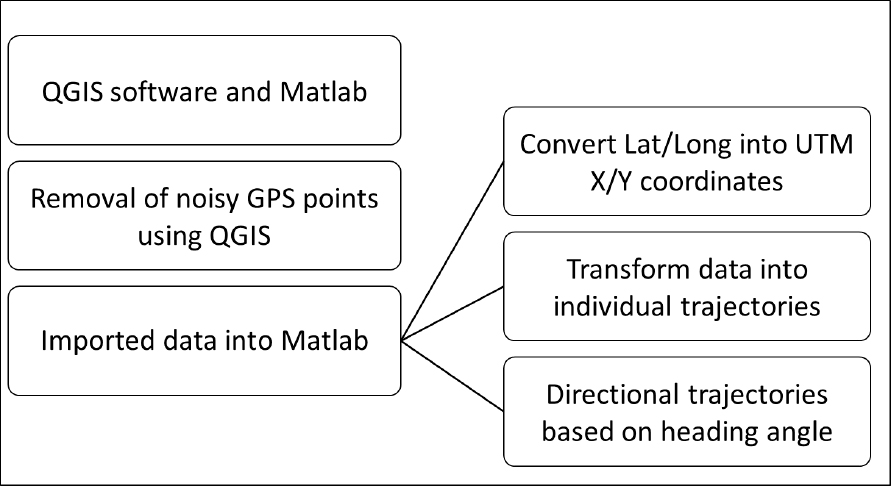
Data Filtering
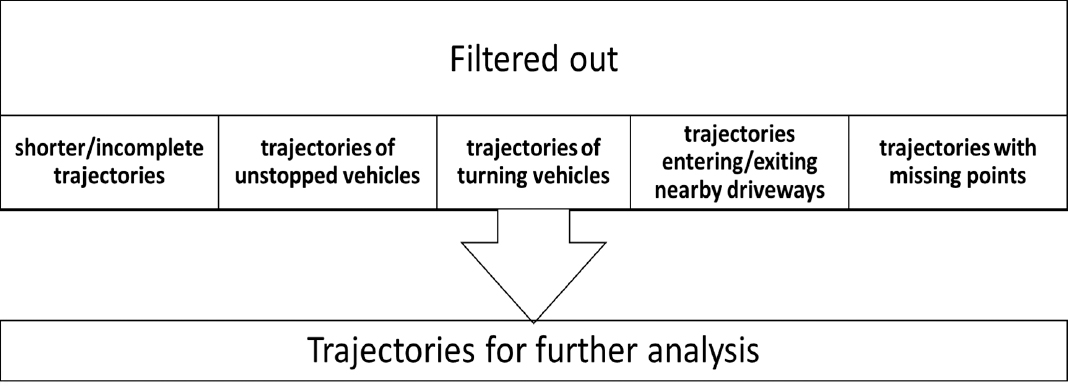
- Only SE-bound trajectories
- Further cleaning was done.
Steps in Data Processing
- Computed distance between consecutive points and added cumulative distance column to data.
- Added acceleration/deceleration in ft/s2 column to data.
- Added speed in ft/s column to data.
Influence Area Determination
- Developed heuristic algorithm to determine influence area using acceleration / deceleration.
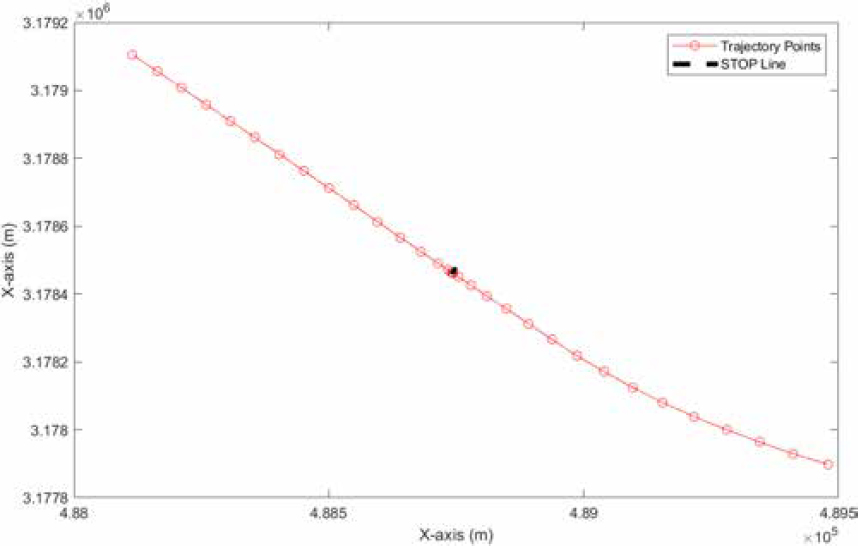
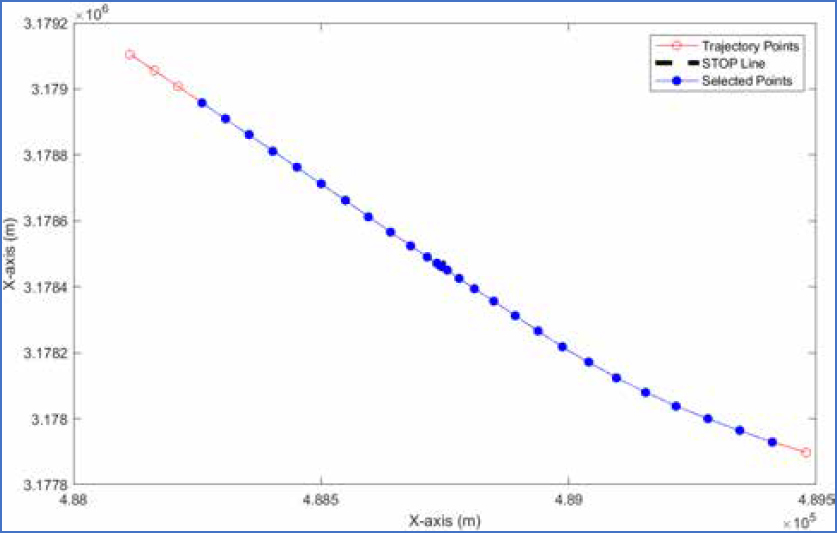
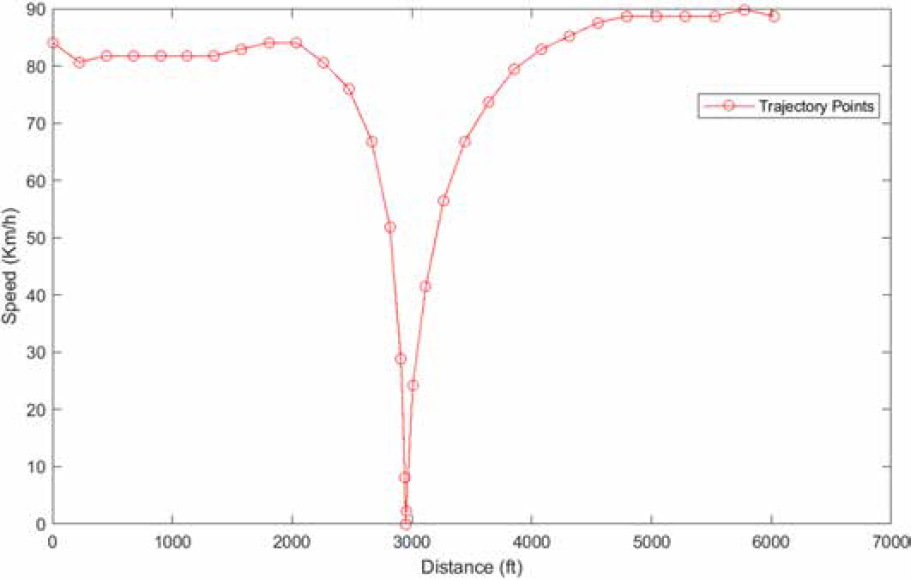
Sample Trajectory, Step 1
- Hollow dots are GPS points every 3 seconds.
- Black small line indicates STOP Line
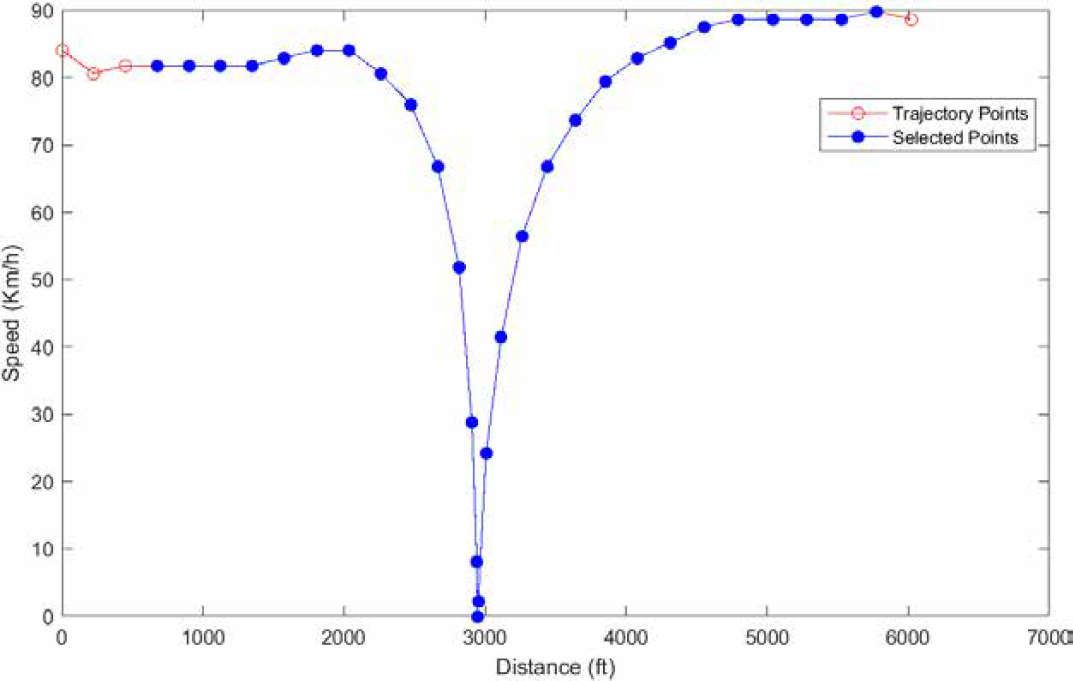
Sample Trajectory, Step 2
- Selected 15 points upstream and 15 points downstream of the STOP line.
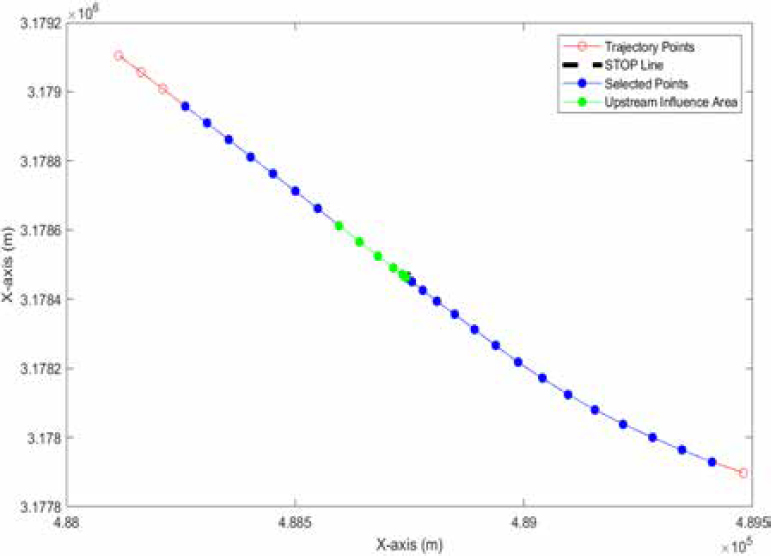
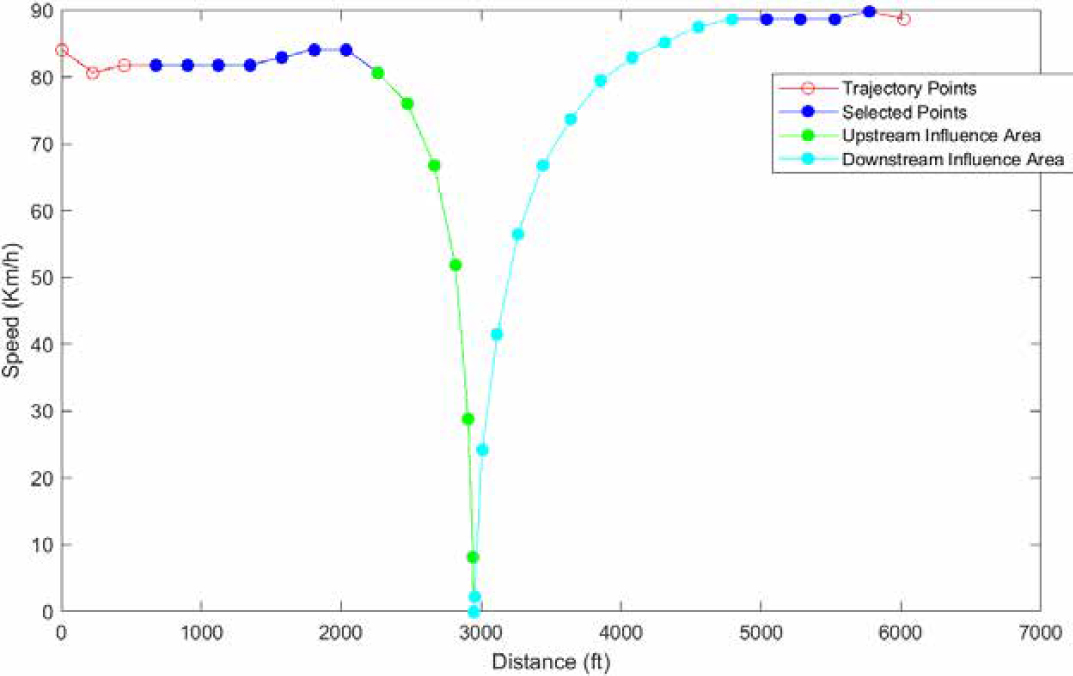
Sample Trajectory, Step 3
- Identified upstream influence area based on speed profile – shown in Figure D-40
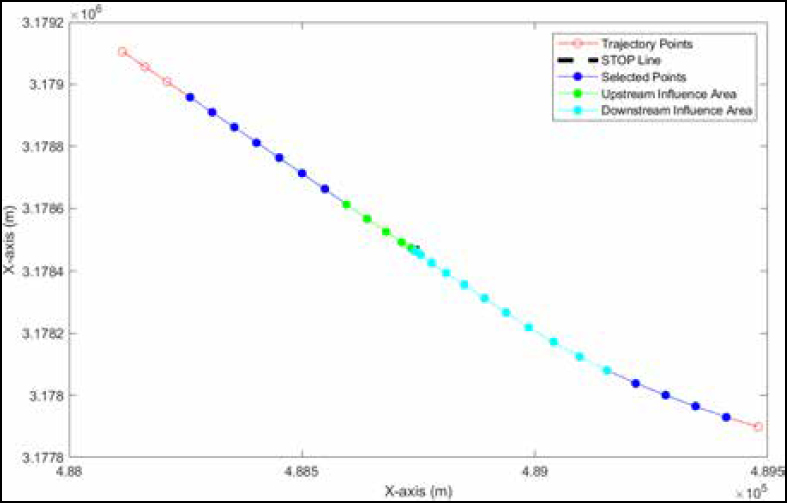
Sample Trajectory, Step 4
- Identified Downstream Influence Area based on Speed profile – shown in Figure D-41
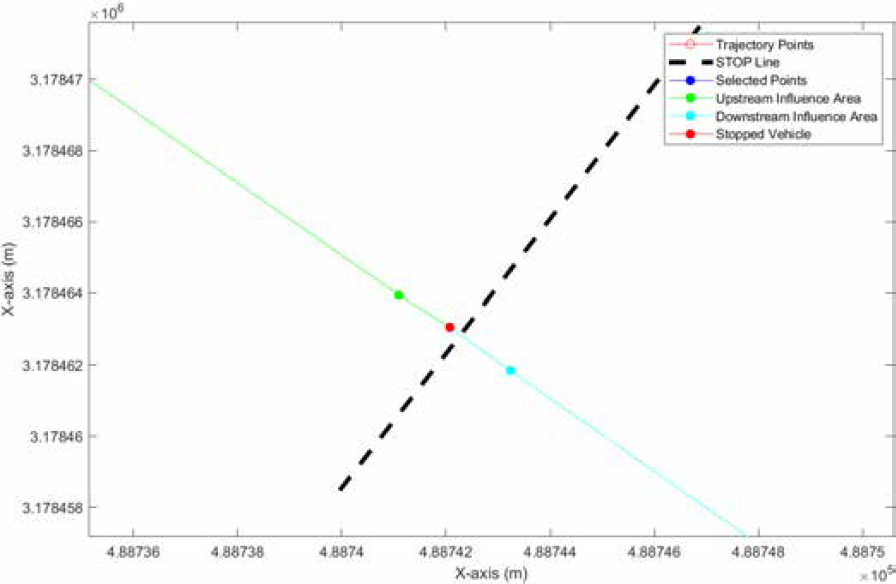
Sample Trajectory, Step 5
- Red point shows where vehicle was stopped.
- Dashed black line represents stop line.
Results
This section provides a summary of the analysis results. The results are presented in separate tables based on intersection control type and the upstream and downstream influence area (IA), as follows.
Table D-3. Upstream IA results for signalized intersection
| Site | Dir | N | Mean IA ft (Speed mph) | Std. Dev IA ft (Speed mph) | 50th Percentile IA ft (Speed mph) | 85th Percentile IA ft (Speed mph) |
|---|---|---|---|---|---|---|
| 01 | NB | 56 | 1239.10 (62.00) | 356.68 (8.27) | 1223.30 (63.70) | 1684.60 (69.58) |
| SB | 103 | 1443.40 (64.15) | 398.51 (8.64) | 1391.90 (62.99) | 1869.40 (72.33) | |
| EB | 303 | 1056.80 (57.19) | 396.94 (9.54) | 965.29 (56.55) | 1534.90 (68.01) | |
| WB | 509 | 547.55 (42.84) | 202.98 (7.17) | 502.95 (42.94) | 774.90 (50.11) | |
| 02 | EB | 878 | 877.52 (61.05) | 301.88 (7.13) | 835.71 (60.64) | 1228.10 (68.01) |
| WB | 541 | 799.95 (62.16) | 279.48 (7.67) | 750.88 (61.56) | 1071.10 (70.86) | |
| 03 | EB | 502 | 867.03 (64.26) | 286.60 (6.54) | 821.18 (64.42) | 1186.10 (70.86) |
| WB | 544 | 891.98 (69.85) | 305.88 (7.74) | 854.06 (69.43) | 1205.40 (77.30) | |
| 04 | NB | 593 | 927.66 (54.38) | 315.83 (6.55) | 908.80(55.12) | 1270.60 (60.52) |
| SB | 644 | 761.84 (49.57) | 208.92 (5.56) | 739.40 (49.39) | 975.55 (55.83) |
Table D-4. Downstream IA results for signalized intersection
| Site | Dir | N | Mean IA ft (Speed mph) | Std. Dev IA ft (Speed mph) | 50th Percentile IA ft (Speed mph) | 85th Percentile IA ft (Speed mph) |
|---|---|---|---|---|---|---|
| 01 | NB | 48 | 1716.90 (63.36) | 546.99 (10.29) | 1850.0 (64.42) | 2270.70 (73.94) |
| SB | 100 | 1798.10 (62.20) | 436.52 (6.27) | 1830.80 (62.98) | 2252.20 (68.01) | |
| EB | 297 | 650.80 (42.32) | 352.98 (7.22) | 542.73 (41.51) | 1027.0 (50.11) | |
| WB | 470 | 1535.80 (58.25) | 450.90 (8.26) | 1573.20 (58.70) | 2057.60 (66.57) | |
| 02 | EB | 881 | 1469.20 (60.41) | 519.46(7.06) | 1408.10 (60.12) | 2128.80 (68.01) |
| WB | 557 | 1224.94 (58.71) | 353.25 (6.07) | 1187.10 (58.69) | 1616.70 (65.14) | |
| 03 | EB | 490 | 1822.50 (67.01) | 459.37 (6.46) | 1811.30 (67.28) | 2404.01 (73.72) |
| WB | 515 | 1538.20 (64.23) | 431.58 (6.12) | 1498.90 (64.42) | 2056.10 (70.15) | |
| 04 | NB | 592 | 1060.01 (49.69) | 342.02 (5.35) | 1044.40 (50.11) | 1453.60 (55.12) |
| SB | 651 | 1267.97 (56.26) | 366.07 (5.95) | 1324.30 (56.55) | 1668.50 (62.27) |
*IA = Influence Area
Table D-5. Upstream IA results for stop-controlled intersection
| Site | Dir | N | Mean IA ft (Speed mph) | Std. Dev IA* ft (Speed mph) | 50th Percentile IA ft (Speed mph) | 85th Percentile IA ft (Speed mph) |
|---|---|---|---|---|---|---|
| 01 | EB | 131 | 689.33 (49.62) | 255.79 (7.12) | 681.50 (48.67) | 950.13 (56.54) |
| 02 | NB | 123 | 517.28 (44.92) | 170.95 (7.54) | 482.75 (45.09) | 709.75 (52.29) |
| 03 | SB | 252 | 735.95 (51.94) | 248.08 (7.07) | 700.71 (51.89) | 1031.20 (59.04) |
| 04 | SB | 51 | 599.99 (45.92) | 288.35 (7.05) | 460.21 (45.09) | 999.26 (55.00) |
| 05 | NB | 20 | 903.87 (58.94) | 309.75 (6.43) | 827.90 (59.05) | 1289.30 (64.78) |
| 06 | SB | 22 | 829.46 (51.24) | 309.72 (6.71) | 789.79 (50.46) | 1205.10 (58.70) |
| 07 | NB | 526 | 768.54 (51.62) | 210.37 (7.02) | 753.15 (52.25) | 976.33 (58.69) |
*IA = Influence Area
Table D-6. Downstream IA results for stop-controlled intersections
| Site | Dir | Turn | N | Mean IA ft (Speed mph) | Std. Dev IA ft (Speed mph) | 50th Percentile IA ft (Speed mph) | 85th Percentile IA ft (Speed mph) |
|---|---|---|---|---|---|---|---|
| 01 | EB | RT | 36 | 1200.00(54.26) | 319.82(4.72) | 1091.37(54.04) | 1695.60(60.20) |
| LT | 99 | 977.53(48.34) | 348.69(6.96) | 1109.30(46.53) | 1330.50(56.54) | ||
| 02 | NB | RT | 63 | 1415.40(61.51) | 270.71(7.12) | 1409.90(62.27) | 1687.50(66.60) |
| LT | 33 | 1332.6(64.07) | 282.40(6.98) | 1257.10(63.70) | 1573.10(72.36) | ||
| 03 | SB | RT | 27 | 1217.20(57.45) | 86.87(4.93) | 1240.90(57.26) | 1302.40(64.02) |
| LT | 212 | 1452.95(61.07) | 326.98(6.88) | 1469.38(61.56) | 1832.77(67.28) | ||
| 04 | SB | RT | 12 | 1589.40(63.70) | 282.94(5.78) | 1657.60(62.63) | 1857.70(69.93) |
| LT | 10 | 1929 (68.43) | 481.52 (8.26) | 1934.95(68.71) | 2556.98(75.87) | ||
| 05 | NB | RT | --- | --- | --- | --- | --- |
| LT | 44 | 1471.01(59.36) | 331.25(6.79) | 1427.90(59.05) | 1882.30(67.06) | ||
| 06 | SB | RT | 11 | 1232.40(58.88) | 229.98(7.60) | 1177.30(58.69) | 1510.90(67.75) |
| LT | 88 | 1474.40(61.95) | 299.77(5.57) | 1504.60(62.27) | 1805.20(68.00) | ||
| 07 | NB | RT | 44 | 1766.90(65.23) | 407.56(6.52) | 1728.10(66.57) | 2282.30(71.50) |
| LT | 474 | 1785.20(64.69) | 390.89(5.39) | 1735.90(65.14) | 2234.70(70.15) |
--- Missing data for right-turn movements
Table D-7. Upstream IA results for roundabout intersections
| Site | Dir | N | Mean IA ft (PSL mph) | Std. Dev IA ft (PSL mph) | 85th Percentile IA ft (PSL mph) |
|---|---|---|---|---|---|
| 01 | NB | 393 | 627.35 (50) | 102.57 (50) | 729.50 (50) |
| 02 | NB | 96 | 532.40 (35) | 182.32 (35) | 743.41 (35) |
| 03 | WB | 139 | 407.45 (35) | 165.03 (35) | 588.75 (35) |
PSL: posted speed limit.
Table D-8. Downstream IA results for roundabout intersections
| Site | Bound | N | Mean IA ft (Speed mph) | Std. Dev IA ft (Speed mph) | 85th Percentile IA ft (Speed mph) |
|---|---|---|---|---|---|
| 01 | NB | 406 | 873.86 (50) | 192.55 (50) | 1068.80 (50) |
| 02 | NB | 96 | 446.26 (35) | 173.69 (35) | 687.03 (35) |
| 03 | WB | 141 | 522.42(35) | 164.63 (35) | 700.29(35) |
Percentile Selection Procedures
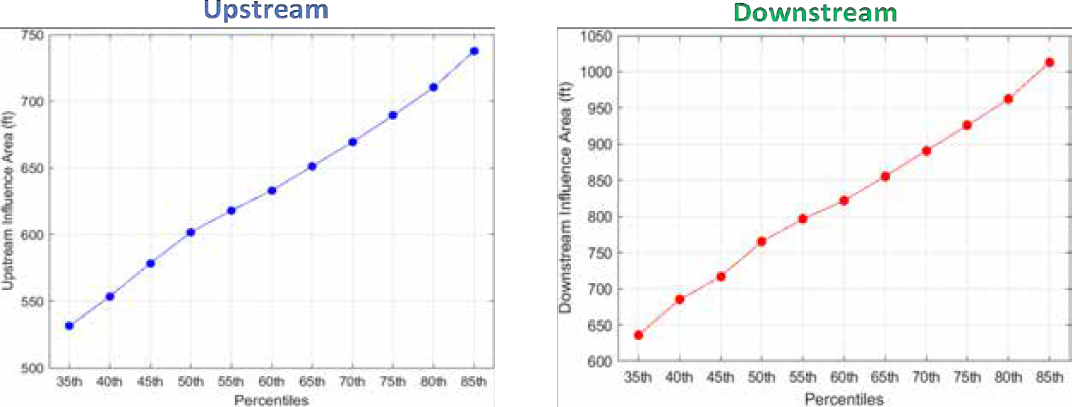
Length of Upstream Influence Area
To examine the impact of three different traffic controls (i.e., intersection types), the upstream IA at differences is illustrated in Figure D-42. For instance, 70th percentile IA lengths for “Stop” control intersection is 800 ft, Signalized Intersection is 1020 ft, and roundabout is 670 ft.

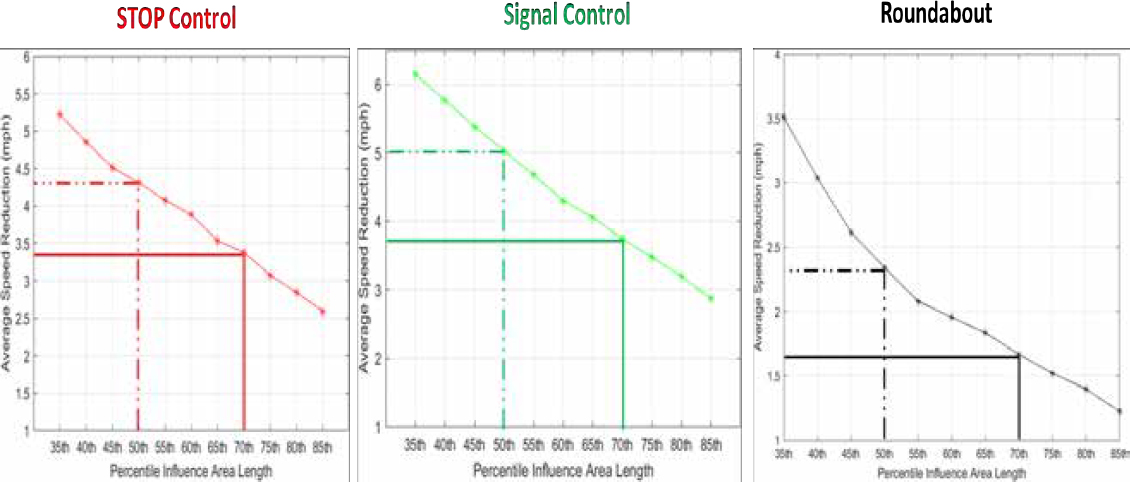
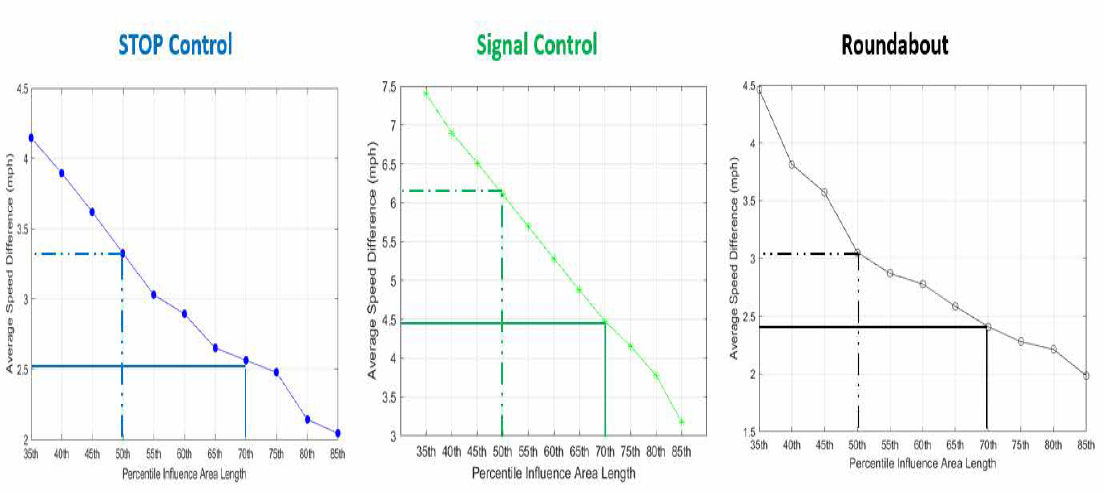
Upstream Influence Area: Speed Reduction
To determine the speed drop from running speed of the upstream segment on the approach to intersection, average speed reduction at different locations (different percentile upstream IA lengths) on upstream approach were calculated. Figure D-43 shows the average speed reduction from the operating speed to the distance of specific percentile of upstream IA length. For example, the average speed reduction from the operating speed to the 70th percentile distance upstream of the stop-control intersection is 3.4 mph, whereas at a 50th percentile distance the speed reduction is about 4.35 mph. The speed reduction upstream of the roundabout is different from the other two types of intersections because most of the vehicles do not stop at “Yield” line of the roundabout approach.
Upstream Influence Area: Average percentage speed reduction
The posted speed limits at different sites were different. Therefore, instead of comparing magnitude of speed reduction for different intersection controls, average percentage speed reduction is a better measure to select an upstream IA length based on percentile length as shown in Figure D-44.
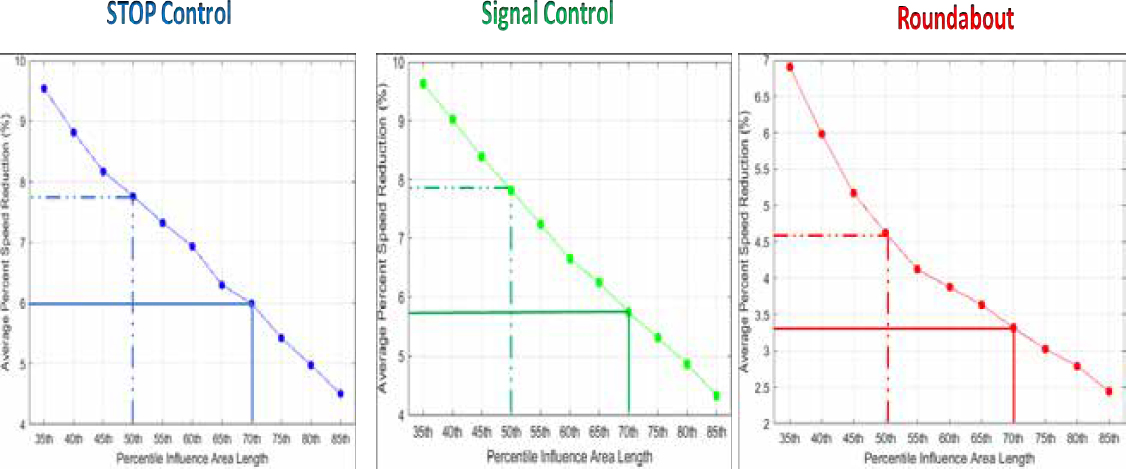
Decision Rule – Upstream Influence Area
- Traffic operational analysis is different from safety applications.
- Tangible impact on traffic operations rather than trying to incorporate a vast majority of drivers.
- Signal and stop-control require vehicles to stop, a roundabout does not.
- Recommended 70th percentile of IA length for signal and stop-control intersections.
- More than 5% (3 mph) reduction in average speed (≈ 6%).
- Recommended 50th percentile of IA length for roundabouts.
- Corresponds to approximately 4.5% (2.4 mph) average speed reduction.
Downstream Influence Area: Speed difference
Figure D-45 illustrates the speed difference between the downstream approach running speed and the speed at different percentiles IA lengths. For example, the speed at 70th percentile downstream distance of signalized intersection is about 4.5 mph less than the running speed on downstream segment.
Downstream Influence Area: Average percentage Speed difference
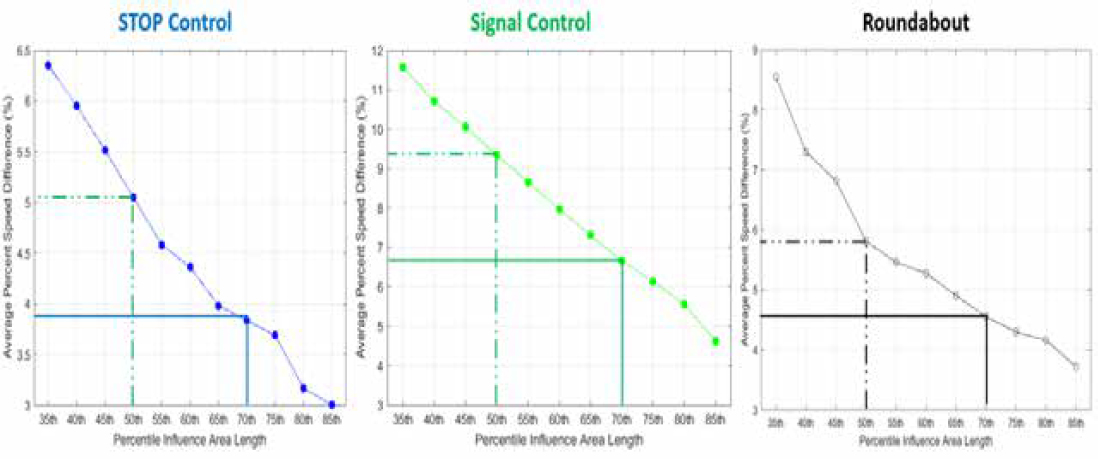
Decision Rule – Downstream Influence Area
- Traffic operational analysis is different from safety applications.
- Tangible impact on traffic operations rather than trying to incorporate a vast majority of drivers.
- At signal and stop-control, vehicle starts from stop position. At roundabout, vehicle starts from a reduced speed.
- Recommended 70th percentile of IA length for signal control intersections.
- Speed difference is more than 6.5% from the downstream average speed (6.2 mph).
- Recommended 50th percentile of IA length for roundabouts.
- Speed difference is approximately 5.8% (3.1 mph).
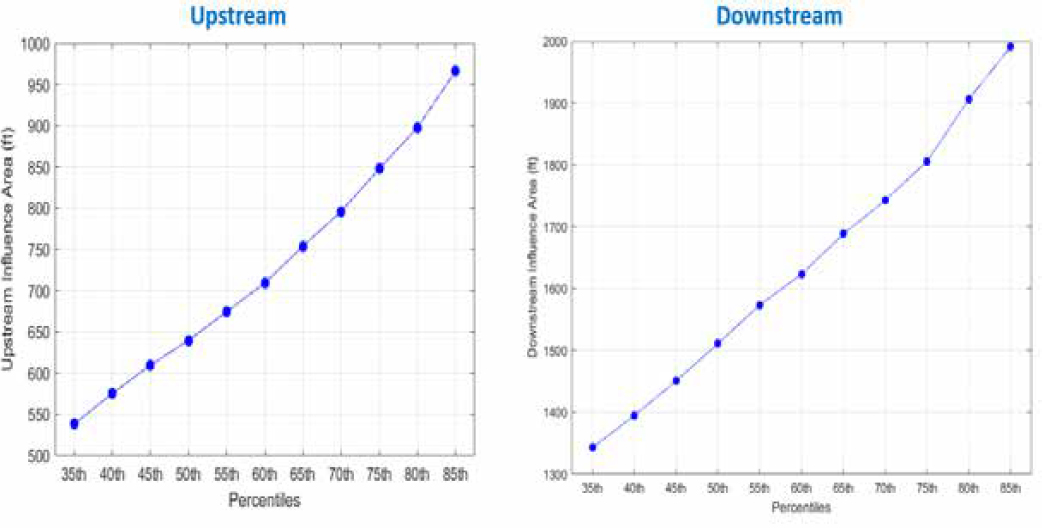
Comparison of Upstream and Downstream IAs
Signalized intersection

Roundabout intersection
Stop-control intersection
Influence Area Equations and Look-Up Tables
Upstream IA at Signal Control Intersections
| [D-1] |
Multilane Highways
| Mean Speed (mph) | 70th Percentile IA (ft) | |||||
|---|---|---|---|---|---|---|
| HV 5% | HV 10% | HV 15% | HV 20% | HV 25% | HV 30% | |
| 45 | 325 | 330 | 335 | 345 | 350 | 355 |
| 50 | 505 | 510 | 515 | 520 | 530 | 535 |
| 55 | 685 | 690 | 695 | 70 | 710 | 715 |
| 60 | 865 | 870 | 875 | 880 | 890 | 895 |
| 65 | 1045 | 1050 | 1055 | 1060 | 1070 | 1075 |
| 70 | 1220 | 1230 | 1235 | 1240 | 1250 | 1255 |
| 75 | 1400 | 1410 | 1415 | 1420 | 1425 | 1430 |
Two-lane Highways
| Mean Speed (mph) | 70th Percentile IA (ft) | |||||
|---|---|---|---|---|---|---|
| HV 5% | HV 10% | HV 15% | HV 20% | HV 25% | HV 30% | |
| 45 | 700 | 705 | 710 | 720 | 725 | 730 |
| 50 | 880 | 885 | 890 | 895 | 900 | 910 |
| 55 | 1060 | 1065 | 1070 | 1075 | 1080 | 1090 |
| 60 | 1240 | 1245 | 1250 | 1255 | 1260 | 1270 |
| 65 | 1420 | 1425 | 1430 | 1435 | 1440 | 1450 |
| 70 | 1595 | 1600 | 1610 | 1615 | 1620 | 1630 |
| 75 | 1775 | 1780 | 1790 | 1795 | 1800 | 1810 |
Variable definitions
- MeanSpeedMPH = average upstream operating speed (mph)
- %HeavyVeh = percentage of heavy vehicles (per HCM definition) in the traffic stream
- Imultilane = indicator variable, =1 if upstream roadway has multiple through lanes, = 0 otherwise
Downstream IA at Signal Control Intersections
| [D-2] |
Multilane Highways
| Mean Speed (mph) | 70th Percentile IA (ft) | |||||
|---|---|---|---|---|---|---|
| HV 5% | HV 10% | HV 15% | HV 20% | HV 25% | HV 30% | |
| 45 | 660 | 700 | 735 | 770 | 810 | 845 |
| 50 | 965 | 1000 | 1035 | 1070 | 1110 | 1145 |
| 55 | 1265 | 1300 | 1340 | 1345 | 1410 | 1445 |
| 60 | 1565 | 1600 | 1640 | 1675 | 1710 | 1750 |
| 65 | 1870 | 1900 | 1940 | 1975 | 2015 | 2050 |
| 70 | 2170 | 2205 | 2240 | 2280 | 2315 | 2350 |
| 75 | 2470 | 2505 | 2540 | 2580 | 2615 | 2650 |
Two-lane Highways
| Mean Speed (mph) | 70th Percentile IA (ft) | |||||
|---|---|---|---|---|---|---|
| HV 5% | HV 10% | HV 15% | HV 20% | HV 25% | HV 30% | |
| 45 | 815 | 855 | 890 | 925 | 960 | 1000 |
| 50 | 1120 | 1155 | 1190 | 1225 | 1265 | 1300 |
| 55 | 1420 | 1455 | 1490 | 1530 | 1565 | 1600 |
| 60 | 1720 | 1755 | 1790 | 1830 | 1865 | 1900 |
| 65 | 2020 | 2060 | 2095 | 2130 | 2165 | 2200 |
| 70 | 2325 | 2360 | 2395 | 2430 | 2470 | 2505 |
| 75 | 2625 | 2660 | 2695 | 2730 | 2470 | 2805 |
Variable definitions
- MeanSpeedMPH = average downstream operating speed (mph)
- %HeavyVeh = percentage of heavy vehicles (per HCM definition) in the traffic stream
- Imultilane = indicator variable, = 1 if downstream roadway has multiple through lanes, = 0 otherwise
Upstream IA at Stop-Control Intersections
| [D-3] |
| Mean Speed (mph) | 70th Percentile Upstream IA (ft) |
|---|---|
| 45 | 570 |
| 50 | 760 |
| 55 | 950 |
| 60 | 1145 |
| 65 | 1335 |
Downstream IA at Stop-Control Intersections
| [D-4] |
| Mean Speed (mph) | 70th Percentile Downstream IA (ft) |
|---|---|
| 45 | 930 |
| 50 | 1150 |
| 55 | 1370 |
| 60 | 1595 |
| 65 | 1815 |
Variable definitions
- MeanSpeedMPH = average up/downstream operating speed (mph)
Upstream IA at Roundabout Intersections
| [D-5] |
Note: As the data were available for only three sites, models were developed using individual vehicle speeds instead of mean operating speed at each site.
| Mean Speed (mph) | 50th Percentile IA (ft) | |||
|---|---|---|---|---|
| CS = 10 mph | CS = 15 mph | CS = 20 mph | CS = 25 mph | |
| 35 | 605 | 530 | 455 | 380 |
| 40 | 660 | 580 | 505 | 430 |
| 45 | 710 | 635 | 555 | 480 |
| 50 | 760 | 685 | 605 | 530 |
| 55 | 810 | 735 | 660 | 580 |
| 60 | 860 | 785 | 710 | 635 |
CS = mean circulating speed
Downstream IA at Roundabout Intersections
| [D-6] |
Note: As the data were available for only three sites, models were developed using individual vehicle speeds instead of mean operating speed at each site.
| Mean Speed (mph) | 50th Percentile IA (ft) | |||
|---|---|---|---|---|
| CS = 10 mph | CS = 15 mph | CS = 20 mph | CS = 25 mph | |
| 35 | 560 | 425 | 290 | 155 |
| 40 | 725 | 590 | 455 | 320 |
| 45 | 890 | 755 | 620 | 485 |
| 50 | 1050 | 920 | 780 | 650 |
| 55 | 1215 | 1080 | 945 | 810 |
| 60 | 1380 | 1245 | 1110 | 975 |
CS = mean circulating speed
Variable definitions
- IARoundabout/Upstr = Upstream IA of roundabout (ft)
- IA.Roundabout/Downstr = Downstream IA of roundabout (ft)
- MeanOSmph = average up/downstream average operating speed (mph)
- MeanCSmph = average roundabout circulating speed (mph)
The preceding equations were developed based on data from roadways with posted speed limits of 45 mph and higher. Consequently, these equations may yield unreasonable results for roadways with lower posted speed limits. Both the upstream and downstream influence distances are compared against practical minimum influence distances, namely, practical stopping distance for the upstream IA and practical acceleration distance for the downstream IA. In both cases, for simplicity, the reference speed is the posted speed limit.
The calculated upstream IA value should be compared to braking distance, per the following equation, and the maximum value used. Note that this formula is simplified, by assuming level grade.
| [D-7] |
Where:
BrakingDist = distance for vehicle to decelerate from speed VInit to a stop, in feet
VInit = initial speed, in ft/s; posted speed limit is recommended value
a = deceleration rate, 10.0 ft/s/s, based on Institute of Transportation Engineers (ITE) recommendations for slowing on an approach to a signalized intersection (ITE, 2016)
Likewise, the calculated downstream IA value should be compared to practical acceleration distance, per the following equation, and the maximum value used.
| [D-8] |
Where:
AccelDist = distance for vehicle to accelerate from a stop to speed VFinal, in feet
VFinal = final speed, in ft/s; posted speed limit is recommended value


