On-Bridge Stormwater Treatment Practices: A Guide (2024)
Chapter: 5 Decision-Making Framework and Supplemental Guidance

CHAPTER 5
Decision-Making Framework and Supplemental Guidance
Chapter at a Glance
This chapter continues the stepwise process from Chapter 4 that was outlined in Figure 10. It provides a framework for assessing design alternatives and making decisions about how to proceed. It also provides supplemental guidelines on scoping additional studies that may be needed to support decisions. This chapter is intended to support the design team in answering the following questions:
- Which of the alternatives developed in Chapter 4 should be selected?
- How should the project proceed?
- If decisions are unclear, what additional information or study findings may be needed to support decisions? How can this information be obtained?
Step 3: Perform Multi-Factor Preliminary Design Evaluation
Decisions to be Supported
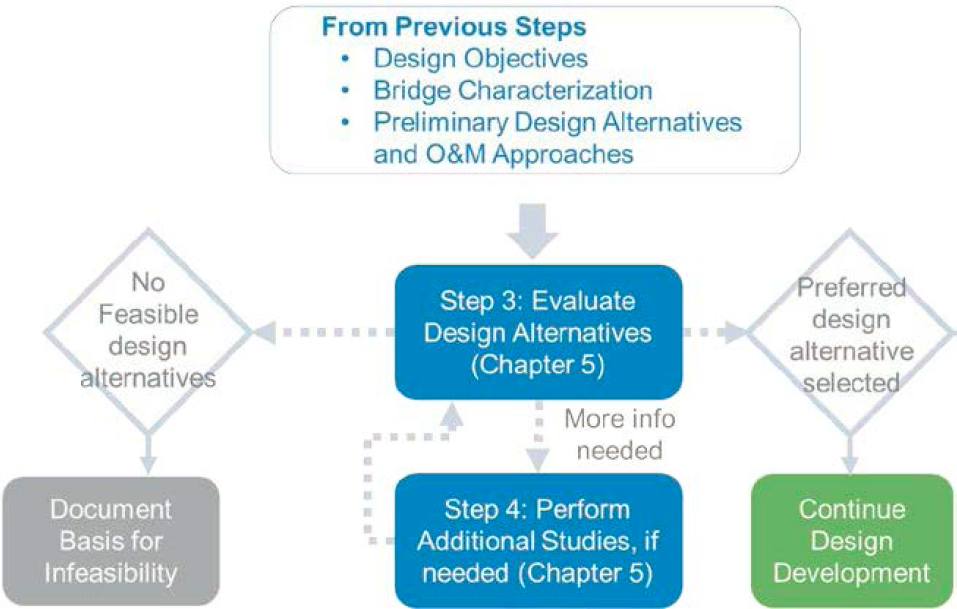
Step 3 is a major decision gate to determine the next steps for the project. As the ultimate outcome of this step, the design team and decision-makers need to reach one of three findings:
- A preferred alternative is selected and is advanced to further design phases. This may not be a conclusive finding of feasibility. However, one design alternative is determined to be clearly superior and is potentially feasible.
- Insufficient information is available to determine a preferred alternative. Additional study is needed to help assess feasibility and/or determine the best alternative to advance.
- Despite the iterative process to try to find feasible designs, there are no alternatives that are feasible. This may need to be documented to help justify an approach that does not involve on-bridge treatment BMPs.
The roadmap first introduced in Chapter 3 illustrates this decision gate. Figure 33 shows an excerpt of this roadmap pertaining to Step 3 and 4, and the potential outcomes of the decision-making process.
Decision-Making Approach
The previous section defines the decisions that need to be made. It does not define how decisions should be made. This section presents a framework for making these decisions, including the following three sub-steps:
- 3a: Screen for fatal flaws or a clearly preferred alternative.
- 3b: Select and define a decision-making framework.
- 3c: Evaluate preliminary design alternatives and consult necessary internal departments to populate this framework.
- 3d: Prioritize information gaps and scope necessary supplemental studies, as needed. Return to Step 3c.
Step 3a: Screen for Fatal Flaws or Clearly Superior Options
Following bridge characterization (Chapter 2) and in Chapter 4 (Step 1), checks for likely fatal flaws were performed when assessing whether any locations could support a BMP.
A similar fatal flaw screening is relevant at this decision gate as well. To avoid unnecessary complexity, design teams can use a simple screening of options in the first phase to determine if multiple alternatives are viable. If all options have clear or likely fatal flaws, further complexity in decision-making is not needed. Or, if one option is a clear favorite due to serious issues with other options, further complexity is not needed. In either case, it may be adequate to simply document the basis for these findings and skip the following steps.
If there are two or more options that appear to be potentially feasible and there is not a clear favorite based on simpler methods, then the design team should proceed to the following sub-steps.
Step 3b: Select and Define Decision-Making Framework
Defining a decision-making framework is important before performing the design evaluation as the framework will define the specific metrics that need to be calculated and the parties that need to contribute to this evaluation.
Most highway projects involve complex decisions that require multiple objectives to be considered and balanced. Where existing DOT decision-making processes can be adapted to serve the decisions needed for on-bridge stormwater treatment, this is likely the most efficient and effective as it builds on familiarity and past experience.
If existing decision-making frameworks are not adequate to support the decisions presented in this step, various modern decision-making practices can be reviewed and adapted. The following decision-making frameworks may be applicable:
- Risk Analysis: Assessing and managing risks and uncertainties associated with different stormwater treatment alternatives, helping decision makers understand and mitigate potential negative outcomes, prioritizing safety and potential damage.
- Life Cycle Cost Analysis: Evaluating the total costs of an option throughout its entire life cycle, including construction, maintenance, and eventual replacement, to optimize cost-effectiveness.
- Multi-Criteria Decision Analysis (MCDA): Integrating multiple criteria, such as safety, lifecycle cost, and design effectiveness, to systematically evaluate and prioritize design alternatives.
Elements of each approach would be applicable to determining how well each alternative meets the objectives defined in Chapter 2.
One viable option is the MCDA approach, with risk assessment and lifecycle cost being two major inputs to the MCDA. Yannis et al. (2020) provides a review of the state of the practice of MCDA for transportation projects. While various sophisticated methods can be used, an MCDA can be as simple as a weighted scoring matrix. Most MCDA processes involve the following:
- Defining objectives and criteria. This is provided in Chapter 2.
- Defining options. This is provided in Chapter 3 and Chapter 4.
- Scoring options against the objectives and criteria using a decision matrix approach. For example, for each objective, determine how well each alternative scores.
- Weighting and aggregation of scores. This involves assigning relative importance to the objectives and aggregating the results of how well each alternative compares for each objective.
- Sensitivity and robustness tests. This involves assigning uncertainty ranges to different input parameters and testing to determine if, within the uncertainty range of input parameters, different alternatives may be selected. This could indicate that the alternatives are similarly favorable. Or it could indicate that uncertainty in inputs needs to be reduced to support a decision.
Step 3c: Apply Decision-Making Framework to Evaluate Preliminary Design Alternatives
In order to apply the selected framework, the preliminary design alternatives will need to be quantified and scored based on the evaluation objectives and criteria. The inputs to this process will likely be a mix of qualitative ratings and quantitative calculations.
Examples of design objectives with qualitative ratings could include:
- Structural risk. This could be a fatal flaw issue. See guidelines in this chapter for scoping structural analysis of bridge retrofits.
- Worker and driver safety (e.g., complexity and risk of O&M operations, lateral spread risks). These could be a fatal flaw issue.
- Certainty of constructability, maintainability, and lifecycle costs. If one alternative offers greater certainty, it should be scored higher if all else is equal.
- Traffic impacts from construction.
- Traffic impacts from O&M.
- Design and construction complexity/constructability. This could be redundant with quantitative inputs for lifecycle costs and may not be needed as both a qualitative and quantitative input.
- O&M requirements and complexity. This could be redundant with quantitative inputs for lifecycle costs and may not be needed as both a qualitative and quantitative input.
Examples of quantitative inputs include:
- Fraction of the water quality sizing target that is provided by the BMPs on the project. This could be expressed as the portion of the bridge treated multiplied by the average portion of the water quality sizing target provided for the areas that are treated. This is a surrogate for project benefits. This allows different alternatives to be compared that may have different sizes and different areas treated.
- Lifecycle costs, including design, construction, and O&M costs. See guidelines in this chapter for developing estimates. Alternatively, qualitative ratings could be assigned as part of this step to help select a preferred alternative, and lifecycle cost estimates could be developed as part of subsequent design phases.
To account for uncertainty, inputs can be expressed as a range to enable sensitivity analysis and robustness testing.
Once these inputs are developed for each alternative, the design and decision-making team can apply the selected decision-making framework to compute weighted scores (or ranges of scores) for each option. The results of this analysis can be interpreted to determine if clear decisions are supported.
Step 3d: Prioritize Information Gaps and Scope Necessary Supplemental Studies
The results of Step 3b may indicate that certain issues have a greater influence on decisions and are not quantified well enough to allow distinction between alternatives (i.e., scoring ranges of alternatives overlap). If these issues are identified, they should be scoped and performed as part of Step 4, and the findings should feed back into Step 3c above to improve decision-making power.
Quick Reference Feasibility Checklist
The checklist in Table 17 is intended as a simple tool to organize decision-making steps. This builds on the guidelines provided in Chapters 2, 3 and 4. This checklist is not intended to be comprehensive or apply to all types of projects. It is intended to serve as an efficient reference.
Step 4: Perform Supplemental Studies to Support Decisions
This step should be performed based on the prioritized information needs identified in Step 3. Examples of potential supplemental studies that may be needed to help support alternatives analyses and/or feasibility assessments include:
- Structural analysis and design of structural support structure. If structural analysis specific to the candidate BMP locations has not yet been performed as part of bridge characterization or design development, it may be necessary to perform this analysis at this step. Guidelines for the scoping of structural analysis methods are provided in this chapter.
- Whole lifecycle cost analysis. A quantitative assessment of whole lifecycle costs can be a powerful tool to integrate several factors, including design complexity, special engineering needs to meet design objectives, complexity and scope of construction, O&M frequency and requirements, and other factors. This can help design teams evaluate tradeoffs between upfront design and construction costs and long-term O&M costs. Guidelines for scoping of lifecycle costing methods are provided in this chapter.
Table 17. Quick reference feasibility checklist.
| Quick Reference Checklist | ||
|---|---|---|
| Part A: Need for On-Bridge BMPs | ||
| Are on-land or other alternative treatment or compliance options available? | These options should be evaluated before considering on-bridge BMPs. |
Continue to evaluate on-bridge design. |
| Part B: Initial Fatal Flaw Assessment Do conditions exist that likely render on-bridge BMPs infeasible? See Chapter 2, “Screening of Potential Fatal Flaws,” and Chapter 4, “Step 1: Screen Potential BMP Locations,” for additional rationales. If one or more of the following conditions apply, this may be a fatal flaw for on-bridge treatment. |
||
| Conditions require the BMPs to be located underneath the footprint of the bridge deck and below the lower strand. | ||
| Bridge deck drains are located between girders, making it infeasible to convey water to a treatment location. | ||
| Edge barriers with crash test ratings of TL-4 or lower and no option for BMP support from girders or piers, making it highly unlikely for placement of BMPs on edge barriers without major modifications. | ||
| The bridge is classified as poor structural condition or is posted for load. | ||
| Unacceptable traffic interruptions to emergency services or other critical functions. | ||
| Other fatal flaws are identified in the site investigation. | ||
| Enter explanatory notes for fatal flaws. | ||
| Part C: Core Design Criteria Can the design be configured to meet the project-specific objectives defined in Chapter 2? If the design cannot meet each of these criteria, then it is likely not acceptable. This is a generic checklist only. Development of project-specific objectives and feasibility thresholds are suggested. |
||
| Provides adequate stormwater treatment to meet regulatory requirements, including level of treatment provided, amount of water treated, portion of the bridge treated. | ||
| Avoids unacceptable traffic safety hazards from lateral spread by maintaining the design drainage capacity and avoiding increased risk of drainage system clogging. | ||
| Avoids unacceptable increase in structural risk by adhering to the findings of a bridge-specific structural analysis. | ||
| Minimizes traffic impacts to acceptable levels during construction and O&M by locating BMPs where they can be readily constructed and maintained. | ||
| Quick Reference Checklist | ||
|---|---|---|
| Protects worker safety during construction and O&M activities by designing systems that can be reasonably constructed and maintained. | ||
| Complies with material procurement policies for both the construction phase and the O&M phase. | ||
| Avoids damage to BMP from cold climates or excessive O&M burden due to cold weather operations. | ||
| For design criteria that cannot be met, provide explanation to justify infeasibility of design. | ||
| Part D: Cost and Financial Feasibility Is the project financially feasible? |
||
| Is the required capital and O&M cost needed to meet the design criteria above feasible? | ||
| How does the cost compare to other alternatives or DOT-specific feasibility benchmarks? | ||
| Could phasing the project with other planned construction or rehabilitation activities improve the cost? | ||
| Provide a summary of findings on cost and financial feasibility below: | ||
-
Refinement of construction materials and methods. More in-depth analysis to refine certain aspects of construction materials and methods can help improve understanding of lifecycle costs. Potential elements to evaluate include, but are not limited to:
- Capture and conveyance material (e.g., metal, plastic, or fiberglass).
- BMP box material (e.g., metal, plastic, or fiberglass).
- Permanent installations to support O&M activities, including ladders, platforms, fall restraints, hoists/winches, or other components.
- Options to construct the system from below the bridge (e.g., from a barge or temporary platform) versus closing lanes to perform work.
-
Greater details of BMP components to support obtaining fabrication and procurement estimates, including:
- Underdrain and outlet control system
- Connections between modules
- Internal baffles and piping
- Bypass system
- Research on local availability of filter media components
- Traffic impact study. This could help inform the direct cost and indirect economic impacts of traffic interruptions during construction and O&M, enabling these factors to be considered more quantitatively in decision-making.
- Bridge-specific water quality characterization study. Because runoff quality can vary substantially by climate and bridge type and can have an important impact on O&M intervals, there could be benefits to developing bridge-specific estimates rather than relying on regional or nationwide data. A study could quantify sediment and debris loading and/or sampling of runoff for TSS load.
- Full-scale BMP accelerated clogging study. Uncertainty in O&M intervals could be a major driving factor in lifecycle cost. If considering a design involving many treatment BMPs, it could be beneficial to perform accelerated clogging studies of full-scale units procured ahead of the full design and construction phase to improve estimates of clogging lifespan and effectiveness of routine O&M activities to restore permeability. This could also improve understanding of the cost to fabricate systems and improve engineer’s estimates of probable construction costs.
The following sections provide supplemental guidelines for scoping two of these studies that are likely to be broadly applicable.
- Scoping of structural analysis of on-bridge retrofits.
- Scoping of whole lifecycle cost analysis.
Guidance for Scoping of Structural Analysis
Each part of a bridge serves a structural purpose. Modifications to any part of a bridge, such as adding new weight and attachments, nearly always require structural assessment by a structural engineer. This assessment could find that (1) the added weight can be supported as is, (2) structural reinforcements are needed to support the added weight, or (3) there are no reasonable modifications that could be made to support the added weight.
The purpose of this section is to provide general guidelines for scoping structural analyses to determine the feasibility of attaching new stormwater treatment and conveyance systems to a bridge.
The primary focus of the information presented here is attachment to edge barriers. As described in Step 1, attaching stormwater treatment systems to edge barriers may be advantageous to allow construction and maintenance access without in-water or under-bridge work. However, compared to other bridge components, the edge barrier has the most points of potential failure (i.e., the edge barrier, the top slab overhang, the supporting girders, and the supporting piers) and generally has less structural resistance compared to girders or piers.
Due to differences in structural methods used by different DOTs and the large variability in bridge and edge barrier types, this section does not provide structural analysis guidance. This section is intended to help DOT design teams understand the general structural analysis framework for on-bridge retrofits in order to scope the appropriate structural analyses by qualified professionals.
General Framework for Structural Analysis of Stormwater Treatment Retrofits
The general framework presented in this section is based on the LRFD [Load-and-Resistance Factor Design] Bridge Design Specifications, 9th Edition (AASHTO 2021). The primary steps include:
- Determine existing design loads and load distribution that the bridge must support, prior to considering stormwater retrofits.
- Determine added loads from the stormwater retrofit and the location these loads would be applied. This can be done after the size and location of stormwater retrofits have been tentatively selected.
- Identify potential failure modes and associated points of failure.
- For each potential failure mode and point of failure:
- Calculate the sum of the applied load, inclusive of the stormwater retrofit.
- Calculate the sum of resisting forces.
- Determine if the resisting forces exceed the applied load with an acceptable factor of safety.
- Repeat this process for each failure mechanism and associated point of failure. This may include failure of edge barriers, top slab, girders, and/or piers, each of which could have a non-negligible applied load in excess of current conditions.
- Evaluate whether reasonable reinforcement could be added to increase the resistance for the limiting elements. Repeat calculations with these reinforcements added.
Several factors should be considered in applying this framework:
- The existing structural resistance of the bridge may be lower than the original design condition, particularly for older bridges where structural deterioration has occurred. An assessment of the current structural resistance should be informed by bridge inspection information.
- Design loads may have changed since original construction due to changes in design assumptions or changes in traffic characteristics. Current design loads should be used.
- The structural design methodology used as part of original design may be different than current methods. This guidance assumes that DOTs will update to current design methodologies when considering a retrofit of the bridge.
For edge barriers specifically, the following notes apply:
- Edge barriers are primarily intended to prevent vehicles from leaving the roadway; therefore, their design loads are primarily based on resisting vehicular impact forces.
- Types of edge barriers vary greatly.
- Points of failure for edge barriers may include: (1) overturning of the edge barrier, and/or (2) fracture of the bridge deck top slab overhang.
- Standards for edge barrier crash safety ratings have evolved substantially over recent decades. When considering whether a new stormwater retrofit can be attached to an edge barrier, the DOT will likely need to determine its current target crash test levels for the edge barrier (known as the “test level”) in order to determine the design load that the barrier needs to resist. References for selecting appropriate level ratings and the design forces associated with meeting these ratings are discussed later in this step.
Estimating the Weight of Stormwater Treatment Systems
The weight of stormwater treatment systems is a key input to structural analyses. When estimating the added weight, the design team should consider the following components:
- Conveyance elements such as pipes and gutters. Assume that conveyance systems are filled with saturated sediment and debris.
- Stormwater treatment device and mounting apparatus. Assume that the pre-treatment and headspace of the media is filled with sediment and the pore space of the entire system is saturated.
- Weight of maintenance personnel. Assume that three people will be supported by the treatment system during manual maintenance activities.
For the prototype system described in Chapter 3, the estimated design weight of a 4-ft × 6-ft treatment unit is approximately 14,550 lbs of load. Approximately 9,850 lbs of this load would be at the point of attachment and approximately 4,700 lbs would be distributed over the 100 ft span of the collection system. See the section titled “Weight Estimates” in Chapter 3 for additional detail about this calculation.
These hypothetical estimates are intended as an example only. Design teams should consider the proposed project-specific design of conveyance, mounting, and stormwater treatment systems when estimating weights for structural analysis.
Types of Barriers
Roadside hardware, such as barriers, are commonly used to reduce the potential severity of crashes on the roadside. Three general classes of bridge barriers are traffic barriers, pedestrian or bicycle barriers, and combination barriers. This section assumes that stormwater retrofits would be suspended from traffic barriers or combination barriers, as these are the only types of barriers that may have adequate resisting forces.
Traffic barriers, also known as railings, are generally made of reinforced concrete, metal, and/or timber; however, the majority of traffic barriers are reinforced concrete or metal. Bridges with timber decks on low volume secondary roads may have timber barriers. Figure 34 shows a typical range of traffic barrier design, illustrating the variability that will need to be considered during structural analysis. Appendix A of the Bridge Railing Manual prepared by Texas Department of Transportation (TxDOT 2020) is a good resource for the types of edge barriers that may be encountered in the bridge environment and is indicative of the variability, even within a single state.
Primary Design References for Bridge Edge Barriers
According to Roadside Safety Hardware (FHWA 2015), FHWA policy holds that roadside safety hardware installed on the National Highway System (NHS) should be in compliance with the crash testing and evaluation criteria contained in the Manual for Assessing Safety Hardware (MASH) (AASHTO 2016) or its predecessor, NCHRP Report 350 (Ross et al. 1993). In addition to NCHRP Report 350 and MASH, AASHTO provides other guidance related to the design and installation specifications of roadside hardware and safety hardware such as bridge barriers in section 13 of the LRFD Bridge Design Specifications (AASHTO 2021). Currently, most states have developed a bridge barrier design manual by incorporating guidance offered by MASH, the Roadside Design Guide (AASHTO 2011), LRFD Bridge Design Specifications, NCHRP Report 350, and other national publications and available research (Griffith 2010).
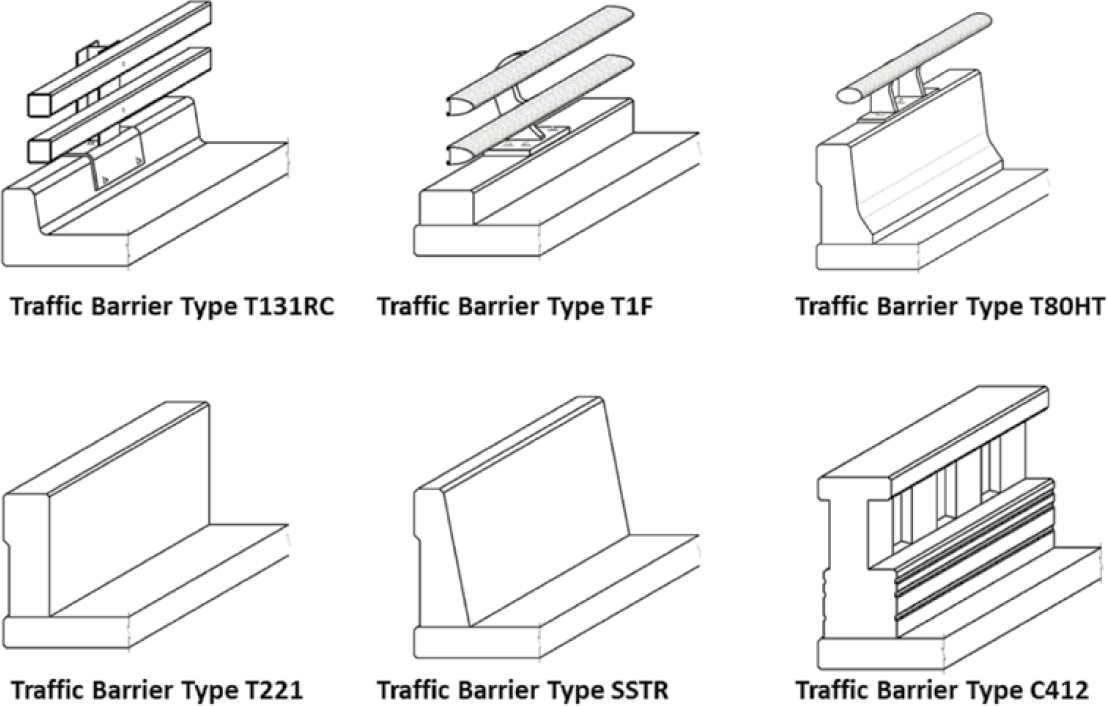
Figure 34. Various traffic barrier design types.
Design Loads Associated with Crash Test Levels
Design of edge barriers is a complicated process that requires a deep understanding of the principles of mechanics, including structural loadings, static and dynamic testing as well as design using computer simulations. Computer simulation tools such as LS-DYNA are widely used to evaluate the performance of roadside barriers against environmental and structural loads. Bridge edge barriers must have sufficient structural capacity to resist the lateral impact loads from a crashing vehicle as well as support for any additional loading such as signs, lights, or potential stormwater treatment retrofits.
MASH currently defines six different crash test levels (TL) for longitudinal barriers (AASHTO 2016). A given TL provides a certain level of protection against failure in the event of vehicle impacts. NCHRP Report 350 provides guidance for selecting the target TL rating for a given bridge. The selection of a TL is primarily based on the capacity of the bridge (vehicle size and speed) and the criticality of the bridge. The information regarding these tests for longitudinal barriers can be found in Table 18.
The LRFD Bridge Design Specifications (AASHTO 2021) provides additional information on selecting the appropriate test-level criteria for bridge barriers:
- TL-1: Generally acceptable for work zones with low posted speeds and very low-volume, low-speed local streets.
- TL-2: Generally acceptable for work zones and most local and collector roads with favorable site conditions as well as where a small number of heavy vehicles is expected and posted speeds are reduced.
- TL-3: Generally acceptable for a wide range of high-speed arterial highways with very low mixtures of heavy vehicles and with favorable site conditions.
- TL-4: Generally acceptable for most applications on high-speed highways, freeways, expressways, and Interstate highways with a mixture of trucks and heavy vehicles.
- TL-5: Generally acceptable for the same applications as TL-4 and where large trucks make up a significant portion of the average daily traffic or when unfavorable site conditions justify a higher level of rail resistance.
Table 18. Test Levels (AASHTO 2016; the detailed description of each test vehicle can be found in Appendix H of MASH).
Test Level |
Test Vehicle Designation and Type |
Test Conditions | |
|---|---|---|---|
| Speed, mph (km/h) | Angle, degrees | ||
| 1 | 1100C (Passenger Car) 2270P (Pickup Truck) |
31 (50) 31 (50) |
25 25 |
| 2 | 1100C (Passenger Car) 2270P (Pickup Truck) |
44 (70) 44 (70) |
25 25 |
| 3 | 1100C (Passenger Car) 2270P (Pickup Truck) |
62 (100) 62 (100) |
25 25 |
| 4 | 1100C (Passenger Car) 2270P (Pickup Truck) 10000S (Single-Unit Truck) |
62 (100) 62 (100) 56 (90) |
25 25 15 |
| 5 | 1100C (Passenger Car) 2270P (Pickup Truck) 36000V (Tractor-Van Trailer) |
62 (100) 62 (100) 50 (80) |
25 25 15 |
| 6 | 1100C (Passenger Car) 2270P (Pickup Truck) 36000T (Tractor-Tank Trailer) |
62 (100) 62 (100) 50 (80) |
25 25 15 |
- TL-6: Generally acceptable for applications where tanker-type trucks or similar high center of gravity vehicles are anticipated, particularly along with unfavorable site conditions.
It should be noted that these are the generally acceptable TLs, and states might have additional requirements as well.
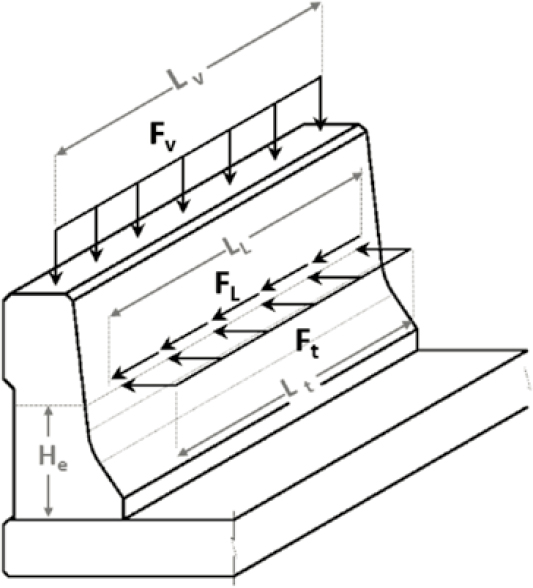
After determining the target TL rating for a bridge, the user can determine the design loads that edge barriers need to be designed to resist. Table 19 summarizes the standard design loads associated with each TL based on LRFD Bridge Design Specifications Section 13 (AASHTO 2021), and Figure 35 illustrates the variables presented in Table 19. Additional state-level criteria may apply.
Deck Overhang Behavior
LRFD specification requires that deck overhang should have sufficient strength to withstand the loads received from a vehicle crash to barrier and resistance to force the yield line failure pattern to remain within the barrier. It is recommended by LRFD specifications that the concrete deck overhang should not fail in a crash event before the barrier. This means the overhang should also be capable of resisting the reaction forces received from the barrier during a crash. According to Chang et al. (2012) the reinforcement of the overhang is usually designed based on the maximum bending moment (and ignoring the associated tensile force) among the different load combinations, including the extreme and seismic events. More information regarding deck overhang design can be found in Appendix 13.4 of the LRFD Bridge Design Specifications (AASHTO 2021).
Table 19. Minimum required design loads and dimension for barriers (1kip 5 = 4.45kN, 1ft = 0.31 m) (AASHTO 2021).
| Design Loads and Dimensions | TL-1 | TL-2 | TL-3 | TL-4 | TL-5A | TL-5 | TL-6 |
|---|---|---|---|---|---|---|---|
| Ft, transverse (kip) | 13.5 | 27.0 | 54.0 | 54.0 | 116.0 | 124.0 | 175.0 |
| FL, longitudinal (kip) | 4.5 | 9.0 | 18.0 | 18.0 | 39.0 | 41.0 | 58.0 |
| Fv, vertical (kip) down | 4.5 | 4.5 | 4.5 | 18.0 | 50.0 | 80.0 | 80.0 |
| Lt and LL (ft) | 4.0 | 4.0 | 4.0 | 3.5 | 8.0 | 8.0 | 8.0 |
| Lv (ft) | 18.0 | 18.0 | 18.0 | 18.0 | 40.0 | 40.0 | 40.0 |
| He (min) (in) | 18.0 | 20.0 | 24.0 | 32.0 | 40.0 | 42.0 | 56.0 |
| Hrail (min) (in) | 27.0 | 27.0 | 27.0 | 32.0 | 40.0 | 54.0 | 90.0 |
Ft = transverse vehicle impact force distributed over a length Lt at a height He above bridge deck
FL = longitudinal friction force along barrier
Fv = vertical force of vehicle laying on top of barrier
LL = longitudinal length of distribution of friction force FL
Lt = longitudinal length of distribution of impact force Ft along the barrier located a height of the He above the deck
Lv = longitudinal distribution of vertical force Fv on top of barrier
He = effective height of vehicle rollover force
Hrail = height of rail
Design Considerations for Stormwater Retrofit
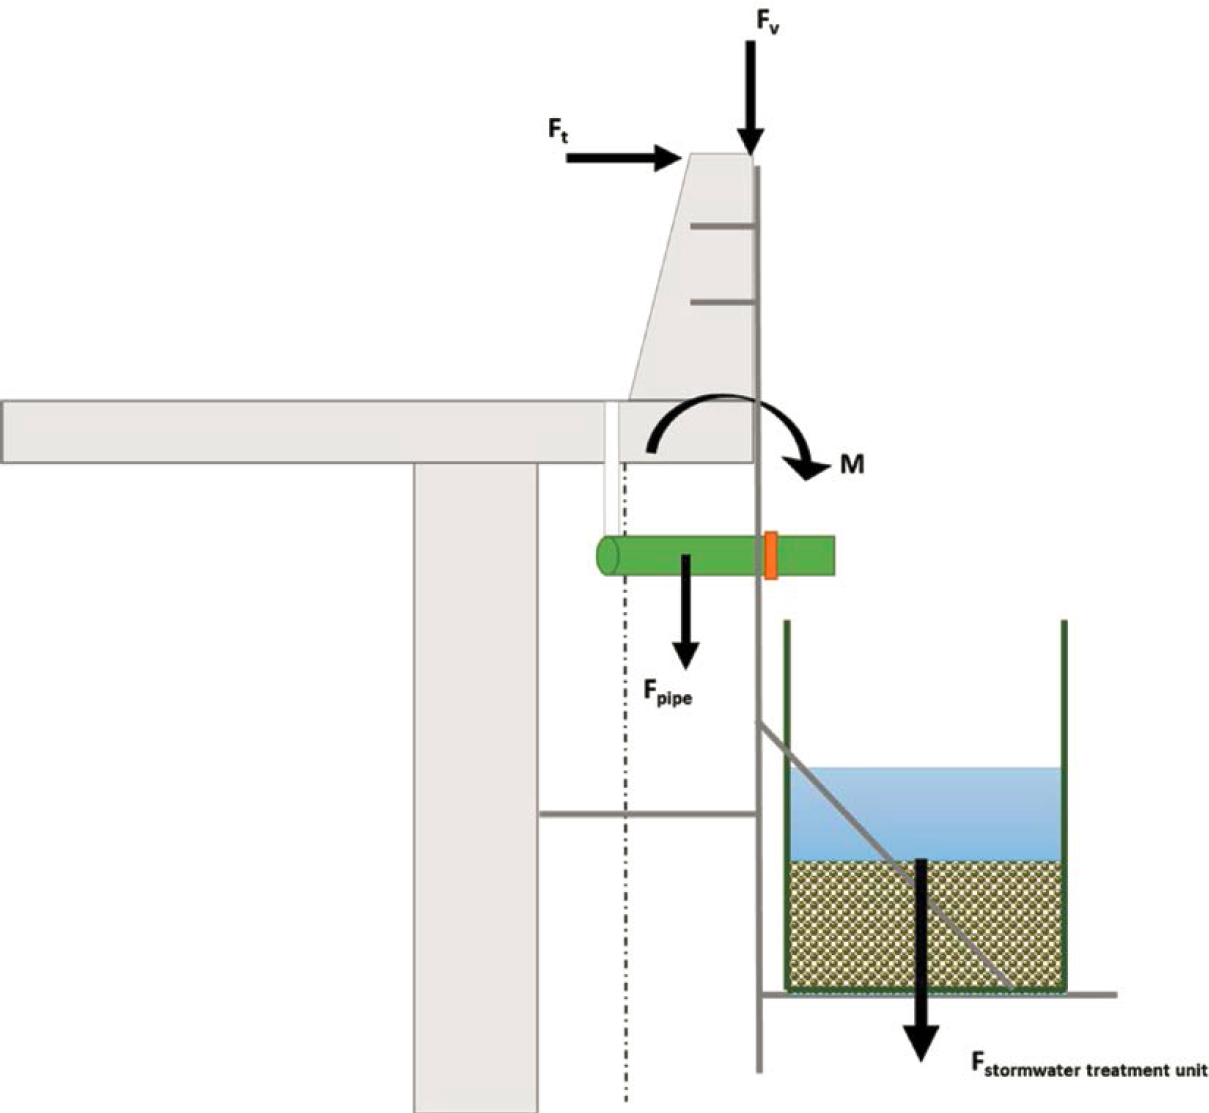
The primary purpose of traffic barriers is to contain and redirect crashing vehicles. The load applied to the edge barrier associated with a stormwater retrofit can be significantly increased compared to the forces associated with the selected crash test level. Therefore, when attaching a stormwater treatment unit to an edge barrier, the loads and moments should be carefully recalculated, and reinforcements should be updated using adequate structural analysis techniques. Figure 36 shows an example forced diagram for a prototype BMP attached to a TL-4 edge barrier and braced from a girder to resist overturning moment. The primary new force exerted is the vertical weight of the stormwater treatment unit.
According to Table 19, for a TL-4 barrier, the minimum design forces that need to be resisted are as follows:
| Ft, transverse (kip) | 54.0 |
| FL, longitudinal (kip) | 18.0 |
| Fv, vertical (kip) down | 18.0 |
The Lv (length over which the vertical force is applied) is 18 ft.
The stormwater treatment unit plus 18 ft of conveyance would increase the vertical force at the point of attachment by an additional 10 kips. In addition, the weight of conveyance elements would increase the vertical force along the conveyance span by about 0.85 kips for each 18 ft of length.
The added weight at the point of stormwater treatment system attachment (10 kips) represents an increase of about 55% compared to the vertical design load associated with TL-4 (18 kips). In comparison, TL-5 has a vertical design load of 50 kips over 40 ft. For a TL-5 edge barrier, the added weight of the stormwater treatment unit plus 40 ft of conveyance (12 kips) would represent an increase of about 24% compared to the vertical design load.
Stormwater treatment units would not typically contribute to transverse or longitudinal loading. However, depending on configurations and reinforcements, stormwater treatment units could contribute to the overturning moment on the edge barrier or fracture of the top slab.
Summary
Each part of a bridge has a design load and a certain level of resistance. By determining the required design load for normal bridge operations, adding the new load associated with the stormwater treatment unit, and comparing this to the resistance provided by the bridge components, a structural engineer can assess whether a certain proposed modification is feasible and acceptable.
For the example presented in the previous section, a typical stormwater treatment unit could add about 24 to 55 percent to the ordinary design load of a modern edge barrier, depending on the test level rating of the edge barrier. While the information and examples provided in this section focus on edge barrier attachment, similar principles of calculating an existing load and recalculating potential future load with the addition of a stormwater treatment system and its associated infrastructure can be performed for alternative attachment locations, such as mounting to beams or piers.
As discussed earlier, regardless of the selected location, each mode of failure should be assessed by a licensed structural engineer using proper methods and tools to determine the eligibility of attaching a stormwater treatment unit to any bridge component.
Guidance for Scoping Lifecycle Cost Analysis
Whole Lifecycle Cost Framework
A preliminary design alternative (per Steps 1 and 2) typically provides enough information to serve as the foundation for lifecycle cost analysis. Using lifecycle costing methods is particularly important for maintenance intensive BMPs such as high-rate media filters as the costs of capital design and construction are combined with the net present value of O&M activities to provide a single combined estimate. This can be used to evaluate the total cost of ownership compared to alternative scenarios. In some cases, higher upfront costs could reduce long-term O&M costs, resulting in a more favorable cost of ownership.
A whole lifecycle cost framework for stormwater BMPs is described in detail in NCHRP Report 792: Long-Term Performance and Life-Cycle Costs of Stormwater Best Management Practices (Taylor et al. 2014b). The main components of this framework are:
- Estimation of capital costs and initial O&M expenses.
- Estimation of routine maintenance costs and frequency, described as a series of future costs that can be variable by year, and will likely increase over time based on inflation.
- Estimate of major rehabilitation costs and frequency, described as a less frequent series of larger maintenance costs, incorporating inflation into the cost of future rehabilitation events.
- Conversion of future costs to net present value (NPV) through the use of a discount factor. A discount factor is the return a DOT could expect to earn on money that is not currently spent but has rather been allowed to grow at a rate that can be expected from savings or investments. NCHRP Report 792 recommends using the interest rate currently set by the Federal Reserve as the discount rate. Municipal bond rates could also be used as the discount rate.
Note that if inflation is higher than the discount rate, future costs will have increasing NPV further into the future. On the other hand, if the discount rate is higher than the inflation rate, future costs will have a lower NPV further into the future. On a long-term basis, the discount rate tends to be higher than the inflation rate.
NCHRP Report 792 provides additional information on the foundational basis of whole lifecycle cost estimating (Taylor et al. 2014b).
Primary Inputs for Whole Lifecycle Cost Estimating of On-Bridge Stormwater Treatment
Table 20 summarizes the primary components of a whole lifecycle cost estimate. This can serve as a checklist for project-specific cost estimating.
Anticipated Lifecycle Cost Drivers for On-Bridge Stormwater Treatment
Cost drivers will vary by project depending on bridge characteristics and preliminary design alternatives; however, several factors have the potential to be consistent drivers of elevated costs in comparison to a traditional on-land highway stormwater treatment approach.
Complexity of site characterization and design process, including the likely need to obtain detailed survey, perform a full structural reanalysis of substantial parts of the bridge to support design, and evaluate multiple alternatives. In general, stormwater retrofits tend to be much more expensive than stormwater features designed as part of new construction due to the need to work around the existing infrastructure.
Table 20. Checklist of primary inputs for whole lifecycle cost estimating.
| Phase | Primary Inputs |
|---|---|
| Capital Costs |
|
| Routine O&M Costs |
|
| Rehabilitative Maintenance Costs |
|
Extensive use of specialized materials and special specifications. Specialized elements will be unavoidable in developing a workable design within the site-specific constraints of a bridge. These elements require greater cost to design and specify and often result in higher construction bids than standard components. High costs are expected for capture and conveyance systems, structural support systems, and custom BMPs.
Design elements to support O&M activities, including elements like ladders, maintenance platforms, fall protection, and hoists to enable maintenance. This equipment is typically simpler or non-existent in on-land BMPs.
Construction complexity. Retrofit stormwater management projects tend to be more costly than new construction in any environment, primarily because of the need to engineer and construct connections to existing infrastructure. Additionally, bridge projects will require specialized equipment, potentially including major expenses such as temporary work platforms or barge rental. Traffic control and worker safety also tend to be elevated compared to traditional on-land stormwater treatment projects.
Special equipment and materials, safety requirements, and traffic control for O&M. On-bridge BMPs will nearly always require special training, special equipment, and traffic control compared to on-land BMPs.
Frequency of O&M and replacement activities. Driven by the need to reduce size and design weight, BMPs will tend to have a much smaller footprint per area treated than on-land BMPs. This increases the loading per unit of BMP footprint, requiring more frequent routine O&M and replacement activities.
Comparison of On-Bridge and Off-Bridge Construction Costs
Several recent studies have summarized the typical costs of stormwater BMPs for highway runoff. Caltrans (2021) uses budgetary estimates of $176,000 to $350,000 capital cost per acre of right of way (ROW) treated for BMPs retrofits within the ROW. This is based on BMPs to meet TMDL requirements. This estimate is lower for BMP retrofits that are out of the ROWs. Price et al. (2021) summarized actual BMP implementation costs in the Chesapeake Bay region and found that implementation costs are typically between $50,000 and $300,000 per impervious acre treated. San Mateo County (2022) estimated that street-level green infrastructure projects cost about $300,000 per acre treated, while regional projects cost about $70,000 per acre treated.
There are no known cases of on-bridge stormwater treatment where costs are available. However, from the case studies presented in the Appendix, the cost to retrofit existing bridges with on-bridge stormwater treatment is between $2.2M and $4.5M per acre of bridge treated at the low range of cost estimates and from $3.6M to $10M per acre at the high end.
If the cost of off-bridge treatment is conservatively estimated as $300,000 per acre treated, then the lower range cost of on-bridge BMPs is estimated to be well more than five times higher and often more than ten times higher than this conservative estimate for off-bridge BMPs.


