On-Bridge Stormwater Treatment Practices: A Guide (2024)
Chapter: 4 Preliminary Design of On-Bridge Stormwater Treatment Systems

CHAPTER 4
Preliminary Design of On-Bridge Stormwater Treatment Systems
Chapter at a Glance
Design of an on-bridge stormwater treatment system requires integration and balance of many design objectives based on the specific physical and operational conditions of the subject bridge. An on-bridge stormwater treatment system includes the capture and conveyance system, the treatment BMP(s) and structural support features, and associated maintenance access features. Configuring these elements into preliminary design alternatives requires ensuring compliance with rigid standards, such as those accounting for structural risks, lateral spread risk, and maintenance access, and balancing tradeoffs between other objectives, including performance, complexity, cost, traffic impacts, and O&M requirements.
This chapter is intended to support the design team in answering the following questions as part of developing preliminary design alternatives:
- Where can BMPs potentially be located? What potential locations have fatal flaws? Are there any potentially feasible locations?
- How can stormwater be conveyed to these locations? Do specific drainage criteria apply, such as sag criteria?
- What are the sizing options for BMPs, and how should the design team select a sizing approach? What are the associated weight requirements?
- How can maintenance be performed?
This chapter guides a design team through a structured process of answering these questions and developing a preliminary design or multiple design alternatives.
Preliminary Design and Decision-Making Process
Developing and evaluating preliminary design alternatives is inherently iterative and integrated. However, a defined structure can help support coordination and decision-making. This chapter is structured around a generalized roadmap for how to develop a preliminary design for an on-bridge stormwater treatment system, including key milestones and decision points illustrated in Figure 10.
Coming into this chapter, the design team should have set design objectives, characterized the existing condition of the bridge, performed initial fatal flaw screening (see Chapter 2), and developed an initial understanding of the BMP options that may be compatible with the bridge environment (see Chapter 3).
There are two main steps described in this chapter:
- Step 1 involves screening the bridge for potential locations where BMPs can be located. This is an initial decision gate for narrowing subsequent design steps and identifying the

- Step 2 involves iterative investigation of the potential BMP location opportunities defined in Step 1 to develop preliminary design alternatives, including balancing the key tradeoffs of conveyance costs and complexity, BMP size and weight, structural risks, and O&M access.
key tradeoffs that will need to be explored. This step may also identify fatal flaws that prevent further design development.
The next two steps are covered in Chapter 5, including:
- In Step 3, preliminary design alternatives are evaluated using a decision framework, key contingencies or uncertainties are identified, and additional studies are scoped as needed. This serves as another primary decision gate for determining if there are potentially feasible options.
- Step 4 involves performing the additional studies identified in Step 3 to reach a final decision about whether any alternative is feasible and, if so, which alternative is preferred. A selected alternative from this task can be advanced to detailed design development.
Step 1: Screen Potential BMP Locations
This step involves overlaying key opportunities and constraints assembled per the guidelines in Chapter 2 to identify locations that are potentially suitable for BMPs. This is similar to the initial fatal flaw screening in Chapter 2 but may incorporate additional information and analysis.
Key Site Investigation Information
The most important information to gather for this step is outlined in the following list. Chapter 2 provides guidelines on assessing these factors.
- Basic bridge characteristics:
- How long and how wide is the bridge?
- What are the transverse and longitudinal slopes?
- For longer bridges, are there distinct sections of the bridges (e.g., rising and falling sections, curved sections) that need to be screened separately?
- What is the size and shape of the piers and bents, and where are they in relation to the bridge deck and storm drains? Do piers or bents extend outside of the roadway edge, offering an accessible location to mount BMPs?
- How high is the bridge above the water or land?
- Results of preliminary structural assessment:
- Are certain parts of the bridge structurally deficient and cannot accept any additional weight?
- Are there structural components that can clearly tolerate additional loads? (potentially piers, bents, girders) This can be a qualitative assessment to be verified in subsequent steps.
- Is there a possibility the edge barrier could support the weight of a BMP?
- Existing stormwater drainage features and drainage patterns:
- How many inlet structures are present? How far apart are they?
- Where are inlets in relation to the roadway edges and substructure elements? Do inlets drain inside or outside the girders?
- Is water routed to more centralized locations via inlets or existing pipes? Or does water drain to many distributed points, such as holes in the deck or edge barrier?
- Clearance issues:
- What is the separation between bridge features and high-water elevations?
- Are there other clearance limits (e.g., navigation, other transit)
- Major factors influencing maintenance accessibility:
- Is the water body navigable? Are the underside of the deck or piers reachable by boat or land?
- Is there enough of a shoulder on the bridge to park a maintenance vehicle during service, or would temporary lane closure be required?
- Do piers or abutments extend near the edge of the bridge such that a BMP mounted on the side of the pier or abutment would be accessible from the bridge deck?
- Are there catwalks, ladders, or other access points already in place for bridge inspection purposes or similar reasons?
- Have O&M personnel provided specific information or expressed preferences as part of the information gathering to guide the identification of locations?
- Special considerations such as:
- Are there historical preservation or aesthetic limitations?
- Are there grated bridge decks (on-bridge treatment will normally be infeasible due to the inability to collect runoff)?
- Are there movable drawbridge spans?
Notably, this step does not involve the delineation of drainage areas, defining specific conveyance schemes, or the sizing of BMPs. It is intended to be a precursor to those steps.
Review of Typical Placement Options
The primary potential installation locations for on-bridge BMPs include:
- Substructure, including piers, bents, abutments, or other substructure elements.
- Superstructure, including girders, beams, trusses, or other superstructure elements.
- Inserted into the bridge deck, such as within inlets or vaults.
- Suspended from an edge barrier.
Major considerations for each option are described later in this section and summarized in Table 12. Examples of real bridges and associated placement options are provided in the Case Studies in the appendix.
BMP Placement on Substructure - Bents, Piers, or Piles
Geometric Mounting Options. BMPs can be mounted in a variety of ways and at different elevations. BMPs could be considered on the longer face of piers and pilings (perpendicular to the bridge), suspended between substructure elements, or in some cases, on the outside face of the substructure (parallel to the bridge), extending outside of the edge barriers. An example of this is presented in Figure 11.
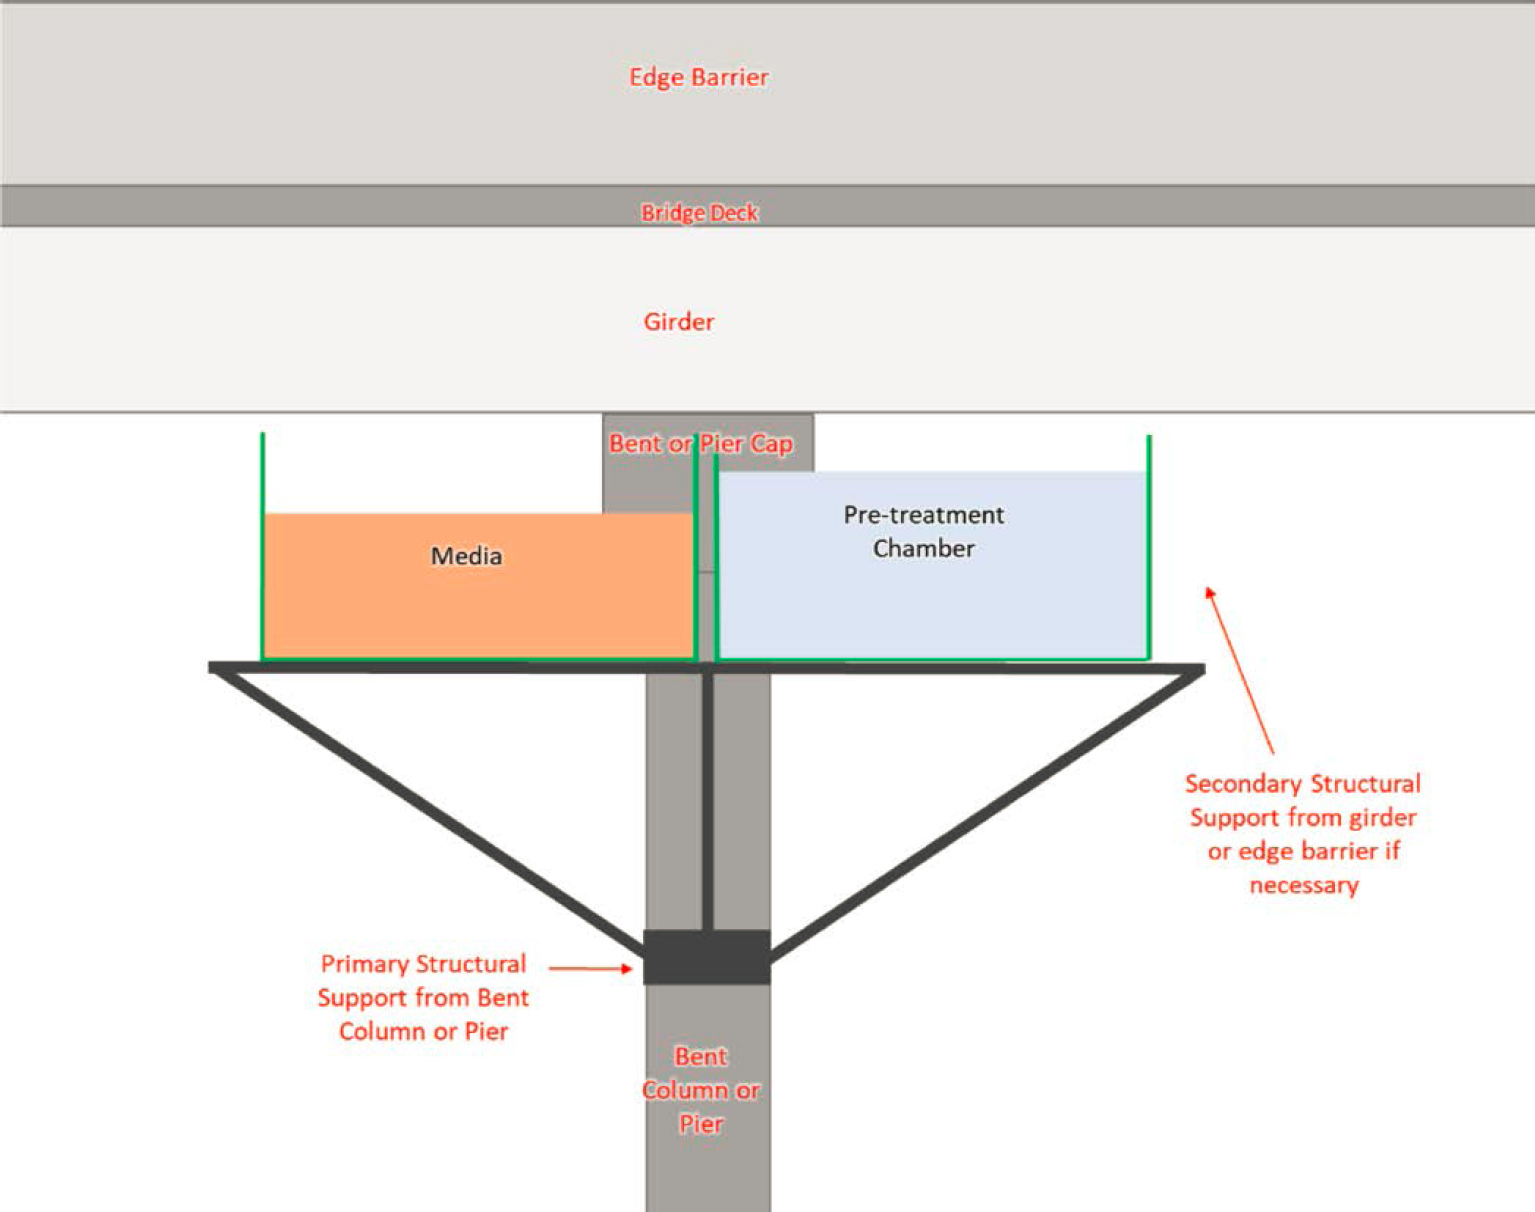
Structural Risk. Mounting the BMP to bents or piers presents the lowest structural risk, as these elements have the greatest load-bearing capacity relative to potential BMP weights. Mounting on the long (inner) face offers greater structural attachment options than mounting on the outer face.
Conveyance Feasibility. For bridges with existing piped drainage systems, vertical down drains typically follow the substructure elements for some distance toward the water. This could be advantageous as it would limit the amount of new conveyance elements. For bridges with distributed drainage, conveyance to bents is likely to be reasonably feasible in most cases. This option may require larger pipes than a more distributed BMP but may allow BMPs to be more centralized.
Clearance. High water levels will be a major factor in the elevations where BMPs can be placed. There may be only a small vertical band of the substructure that is above design high water levels but low enough to receive water conveyed to the substructure element. If constructed along a navigation lane, attachments to the substructure could possibly reduce horizontal clearance.
Maintenance Access. Access to the long-face of bents below the bridge footprint will typically be challenging or infeasible from the bridge deck. This would require specialized under-bridge maintenance equipment or a system. These locations may only be feasible where the water body is navigable and slow-moving, and maintenance can be performed by barge.
If there is an opportunity to mount the BMP to outside face of the substructure, this could better support maintenance by allowing most maintenance to be performed over the edge of the bridge.
BMP Placement on Superstructure - Girders, Beams, or Trusses
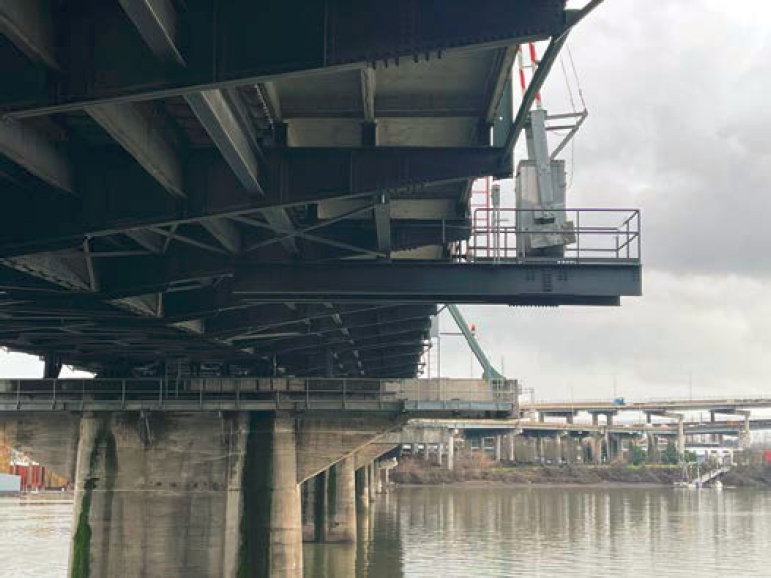
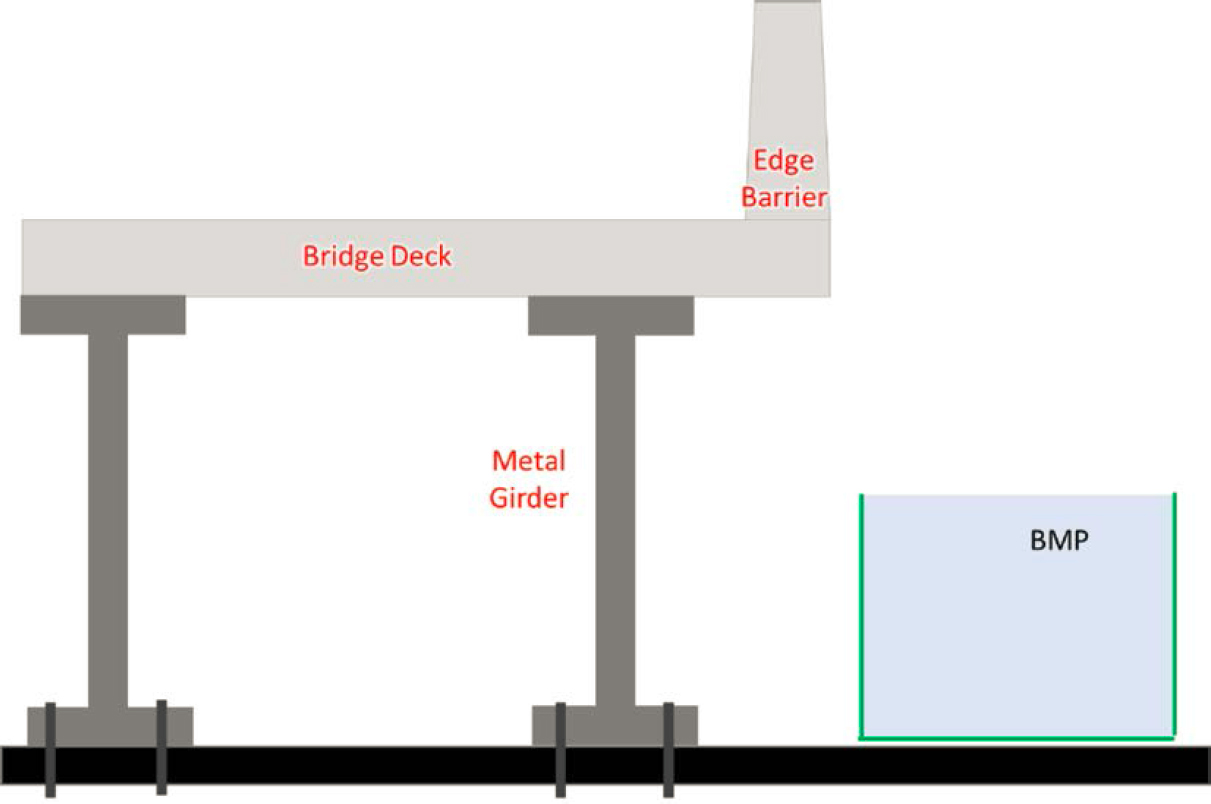
Geometric Mounting Options. The primary options are on the outer face of the outer girders or truss elements. The proximity of these elements to the outer edge of the bridge varies considerably between bridges. Mounting between girders is excluded from consideration due to a lack of reasonable maintenance access. A cantilevered platform connected to the bottom of girders and extended beyond the edge of the bridge could be considered for steel girder bridges. Figure 12 shows an example of a platform constructed by affixing new beams to the underside of a steel girder bridge and Figure 13 shows a conceptual diagram of how a BMP could be mounted in this configuration in cases with metal trusses.
Structural Risk. The structural risk depends greatly on the bridge design. Suspending between girders has the least structural risk but would be inaccessible for maintenance. A cantilevered platform connected to the bottom of the girders and extending beyond the bridge edge may be feasible for bridges with metal girders. In general, mounting to girders or beams should only be considered for bridges with metal girders or trusses. Major structural connections to concrete girders have higher risks.
Conveyance Feasibility. The main factor is the location of the deck drains relative to the girders. Where deck drains run inside of the outermost girders, it could be impractical to route pipe to an accessible BMP location outside of the girders unless the BMP is suspended well below the lower strand. This may not be permitted. If deck drains are outside of the outermost girder, then conveyance to a BMP may be feasible and should be explored further (see additional guidelines in Step 2a). Penetrations through girders are unlikely to be acceptable and are strictly avoided for concrete girders.
Clearance. If a BMP is mounted above the bottom strand of the girder, clearance should be a limited issue. High water clearance, navigation clearance, or DOT policy could prevent a BMP from extending below the bottom strand of the girder.
Maintenance Access. Maintenance access would depend on how close the outer face of the girder is to the edge of the bridge and whether a cantilevered platform can be used. In many cases, attaching to the outer face would still result in the BMP being tucked below the bridge deck, making maintenance challenging or impractical. If the BMP can be extended beyond the edge barrier, then maintenance access would be relatively favorable, enabling the use of vacuum
trucks, vertical lift trucks, and hand labor (with appropriate access features and fall restraint). Over-bridge maintenance could be limited by conflicts with superstructure elements that extend above the roadway, such as trusses or cables.
BMP Placement in Bridge Deck
Geometric Mounting Options. Casting a vault or box into the bridge deck could enable the installation of a BMP that receives direct runoff from the curb line of the bridge deck and enables access to the top of the BMP via a structural grate. Figure 14 shows an example of a single-cartridge Contech StormFilter® cartridge in a custom metal box. More information about this project can be found in “Case Study 5: Broadway Bridge, Multnomah County” in the appendix.
Structural Risk. In general, creating a new vault poses a structural risk if an adequate size for a BMP requires substantial enlargement of existing penetrations with associated impacts to the structure rebar. Design teams would need guidance from structural engineers to determine if this option can be explored, as it is very unlikely to be acceptable. Figure 15 shows an example of the rebar placement around a deck drain. This illustrates how opening a larger hole would require cutting through many rebar, weakening the bridge deck and edge barrier. This illustrates why drainage openings on bridges are generally small. However, as noted in Case Study 5 on the Burnside and Broadway bridges in the appendix, this can be done in some cases.
Conveyance Feasibility. This option could be feasible if points of drainage are already consolidated at discrete inlets that could be expanded. If drainage is through distributed down drains or distributed openings in the edge barrier, then it would typically not be acceptable to decommission these points of drainage and consolidate drainage to more centralized inlets, as this would increase lateral spread between new inlets.
Clearance. This option would typically result in no issues with clearance, as the new vault would normally be within the vertical profile of the girders.
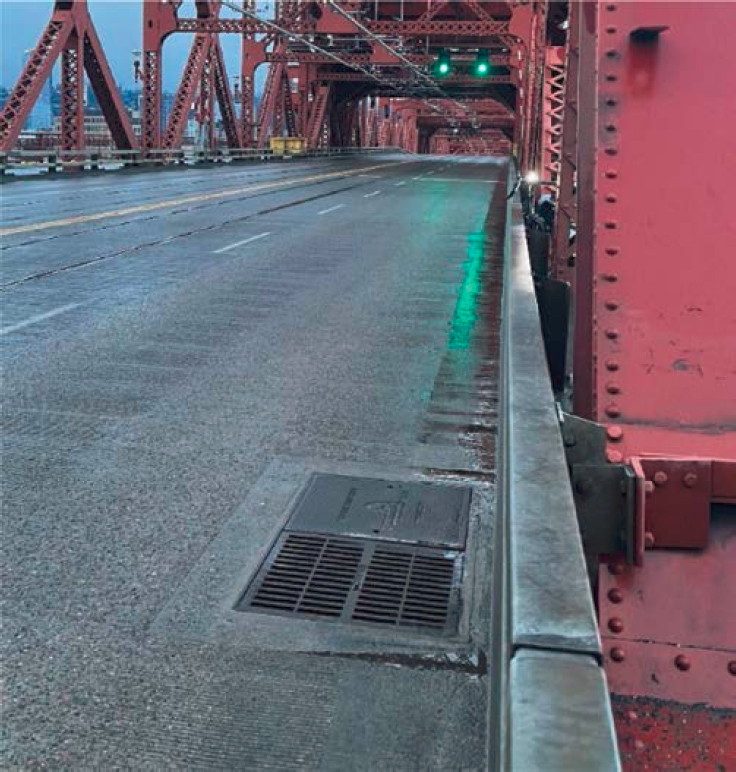
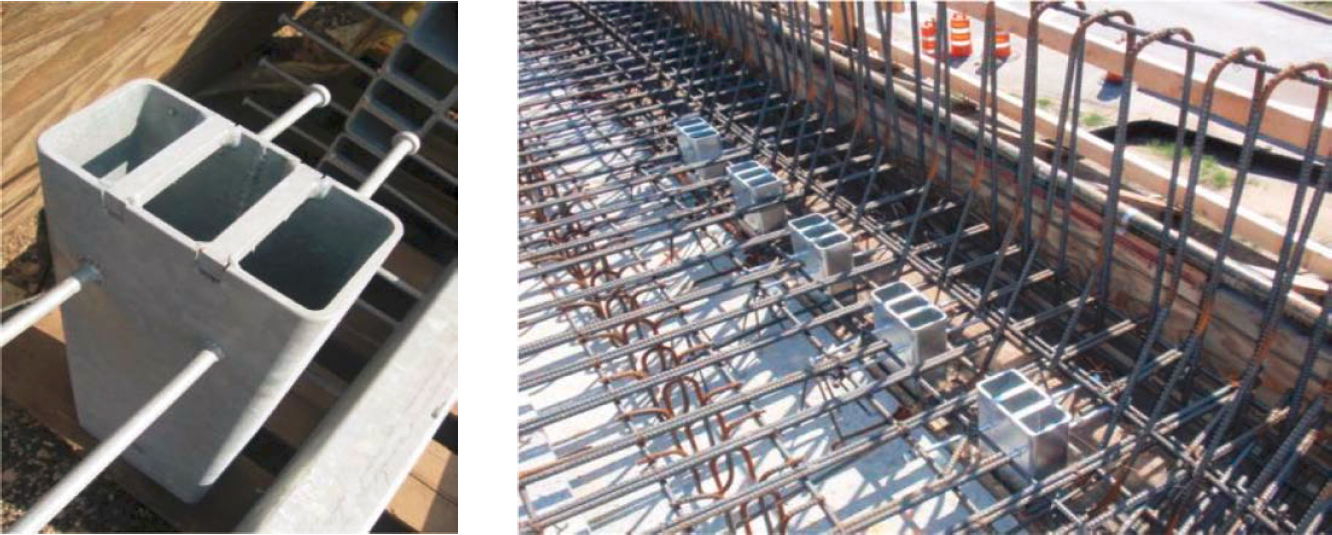
Figure 15. Example of rebar spacing and deck drains.
Maintenance Access. This option would be relatively advantageous for maintenance as all maintenance can be performed from the bridge deck. Lane closures would be likely, but maintenance would not be required over the edge of the bridge.
BMP Placement on Edge Barrier: Railing or Parapet
Geometric Mounting Options. A bridge railing or parapet is a possible location to mount a BMP, depending on the type and structural capacity. The BMP could be mounted in a cantilevered orientation outside the bridge deck to support O&M access (Figure 16 or Figure 17). In the understanding of the research team, it is very unusual to mount significant elements to an edge barrier beyond features like signage. Therefore, this configuration should be regarded as relatively novel with associated attention paid to how this impacts the level of service of the bridge.
Structural Risks. Edge barriers have a wide variety of designs and strength ratings. A site-specific analysis is needed to determine whether the added weight of the BMP would affect the crashworthiness of the barrier or the stability of the overhang. Additional guidelines are provided in Chapter 5. In general, barriers with a MASH test level of TL-4 or less would not be able to support a normal BMP load unless otherwise supported. Depending on bridge geometry, it may be possible to attach BMPs to edge barriers and also support the BMPs from frame elements attached to girders or piers. This could substantially distribute the load.
Conveyance Feasibility. The main factor is the location of the deck drains relative to the girders. Where deck drains run inside of the outermost girders, it would normally be impractical to route pipe to an accessible BMP location outside of the girders unless the BMP is suspended well below the lower strand. This may not be permitted. If deck drains are outside of the outermost girder, then conveyance to a BMP may be feasible and should be explored further (see additional guidelines in Step 2a).
Clearance. If a BMP is mounted above the bottom strand of the girder, there should be no issues with clearance. Clearance limits or DOT policy could prevent a BMP from extending below the bottom strand of the girder.


Maintenance Access. This maintenance placement option can enable reasonable maintenance access from over the bridge edge barrier, enabling the use of vacuum trucks, vertical lift trucks, and hand labor (with appropriate access features and fall restraints). This is a primary reason to consider this option despite uncertainty in structural acceptability. Over-bridge maintenance could be limited by conflicts with superstructure elements that extend above the roadway, such as trusses or cables.
Summary of Pros and Cons of Placement Options
Table 12 summarize the pros and cons of several distinct mounting options based on the summary in the “Review of Typical Placement Options” section and the findings from case studies.
Table 12. Pros and cons for potential BMP locations.
| Location | Pros | Cons | Potential Fatal Flaws |
| Substructure on Below-Bridge Face of Piers or Columns below Bridge Footprint |
|
|
|
| Substructure on Outer Face of Piers, Bents, or Caps beyond Bridge Edge |
|
|
|
| Girders, Outside Face |
|
|
|
| Location | Pros | Cons | Potential Fatal Flaws |
| Vault or Box Cast into Bridge Deck at Existing Inlets |
|
|
|
| Edge Barriers with Support from Substructure Members |
|
|
|
| Edge Barriers without Support from Substructure Members |
|
|
|
Decision Gate – Potentially Feasible Locations
Using the guidelines in this section and reviewing key bridge information, the design team should outline and prioritize the potentially feasible locations based on the factors discussed in this section. Key uncertainties and contingencies needed to confirm feasibility can be explored at this step or later in the process as part of developing preliminary design options.
From this step, one of three choices should be made:
- Identification of the top priority locations and the decision to proceed to the next phase of preliminary design.
- Identification of key questions that need to be explored and answered before proceeding to the next phase. For example, if a location satisfies all major criteria but has unknown suitability for structural risk, it may be appropriate to pause the design process while the suitability of that location can be explored.
- Determination that there are fatal flaws precluding placement at any location, in which case this should be documented, and other potential compliance pathways explored.
If the decision is made to proceed with the preliminary design, then proceed to the following step.
As summarized in the “Screening of Potential Fatal Flaws” section in Chapter 2, there are several conditions that would likely be fatal flaws if they are found to occur for a given bridge, including:
- Any case that requires BMPs to be located below the footprint of the bridge deck, including between girders or attached to the portion of piers that are below the footprint of the bridge deck. This is especially constrained if the water body is not navigable.
- Bridge deck drains are located between girders.
- Edge barriers with a TL-4 or lower crash test rating and no option for BMP support from substructure or piers.
- The bridge is classified as poor condition or is posted for load, such that additional loading would pose an unreasonable risk.
- Unreasonable and unacceptable traffic interruptions for construction, including one- or two-lane bridges without adequate shoulders to serve critical routes for emergency services.
- Grated bridge decks, which would make it nearly impossible to collect water.
In addition to the factors above, combinations of other factors could result in no feasible locations identified.
Step 2: Develop Preliminary Design Alternatives
This step is a collection of multiple sub-steps that will need to be done iteratively to arrive at a preliminary design alternative. The outcome of this step should be preliminary design alternatives described in adequate detail to support the evaluation of design objectives, including benefits, costs, and risks.
Step 2a: Determine Capture and Conveyance Approach
Once potential locations for BMP placement have been identified, designers will need to identify if and how water can be conveyed to that centralized location. This is referred to as the “capture and conveyance system” as it involves both capturing water from existing drainage points and conveying water to BMP locations. Specifically, designers will need to route water quality flows to treatment while still providing an overflow pathway for peak storm flows such that storm drainage requirements for the bridge itself are maintained.
The drainage area to BMP locations has a major downstream effect on sizing and associated structural risks (Steps 2b and 2c). Iterative feedback from sizing and structural review may result in the need to develop different options for the capture and conveyance system.
General Criteria and Guidelines
There are four primary design criteria applicable to the capture and conveyance system design:
- The added capture and conveyance features should convey at least the relevant water quality design flow (See Step 2b, Sizing).
- The overall drainage system needs to continue to convey the design flows from the bridges with no unacceptable increase in lateral spread. Additionally, the added capture and conveyance features should not increase the risk of drainage system clogging or obstruction. This may limit the ability to add new fittings and bends to an existing drainage system, which can reduce hydraulic capacity or increase clogging risk.
- The capacity of the drainage system must not depend on whether the BMP is clogged. This means that bypass or overflow must exist upstream of a BMP.
- Water discharged from a BMP should comply with DOT policies, such as whether water is allowed to freefall to a water body after being treated or needs to be collected and piped to the original discharge point.
- Capture and conveyance systems should be designed to limit sediment accumulation. This can be achieved by providing a flushing velocity of 3 feet per second at pipeful flow. This requires a minimum slope of 2% for 4″ pipe and 1.2% for 6″ pipe. For gutters, a 2% slope should be assumed and can be confirmed with more detailed calculations.
The following sections identify common drainage systems and the conceptual approaches that can be used to capture and convey water to BMPs.
Primary Types of Existing Drainage Systems
There are at least five general types of drainage systems that exist on bridges. The existing drainage system influences the applicability and design of capture and conveyance approaches. Each of these approaches appears to be relatively common among existing bridges, and additional types likely exist.
Deck drains connected to existing conveyance piping, attached to piers or bents. The prevailing materials used are metal-fitted pipe (often cast iron), aluminum, fiberglass, and high-density polyethylene (HDPE). See examples in Figure 18.
Deck drains with pipe extensions below deck without conveyance piping. This approach is common. The extensions primarily serve to help keep water away from the underside of the bridge. See examples in Figure 19.
Deck drains without extensions below deck (simple holes in the deck). This approach is commonly associated with small diameter holes and tight spacing between holes. See example in Figure 20.


Figure 19. Example of vertical drainpipe extensions below bridge deck.
Side runoff under the edge barrier at discrete points. This approach often involves relatively small penetrations through the edge barrier at relatively tight spacing. See example in Figure 21.
Continuous side runoff under an open barrier. This approach is not common but is present on some bridges. See example in Figure 22.
Conceptual Approaches for Capture and Conveyance
Through case study analysis, the research team identified five primary capture options that can be used for various drainage configurations. These are outlined later in this section with example pictures.
Option 1: Modify an existing downdrain near the BMP location with a diversion and bypass pipeline to route low flows into the BMP. See the example schematic in Figure 23.
Option 2: Connect fittings to each drainpipe below the bridge deck (multiple down drains) and design the new conveyance system with adequate capacity to convey the full peak

Figure 20. Example of vertical drain holes flush with the bottom of the bridge deck.

Figure 21. Example of penetrations through edge barrier.
stormwater flow to the BMP location, meeting both water quality and drainage criteria. Provide a wye fitting near the BMP to allow the diversion of water to the BMP and bypass of large flows.
Option 3: Connect fittings to each down drain and design the new conveyance system with adequate capacity to convey the water quality flow rate to the BMP location. Provide overflow or surcharge outlets for storm flows with at least the same capacity as the existing deck drains. This would minimize the piping sizes needed but require more fittings for overflows. See conceptual design in Figure 24.
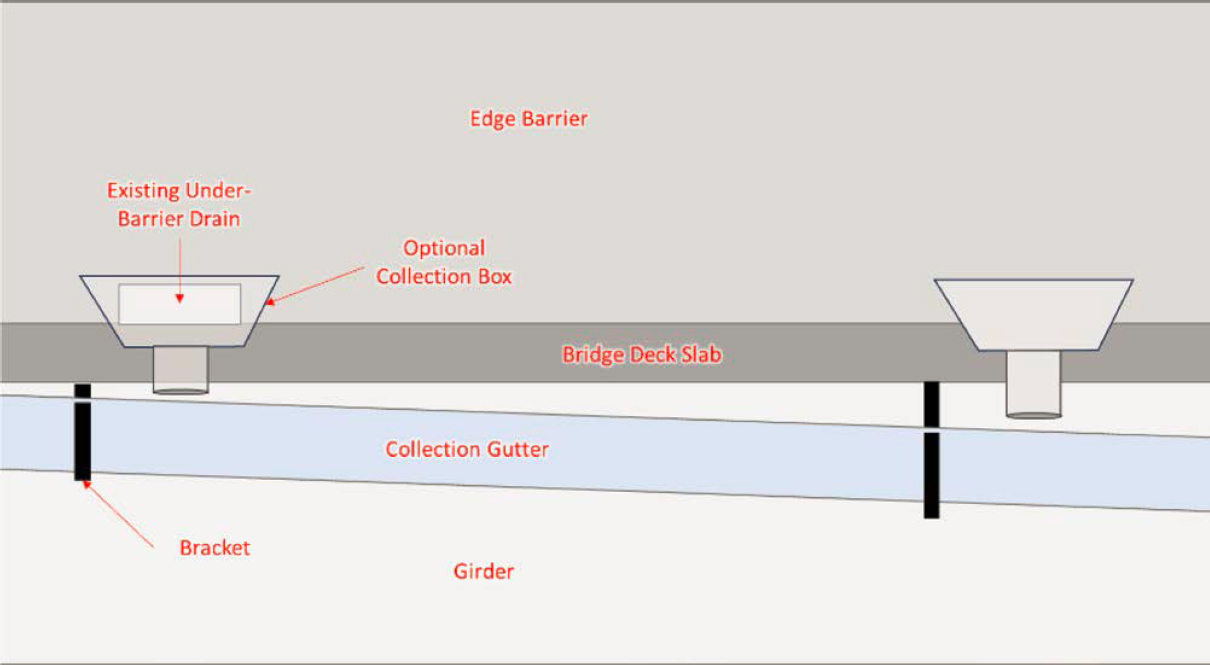
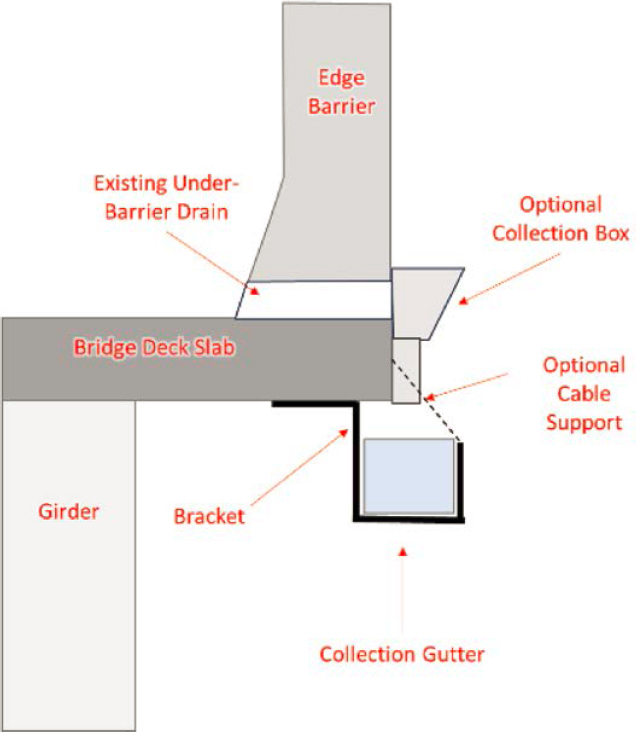
Option 4: Install an open channel gutter (aka channel drain, trench drain) feature below down drains or along the edge of the bridge with adequate capacity to convey the water quality flow to the BMP location (Figure 25 and Figure 26). This channel would overflow if its capacity is exceeded. Channels would ultimately drain directly to BMPs or connect to a piped-down drain. If a bridge is flat, then this gutter system would need to be progressively sloped at a different slope than the bridge.
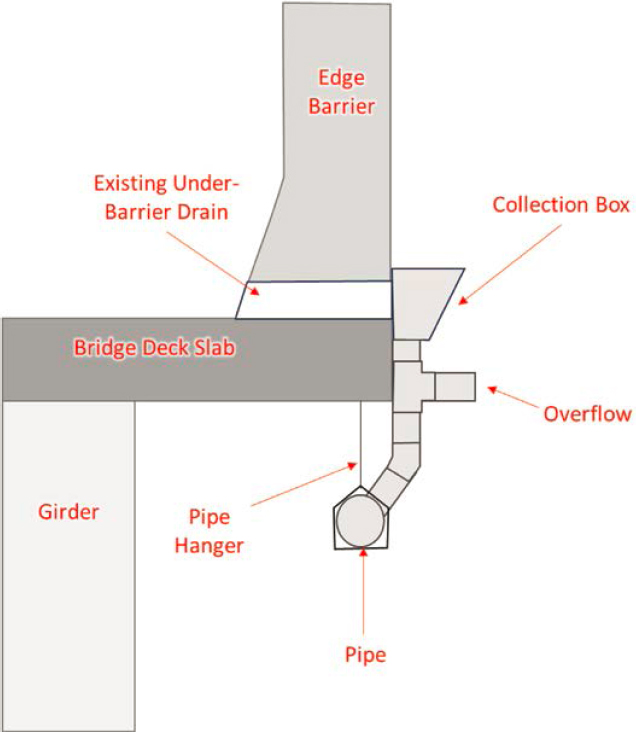
Option 5: Side collection box drains (aka scuppers) at each discharge point, connected to a closed pipe or open channel collection system (Figure 27).

Figure 22. Example of continuous edge barrier overflow without barrier or curb.
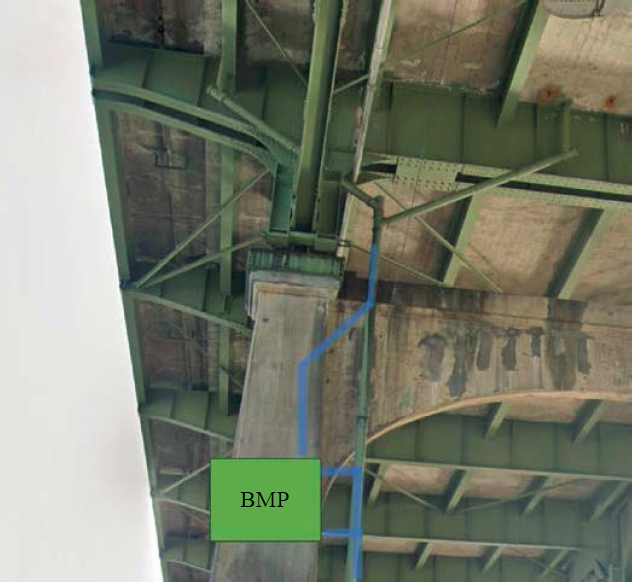
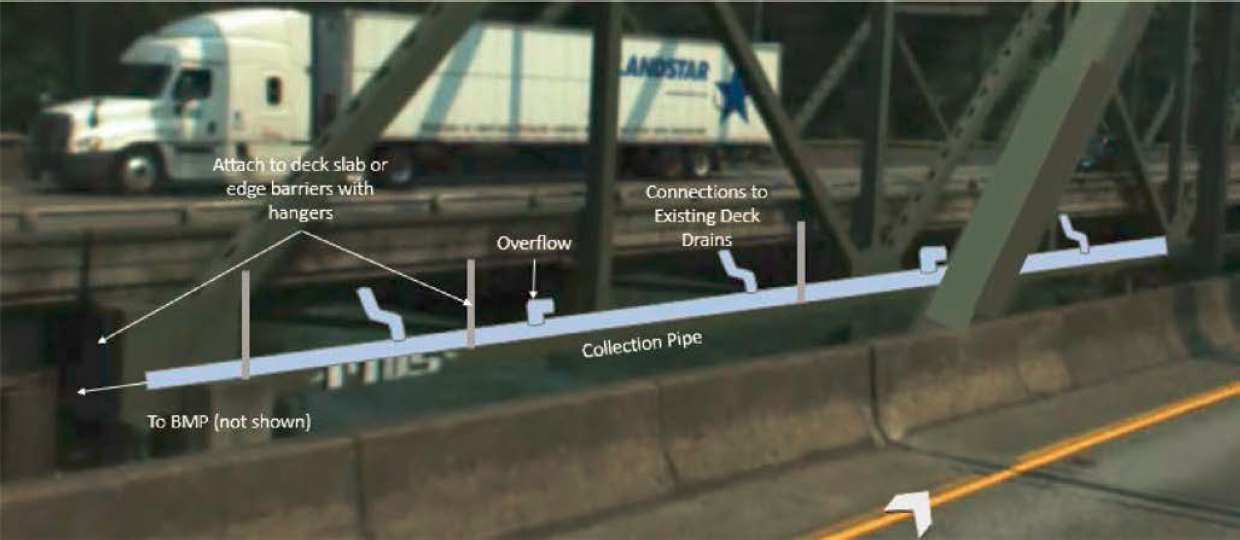
Figure 24. Conceptual closed pipe conveyance system with storm overflow.
Applicability of Capture and Conveyance System Approaches
Table 13 summarizes the applicability and relative favorability of different capture and conveyance approaches. Ratings consider design complexity, constructability, O&M risks, and other factors.
Step 2b: Select and Size BMPs
Overview of Approach
Once a capture and collection system design has been developed, the design team will be able to delineate the drainage area to each BMP location. This supports the next step of selecting and sizing BMPs. These guidelines assume that the design will be based on the prototype BMP with filtration media designed at 50 in/h. However, a similar approach can be adapted to other BMP designs and treatment flow rates.
The sizing of media filters can be controlled by either water quality treatment design standards (i.e., how much water needs to be treated) or O&M considerations (how long a filter will treat water at or above the design treatment rate before it clogs). In a given region or application, either of these factors could be the controlling factor in design. The overall method we suggest is to calculate the necessary size for both target water quality treatment and target O&M frequency and determine which controls. Figure 28 provides an overview of the sizing approach and includes a decision tree for selecting a compromise sizing approach if the initial sizing result
Table 13. Applicability and favorability of capture and conveyance approaches.
| Existing Drainage Configuration | ||||||
|---|---|---|---|---|---|---|
| Potential Capture and Conveyance Approaches | Existing piped drainage | Down drains with pipe extensions | Down drains flush with bridge bottom | Flow through edge barrier openings | Continuous discharge through edge barrier | Key Considerations |
| Diversion from existing piped conveyance | NA | NA | NA | NA |
| |
| New piped conveyance fixed to each down drain; without overflows | NA | NA | NA |
| ||
| New piped conveyance fixed to each down drain, with overflows | NA | NA | NA |
| ||
| Open channel drain below the deck or on outer face of deck | NA |
| ||||
| Side collection box drains | NA | NA | NA | NA |
| |
Key to ratings: ![]() = most favorable;
= most favorable; ![]() = moderately favorable;
= moderately favorable; ![]() = least favorable; NA = not applicable to the drainage configuration.
= least favorable; NA = not applicable to the drainage configuration.
is not feasible at the BMP locations of interest. For water quality-based sizing, if the initial sizing approach selected produces unreasonable results, a different capture criterion can be assessed. For sizing based on maintenance interval, decreasing the area draining to each BMP will decrease the size of the BMP needed to achieve a given maintenance interval. Alternatively, a shorter maintenance interval could be explored.
BMP Sizing for Water Quality Flow Rate
The typical process for stormwater treatment sizing in DOT design manuals includes two steps:
- Calculation of a design flow rate.
- Design of a stormwater treatment system to provide treatment of at least this design flow rate.

Guidance on applying these steps to the design of on-bridge stormwater treatment is provided in the sections discussing Step 2b.
Step 2b.1. Calculation of Design Flow Rate
DOT drainage design manuals commonly specify a water quality design standard that results in a design flow rate. This could be based on the peak runoff from a water quality design storm or the runoff produced by a specified intensity of rainfall. It can also be expressed as the flow rate needed to treat a certain percentage of long-term runoff volume determined using a continuous simulation model or sizing chart. Regardless of the differences in methods between DOTs, this step results in a certain flow rate that needs to be treated based on tributary area.
Alternatively, for on-bridge treatment, designers may need to consider a reduced sizing approach that balances space constraints with water quality treatment. For example, sizing for a flow rate needed to treat 80 percent of long-term runoff could reduce the required size substantially compared to other options while having relatively little impact on water quality benefits.
For the ranges of sizing considered, the removal of pollutant load is reasonably proportional to the reduction in long-term capture efficiency. Therefore, reducing from 90 percent long-term capture efficiency to 80 percent long-term capture efficiency would have about a 10 percent effect on pollutant load reduction but could greatly reduce size, as illustrated in this section.
To provide reference information to guide design, the research team applied BMP analysis tools developed as part of NCHRP Report 778 to develop alternative water quality sizing options for different levels of long-term capture (Taylor et al. 2014a). Table 14 shows the design precipitation intensity needed to capture different percentages of long-term runoff volume at locations throughout the United States. Estimates are based on an analysis of 5-minute resolution precipitation, with the assumption that the time of concentration of the drainage area is 5 minutes or less. While the method of deriving these numbers is different from DOT standard methods, this also results in a design flow rate by using the design intensity in a rational method calculation (see Equation 1) (Taylor et al. 2014a).
Table 14. Design precipitation intensity to achieve target long-term capture for various US climate regions, derived from 5-minute rainfall stations analyzed in NCHRP Report 778 (Taylor et al. 2014a).
| City (Airport Code) | Representative Climate Region | Design Precipitation Intensities for Target Capture Efficiency at 5-minute Time of Concentration, in/h | ||
|---|---|---|---|---|
| 50% capture* | 80% capture* | 90% capture* | ||
| Boston, MA (KBOS) | Northeast | 0.12 | 0.27 | 0.49 |
| Buffalo, NY (KBUF) | Northeast | 0.11 | 0.27 | 0.54 |
| New York City, NY (KLGA) | Northeast | 0.14 | 0.46 | 0.92 |
| Washington, DC (KDCA) | Northeast | 0.14 | 0.47 | 0.98 |
| Billings, MT (KBIL) | Northern Rockies and Plains | 0.09 | 0.18 | 0.43 |
| Bismarck, ND (KBIS) | Northern Rockies and Plains | 0.13 | 0.42 | 0.93 |
| Lincoln, NE (KLNK) | Northern Rockies and Plains | 0.16 | 0.60 | 1.13 |
| Missoula, MO (KMSO) | Northern Rockies and Plains | 0.08 | 0.16 | 0.22 |
| Pierre, SD (KPIR) | Northern Rockies and Plains | 0.13 | 0.43 | 0.97 |
| Boise, ID (KBOI) | Northwest | 0.09 | 0.17 | 0.28 |
| Portland, OR (KPDX) | Northwest | 0.08 | 0.16 | 0.21 |
| Seattle/Tacoma, WA (KSEA) | Northwest | 0.08 | 0.16 | 0.23 |
| The Dalles, OR (KDLS) | Northwest | 0.07 | 0.14 | 0.17 |
| Charleston, WV (KCRW) | Ohio Valley | 0.13 | 0.43 | 0.94 |
| Columbia, MO (KCOU) | Ohio Valley | 0.15 | 0.56 | 1.09 |
| Nashville, TN (KBNA) | Ohio Valley | 0.16 | 0.56 | 1.1 |
| Chicago, IL (KORD) | Ohio Valley | 0.15 | 0.59 | 1.17 |
| City (Airport Code) | Representative Climate Region | Design Precipitation Intensities for Target Capture Efficiency at 5-minute Time of Concentration, in/h | ||
|---|---|---|---|---|
| 50% capture* | 80% capture* | 90% capture* | ||
| Austin, TX (KAUS) | South | 0.23 | 0.90 | 1.56 |
| Dallas, TX (KDAL) | South | 0.20 | 0.82 | 1.47 |
| Little Rock, AK (KLIT) | South | 0.17 | 0.62 | 1.18 |
| Lubbock, TX (KLBB) | South | 0.16 | 0.59 | 1.11 |
| Atlanta, GA (KATL) | Southeast | 0.16 | 0.62 | 1.19 |
| Birmingham, AL (KBHM) | Southeast | 0.18 | 0.75 | 1.43 |
| Charleston, SC (KCHS) | Southeast | 0.23 | 0.90 | 1.58 |
| Miami, FL (KMIA) | Southeast | 0.40 | 1.28 | 2.00 |
| New Orleans, LA (KNEW) | Southeast | 0.31 | 1.03 | 1.65 |
| Denver, CO (KDEN) | Southwest | 0.13 | 0.43 | 1.11 |
| Phoenix, AZ (KPHX) | Southwest | 0.13 | 0.39 | 0.82 |
| Salt Lake City, UT (KSLC) | Southwest | 0.09 | 0.16 | 0.25 |
| Hanford, CA (KHJO) | West | 0.09 | 0.16 | 0.24 |
| Las Vegas, NV (KLAS) | West | 0.11 | 0.25 | 0.53 |
| Los Angeles, CA (KLAX) | West | 0.12 | 0.26 | 0.42 |
| Redding, CA (KRDD) | West | 0.10 | 0.19 | 0.34 |
| San Diego, CA (KCRQ) | West | 0.11 | 0.25 | 0.40 |
| San Francisco, CA (KSFO) | West | 0.10 | 0.19 | 0.29 |
*Percent capture refers to the portion of long-term runoff volume that is treated by a BMP if sized for the specified design intensity.
Figure 29 shows the locations of the weather stations with 5-minute resolution data from NCHRP Report 778 that were used in this analysis (Taylor et al. 2014a). Notably, the prior analysis did not include gages in the upper Midwest US, but it would be reasonable to bracket estimates based on the most proximate gages (Bismarck, ND, Chicago, IL, Pierre, SD, and Lincoln, NE), which offer reasonably similar sizing ranges. DOTs can also use locally available tools to perform similar analyses.
To convert the design intensity to a design flow rate, use Equation 1.
| Q = CiA | (Equation 1) |
Where:
Q = design flow rate (cfs)
C = runoff coefficient (0.9 for fully impervious areas, such as bridge decks)
i = design peak intensity (in/h), per Table 14 or DOT drainage manual
A = stormwater treatment tributary area (acres)
The drainage system conveying water to the BMPs can also be sized using this flow rate.
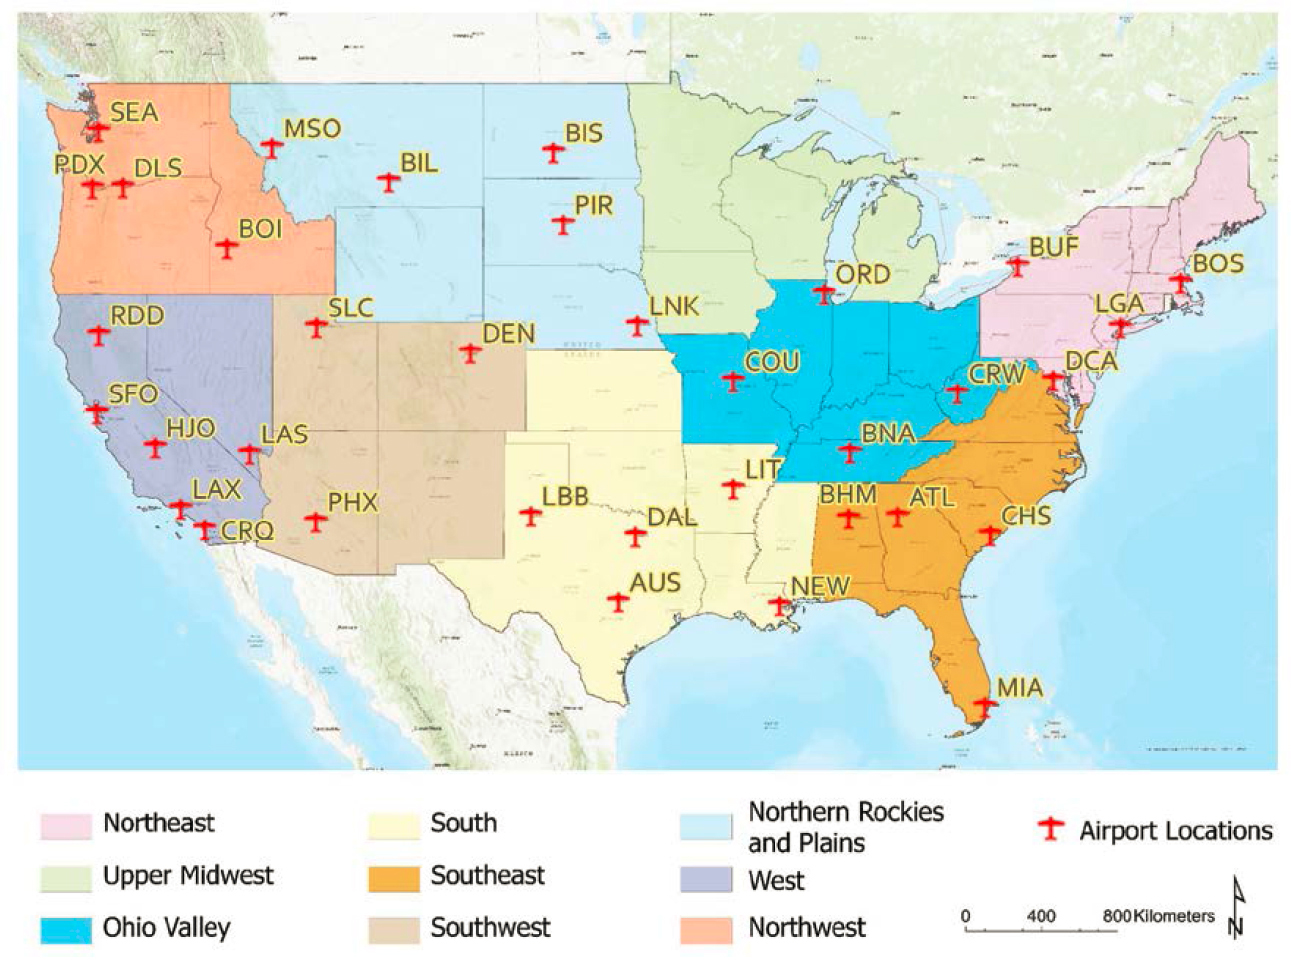
Figure 29. Weather stations from NCHRP Report 778 used for sizing guidance tables.
Step 2b.2. Size Stormwater Treatment System to Treat Design Flow Rate
The design flow rate requirement is met by providing an adequate media bed footprint. For traditional downflow media filtration bed-type BMPs, such as the prototype BMP described in Chapter 3, the required media bed surface area can be calculated using Equation 2.
| (Equation 2) |
Where:
FPWQ = media bed footprint necessary to meet water quality design flow rate, sq ft
Q = water quality design flow rate (cfs)
f = design filtration rate (in/h)
The results of this step can be used to determine the required size of individual treatment units. By converting the design intensities in Table 14 to design flow rates, it is possible to determine the media bed footprint needed to capture a certain fraction of long-term runoff in each of these locations. Using the design filtration rate proposed in Chapter 3 (50 in/h), resulting unit footprints for each location are presented in Table 15. This shows that for a given level of long-term capture, sizing will vary greatly across the country. Additionally, this shows that it requires about 50 percent smaller footprint on average to capture 80 percent of long-term runoff volume compared to 90 percent while only reducing load reduction by about 10 percent (load reduction is approximately proportional to the difference in volume capture). This illustrates that in most climate zones, there is a clear basis for targeting 80 percent long-term capture to
Table 15. Media filter footprint calculations for various US climate regions based on long-term capture goals.
| City (Airport Code) | Representative Climate Region | Media Bed Footprint (sq ft) per Acre of Bridge Drainage | ||
|---|---|---|---|---|
| 50% capture | 80% capture | 90% capture | ||
| Boston, MA (KBOS) | Northeast | 94 | 212 | 384 |
| Buffalo, NY (KBUF) | Northeast | 86 | 212 | 423 |
| New York City, NY (KLGA) | Northeast | 110 | 361 | 721 |
| Washington, DC (KDCA) | Northeast | 110 | 369 | 768 |
| Billings, MT (KBIL) | Northern Rockies and Plains | 71 | 141 | 337 |
| Bismarck, ND (KBIS) | Northern Rockies and Plains | 102 | 329 | 729 |
| Lincoln, NE (KLNK) | Northern Rockies and Plains | 125 | 470 | 886 |
| Missoula, MO (KMSO) | Northern Rockies and Plains | 63 | 125 | 172 |
| Pierre, SD (KPIR) | Northern Rockies and Plains | 102 | 337 | 761 |
| Boise, ID (KBOI) | Northwest | 71 | 133 | 220 |
| Portland, OR (KPDX) | Northwest | 63 | 125 | 165 |
| Seattle/Tacoma, WA (KSEA) | Northwest | 63 | 125 | 180 |
| The Dalles, OR (KDLS) | Northwest | 55 | 110 | 133 |
| Charleston, WV (KCRW) | Ohio Valley | 102 | 337 | 737 |
| Columbia, MO (KCOU) | Ohio Valley | 118 | 439 | 855 |
| Nashville, TN (KBNA) | Ohio Valley | 125 | 439 | 862 |
| Chicago, IL (KORD) | Ohio Valley | 118 | 463 | 917 |
| Austin, TX (KAUS) | South | 180 | 706 | 1223 |
| Dallas, TX (KDAL) | South | 157 | 643 | 1153 |
| Little Rock, AK (KLIT) | South | 133 | 486 | 925 |
| Lubbock, TX (KLBB) | South | 125 | 463 | 870 |
| Atlanta, GA (KATL) | Southeast | 125 | 486 | 933 |
| Birmingham, AL (KBHM) | Southeast | 141 | 588 | 1121 |
| Charleston, SC (KCHS) | Southeast | 180 | 706 | 1239 |
| Miami, FL (KMIA) | Southeast | 314 | 1004 | 1568 |
| New Orleans, LA (KNEW) | Southeast | 243 | 808 | 1294 |
| Denver, CO (KDEN) | Southwest | 102 | 337 | 870 |
| Phoenix, AZ (KPHX) | Southwest | 102 | 306 | 643 |
| Salt Lake City, UT (KSLC) | Southwest | 71 | 125 | 196 |
| Hanford, CA (KHJO) | West | 71 | 125 | 188 |
| Las Vegas, NV (KLAS) | West | 86 | 196 | 416 |
| Los Angeles, CA (KLAX) | West | 94 | 204 | 329 |
| Redding, CA (KRDD) | West | 78 | 149 | 267 |
| San Diego, CA (KCRQ) | West | 86 | 196 | 314 |
| San Francisco, CA (KSFO) | West | 78 | 149 | 227 |
| Average | 113 | 354 | 658 | |
optimize between performance and weight. Larger sizing could still be required for target O&M intervals, as discussed in the following section.
It should be noted that design filtration rates, both slower and faster than 50 in/h, are possible. Laboratory tests performed as part of this project suggest a lower design filtration rate may provide a greater reduction in contaminant concentrations, though this may not be true for all sites, media blends, and contaminants. Some proprietary media blends have been approved by the TAPE program at filtration rates of 100 in/h or more.
Treatment System Sizing for Target O&M Frequency
Sizing for target O&M frequency can be performed by following the steps outlined below.
Step 2b.2.i. Determine the Unit Load to Clog
This is expressed as a mass of suspended sediment per unit area of media filtration bed (lbs per sq ft of media bed area). This depends on the design filtration rate that needs to be maintained – a lower filtration rate allows a greater load of solids to accumulate before falling below this rate. Typical load to clog ranges from 2.0 to 3.0 lb/sq ft for typical vertical flow media filters. For the media blend specified in Chapter 3, laboratory study results suggest a load to clog of 2.2 lbs/sq ft when using a 50 in/h filtration rate and 3.0 lbs/sq ft for a filtration rate of 25 in/h.
Step 2b.2.ii. Determine the Target O&M Frequency
This value will be set by DOT design and O&M teams based on the O&M regime planned for the treatment systems on the bridge. A default value of once per year is suggested and is a typical target for small-footprint treatment systems, including proprietary treatment systems. However, depending on the nature of the bridge, it may be advantageous to target higher frequency (smaller systems, but more O&M events) or lower frequency (larger systems, but less frequent O&M events).
DOTs may consider a factor of safety on this value to account for uncertainty in site-specific stormwater influent, inter-annual variability in loading, and other factors. If the unit is expected to have an O&M frequency of once every two years, targeting an O&M frequency of once each year may be appropriate.
Step 2b.2.iii. Determine the Annual Suspended Sediment
Load Tributary to the System after Pre-Treatment
The annual suspended sediment load after pre-treatment can be derived from a simple mass loading calculation (Equation 3).
| (Equation 3) |
Where:
LTSS = annual average load of TSS, lbs/yr
A = tributary area to media filter, sq ft
P = average annual precipitation at the project location, inches
RCv = volumetric runoff coefficient (a default assumption of 0.9 is reasonable for bridge decks)
CTSS = representative concentration of TSS in roadway runoff, mg/L.
Step 2b.2.iv. Calculate Media Bed Footprint to Achieve Target O&M Interval
The media bed footprint needed to achieve the target O&M interval can be derived from a simple calculation (Equation 4).
| (Equation 4) |
Where:
FPMI = media bed footprint needed to achieve desired O&M interval, sq ft
TO&M = target time between O&M activities, years, from Step 2b.2.ii
LTSS = TSS load per year tributary to the media filter, lbs/yr, from Step 2b.2.iii
ULclog = Unit TSS load to induce clogging, lb/sq ft, from Step 2b.2.i
Based on annual precipitation derived from the NCHRP Report 778 tools (which can be downloaded from the National Academies Press website at https://doi.org/10.17226/22395), a target O&M interval of 1 year, and a TSS concentration (CTSS) of 70 mg/L based on the Highway Runoff Database (Granato and Cazenas 2009; Smith and Granato 2010), as summarized in NCHRP Report 778, example media footprint calculations are shown in Table 16.
Integration of Sizing Criteria with Practical Considerations to Produce Compromise Sizing
As shown in the decision tree (Figure 28), there is a need to combine and reconcile the differences in sizing needed to meet water quality treatment objectives and provide a target O&M interval.
As the first option, the design team can take the larger of the two methods and determine if this size is reasonable for the BMP location. Reasonableness can be evaluated based on the space
Table 16. Media filter footprint calculations for target one-year clogging lifespan.
| City | Representative Climate Region | Average Annual Precipitation Depth, inches | Footprint Needed for Approx. 1-year Clogging Interval; sq ft/ac Treated |
|---|---|---|---|
| Boston, MA (KBOS) | Northeast | 48 | 311 |
| Buffalo, NY (KBUF) | Northeast | 40 | 260 |
| New York City, NY (KLGA) | Northeast | 49 | 318 |
| Washington, DC (KDCA) | Northeast | 45 | 292 |
| Billings, MT (KBIL) | Northern Rockies and Plains | 14 | 91 |
| Bismarck, ND (KBIS) | Northern Rockies and Plains | 19 | 123 |
| Lincoln, NE (KLNK) | Northern Rockies and Plains | 31 | 201 |
| Missoula, MO (KMSO) | Northern Rockies and Plains | 14 | 91 |
| Pierre, SD (KPIR) | Northern Rockies and Plains | 19 | 123 |
| Boise, ID (KBOI) | Northwest | 12 | 78 |
| Portland, OR (KPDX) | Northwest | 42 | 272 |
| Seattle/Tacoma, WA (KSEA) | Northwest | 43 | 279 |
| The Dalles, OR (KDLS) | Northwest | 15 | 97 |
| Charleston, WV (KCRW) | Ohio Valley | 46 | 298 |
| Columbia, MO (KCOU) | Ohio Valley | 43 | 279 |
| Nashville, TN (KBNA) | Ohio Valley | 53 | 344 |
| Chicago, IL (KORD) | Ohio Valley | 38 | 246 |
| Austin, TX (KAUS) | South | 36 | 234 |
| Dallas, TX (KDAL) | South | 40 | 260 |
| Little Rock, AK (KLIT) | South | 52 | 337 |
| Lubbock, TX (KLBB) | South | 18 | 117 |
| Atlanta, GA (KATL) | Southeast | 52 | 337 |
| Birmingham, AL (KBHM) | Southeast | 58 | 376 |
| Charleston, SC (KCHS) | Southeast | 53 | 344 |
| Miami, FL (KMIA) | Southeast | 65 | 422 |
| New Orleans, LA (KNEW) | Southeast | 64 | 415 |
| Denver, CO (KDEN) | Southwest | 15 | 97 |
| Phoenix, AZ (KPHX) | Southwest | 8 | 52 |
| Salt Lake City, UT (KSLC) | Southwest | 16 | 104 |
| Hanford, CA (KHJO) | West | 9 | 58 |
| Las Vegas, NV (KLAS) | West | 5 | 32 |
| Los Angeles, CA (KLAX) | West | 13 | 85 |
| Redding, CA (KRDD) | West | 34 | 220 |
| San Diego, CA (KCRQ) | West | 12 | 78 |
| San Francisco, CA (KSFO) | West | 21 | 136 |
available for BMPs, input from the structural design team, or other factors. This will often need to be iterative with other parts of the preliminary design.
If the size is not reasonable, the design team should evaluate which objective is controlling the size and evaluate if that objective can be pared back to allow for a more reasonable size. For example, the water quality treatment sizing target can be reduced, or more frequent O&M can be accepted.
Results presented in the previous sections show that the controlling factor for filter sizing varies by location. For example, in Seattle, the design to provide a 1-year O&M cycle (279 sq ft/acre treated) is substantially larger than the sizing to capture 90% of long-term runoff volume (180 sq ft/acre treated). Seattle is characterized by relatively low-intensity storms but abundant rainfall. In Washington, DC, the design to provide a 1-year O&M cycle (279 sq ft/acre treated) is much smaller than the size to capture 90% of long-term runoff volume (768 sq ft/acre treated). Washington, DC, has similar annual rainfall and pollutant loading to Seattle but much more intense storm events.
In most of the locations summarized in Table 16, the required size for water quality treatment substantially exceeds sizing for O&M intervals. This suggests that a reduction in water quality treatment objectives could be considered. Continuing with the example of Washington, DC, reducing treatment goals from 90 to 80 percent of long-term runoff volume in the city would reduce the sizing factor from 784 to 369 sq ft/acre treated (>50% reduction) while only reducing long-term pollutant load reduction by about 10%. The sizing factor of 376 sq ft/acre treated would provide 1-year O&M cycles with a factor of safety of about 1.5×. This may be a reasonable compromise option to balance size, weight, treatment performance, and O&M frequency.
Applicability of Sizing Process to Proprietary BMPs
The overall sizing framework described earlier in Step 2b can also be applied to proprietary BMPs or proprietary media.
To meet water quality treatment sizing objectives, the designer would calculate the flow rate as described in this section and consult manufacturer product information to determine the provided treatment flow rate for different types and sizes of BMPs. If simply substituting a proprietary media, then the designer could increase the design media flow rate in the calculations to match TAPE-approved rates, resulting in a smaller size to meet stormwater treatment sizing objectives. A rate of 100 in/h ensures that several products can meet this specification. This would reduce footprint by approximately half compared to the sizes in Table 15.
To meet objectives for maintenance interval, the designer can use the same assumptions about loading to clog as specified in this section (Table 16) or consult with the product manufacturer for reasonable assumptions that can be used.
Step 2c: Preliminary Structural Review
With Steps 1, 2a, and 2b complete, the design team should have identified BMP locations, developed a schematic design for stormwater conveyance, and determined the sizing of BMPs to balance treatment and O&M goals with space and weight constraints. This provides key inputs for a structural review.
This step should engage the structural design team to review and assess the potential feasibility of the preliminary concepts. This Guide does not prescribe structural analysis methods, however an overview of a proposed structural analysis framework and guidelines for scoping an analysis
is provided in Chapter 5. Structural design teams should develop a project-specific framework based on local guidance and criteria.
The outcomes of this step should be:
- Quantification of design weights of the BMP, structural support and O&M access system, and capture conveyance system (see guidelines for weight calculation in Chapter 3), including sediment accumulation at the end of the maintenance cycles and O&M personnel weight.
- Calculations to determine potential feasibility based on the available structural capacity of the bridge elements of interest. This does not necessarily need to consider the details of the structural support system.
- Determination of next steps based on the results of the preceding steps.
- If it appears that the added weight can be supported by the relevant parts of the bridge structure, then the preliminary design can proceed. The details of the attachment and support system can be detailed later, and final structural analyses can be scoped.
- If the weight is clearly infeasible for the relevant parts of the bridge, then this feedback will either be the basis to determine infeasibility or be used as iterative feedback to develop different alternatives, such as different BMP locations or smaller sizing.
- If it is unclear whether the bridge elements have capacity, additional structural analysis may be needed to reach this determination before further developing preliminary designs.
Step 2d: Develop Conceptual O&M Approach
Overview
At this point in the design process, there should have been multiple prior check-points where O&M was considered and O&M teams were consulted, including during the development of project objectives and characterization of site conditions (Chapter 2), review of BMP options and O&M needs (Chapter 3), and screening of potential BMP locations (Chapter 4, Step 1). Therefore, key O&M issues and preferences should be reflected in the choice of locations, conveyance design, and BMP types, and a tentative O&M approach should be partly formed.
This step involves defining specific O&M approaches that will be used for each alternative, including again engaging O&M team members to help define the necessary O&M activities of each system element. The O&M approach should consider what needs to be done, when it needs to be done, by whom, and how it should be done (i.e., protocols, equipment). Chapter 3 describes O&M needs, frequencies, and equipment needs for the prototype BMP, which should be consulted in performing this step.
Maintenance Paradigms
Maintenance intervals for on-bridge treatment will be relatively frequent due to small media bed footprints and insufficient room for extensive pre-treatment. Typical routine maintenance intervals are anticipated to be approximately annual, though it is possible to design for less or more frequent maintenance intervals. This involves inspection, removal of captured material from pre-treatment systems, and raking the surface of the media bed. More intensive maintenance is anticipated to be needed every three to five years, which involves substantial media replacement and potentially the rehabilitation of system components.
Because of the need for routine O&M and relatively frequent intensive O&M, specific O&M approaches need to be considered as part of the design phase to support the feasibility and efficiency of O&M. One strategy to simplify on-bridge O&M is to make the BMP itself modular, where the DOT has duplicates of each distinct BMP module and can wholly remove and replace
the BMP module with a new one when more intensive media replacement and rehabilitation work is needed. This rehabilitation work would be performed in an off-bridge location. This design could also allow simpler routine maintenance activities such as vacuum truck cleanout and media raking to be performed in place without requiring the module to be removed. Alternatively, designers could make the BMP outer structure permanent but design for specific parts of the BMP to be accessible to suitable maintenance equipment, allowing the media to be removed and replaced in situ. This may simplify the design compared to having removable parts, but it requires all work to be performed on-bridge.
Deciding between these paradigms will require integrating project-specific information, including the traffic impacts caused by maintenance, the ability to place BMPs where on-bridge O&M can be safely performed, the size and weight of BMPs, coordination with other O&M activities, and other factors.
In general, the research team suggests a hybrid approach in which routine maintenance can be performed without removing the BMP, but it is feasible to remove BMP modules at the time when media needs to be fully replaced if off-bridge rehabilitation is preferred. The prototype BMP described in Chapter 3 supports both approaches.
Primary O&M Considerations
Considering the required O&M steps listed above, the primary O&M factors that need to be evaluated prior to moving forward with BMP designs are:
- Triggers for routine and rehabilitative maintenance.
- Methods of accessing BMPs for inspection, routine maintenance, and rehabilitation.
- Personnel safety and training.
- Availability and capabilities of specialized equipment.
- Cold climate O&M needs.
Each of these are discussed in further detail in the remainder of this section.
Triggers for Maintenance Activities
Routine maintenance should be performed at a frequency necessary to avoid excessive material accumulation in the pre-treatment system or premature clogging of the media bed. Maintenance activities can be performed at scheduled intervals or as triggered by inspection findings. However, separate inspection visits may be impractical due to the challenges of accessing BMPs. The most practical approach is likely to schedule routine maintenance at a defined interval coinciding with inspection and/or other bridge maintenance activities. The findings from inspections (e.g., degree of material accumulation in pre-treatment, level of media bed sediment accumulation) can be used to determine if routine maintenance frequency should be modified. In general, material accumulation should be limited to about 25 percent of the pre-treatment system capacity. Media permeability should not fall significantly below the design media filtration rate prior to maintenance. Visual observations of surface sediment accumulation cannot be directly translated to media permeability. To help address this limitation, a simple permeameter test could be used to assess permeability for a subset of systems on a temporary basis to help develop linkages between visual observations and permeability.
Rehabilitative maintenance primarily includes the replacement of media and the replacement of worn parts. Media replacement can involve handling thousands of pounds of loose media, disposal of old media, and procurement of new media. Researchers have found that similar media mixes will tend to experience clogging that requires substantial media replacement prior to exhausting media treatment processes (Pitt and Clark 2010; Pitt and Colyar 2020). There
is not a practical way to test the remaining treatment capacity of media. Therefore, the most practical approach for triggering rehabilitative maintenance is by measuring permeability. A permeability measurement obtained after scraping mulch provides an indication of whether the underlying media has become clogged to the point that surface rehabilitation will no longer restore performance. At that point, rehabilitative maintenance should be triggered.
Methods of Accessing BMPs for Inspection, Routine Maintenance, and Rehabilitation
Accessibility of on-bridge BMPs influences the cost, level of effort, and equipment required for routine BMP inspection and maintenance. Acknowledging that DOT maintenance budgets are limited, it is understood that access should be designed for maximum efficiency to minimize the time needed for staff to conduct the tasks. Similarly, access should minimize the need to purchase specialized equipment and/or the duration of time such equipment needs to be rented.
In considering access, the design team should consider the design features needed for safe access (e.g., ladders, platforms, railings, fall protection restraints), as well as available equipment.
Additionally, permanently installed design features such as pulley lift systems or power winches (with permanent power or temporary power supplied from maintenance equipment) could be considered to support more streamlined maintenance activities and reduce manual labor.
Personnel Safety and Training
As with any work on a bridge, personnel, and traffic safety must be preserved while conducting BMP inspection and maintenance tasks. At a minimum, all O&M activities need to comply with Occupational Safety and Health Administration (OSHA) and state regulations. There are some unique characteristics of on-bridge locations that would require appropriate planning, training, and equipment to provide safe maintenance access. Primary safety considerations include traffic control, fall protection, materials handling, and training. A site-specific job risk assessment should be conducted for any on-bridge BMP to fully develop a safety program.
Traffic control, including lane closures on bridges, is a routine DOT procedure and does not present a unique challenge. Fall hazards associated with accessing BMP locations pose the highest risk. A fall protection program is necessary for any O&M operations taking place under the bridge deck. Specific considerations are needed for the use of a lift truck and catwalk. Fall hazards can be minimized for operations using a vacuum truck or hoist to conduct maintenance from the bridge deck, as would be the case with a cantilevered BMP attached to the edge barrier.
O&M tasks will include lifting materials, such as removal and replacement of the filtration media in the BMP, as well as raking and/or scraping of the media surface. While other inspection and maintenance programs (e.g., painting and applying anti-corrosion sealers) require the movement of materials, there is no clear analog to the removal and replacement of filtration media in current bridge maintenance programs. Site-specific needs should be evaluated to determine if personnel can safely lift the materials manually or if equipment is needed since the BMP design may affect these options. Once the material is removed from the BMP, it must safely be transported for disposal. Carrying bags of media on a ladder would pose unique safety issues and challenges, so it is not recommended.
Availability and Capabilities of Specialized Equipment
In considering potential BMP locations, designers should review the specialized equipment that is owned by the DOT or is available to rent. In many cases, there may be suitable equipment that is used for structural or coating inspections (see the following examples). Designers should determine the capabilities of the specialized equipment relative to its reach and weight limits
and assess the potential BMP locations based on these parameters. Designers should also assess crew capabilities to safely operate the equipment.
Under-Bridge Boom or Bucket Truck.Figure 30 shows an example of boom or bucket truck designed for under-bridge inspection and maintenance. The arm length, reach, and weight limits will vary by model. Media removed from the BMP may need to be lifted onto the lift truck platform manually, but the disposal will be made simpler with the aid of the equipment to raise it back to the bridge deck surface. Replacing the BMP media can be conducted using these steps in reverse order. These lifts are typically designed with protective guardrail systems on the working platform. Additional fall protection is also warranted, such as a harness or other personal fall arrest system. Personnel must be trained and competent in the safe operation of the selected equipment.
Under-Bridge Platform Trucks.Figure 31 shows examples of mobile truck-mounted platform systems that are designed for under-bridge inspection and maintenance. These are similar to an under-bridge inspection boom truck but provide a temporary catwalk and ladder system. The dimensions and weight limits will vary by model.
Permanent Catwalk System.Figure 32 shows an example of a catwalk system. This type of system typically includes an integral guardrail system as the primary fall protection. If O&M tasks require reaching outside the guardrail, personal fall arrest equipment may also be needed. The catwalk should be designed and constructed to carry the load of personnel anticipated for the tasks as well as the working weight of the BMP maintenance materials, including saturated, spent media. A further consideration is the ongoing inspection and maintenance of the catwalk itself to ensure its structural integrity and provide a safe working environment. This example shows access from a watercraft. A plan for safe personnel movement from the watercraft to the catwalk would be needed.
Vacuum Truck and/or Hoist. A vacuum truck and/or hoist could be operated from the bridge roadway, presenting the lowest safety risk. The vacuum or hoist could be used to remove the spent media from the BMP and the hoist could be used to install replacement media. A hoist

Figure 30. Example of an under-bridge inspection boom truck.
might also be able to reach a catwalk to deliver and recover media. Still, appropriate planning and precautions should be taken to minimize hazards. Any activities involving reaching over the bridge’s edge barrier will require fall protection.
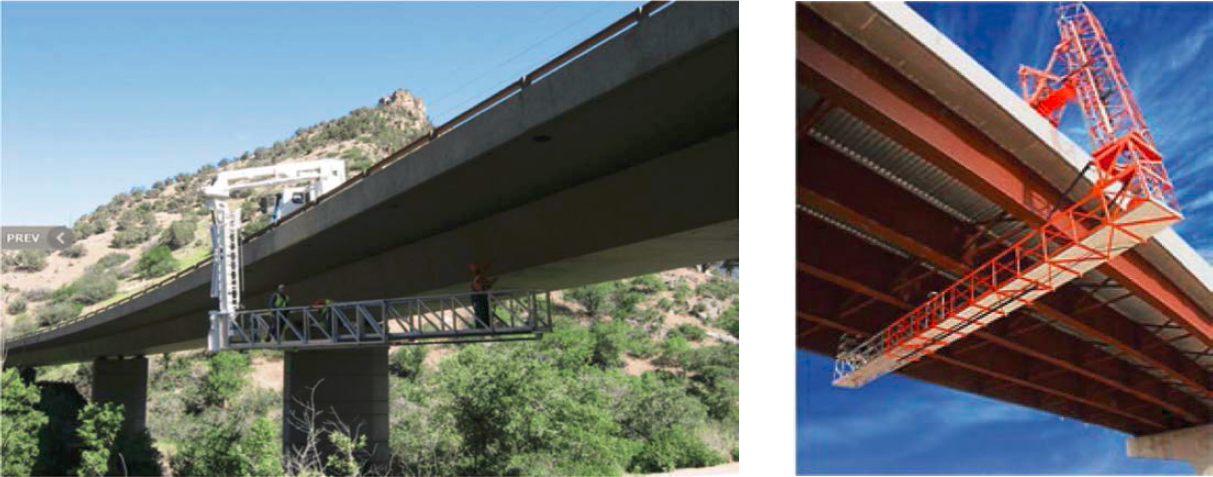
Figure 31. Examples of under-bridge inspection platform trucks with catwalks.
Cold Climate Considerations and O&M Needs
Winter conditions in colder climates are another factor that particularly affects O&M for an on-bridge BMP. Freezing temperatures should be accounted for in the BMP design. Additionally, existing cold weather and post-winter O&M approaches for the bridge should be considered, including traction grit and pipe flushing.
Water retained in an on-bridge BMP will freeze more readily than in typical BMPs installed in the ground since the earth acts as insulation and warming in some cases. Design accommodations should be made for an on-bridge BMP to allow for the expansion of water turning to ice
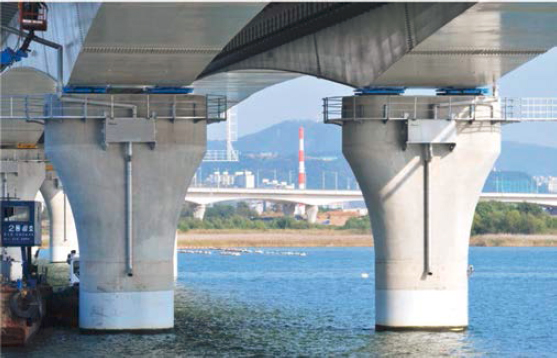
Figure 32. Example of a catwalk system for BMP access.
within the BMP structure, as well as blockages that could occur in the outlet. Weep holes to drain ponded water from pre-treatment chambers may be warranted in these cases.
Various other cold weather factors are present on bridges independent of BMPs, including snow accumulations around the deck drains, inadequate drainage during melt periods, and snowplow operations. As long as BMPs do not interfere with drainage, these issues are unlikely to be exacerbated by BMPs.
Deicing and anti-icing applications may also play an important role in BMP function and maintenance. Traction control products, such as sand and grit, may cause media to clog more quickly. In these cases, a pre-treatment chamber is essential to prolong maintenance intervals. Furthermore, deicing salts may result in water quality issues and premature failure of media due to exhaustion of adsorption sites on the media. This is because salts are ionic compounds that dissociate into anions and cations in water. The media’s purpose is to sorb and hold on to pollutants, many of which are also cations (e.g., zinc, copper). However, media will also bind the cations that come from salt (typically sodium, potassium, magnesium, and calcium), therefore reducing the capacity of the media to bind target cations and potentially causing pollutants to leach from the media. As such, reducing the amount of salt applied to the bridge deck by using anti-icing practices, as well as considering alternative deicers that are not salt-based, is suggested. Designers should also consider incorporating a bypass whereby drainage that occurs during times of salt and/or grit application is not conveyed to the media.
Outcomes of Step 2d
In summary, this step should involve interaction between the design and O&M teams to detail the O&M approach more explicitly, including:
- Specific activities, including what these will include, when they will be performed, how they will be triggered, who will be responsible for performing them, and the specific resources and equipment needed to perform the maintenance.
- Preferred O&M paradigm, including what activities will be performed on-bridge and what will be performed off-bridge.
- Estimates of O&M labor and equipment costs.
- Identification of key uncertainties that can influence the viability and cost of performing necessary O&M. These uncertainties may warrant more specific study prior to selecting a preferred design alternative and advancing designs.
- Formal documentation of O&M frequency, requirements, and procedures, such as a site-specific O&M manual.
Step 2e: Integrate Preliminary Design Decisions and Document Preliminary Design Alternatives
This step involves the preparation of the preliminary design alternatives to undergo the structured decision-making process in Step 3. The results of the preliminary design steps above should be integrated to describe the primary elements of the preliminary design alternatives. In a typical DOT process, this would be documented in a preliminary design report (or equivalent). The description of design elements and the O&M approach should be presented in adequate detail to enable evaluation of these alternatives as part of Step 3 (Chapter 5). Additionally, it is suggested that the design team document the major sources of uncertainty or contingencies that remain. Key questions in assessing the adequacy of preliminary design documents include:
- Are the preliminary designs detailed enough to ensure that systems can be reasonably constructed?
- Do preliminary designs identify and enable quantification of major cost components and support a preliminary estimate of cost?
- Does the O&M approach describe activities, frequency, and tentative procedures and equipment needs? Do preliminary design documents include features and design adaptations that support the selected O&M approach?
- Are risks and uncertainties clearly described, including their potential impact on the design, O&M, and costs?
- If there are no feasible design alternatives available, is this finding supported by specific information and analysis?


