On-Bridge Stormwater Treatment Practices: A Guide (2024)
Chapter: Appendix: On-Bridge Stormwater Treatment Case Studies

APPENDIX
On-Bridge Stormwater Treatment Case Studies
Appendix at a Glance
This appendix contains five case studies of on-bridge BMP design concepts, three illustrating hypothetical conceptual design processes for real bridges, one showing an actual proposed design for a bridge, and one showing a completed on-bridge stormwater treatment retrofit.
For hypothetical conceptual design studies, the research team worked with the Project Panel to select bridges that cover a range of common conditions and would be meaningful to study. Selection criteria included:
- Bridges had a design type that was not highly unique.
- Bridges were intentionally selected to include those where on-bridge stormwater treatment might be a necessary technical solution if there was a regulatory requirement to do so. For example, these bridges currently drain directly to the water body and do not have flat land areas below the bridge that would support a land-based BMP.
- Bridges were selected that did not have obvious fatal flaws based on initial characterization of existing conditions, such as those described in Chapter 2. This intentionally biases the analysis but supports more meaningful case studies.
- Bridges had a range of traffic volumes, lengths, and water body sizes.
The three hypothetical case studies included:
- Case Study 1: Monitor Merrimac Memorial Bridge-Tunnel, Virginia. This is a long viaduct-type concrete bridge across the Hampton Roads Harbor that presents no opportunity to route water to land.
- Case Study 2: Nisqually River Bridge, I-5, Washington State. This is an at-grade metal truss bridge over the Nisqually River, which is a relatively small river that supports salmonid runs.
- Case Study 3: Cannon Road Bridge, Georgia. This is a two-lane at-grade concrete bridge over a relatively small creek with relatively limited separation from flood event high water.
The two real project examples were selected based on examples with sufficient available data. The research team is aware of very few examples of on-bridge stormwater treatment. These bridges include:
- Case Study 4: Molise Viaduct, Molise, Italy. This is a long viaduct-type bridge over a water supply reservoir that is key to the region. It is proposed to be retrofitted with spill containment and stormwater treatment in 2025 or 2026 as part of major rehabilitation work.
- Case Study 5: Broadway Bridge, Portland, Oregon. This bridge was retrofitted with stormwater treatment BMPs as part of a larger rehabilitation project in the early 2000s.
Each of these studies is intended to offer different insights and examples regarding the conceptual design process for on-bridge stormwater BMPs. These are not intended to be a cross-section of all bridges, as many bridges would be infeasible to advance beyond initial screening.
Case Study 1: Monitor Merrimac Memorial Bridge-Tunnel, Virginia (Hypothetical)
Case Study Relevance
This case study addresses considerations that are present in many bridges, including:
- Capture of water from many distributed discharge locations.
- Evaluation of clearance from high water levels at coastal locations.
- Tradeoffs between sizing method, weight, consolidation of BMP locations, and the number of units to be installed.
- Evaluation of options for construction and O&M access over a large water body.
- Estimated costs for construction and O&M.
While each bridge has distinct characteristics, this example is relatively representative of long, viaduct-type bridges over coastal water bodies or lakes.
Bridge Setting
The Monitor Merrimac Memorial Bridge-Tunnel (MMMBT) is a combined twin-trestle bridge and underwater tunnel that carries Interstate Highway 664 (I-664) over the Hampton Roads Harbor (HRH) within Chesapeake Bay in southeast Virginia (Figure 37). The bridge portion of the MMMBT (South Trestles) consists of two long, narrow, low-lying parallel trestle bridges that cross over approximately two-thirds of the width of the HRH before the highway transitions to an underwater tunnel. The bridge is owned, operated, and maintained by the Virginia Department of Transportation. It was built in the late 1980s.
The MMMBT is approximately 4.6 miles long and consists of a system of trestle bridges, artificial islands, and tunnels. The bridge portion of the MMMBT (i.e., the South Trestles) is approximately 3.15 miles long and extends from the southern side of the harbor to an artificial island, with the tunnel spanning the remaining distance to the north (Figure 38). The tunnel allows shipping, therefore there is no drawbridge or elevated section of the bridge. This aspect of the design is somewhat uncommon. However, the remainder of the bridge is similar to other low-lying bridges that cross bays and rivers.
The region is subject to subsidence, hurricanes, sea-level rise, and increased precipitation amounts and rainfall intensities caused by climate change, which pose a significant risk to the structural integrity of existing infrastructure and the development of new infrastructure in the HRH and the surrounding region. The development of on-bridge BMPs on coastal bridges must consider these factors to produce robust and sound designs.
Characterization of Key Features and Constraints
Roadway Geometry
Each of the South Trestles is approximately 44 ft wide, with two 12-foot-wide lanes of travel, a 10-foot-wide emergency shoulder on the outer side of each bridge, a 6-foot-wide shoulder on the inner side, and a 20-inch-wide concrete parapet edge barrier on each side of the bridge deck. The differing sizes of the shoulder/emergency lanes on the sides of the bridges should be considered in the selection/placement of BMP sites, as there could be differing implications for lane closures depending on which side of the bridge BMPs are placed.
The bridge is comprised of six distinctive sections:
- Section 1 spans approximately 5,900 ft and extends as a straight, flat expanse from the south abutment of the bridge to the base of the southern inclined approach leading to the raised portion of the bridge (Figure 39).
- Following this, Sections 2 and 3 represent the approach and descent of the inclined elevated section, both measuring approximately 1,400 ft with a 2 percent longitudinal gradient. This is similar to Figure 39, but with a small longitudinal slope.
- Section 4 covers an approximately 5,400-foot-long flat, straight trajectory from the base of the elevated section to a curve. This is nearly identical to Section 1, shown in Figure 39.
- Section 5 is a 2,400-foot-long curved superelevated segment (Figure 40), notable for drains exclusively on the lower side of the bridge deck.
- Section 6 is a short segment of bridge deck within 300 ft of an artificial island, marking the end and northern terminus of the South Trestle.
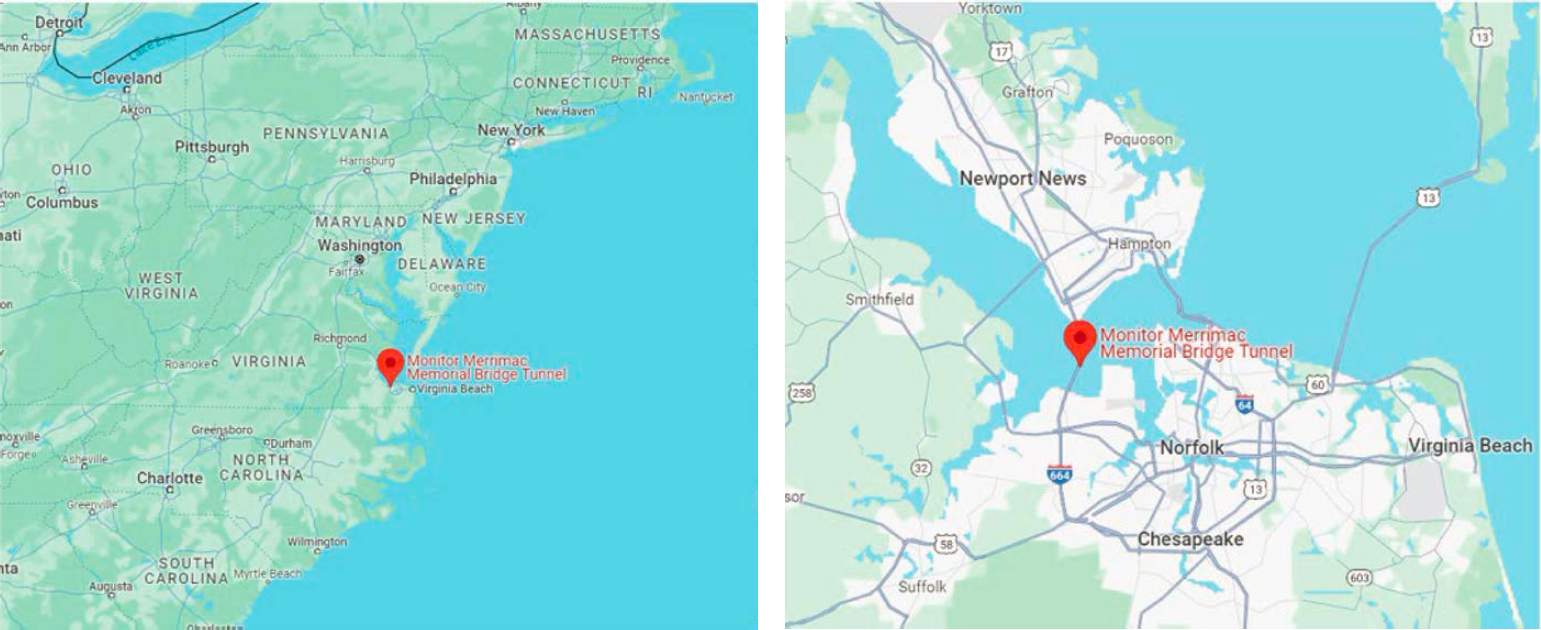
Figure 37. Monitor Merrimac Memorial (I-664) Bridge location and vicinity maps.
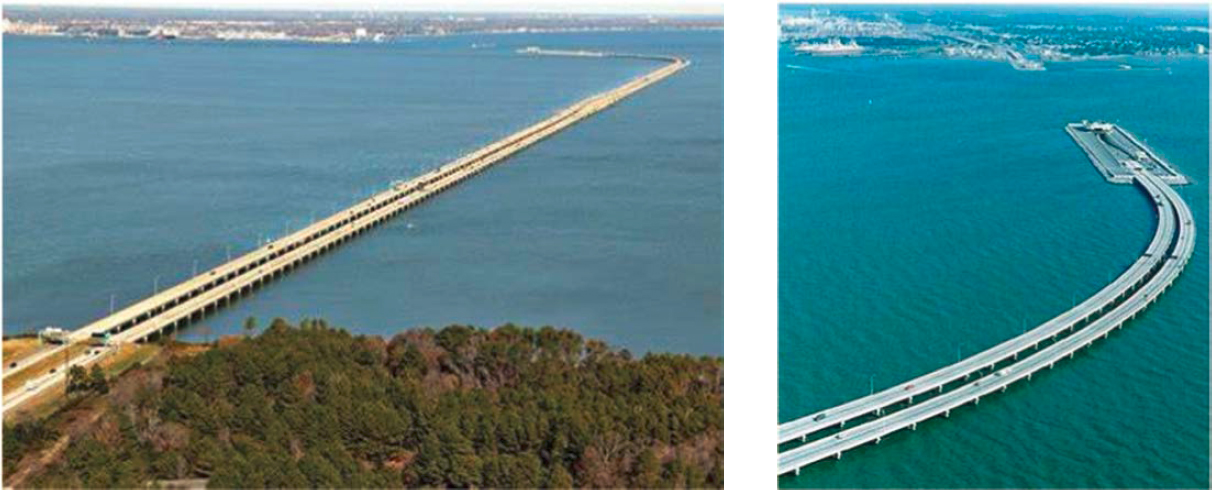
Figure 38. Aerial view of the MMMBT (I-664 Bridge) over Hampton Roads Harbor.
For bridge Sections 1 through 4 the two bridges are separated by approximately 40 ft, however, between Section 5 and 6 the distance between bridges narrows to about 5 ft.
Structural Configuration
The bridge is divided into over 200 spans on each side, with each span supported at each end by a concrete bent (horizontal substructure member) supported by concrete trestles (aka piers)

Figure 39. Typical crowned section (Section 1, 2, 3, 4).

Figure 40. Typical superelevated section (Section 5).
(Figure 41). Spans in the straight sections are 72 ft long and are supported by concrete I-beam girders. The edge barriers are steel-reinforced cast-in-place concrete parapets. They are about 2′8″ tall. The crash test level rating of the edge barriers is not known, but the height is similar to barriers with modern MASH TL-4.
Existing Drainage Patterns
The drainage infrastructure consists of 8-inch-wide, 3-inch-tall side deck drains through at the base of the concrete edge barriers (Figure 42). Drains are spaced about 8 ft on center.
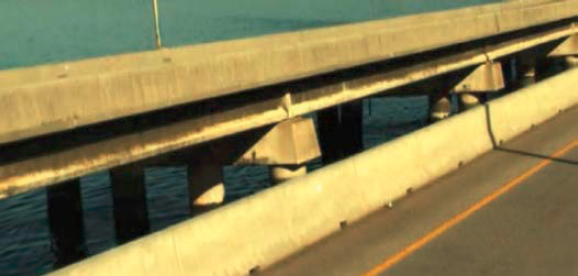
Figure 41. Representative view of concrete girder and trestle piers.

Figure 42. As-built details for side deck drains through edge barriers.
The deck drains discharge bridge deck runoff off the side of the bridge on the outside of the outermost girder. On sections of the bridge with a roadway-crowned cross section (Sections 1, 2, 3, 4, and 5), water discharges from drains on both sides of the bridge (Figure 39). In the superelevated section (Section 5), water drains only to the lower inside of the curve (Figure 40) At 8-foot spacing and accounting for superelevated sections, this means there are around 7,500 side deck drains.
Features Influencing Construction and O&M Access
As discussed earlier, the outside shoulder is 10 ft, and the inside shoulder is 6 ft. The waterway is fairly quiescent during normal conditions, and the bridge should be reasonably accessible by boat. However, access to the space between the bridges would be challenging by water due to low clearance and narrow space. See the additional discussion in the following section as part of the BMP location screening process. The bridge has electricity, which could potentially support O&M features or activities.
Step 1: Screen Potential BMP Locations
Floodway and Clearance Requirements
Table 21 shows key elevations for the flat, crowned sections of the bridges. Based on these values, the minimum bottom elevation of the BMP system should be 6.75 ft to avoid being inundated by water in an extreme high-water event in a future sea level rise scenario. This provides approximately 4.25 ft of clearance between the bottom of the girders and the design high-water level in the lowest crowned segment of the bridge. Structural elements that are below elevation 3.3 ft would be inundated relatively frequently under sea level risk.
This does not account for wave height. This may justify an additional separation from high water or precautions to avoid major damage if large waves and high tides co-occur.
Clearance is more than 20 ft higher than the values given in Table 21 at some spots where the roadway rises. For the superelevated sections, the lower edge of the bridge is likely lower than
Table 21. Elevation profile of flat crowned sections (NAVD88).
| Elevation Parameter | Elevation (ft) | Source |
|---|---|---|
| Bridge Deck (South Abutment) | 17.25 | Design drawings |
| Bridge Deck (North Abutment) | 16.1 | Design drawings |
| Girder Bottom Elevation (North Abutment) | 11.0 | Design drawings (approx.) |
| Mean High Tide (1992) | 1.3 | Design drawings |
| Mean Low Tide (1992) | -1.3 | Design drawings |
| Mean Sea Level | -0.25 | NOAA: https://tidesandcurrents.noaa.gov/datums.html?id=8638610&name=Sewells%20Point&state=VA |
| 10-Year High Water Level | 4.75 | NOAA: https://tidesandcurrents.noaa.gov/est/est_station.shtml?stnid=8638863 |
| Sea Level Rise at Mid-Century | +2 above current | Hampton Roads Planning District Commission Water Resources |
| Design High Water Surface Elevation | 6.75 | Sum of 10-year water level and sea level rise estimate |
the values shown here, which would reduce clearance on the lower edge compared to the values given in Table 21.
Structural Considerations
As described in Chapter 4, the bent columns and bent caps are the most likely structural element to have sufficient structural capacity to support BMPs. Bent caps are around 5′ wide by 5′ high, and bent columns are around 5′ in diameter.
Girders are likely made of prestressed concrete. Therefore, attachments to these girders are unlikely to be acceptable.
Because this is a high-traffic interstate bridge with a speed limit of 60 mph over water, it is likely the edge barriers were designed to approximately a MASH TL-4 standard. However, the construction of the bridge pre-dated the MASH rating system, and the structural rating is not known. TL-4 rating has a vertical design load of 18,000 lbs. Therefore, it is unlikely that the edge barriers could support a BMP without supplement support, even if the barriers were designed to the TL-4 standard.
Construction and Maintenance Access Considerations
The most conducive BMP locations for access are on the outer edges of the bridges as there is a full 10-ft shoulder, which may not require lane closure for normal O&M. The shoulder on the inner edge of each bridge is only 6 ft and would require lane closure.
If construction or O&M is performed by barge, it could be challenging to access the space between the bridges as there is relatively limited vertical clearance to get under the bridges and the space between bridges varies from 40 ft to less than 10 ft.
Mounting BMPs below the bridge deck appears to be very undesirable due to the limited clearance. The top of the BMP would need to be about 1 to 2 ft below the girders, interfering with access. Furthermore, less than 10 ft of clearance between the bottom of girders and mean high tide would make it difficult for a barge with lift equipment to fit under the bridge for installation and removal during major maintenance. These considerations mean the BMP will need to be placed outside of the outermost girder to make regular maintenance feasible.
Capture and Conveyance of Stormwater
Due to the large number of existing deck drains and the inability to modify the existing drainage infrastructure on the bridge deck (e.g., by plugging/removing deck drains and installing consolidated catch basins), placing a BMP at each drain point is infeasible. As such, drainage will need to be consolidated to multiple locations. This offers flexibility in locating the BMP where it is conducive to structural support and maintenance access. However, it means a drainage system will effectively need to span the entire bridge.
With the 4.25 ft of clearance from the bottom of the girder to design BMP bottom elevation, it appears there may be enough room to route water under the bridge from the inside edges to the outside edges.
Initial Location Screening Results
The most preferred locations are on the end of the trestle piers on the outer edge of each bridge. This affords the most favorable access for both on-bridge and on-water construction and O&M activities. This conceptual design will first examine the possibility of this location. The primary downsides of this location are the need to convey water below the bridge from the inner drain points and the potential structural risks associated with asymmetrical loading on one side of the bridge.
Other locations are clearly less desirable:
- Mounting below the bridge deck is clearly undesirable and likely infeasible.
- Mounting on the inside of the bridges would be substantially less favorable for access. The only advantage of this location is that it would reduce under-bridge piping and balance weight more symmetrically.
- There is no reason to suspend BMPs from the edge barrier. Piers have close enough spacing and have much better structural strength.
Step 2: Develop Preliminary Design Alternatives
Capture and Conveyance
Per the guidelines in Chapter 4, the two primary capture and conveyance approaches for distributed side drains are (1) side collection box drains at each drainage point, attached to a piped system, or (2) a continuous gutter or trough system. Because the drains are spaced at only 8 ft, it likely makes more sense to use a continuous capture gutter rather than attaching boxes and distinct pipe connections to each collection point. A gutter also has the advantage of providing a simple overflow mechanism for large storms and less risk of lateral spread on the roadway if the drainage system is obstructed.
The next question is how much elevation fall is available to convey the captured water, which informs how many spans could be collected to a single BMP. The distance from the drain hole invert to the bottom of the girder is approximately 5 ft. At a 2 percent slope, this means about 250 ft of roadway, or more than three spans, could be consolidated in each direction to a central pier before falling below the lower strand of the girder. This would allow up to six spans (three from each direction) to be consolidated.
There is 4.25 ft of clearance from the bottom of the girders to design high water. The minimum BMP profile from the BMP bottom to the inlet pipe invert is 2 ft. The pipe diameter is estimated to be 6 to 12 inches. This allows 1.25 ft of vertical to convey water under the bridge to the other side. Using the bridge width of 44 ft, the slope could be around 2.5 percent. As such, consolidating runoff from both sides of the bridge to the outside appears to be feasible for up to three spans in each direction.
Selecting and Sizing the BMP
For this case study we assume the prototype BMP described in Chapter 3 will be used. Proprietary options could be considered if BMP footprint is a prevailing factor.
There is no local water quality design flow rate that would apply to retrofit bridges. However, local water quality sizing criteria in Virginia are generally intended to target 90% long-term runoff capture. For this analysis, we evaluated the sizing needed to achieve varying long-term volumetric capture efficiencies (50, 80, and 90 percent) and separate sizing calculations of the footprint needed to achieve a one-year maintenance interval.
Table 22 summarizes the potential sizing options on a per-span basis. Each typical span is 0.073 acres (44 width × 72 length). This is based on the sizing guidelines provided in Chapter 4, Step 2b, consulting the reference values provided for Washington, DC (KDCA airport).
Consulting the decision tree provided in Figure 28 from Chapter 4 of the Guide, the first step is to determine whether water quality-based sizing or O&M-based sizing is larger. In this case, the controlling factor is the sizing to achieve the water quality target of 90% capture efficiency. This is much larger than the size needed to achieve a 1-year clogging interval and is quite large. Therefore, the next step is to see if a lower water quality sizing target is reasonable. Relaxing the
Table 22. Preliminary BMP sizing options.
| Sizing Criteria | WQ Design Intensity, in/h | WQ Design Flowrate Per Span, cfs | Filter Surface Area Per Span, sq ft | Time to Clog (years) | Annual Average Percent Capture (%) |
|---|---|---|---|---|---|
| 50% Long-Term Capture Efficiency | 0.14 | 0.0092 | 8 | 0.4 | 50 |
| 80% Long-Term Capture Efficiency | 0.47 | 0.0308 | 27 | 1.5 | 80 |
| 90% Long-Term Capture Efficiency | 0.98 | 0.0641 | 56 | 3 | 90 |
| 1-Year Maintenance | - | - | 21 | 1 | 67 |
sizing target to 80 percent capture criteria only reduces the annual percent capture by 10 percent yet reduces the required filter surface area by around 50%. It provides a 1.5-year estimated maintenance interval. For the purpose of this case study, the 80 percent capture target was selected as the compromise sizing approach. This requires about 27 sq ft of media bed for each span that is captured and routed to a BMP location.
Based on preliminary hydraulic calculations, the design water quality flow rates from two spans (0.062 cfs) can be conveyed in a 4-inch pipe or equivalent gutter if slopes are 2 percent or greater.
Preliminary Structural Review
As this is a hypothetical case study, structural specifications for the existing bridge were not available for review. Regardless, the selected location is attached to a pier, which is assumed to have enough excess load-bearing capacity to support the addition of a BMP. This should be confirmed, and additional structural considerations, such as whether placing all BMPs on the outside of the bridges would present a problem due to asymmetrical loading. Additionally, because this area is subject to regional subsidence, a structural analysis may need to consider whether placing BMPs on selected piers presents a risk of differential settlement.
One of the main considerations is the ability to construct suitable platforms to support the BMPs from the piers/bents and the relative cost and complexity of these platforms. Structural design is needed to determine if attachments to the trestle piers and bents are feasible.
Develop Conceptual O&M Approach
If all BMPs are located on the exterior of the bridges, routine maintenance from the 10-ft emergency lanes will likely be feasible. Maintenance from the water by boat or barge is also possible but is likely not needed.
Regular maintenance primarily includes raking and replacement of mulch, vacuum truck cleanout of the pre-treatment chamber, and potentially permeability testing. These activities require hand labor access. This suggests the need for a permanent platform with guard rails and potentially a built-in ladder system.
For major maintenance and initial construction, when whole media units are being moved, it may be necessary to remove BMP modules and rehabilitate them at a maintenance yard. Couplings between the conveyance piping and the pre-treatment module, as well as between the pre-treatment module and the media modules, should be flexible to allow for quick disconnection and a few inches of placement tolerance.
This concept would result in new drainage elements that did not exist before the retrofit project. These will need to be cleaned, such as by jet trucks.
Due to the large number of BMPs likely required for this installation, maintenance intervals will likely need to be staggered, such that perhaps 20-50 BMPs are maintained at any given time, with each group of BMPs being maintained approximately once every 12 to 18 months.
Integration of Preliminary Design
Based on the previous steps, the most favorable potential BMP configuration will be based on the following basic design decisions:
- Prototype BMP units as described in Chapter 3
- Pier-mount BMPs
- Convey water with a continuous collection gutter
- Convey water from the inside of the bridges to the outside of the bridges for consolidated treatment
- Keep BMPs on the outside of the outermost girder
- Minimum BMP bottom elevation of 6.75 ft
- Size for 80 percent capture of long-term average annual runoff
The next decision is to decide how many spans to treat at a single pier. The main driver is the size of the BMPs. As a starting point, we will assume the design consolidates two spans to a central BMP location. The drainage configuration is illustrated in Figure 43.
Based on Table 22, two spans will require about 54 sq ft of media bed and about 27 sq ft of pre-treatment. Each treatment module can be approximately 5 ft long and 5.5 ft wide, which is a configuration that approximately equals the required surface area while minimizing unit length and, therefore, distance from the pier. Six inches of spacing is provided between each module. Additionally, a maintenance access walkway is needed on at least two sides of the system, with an estimated 2 ft of width. The resulting system is about 20 ft long and 7 ft wide. This size is at the upper limit of what appears to be reasonable for a pier. Therefore, alternatives that would involve more spans were not considered.
Figure 43. Conceptual drainage routing for Case Study 1.
Figure 44 illustrates this preliminary design concept. Combining the preliminary design with the conveyance criteria discussed in Step 3, we can develop a profile view as well (Figure 45). Figure 46 provides a more detailed version of the profile layout for this conceptual design.
The design illustrated in Figures 44 through 46 would need to be repeated at about 230 piers to treat the entire bridge. This results in a very long construction process, very high cost, and lengthy maintenance cycles.
A similar preliminary design could potentially work for all Sections (1-6) of the bridge, with slight modifications to the conveyance design. Sections 1, 4, and 6 of the bridge will function as illustrated in Figure 44 through Figure 46. For Sections 2 and 3 of the bridge, which are inclined, the designed conveyances should work with the existing bridge slope. As such, the conveyance trough should bring water to the BMP from the two spans upstream rather than from one span upstream and one span downstream. For Section 5 of the bridge, where there is a horizontal curve, the southbound bridge drains to the outside, so no water will need to be conveyed under the girders. For the northbound bridge, which drains to the inside, all water will need to be conveyed under the girders to the outside of the bridge. This may present greater vertical constraints.
Rough Order of Magnitude Capital Cost Estimate
This section presents a rough order of magnitude (ROM) capital cost estimate based on 2023 dollars. Note that this type of construction is quite rare and is not well supported by traditional cost-estimating databases (e.g., RS Means), so professional judgment has been used for some components, and a range of unit costs is presented.
Table 23 summarizes major cost components. The total range of costs is estimated to be approximately $90 to $200 million. The area treated is about 33 acres, translating to about $2.7 to $6 million per acre.
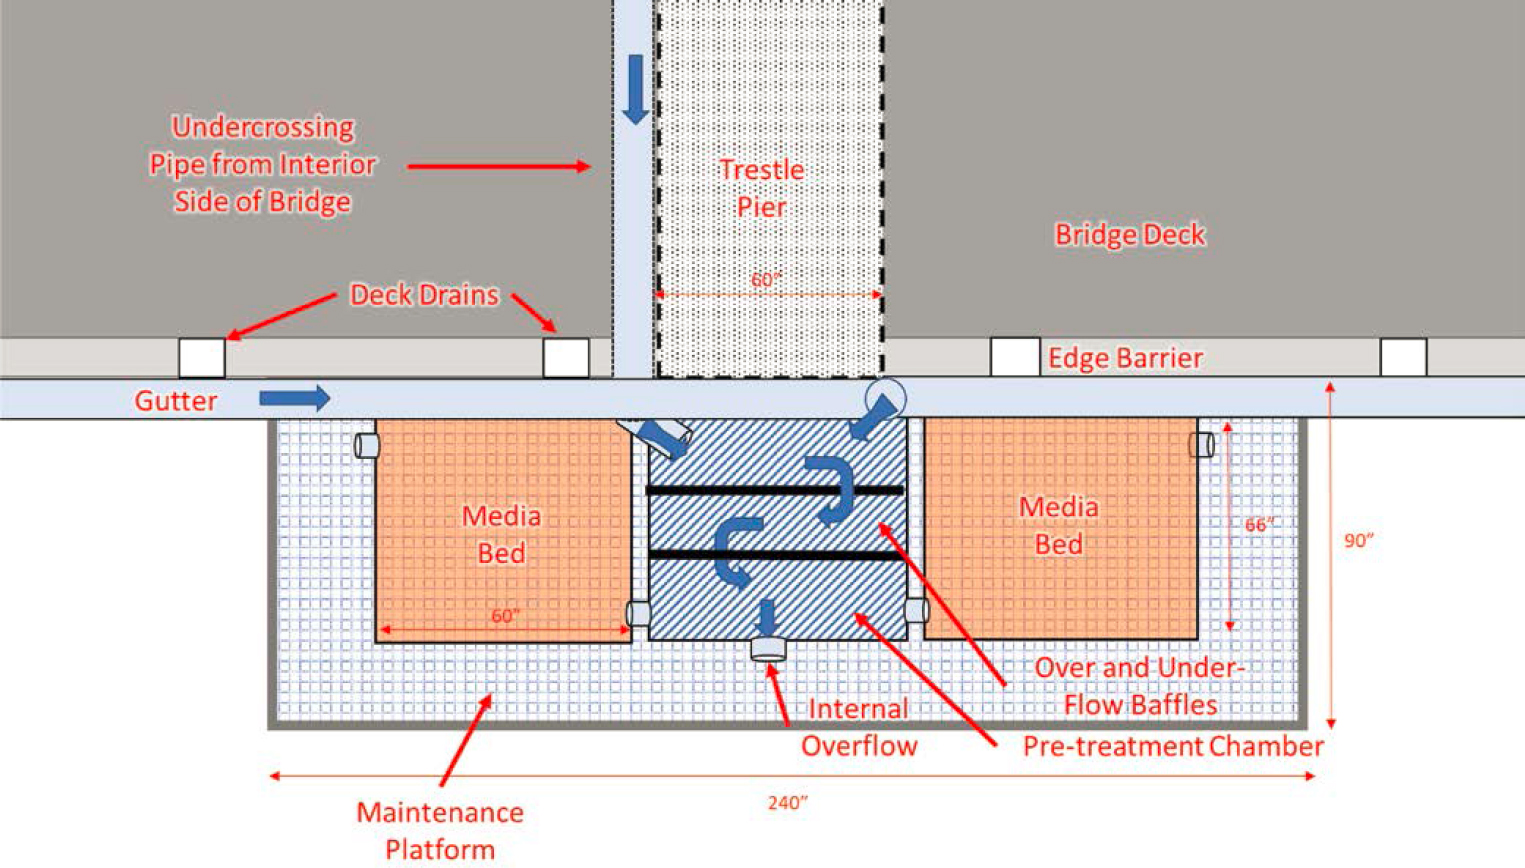


Table 23. Rough order of magnitude capital cost estimate for Case Study 1.
| Line Item | Units1 | Unit Cost, Low | Unit Cost, High | Quantity | Total Cost, Low ($) | Total Cost, High ($) | Assumptions |
|---|---|---|---|---|---|---|---|
| Engineering Design and Planning | |||||||
| Site Survey and Preliminary Bridge Inspections | LS | $100,000 | $300,000 | 1 | $100,000 | $300,000 | |
| Preliminary Design/Feasibility Assessment | LS | $750,000 | $1,500,000 | 1 | $750,000 | $1,500,000 | |
| Permitting, Environmental Impact Assessment, and Legal Compliance | LS | $500,000 | $1,000,000 | 1 | $500,000 | $1,000,000 | |
| Engineering Design (Civil, Structural, etc.), plans and specs | LS | $2,000,000 | $5,000,000 | 1 | $2,000,000 | $5,000,000 | |
| Subtotal | $3,400,000 | $7,800,000 | |||||
| Materials, Fabrication, and Installation | Units | Unit Cost, Low | Unit Cost, High | Quantity | Total Cost, Low ($) | Total Cost, High ($) | |
| Barge Operation | Day | $4,000 | $8,000 | 1150 | $4,600,000 | $9,200,000 | Five workdays per BMP to build structure, install drainage, and perform inspections. |
| Stormwater Treatment Unit (materials, assembly, delivery, minus media) | EA | $10,000 | $20,000 | 460 | $4,600,000 | $9,200,000 | Custom fabricator, large quantity, reinforcement for lifting. Standard mass-produced fiberglass tanks are $5,000 per RSMeans. |
| Pre-treatment Chamber and Components (materials, assembly, delivery) Filtration Media (material, delivery) | EA CY | $6,000 $750 | $12,000 $1,500 | 230 703 | $1,380,000 $527,083 | $2,760,000 $1,054,167 | Simpler version of the Stormwater Treatment Unit. Based on material unit costs, plus procurement, testing, delivering, and handling. |
| Structural Support System, e.g., braces, frame/platform, anti-corrosion coatings, etc. (materials, fabrication delivery), including O&M platform, excluding installation | EA | $50,000 | $100,000 | 230 | $11,500,000 | $23,000,000 | Very rough estimate based on fairly large weight and challenges of connecting to concrete piers. |
| General Labor for Structure and BMP Installation on Piers | EA | $50,000 | $100,000 | 230 | $11,500,000 | $23,000,000 | 4–6-person crew for delivery and construction, 1–2-week duration per BMP installation, plus specialized barge-mounted lifting equipment. |
| Stormwater Conveyance System, e.g., trough, pipe, fittings, appurtenances, brackets, and supports (materials, fabrication, delivery, and installation) | LF | $300 | $600 | 77000 | $23,100,000 | $46,200,000 | 4–6-person crew, 1–2 weeks duration for each BMP collection system. Custom scaffold setup and breakdown. Plus materials, connections, brackets, etc. |
| Subtotal | $57,200,000 | $114,400,000 | |||||
| Line Item | Units1 | Unit Cost, Low | Unit Cost, High | Quantity | Total Cost, Low ($) | Total Cost, High ($) | Assumptions |
|---|---|---|---|---|---|---|---|
| General Construction Requirements | |||||||
| Mobilization/Demobilization (2-5% of construction costs) | LS | $1,144,000 | $5,720,000 | 1 | $1,144,000 | $5,720,000 | |
| Environmental Monitoring/Protection During Construction (1-2% of construction costs) | $572,000 | $2,288,000 | 1 | $572,000 | $2,288,000 | ||
| Health and Safety Management/Oversight (1-2% of construction costs) | $572,000 | $2,288,000 | 1 | $572,000 | $2,288,000 | ||
| Material Inspection and Quality Control (2-5% of material costs) | LS | $1,144,000 | $5,720,000 | 1 | $1,144,000 | $5,720,000 | |
| Traffic Control (Interstate Bridge) | Day | $2,500 | $5,000 | 730 | $1,825,000 | $3,650,000 | Accounts for potentially multiple points of traffic control. |
| Temporary Power and Facilities, Construction Tools/Equipment, Stockpiling, etc. (2-5% of construction costs) | LS | $1,144,000 | $5,720,000 | 1 | $1,144,000 | $5,720,000 | |
| Subtotal | $6,400,000 | $25,400,000 | |||||
| Design and Construction Subtotal | $67,000,000 | $147,600,000 | |||||
| Overhead | Units | Unit Cost, Low | Unit Cost, High | Quantity | Total Cost, Low ($) | Total Cost, High ($) | |
| Construction Management and Overhead, Insurance, and Bonding (10%) | $6,700,000 | $14,760,000 | 1 | $6,700,000 | $14,760,000 | ||
| Contractor Oversight (2.5%) | $1,675,000 | $3,690,000 | 1 | $1,675,000 | $3,690,000 | ||
| Construction Contingency (25%) | $16,750,000 | $36,900,000 | 1 | $16,750,000 | $36,900,000 | ||
| Overhead Subtotal | $25,125,000 | $55,350,000 | |||||
| Opinion of Total Probable Costs | $92,000,000 | $203,000,000 | |||||
1Unit definitions: LS: lump sum, EA: each, CY: cubic yard, LF: linear foot
Within this cost estimate, the cost of the BMP units and media, including fabrication and delivery, are estimated to be about 7% of the total cost of the project.
The cost of the collection systems and structural support systems make up an overwhelming part of this cost estimate and account for much of the construction complexity.
Rough Order of Magnitude O&M Cost Estimate
Table 24 shows rough estimates for routine (yearly) O&M activities. This assumes approximately 2 BMP locations can be maintained in a day by each crew, consisting of two hand laborers and a vacuum truck operator. Multiple crews could operate at the same time.
Table 25 shows rough cost estimates for more significant rehabilitation cycles in which the full depth of filter media is removed and replaced. This could occur approximately every 5 years.
Table 24. Rough order of magnitude routine O&M cost.
| O&M Cost | Units | Unit Cost | Quantity | Total |
|---|---|---|---|---|
| Vacuum operation and disposal | Day | $3,000 | 160 | $480,000 |
| Hand Labor (two-person crew) | Day | $1,800 | 160 | $288,000 |
| Materials and Disposal for Each BMP | EA | $750 | 230 | $172,500 |
| Traffic Safety | Day | $1,000 | 160 | $160,000 |
| Rough total | $1,100,000 |
Steps 3 and 4: Preliminary Design Evaluation and Additional Design Considerations
This case study identified a design that appears to be geometrically feasible and provides adequate clearance. However, there are several major issues that need to be evaluated for this concept to help support a decision of whether to proceed:
- The structural feasibility of adding additional load at a subset of piers.
- There could be concerns about differential settlement or a general increase in structural risk. The weight added to each pier would be about 30,000 to 40,000 lbs plus the weight of conveyance features.
- The structural design and feasibility of attaching the structural supports and platforms to concrete piers.
- It is unclear if there is a reasonable way to attach a platform to the pier to carry this load.
- Constructability, including how to construct the structural platforms.
- It appears that this may require on-water work with a barge and a deck-mounted crane.
- Selection of appropriate materials for work in marine environments.
- For the purposes of this exercise, we assume new structural members will need to be marine-grade metal, and boxes and gutters should be made of fiberglass if possible.
- O&M activities needed to prevent corrosion and deterioration of metals, including elements that may be routinely submerged.
- This may require specialized coatings to be applied and periodically reapplied, which are not required on any other aspect of the concrete bridge and trigger extensive new maintenance.
- Possible use of proprietary BMP media.
- Proprietary media could reduce media bed footprint, potentially allowing a smaller platform every two piers or a similar-sized platform to be placed every four piers.
- Extreme capital costs and O&M costs.
Table 25. Rough order of magnitude system rehabilitation costs.
| O&M Cost | Units | Unit Cost | Quantity | Total |
|---|---|---|---|---|
| Hoist Truck and Flatbed with Operator | Day | $3,000 | 320 | $960,000 |
| Hand Labor (two-person crew) | Day | $1,800 | 320 | $576,000 |
| Materials and Disposal for Each BMP | EA | $2,000 | 320 | $640,000 |
| Traffic Safety | Day | $1,000 | 320 | $320,000 |
| System Rehabilitation (two-person crew, half day) | EA | $1,800 | 320 | $576,000 |
| Rough total | $3,072,000 |
Overall, the biggest issues appear to be the capital and O&M costs, driven by the design complexity, challenging construction environment, and high O&M needs. The capital costs are exceptionally high compared to typical on-land BMPs, perhaps 20 times higher on a per-acre-treated basis than on-land BMPs, which can often be constructed for $150,000 to $300,000 per acre treated, compared to $2.7 to $6 million per acre treated.
Some of the most challenging design and construction components arise from the need to retrofit the entirety of the bridge with a drainage system and the need to install new structural supports. The drainage system is a major cost driver that will apply to any bridge with distributed drainage points. In comparison, the costs of the custom BMPs and specialized equipment are a lower portion of the cost.
Various alternatives could be explored; however, it is unlikely that alternatives would substantially reduce costs. Using more space efficient designs such as proprietary BMPs would potentially reduce structural support costs by allowing for fewer piers with BMPs. This option would likely have similar BMP costs. Conveyance costs would be similar or somewhat increased.
BMPs could be further consolidated and much of the structural support costs avoided by considering floating platforms to hold BMPs. However, new costs would arise from construction of floating platforms. Additionally, the risk of damage from wave action would go up and maintenance needs could be increased.
Overall, even if value engineering and refinement of cost estimates achieves 2–4× reduction in cost savings, it is very unlikely that the benefits of treating water from this bridge would justify the extreme cost.
Case Study 2: Nisqually River Bridge (Hypothetical)
Case Study Relevance
This case study addresses various common considerations:
- Capture of water from many distributed discharge locations
- Evaluation of clearance from high water levels at a river location
- Retrofits involving a metal truss bridge
- Tradeoffs between sizing method, weight, consolidation of BMP locations, and the number of units to be installed
- Estimated costs for construction and O&M
The Nisqually River Bridge (NRB) has no current requirement for stormwater treatment for bridge deck runoff, but is used as an example of an at-grade river crossing that has on-bridge drainage features discharging directly to the river.
Bridge Setting
The NRB is a two-unit steel truss bridge that carries Interstate 5 (I-5) over the Nisqually River in Washington State near the city of Dupont (Figure 47, Figure 48). The two units of the bridge are similar in design and construction but were built at different times (northbound in 1938 with major modifications in 1979 and southbound in 1968), with both having been seismically retrofitted in the late 1990s. The bridges are approximately 450 ft in length, with each bridge consisting of three separate sections: the primary span across the river, which is supported by an arch truss, and an approach span on either side of the river (Figure 49).
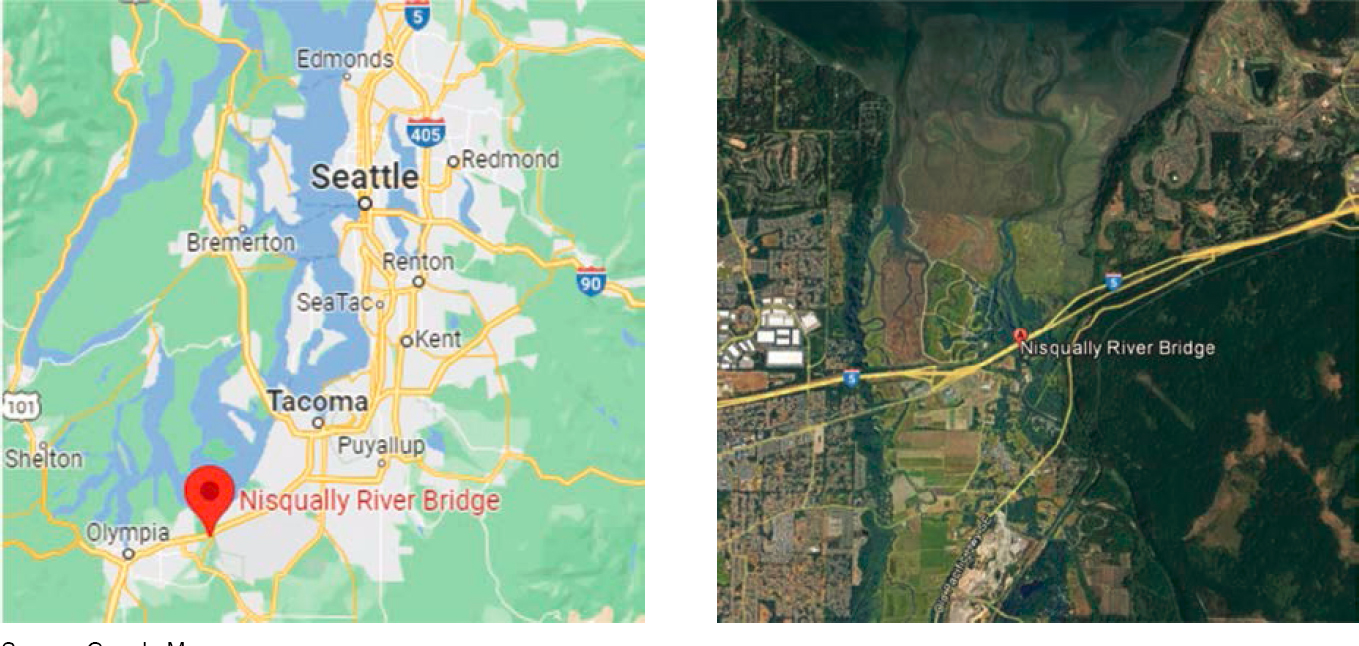
Figure 47. Nisqually River Bridge location.
Characterization of Key Features and Constraints
Roadway Geometry
The northbound bridge has a total width of approximately 43 ft with a gutter-to-gutter width of 36 ft and 3-foot-wide shoulders on both sides of the bridge. The southbound bridge has a total width of approximately 48 ft with a gutter-to-gutter width of 36 ft and 6-foot-wide shoulders on both sides of the bridge.
Both the northbound and southbound bridges are either flat or have a longitudinal crown with a minimal slope (less than 1%) along the main span. Both bridges have 0.3–0.4% slopes on each approach section. Both bridges have dividing crowns approximately one-third of the
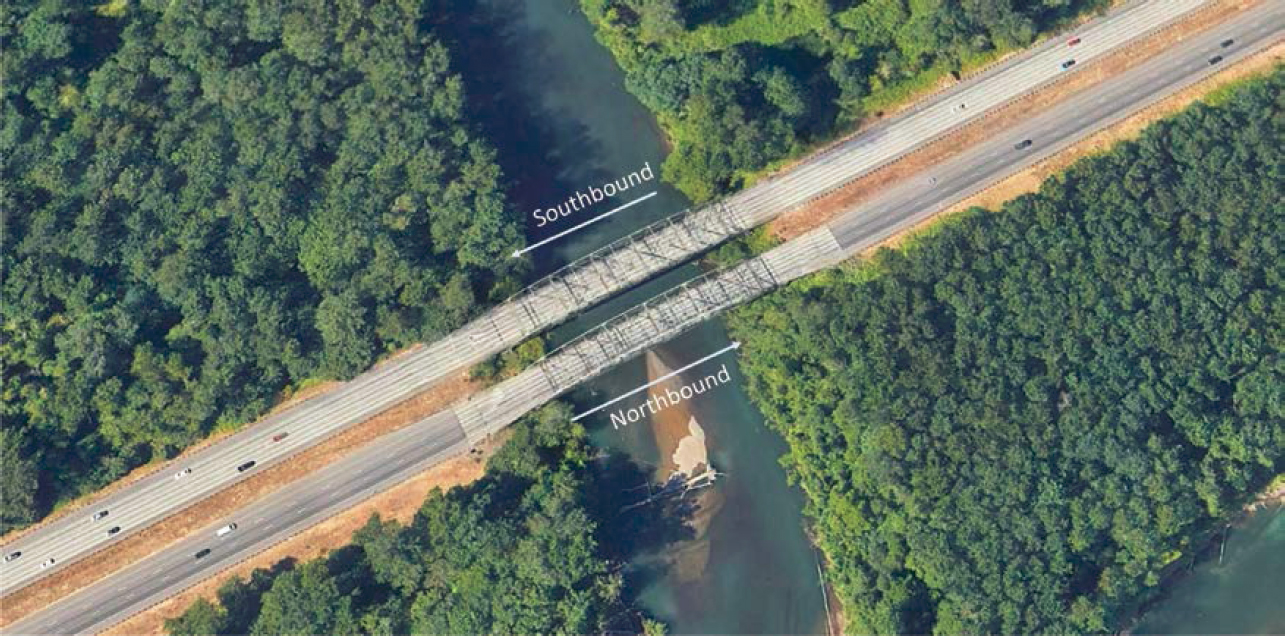
Figure 48. Aerial view of bridge vicinity.
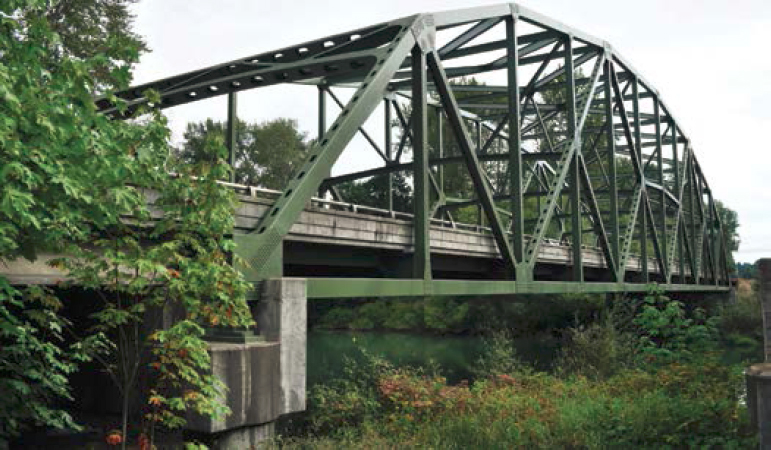
Figure 49. Southbound Nisqually River Bridge from between units.
bridge width off their northern sides. The cross (i.e., transverse) slope of the northbound bridge is approximately 1.7% from the crown point to the south and approximately 0.5% from the crown point to the north. The cross slope of the southbound bridge is 2% from the crown point.
Structural Elements
Both bridges are constructed with metal trusses and girders supported by concrete abutments. There are no central piers. The northbound edge barrier consists of a concrete traffic barrier without curbs. It is supported on its exterior side by a lateral steel beam that is part of the bridge truss structure. The southbound edge barrier consists of curbed, cast-in-place concrete barriers.
Existing Drainage Patterns
Drainage from the primary span of the northbound NRB consists of 4-inch vertical drainpipes distributed along both sides of the bridge at intervals of approximately 25 ft (Figure 50). There are approximately 12 total deck drains on either side. It is unclear if these down drains are flush with the bottom of the bridge or extent below as many modifications have been made since original construction.
The 60-foot-long approach sections are drained by catch basins on each side of the roadway that are then piped to discharge onto the bank of the river under the bridge abutment.
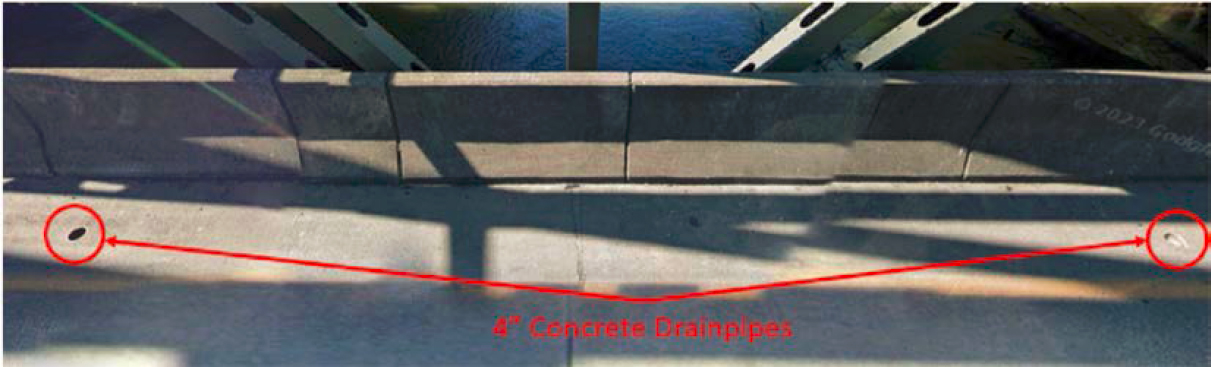
Figure 50. Drainage on the primary span of the northbound bridge.
Drainage from the primary span of the southbound NRB consists of one 6-inch vertical drainpipe located at each corner of the main span near the bridge piers (Figure 51). The pipes extend 5.2 ft beneath the roadway surface. Most of the runoff from the 54-foot approach sections of the southbound bridge is not captured but likely runs down the approaches onto land and infiltrates. There is one catch basin, similar to those on the northbound bridge, for the northeast corner of the southbound bridge.
Features Influencing Construction and O&M Access
Several features are notable related to construction and O&M access:
- There are limited shoulders within the bridge.
- The truss system would interfere with the use of hoists to install or remove structural platforms or BMPs.
- The river may be reachable by small boats in some circumstances but would not likely be navigable by a barge.
- I-5 is a major north-south conduit in Washington with an AADT of over 60,000.
- There is a median between northbound and southbound lanes on both ends of the bridge for staging or potential construction or maintenance access.
Step 1: Screen Potential BMP Locations
Floodway and Clearance Requirements
The normal low flow stage of the river is approximately 2.5 ft, and the FEMA-mapped 100-year flood stage is 17 ft, both reported in NAVD88. The roadway surface elevation on both bridges is about 30 ft, which is about 13 ft above the 100-year flood-stage elevation. This bridge and the associated levees created by the adjacent roadways form a pinch point of the floodplain, so impacts to flood clearance should be strictly avoided. For this case study, an additional 1 foot of clearance is used as a factor of safety to account for potential climate change impacts. The design high-water elevation becomes 18 ft.

Figure 51. Detail of bridge deck drain for the southbound bridge.
Structural Considerations
As described in Chapter 4, piers and girders may have sufficient structural capacity to support BMPs. As truss bridges, only the approach sections have true girders, while the main span is supported by stringers and the truss structure. Stringers are much shallower and have a lower structural capacity than girders; therefore, they are likely unsuitable for BMP attachment. However, the truss structure is designed to bear significant load and may be an appropriate attachment point for BMPs.
It is unnecessary to consider edge barriers in this case due to the presence of the truss structure, which offers much greater structural capacity than edge barriers and actually appears to support the edge barriers from the outside.
Construction and Maintenance Access
Any locations below the bridge would be a critical fatal flaw due to the inability to access it for construction and maintenance.
Maintenance access will be simplest if set outside of the truss section to avoid having to thread equipment BMP components through the openings in the truss. However, it is critical to place BMPs outside of the bridge edge barriers within the truss spans if this is possibly feasible.
If water can be routed toward the piers, it is possible that some maintenance could be performed from land.
The distance between bridges is approximately 30–40 ft, which means it is feasible to place BMPs between the two bridges if needed.
Capture and Conveyance of Stormwater
Due to the large number of existing deck drains on the northbound bridge and the inability to modify the existing drainage infrastructure on the bridge deck (e.g., by plugging/removing deck drains and installing consolidated catch basins, etc.), placing a BMP at each inlet is infeasible for the northbound bridge. However, with the available clearance from the bridge deck to the high-water elevation, it appears there is sufficient ability to collect water from each down drain and route it to the abutments. There also may be sufficient vertical clearance to convey water underneath the bridge to consolidate BMPs further.
The southbound bridge has only four inlets on the main span (one in each corner near the abutments) and one on the approach section. A BMP at each inlet could be feasible for the southbound bridge. However, fewer BMPs could reduce complexity. Therefore, because there is also adequate clearance, consolidation of BMPs is preferred.
Initial Location Screening Results
In our initial screening, we reached the following tentative conclusions:
- Mounting below the bridge is ruled out due to fatal flaws.
- It is not necessary to consider the edge-barrier mounted BMPs since the truss is a better option if BMPs must be distributed.
- It appears feasible to collect and convey water toward piers.
- Evaluating the area around piers, it appears to be feasible to route water from the outside of the bridges to the space between the bridges. This supports the opportunity to consolidate runoff to a single location on each end of the bridge. This option was advanced for further design development.
Step 2: Develop Preliminary Design Alternatives
Capture and Conveyance
A system is needed to collect the runoff from the 24 down drains on the northbound unit. Per the guidelines in Chapter 4, Step 2a, a continuous gutter below these drains would be the simplest to intercept water without requiring individual connections. However, the trusses appear to prevent a clear path for a gutter to flow. Therefore, the water will need to be conveyed to the outside of the truss structure for consolidation. As such, each drain will be connected to a piped extension, which can discharge to either a gutter, which allows overflow over the sides of the gutter, or piping with additional overflow pipes, as illustrated in Chapter 4. Either approach will work in this scenario. We will select the piping option as it is likely a less custom design and permits a greater selection of material types. Figure 52 shows a schematic of this approach.
The bottom of the bridge deck is at an elevation of around 29.0 ft. The top of the horizontal truss beam is at an elevation of 27.25 ft. This 1.75 ft of clearance is adequate to pipe water to the outside of the truss structure above the horizontal beam (Figure 52) at an elevation of about 28 ft.
The main collector pipe will need a slope of about 2%. From the middle of the bridge, there is about 160 ft of pipe, corresponding to about 3.2 ft of fall to an elevation of about 24.8 ft.
The bottom of the girders in the approach sections are about 25 ft. Therefore, the pipe elevation at each pier will be able to route under the girders from the outside of the bridge to the inside. This requires about another 1 ft of fall, putting the pipe at about 23.5 ft at the candidate BMP location. This is 5.5 ft above the high-water elevation of 18 ft, offering enough vertical clearance for the BMP.
For the southbound bridge, there are only four inlets on the main span and one inlet on the approach spans. A simpler version of the piping approach used for the northbound bridge is proposed here but includes much less piping. It is likely that the 5.2-foot drainpipe extensions will need to be cut shorter so as to preserve as much vertical clearance as possible.
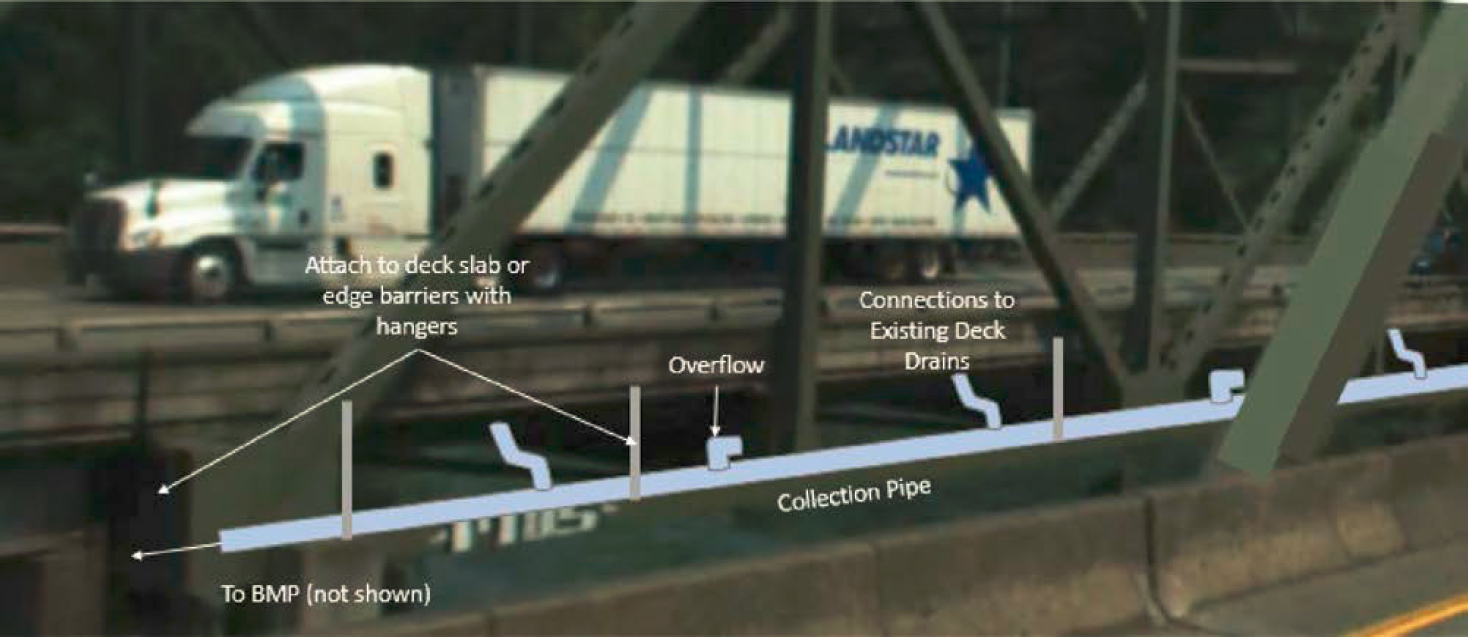
Figure 52. Conveyance schematic for northbound bridge for Case Study 2.
Table 26. Preliminary BMP sizing options for northbound NRB.
Sizing Criteria | Total Filter Surface Area (sq ft) | Time to Clog (years) | Annual Average Percent Capture (%) |
|---|---|---|---|
| 91% Capture (local sizing criteria) | 81 | 0.73 | 91 |
| 50% Capture | 31 | 0.28 | 50 |
| 80% Capture | 55 | 0.50 | 80 |
| 1-Year Maintenance | 111 | 1.00 | >91 |
Selecting and Sizing the BMP
For this case study, we assume that the prototype BMP described in Chapter 3 will be used. Multiple potential sizing options were evaluated, including sizing to the local sizing criteria for new development (91% long-term capture), two additional sizing options to achieve varying long-term volumetric capture efficiencies (50 and 80 percent), and a separate analysis to determine the footprint necessary to achieve a one-year maintenance interval. Table 26 summarizes the potential sizing options as applied to the northbound bridge (0.44 acres) and Table 27 summarizes the sizing options as applied to the southbound bridge (0.38 acres).
Consulting the decision tree provided in Chapter 4, Step 2b, the first step is to determine whether water quality-based sizing or O&M-based sizing is larger. In this case, the controlling factor is the sizing to achieve a 1-year clogging interval. This is somewhat larger than the size needed to achieve 91% long-term capture efficiency but in a similar range. Either option could be selected in this case. Because this is a major interstate bridge, closures for maintenance would be extremely disruptive, and so the design was based on the 1-year maintenance sizing approach.
If the total bridge requirement of 205 sq ft is split evenly between the northern pier and the southern pier, the resulting requirement is about 100 sq ft of media bed and 50 ft of pre-treatment at each pier, or a system 7.5 ft wide by 20 ft long. This appears to fit in the space between bridges.
Preliminary Structural Review
As this is a hypothetical case study, structural specifications for the existing bridge were not reviewed. Regardless, the selected location is attachment to a truss or pier structure, which has reasonable potential to have enough excess load bearing capacity to support the addition of a BMP. This should be confirmed through thorough detailed structural analysis, accounting for the original design, current condition of the structures, and factors of safety.
Develop Conceptual O&M Approach
Because the waterway is not navigable and the bridge shoulders are narrow, maintenance will almost certainly require lane closure unless it can be performed from land.
The ability to provide a centralized area for BMPs on either end of the bridge appears to be feasible related to drainage routing. This is likely most advantageous for maintenance.
Table 27. Preliminary BMP sizing options for southbound NRB.
Sizing Criteria | Total Filter Surface Area (sq ft) | Time to Clog (years) | Annual Average Percent Capture (%) |
|---|---|---|---|
| 91% Capture (local sizing criteria) | 70 | 0.73 | 91 |
| 50% Capture | 27 | 0.28 | 50 |
| 80% Capture | 47 | 0.50 | 80 |
| 1-Year Maintenance | 96 | 1.00 | >91 |
Integrate Preliminary Design
Based on the previous steps, the ideal BMP configuration will be based on the following basic design decisions:
- Prototype BMP units as described in Chapter 3: Stormwater Treatment Practice Design Options.
- Pier-mount BMPs.
- Convey water with piping to a centralized location on either end of the bridges, located between the northbound and southbound lanes.
- Minimum BMP bottom elevation of 18 ft.
- Size for 1-year maintenance interval.
The next decision is to size and configure the BMPs needed at each end and determine if a workable solution can be developed to support centralized BMP.
Drainage areas are illustrated in Figure 53. For the number of BMPs per drainage area, we can start with the assumption that a BMP with separate pre-treatment has 24 sq ft of media surface available (4 ft by 6 ft). This calculation shows we would need just over two media units per side per bridge to provide adequate surface area for a 1-year clogging interval. If we slightly increase the BMP size to 28 sq ft of media surface per module (4 ft by 7 ft), two units per bridge per side is sufficient for a 1-year clogging interval (Table 28).
There will be eight total media units and four pre-treatment units needed to achieve the desired maintenance interval. For ease of production, we will choose to make the pre-treatment modules the same size as the BMP modules. With a width of four ft, six inches between each unit and between each unit and the pier, the total width of the BMP train between the piers is 27.5 ft, which should fit between the bridges when lined up. As such, we will choose to install grated platforms between the two bridges at the piers, which will hold all of the BMPs for that end of each bridge. This approach is advantageous because it allows access to all BMPs from either bridge and allows for the load to be distributed across both piers (Figure 54). Supports between the platform and the ground could be added if structural analysis determines additional support
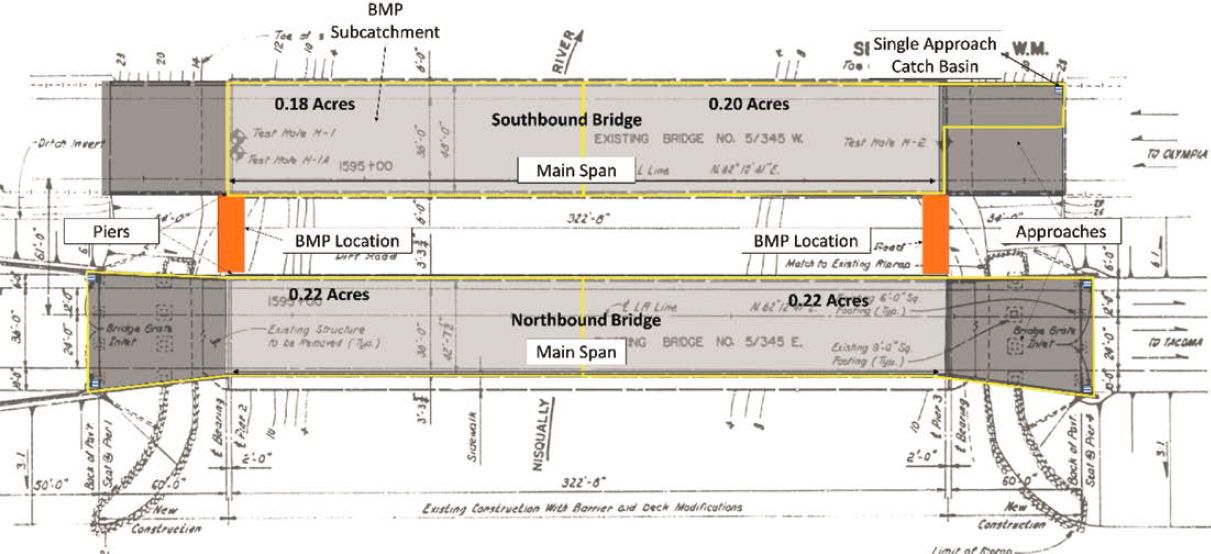
Figure 53. Conceptual BMP drainage areas for Case Study 2.
Table 28. Drainage area-specific BMP sizing needs for Case Study 2.
| Bridge Area | Drainage Area (sq ft) | Area of Media Required for 1-year Maintenance Interval (sq ft) | Number of 4’x6’ Media Units Needed | Number of 4’x7’ Media Units Needed |
|---|---|---|---|---|
| Southbound - west | 7752 | 45 | 1.9 | 1.6 |
| Southbound - east | 8724 | 51 | 2.1 | 1.8 |
| Northbound - west | 9525 | 55 | 2.3 | 2.0 |
| Northbound - east | 9525 | 55 | 2.3 | 2.0 |
is needed. Additionally, a catwalk could be provided to land if desired. A mirror image of this is proposed at the other end of the bridge.
When we examine the profile view, we see that there is sufficient vertical clearance between the bottom of the horizontal truss beam and the top of the BMPs for undercrossing pipes. The bottom of the approach girders is above the bottom of the horizontal truss beam approach girders, so it follows that there is sufficient clearance for piping in the approach catch basins as well. Finally, there is sufficient vertical clearance above the design high-water elevation of 18.0 ft. The profile view of this design is presented as Figure 55.
Rough Order of Magnitude Capital Cost Estimate
This section presents a rough order of magnitude (ROM) capital cost estimate (2023 dollars). Note that this type of construction is quite rare and is not well supported by traditional cost-estimating databases (e.g., RS Means), so professional judgment has been used for some components, and a range of unit costs is presented.
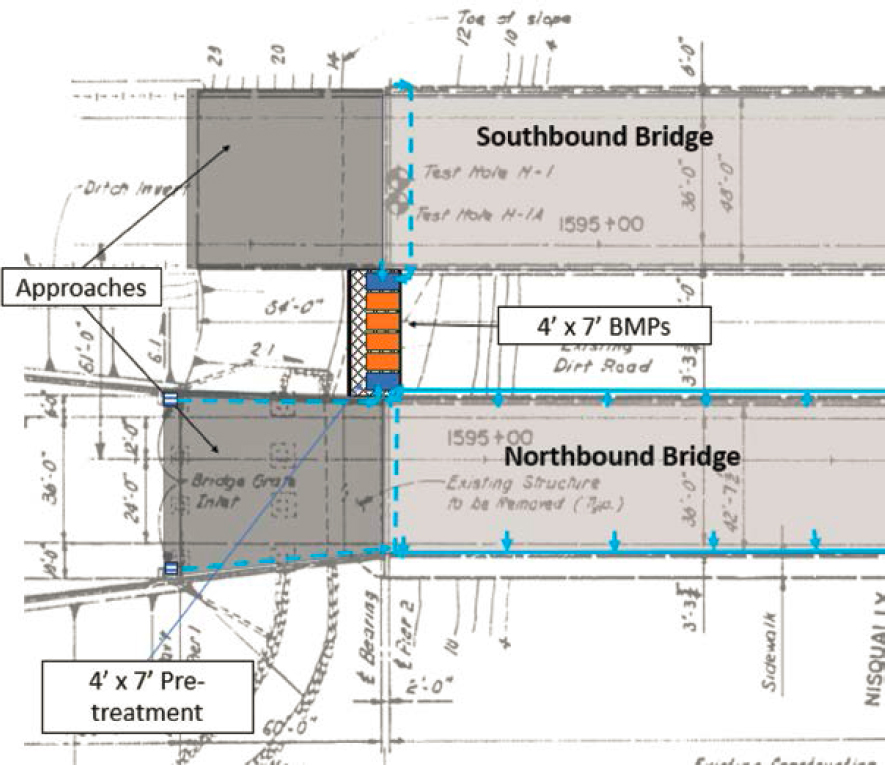
Figure 54. Conceptual plan view of the west side of bridges for Case Study 2.
Table 29 summarizes major cost components. The total range of costs is estimated to be approximately $1.8 to $3.0 million. The area treated is about 0.82 acres, translating to about $2.2 to $3.6 million per acre.
Within this cost estimate, the cost of the BMP units and media, including fabrication and delivery, are estimated to be about 9% of the total cost of the project.
The cost of the collection systems and structural support systems make up an overwhelming part of this cost estimate and account for much of the construction complexity.
Additionally, while this project would treat a small area, there are many fixed costs associated with design that do not scale with project size, particularly for complex projects that require special design features and specifications. As a result, costs for design make up a relatively large portion of the cost estimate in this case.
Rough Order of Magnitude O&M Cost Estimate
Table 30 shows rough estimates for routine (yearly) O&M activities. This assumes it will take two days to complete annual maintenance.
Table 31 shows rough cost estimates for more significant rehabilitation cycles in which the full depth of filter media is removed and replaced. This assumes that rehabilitation will require two days to remove the BMPs, four days in the maintenance yard to refurbish the BMPs and two days for reinstall. This could occur approximately every 3–5 years.
Table 29. Rough order of magnitude capital cost estimate for Case Study 2.
| Line Item | Units | Unit Cost, Low | Unit Cost, High | Quantity | Total Cost, Low ($) | Total Cost, High ($) | Assumptions |
|---|---|---|---|---|---|---|---|
| Engineering Design and Planning | |||||||
| Site Survey and Preliminary Bridge Inspections | LS | $50,000 | $150,000 | 1 | $50,000 | $150,000 | |
| Preliminary Design/Feasibility Assessment | LS | $100,000 | $200,000 | 1 | $50,000 | $100,000 | |
| Permitting, Environmental Impact Assessment, and Legal Compliance | LS | $100,000 | $200,000 | 1 | $50,000 | $100,000 | |
| Engineering Design (Civil, Structural, etc.), plans and specs | LS | $400,000 | $800,000 | 1 | $400,000 | $600,000 | |
| Subtotal | $600,000 | $1,000,000 | |||||
| Materials, Fabrication, and Installation | Units | Unit Cost Low | Unit Cost, High | Quantity | Total Cost, Low ($) | Total Cost, High ($) | Assumptions |
| Crane Rental and Operation | Day | $500 | $1,000 | 90 | $45,000 | $90,000 | 90-day construction window |
| Stormwater Treatment Unit (materials, assembly, delivery, minus media) | EA | $15,000 | $25,000 | 8 | $120,000 | $200,000 | Custom fabricator, relatively small quantity. Reinforcement for lifting. Standard mass-produced fiberglass tanks are 5,000 per RSMeans |
| Pre-treatment Chamber and Components (materials, assembly, delivery) | EA | $10,000 | $15,000 | 4 | $40,000 | $60,000 | Simpler version. |
| Filtration Media (material, delivery) | CY | $750 | $1,500 | 12 | $9,333 | $18,667 | Based on material unit costs, plus procurement, testing, delivering, and handling. |
| Structural Support System, e.g., braces, frame/platform, anti-corrosion coatings, etc. (materials, fabrication delivery), including O&M platform, excluding installation | EA | $50,000 | $100,000 | 2 | $15,000 | $50,000 | Very rough estimate based on fairly large weight and challenges of connecting to concrete piers. |
| General Labor for Structure and BMP Installation on Piers | EA | $75,000 | $120,000 | 2 | $150,000 | $240,000 | 4–6-person crew for construction, 4-6 week duration, prevailing wage. |
| Stormwater Conveyance System, e.g., trough, pipe, fittings, appurtenances, brackets, and supports (materials, fabrication, delivery, and installation) | LF | $300 | $500 | 640 | $192,000 | $320,000 | 4–6-person crew, 1-2 week duration for each BMP collection system. Custom scaffold setup and breakdown. Plus materials, connections, brackets, etc. |
| Subtotal | $600,000 | $900,000 | |||||
| General Construction Requirements | Units | Unit Cost, Low | Unit Cost, High | Quantity | Total Cost, Low ($) | Total Cost, High ($) | Assumptions |
| Mobilization/Demobilization (2-5% of construction costs) | LS | $12,000 | $45,000 | 1 | $12,000 | $45,000 | |
| Environmental Monitoring/Protection During Construction (1-2% of construction costs) | LS | $6,000 | $18,000 | 1 | $6,000 | $18,000 | |
| Health and Safety Management/Oversight (1-2% of construction costs) | LS | $6,000 | $18,000 | 1 | $6,000 | $18,000 | |
| Material Inspection and Quality Control (2-5% of material costs) | LS | $12,000 | $45,000 | 1 | $12,000 | $45,000 | |
| Traffic Control (Interstate Bridge) | Day | $2,500 | $5,000 | 30 | $75,000 | $150,000 | |
| Temporary Power and Facilities, Construction Tools/Equipment, Stockpiling, etc. (2-5% of construction costs) | LS | $12,000 | $45,000 | 1 | $12,000 | $45,000 | |
| Subtotal | $100,000 | $300,000 | |||||
| Design and Construction Subtotal | $1,300,000 | $2,200,000 | |||||
| Line Item | Units | Unit Cost, Low | Unit Cost, High | Quantity | Total Cost, Low ($) | Total Cost, High ($) | Assumptions |
|---|---|---|---|---|---|---|---|
| Overhead | |||||||
| Construction Management and Overhead, Insurance, and Bonding (10%) | $10,000 | $30,000 | 1 | $130,000 | $220,000 | ||
| Contractor Oversight (2.5%) | $130,000 | $220,000 | 1 | $32,500 | $55,000 | ||
| Construction Contingency (25%) | $13,000 | $22,000 | 1 | $325,000 | $550,000 | ||
| Overhead Subtotal | $500,000 | $800,000 | |||||
| Opinion of Total Probable Costs | $1,800,000 | $3,000,000 | |||||
Table 30. Rough order of magnitude routine O&M cost.
| O&M Cost | Units | Unit Cost | Quantity | Total |
|---|---|---|---|---|
| Vacuum operation and disposal | Day | $3,000 | 2 | $6,000 |
| Hand Labor (two-person crew) | Day | $1,800 | 2 | $3,600 |
| Materials and Disposal for Each BMP | EA | $750 | 2 | $1,500 |
| Traffic Safety | Day | $1,000 | 2 | $2,000 |
| Sum | $13,100 |
Table 31. Rough order of magnitude system rehabilitation costs.
| O&M Cost | Units | Unit Cost | Quantity | Total |
|---|---|---|---|---|
| Hoist Truck and Flatbed with Operator | Day | $2,000 | 4 | $8,000 |
| Hand Labor (two-person crew) | Day | $1,800 | 4 | $7,200 |
| Materials and Disposal for All BMPs | LS | $15,000 | 1 | $15,000 |
| Traffic Safety | Day | $1,000 | 4 | $4,000 |
| System Rehabilitation (two-person crew, half day) | EA | $1,800 | 4 | $7,200 |
| Sum | $41,400 |
Steps 3 and 4: Preliminary Design Evaluation and Case Study Observations
This case study identified a design that appears to be geometrically feasible and provides adequate clearance and reasonable O&M access. The following list provides a summary of the design evaluation and outstanding concerns.
- Structural risk.
- The structural risk of adding additional load at the piers needs to be determined. There could be concerns about differential settlement or a general increase in structural risk. The weight added at each end of the bridge would be about 60,000 lbs, translating to 30,000 lbs to each pier. Additionally, the feasibility of making attachments to the piers needs to be evaluated by a structural engineer. It is possible that the system could also be braced from below, but the geotechnical characteristics of the embankment are not known. Additionally, the use of proprietary BMPs could reduce the required size and weight of the platform and BMPs, if needed.
- Capture and conveyance, lateral spread risk.
- The capture and conveyance system appears feasible in concept. Adding new pipes to existing down drains would be somewhat complicated and involve bends that could increase
- the risk of obstructing drains. Overflows are proposed to help mitigate this risk. An open-channel gutter system or oversized pipes could be considered to further mitigate this risk.
- O&M access at this location would likely require lane closures.
- The piers are 50 ft from land, which is likely too long for a vacuum truck or lift truck. There are two additional lanes in each direction. So, if performed at lower traffic times, this may have limited impact.
- Construction impacts.
- Construction would require more extended lane closures to install pipes and the support structure.
- Constructability.
- Retrofitting the new conveyance system on the northbound bridge would involve complicated over-water work. An under-bridge boom truck likely would not fit between trusses. This is a complication that needs to be further explored. Structural attachments to piers need to be further explored.
- Cost and complexity.
- The project is expected to be very costly due to the complexity of the design, custom structural and BMP components interfacing with existing bridge elements, and challenging construction conditions. The total area treated is less than 1 acre; however, much of the design costs will be similar to those of a larger bridge. A ROM cost estimate is included in the previous section. The capital costs are exceptionally high at $2.2 to 3.6 million per acre treated. This is perhaps 10 to 20 times higher on a per-acre-treated basis than on-land BMPs, even in retrofit conditions (normally less than $200,000 per acre treated).
- Additional options.
- Initial review of elevations suggests it may be feasible to route water further toward the shore and place the BMPs on land between the bridges at an elevation above the design high-water level. This would require a level bench to be cut into the embankment with perhaps a 4 to 6 ft retaining wall. This could reduce structural costs, but it would increase piping, geotechnical design, retaining wall, and earthwork costs. Proprietary BMPs could be considered to reduce BMP size and weight should it be determined to be needed. This would have a minor impact on costs.
Overall, even if value engineering and refinement of cost estimates achieve a 2–4× reduction in cost savings, it is very unlikely that the benefits of treating water from this bridge would justify the extreme cost and added risks.
Case Study 3: Georgia DOT Cannon Road Bridge (Hypothetical)
Case Study Relevance
This case study addresses considerations that are present in many small concrete bridges on state highways and county roads, including:
- Capture of water from many distributed discharge locations
- Evaluation of clearance from high water levels at a creek crossing and associated impacts on placement issues
- Estimated costs for construction and O&M
Bridge Setting
The Cannon Road Bridge (CRB) is a small bridge located approximately 20 miles southwest of Atlanta, Georgia, that carries Cannon Road, also known as County Route (CR)-130, over
Figure 56. Cannon Road Bridge location and vicinity maps.
White Oak Creek (Figure 56, Figure 57a, and Figure 57b). The CRB was constructed as a replacement bridge in 2010 and consists of two lanes of travel over White Oak Creek (one in each direction). The bridge is owned and maintained by the Georgia Department of Transportation (GDOT). Currently, this bridge has no stormwater treatment controls for bridge deck runoff and no requirements to install treatment.
Characterization of Key Features and Constraints
Bridge Geometry
The bridge is a single unit, approximately 264 ft long and 33 ft wide, with a gutter-to-gutter width of approximately 30 ft. The bridge deck is crowned with a slope of 2% from the crown to
Figure 57a. Aerial view of the Cannon Road Bridge over White Oak Creek.

Figure 57b. Cannon Road Bridge travel lanes.
the gutters on each side of the bridge. The crown divides the bridge longitudinally in half down its geometric center. The bridge deck slopes longitudinally from east to west at approximately 1%.
Structural Configuration
The bridge has two end bents and two central bents, each supported by piles (Figure 58a). The spacing between each span is about 88 ft. Girders are prestressed concrete (Figure 58b). Edge barriers are reinforced concrete with reinforcement that ties into the bridge deck. Edge barriers are approximately 2′-8″ tall. A crash test level rating was not obtained but may be approximately MASH TL-4 or less. They are clearly not large enough to be TL-5.
Existing Drainage Patterns
The existing bridge drainage system consists of 4-inch diameter deck drains spaced at 10-foot intervals on each side of the bridge (Figure 59a and Figure 59b). Each of the existing 40 deck drains

Figure 58a. Elevation view of Cannon Road Bridge.

Figure 58b. Section view of Cannon Road Bridge.

Figure 59a. Deck drain detail.
Figure 59b. Photograph of deck drains.
(20 on each side of the bridge) are formed holes in the deck without pipe extensions. The drains have drip beads formed around the bottom that allow free discharge below. The drains are outside of the outermost girder.
Step 1: Screen Potential BMP Locations
Floodway and Clearance Requirements
Flood elevations are shown in Figure 58a. The 100-year flood elevation of 779.28 ft is the design flood stage for this project. The road surface at the centerline of the lower end of the bridge is 784.6 ft, meaning the elevation is approximately 784.3 ft at the gutters. With a 0.60 ft thick slab, the bottom of the lowest drains are at an elevation of approximately 783.7 ft, or 4.4 ft from the 100-year flood elevation.
The girders are approximately 3.8 ft thick, meaning the bottom of the lowest girder at its lowest point is at an elevation of approximately 779.9 ft, or 0.6 ft above the 100-year flood elevation. As such, there is not sufficient clearance for water to be piped under the bridge, so each side of the bridge must be treated separately.
Structural Considerations
As described in Chapter 4, piers and girders may have sufficient structural capacity to support BMPs. Abutments (aka “end bents”) would tend to have less structural risk.
Because this is an undivided county road, it is unlikely the edge barriers are designed to at least TL-4 standard. As such, we can assume the edge barriers cannot support a BMP without additional support.
Maintenance Access
BMPs located at the abutments would be relatively close to the ground and may have less fall protection risk than those located over the creek. Otherwise, maintenance would be similar and would likely involve access over the edge of the bridge for any on-bridge location selected.
Capture and Conveyance
Due to the large number of existing deck drains and the inability to modify the existing drainage infrastructure on the bridge deck (e.g., by plugging/removing deck drains and installing consolidated catch basins, etc.), placing a BMP at each inlet is infeasible. Due to the relatively little clearance from high water, it is unclear how far water can be conveyed while still keeping the BMP above high-water level.
Initial Location Screening Results
The earlier discussions rule out edge barriers at locations between bents and rule out any attachment below the bridge, including to piers or girders.
Due to limited clearance below the bridge from high water, it is not possible to route water below the bridge while still keeping the BMP above high-water elevations.
There are two potentially suitable locations that could be explored:
- Attachment to the outside edge of bents or abutments where BMPs could be accessed over the edge of the bridge and potentially supported by the edge barrier.
- Constructing a BMP (multiple types) on land adjacent to the abutments. This would place the BMP below the high-water level, but if it is constructed in the ground, it would have no impact on flood levels or flood conveyance.
For the purpose of this case study, we have assumed a policy decision is made to keep the BMP above the high-water level.
Step 2: Develop Preliminary Design Alternatives
Drainage and Conveyance
The existing drainage paradigm for these bridges is deck drains every 10 ft. The two primary alternatives for this situation, as identified in Chapter 4, are combining the flow via piped connections or via a continuous gutter system. Because the drains are close and numerous and are flush to the bottom of the bridge deck, it makes more sense to use a continuous collection gutter.
To help reduce the BMP weight at individual locations, a tentative decision was made to divide the bridge in the middle and route water to each corner.
For the lower half of the bridge that drains, we can use the existing 1% longitudinal slope of the bridge to our advantage. In this way, the collection gutter can remain very close to the underside of the deck slab, with a small amount of space to allow for overflow and the conveyance gutter itself. If we assume the new conveyance requires 1 foot of vertical space, we still have approximately 4 ft of space between the invert of the conveyance drains and the design water surface elevation.
For the end where the road grade slopes opposite the direction of flow, the gutter will gradually slope in the opposite direction of the bridge deck, departing by about 2.6 ft at the upper end but still maintaining the same 4 ft separation to high-water level (the upper end of the bridge has greater clearance).
Selecting and Sizing the BMP
For this case study, we assume that the prototype BMP described in Chapter 3 will be used. Multiple potential sizing options were evaluated, including sizing to the local design storm, three different sizing options to achieve varying long-term volumetric capture efficiencies (50, 80, and 90 percent), and a separate calculation to provide a 1-year maintenance interval.
The assumed local design storm method was based on the GDOT Drainage Design Manual (GDOT, 2023), which requires the user to calculate the peak rate of discharge for the water quality design storm, which is the 85th percentile rainfall event (1.2 inches in this area). Using the highest possible unit peak discharge allowed by the manual due to the short time of concentration on the bridge, the resulting water quality volume is 835 cu ft, with a peak discharge rate of 0.36 cfs.
Additionally, we consulted the tables with sizing guidelines in Chapter 4, Step 2b, and used values for the Atlanta International Airport (ATL). Table 32 summarizes these potential sizing options as applied to the entire bridge area.
Table 32. Preliminary BMP sizing options for Case Study 3.
| Sizing Criteria | Total Filter Surface Area (sq ft) | Time to Clog (years) | Annual Average Percent Capture (%) |
|---|---|---|---|
| Peak of 1.2” Design Storm | 308 | 4.8 | 99.8 |
| 50% Capture | 27 | 0.4 | 50 |
| 80% Capture | 100 | 1.6 | 80 |
| 90% Capture | 199 | 3.1 | 90 |
| 1-Year Maintenance | 64 | 1.0 | 58 |
Consulting the decision tree provided in Chapter 4, Step 2b, the first step is to determine whether water quality-based sizing or O&M-based sizing is larger. In this case, the controlling factor is the sizing to treat the peak of the 1.2″ design storm. This is much larger than the size needed to achieve a 1-year clogging interval and is quite large. Therefore, the next step is to see if a lower water quality sizing target is reasonable.
Of the three remaining options, the 90 percent capture criterion reduces the annual percent capture over the local design storm by less than 10 percent yet reduces the required filter surface area by 35 percent. The 80 percent capture criterion reduces the required footprint by a further 32 percent but also reduces the average annual percent capture by an additional 10 percent. As a starting point, we will use the 90 percent capture criterion to determine if this can be provided. However, there are valid arguments for using the 80 percent capture criterion over the 90 percent criterion. The use of the 80 percent capture criterion can be revisited if it is determined that using the 90 percent capture criterion is infeasible.
Preliminary Structural Review
As this is a hypothetical case study, structural specifications for the existing bridge were not reviewed. Regardless, the selected location is attachment to a pier, which is assumed to have enough excess load-bearing capacity to support the addition of a BMP. This should be confirmed through thorough detailed structural analysis, accounting for the original design, current condition of the structures, and factors of safety.
Develop Conceptual O&M Approach
Because the waterway is not navigable and the bridge shoulders are narrow, maintenance will require lane closures unless the BMPs can be made accessible from the land next to the bridge near the abutments. The closer to the abutments the BMPs can be placed, the more likely the BMPs may be accessible from land, which is highly desirable from both a safety and logistical perspective.
Integrate Preliminary Design
Based on the previous steps, the following design decisions were made:
- Prototype BMP units as described in Chapter 3
- Convey water with a continuous collection gutter
- BMPs on both sides of the bridge
- Keep BMPs on the outside of the outermost girder
- Place BMPs as close to the abutments as possible
- Minimum BMP bottom elevation of 779.3 ft
- Attempt to size for 90 percent capture of long-term average annual runoff, but reduce to 80% if needed
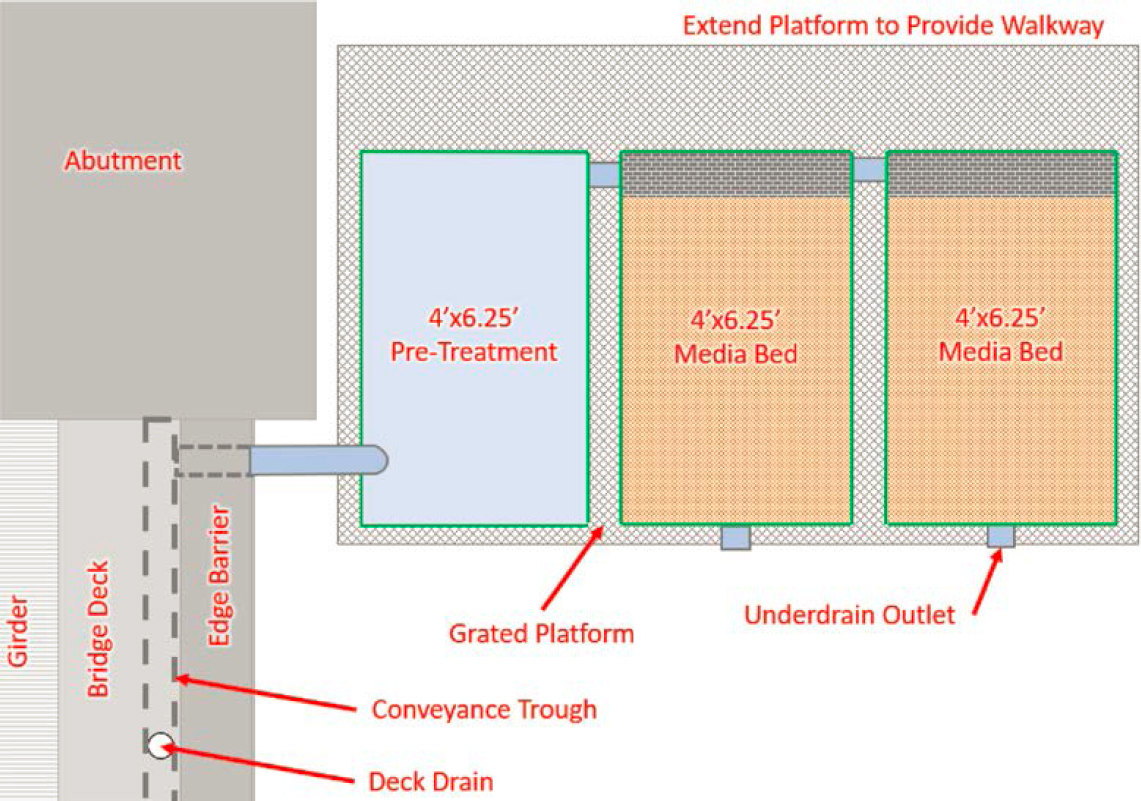
The next decision is to select the conceptual configuration of BMPs and the BMP sizes required to treat each bridge. The drainage routing schematic is shown in Figure 60. The total required footprint for 90% capture is 199 sq ft of media. Each corner of the bridge would need to provide 50 sq ft of media bed. We can start with the assumption that a BMP with separate pre-treatment has 24 sq ft of media surface available (4 ft by 6 ft). Two BMPs at each corner, with separate pre-treatment, would get close enough to this target.
For this case study, we are assuming the BMPs cannot be placed on the ground next to the abutment as the bottom of the abutment is lower than the design flood elevation. However, we can place the BMPs on a grated platform next to the abutment, which is likely to be less complicated than attaching this to the end bent. One end of the platform could be supported by the bent. However, one end will need to be supported by pillars extending to the ground

Figure 60. Conceptual drainage routing for Case Study 3.
surface. As a geotechnical evaluation will already be necessary, we’ll choose to support the platform entirely from the ground, eliminating the need to also perform a structural analysis related to the support of the BMP units. It is assumed the support pillars will be small enough that placing them within the flood plain will not trigger regulatory review, but this will need to be confirmed. A plan and profile schematic of the BMP configuration are provided as Figure 61 and Figure 62, respectively.
From a maintenance perspective, these BMPs could be reached from the side of the bridge deck using a ladder. However, that would require lane closures, and because there is only one lane in each direction, flaggers would need to be used as well. A survey of the existing grade near the abutment and bridge approaches was not readily available to the project team; however,

if possible, a preferred maintenance approach would be to add gravel maintenance roads that lead to each of the four BMP trains from the bridge approaches so maintenance can be performed without disrupting traffic.
Rough Order of Magnitude Capital Cost Estimate
This section presents a rough order of magnitude (ROM) capital cost estimate. Table 33 summarizes major cost components. The total range of costs is estimated to be approximately $900,000 to $2.1 million. The area treated is about 0.20 acres, translating to about $4.5 to $10 million per acre.
Within this cost estimate, the cost of the BMP units and media, including fabrication and delivery, are estimated to be about 13 to 19% of the total cost of the project.
The cost of the collection systems and structural support systems make up an overwhelming part of this cost estimate and account for much of the construction complexity.
Additionally, while this project would treat a small area, there are many fixed costs associated with design that do not scale linearly with project size, particularly for complex projects that require special design features and specifications. As a result, costs for design make up a relatively large portion of the cost estimate in this case.
Rough Order of Magnitude O&M Cost Estimate
Table 34 shows rough estimates for routine O&M activities anticipated to be needed once every two to three years. This assumes it will take two days to complete this maintenance.
Table 35 shows rough cost estimates for more significant rehabilitation cycles in which the full depth of filter media is removed and replaced. This assumes that rehabilitation will require two days to remove the BMPs, four days in the maintenance yard to refurbish the BMPs and two days for reinstall. This could occur approximately every 5 to 10 years.
Table 33. Rough order of magnitude capital cost estimate for Case Study 3.
| Line Item | Units1 | Unit Cost Low | Unit Cost, High | Quantity | Total Cost, Low ($) | Total Cost, High ($) | Assumptions |
|---|---|---|---|---|---|---|---|
| Engineering Design and Planning | |||||||
| Site Survey and Preliminary Bridge Inspections | LS | $20,000 | $50,000 | 1 | $20,000 | $50,000 | |
| Preliminary Design/Feasibility Assessment | LS | $50,000 | $100,000 | 1 | $50,000 | $100,000 | |
| Permitting, Environmental Impact Assessment, and Legal Compliance | LS | $30,000 | $50,000 | 1 | $30,000 | $50,000 | |
| Engineering Design (Civil, Structural, etc.), plans and specs | LS | $150,000 | $300,000 | 1 | $150,000 | $300,000 | |
| Subtotal | $270,000 | $500,000 | |||||
| Materials, Fabrication, and Installation | |||||||
| Boom Truck Rental and Underbridge Platform | Day | $500 | $1,000 | 60 | $30,000 | $60,000 | 90-day construction window. |
| Stormwater Treatment Unit (materials, assembly, delivery, minus media) | EA | $15,000 | $25,000 | 8 | $120,000 | $200,000 | Custom fabricator, relatively small quantity. Reinforcement for lifting. Standard mass-produced fiberglass tanks are 5,000 per RSMeans. |
| Pre-treatment Chamber and Components (materials, assembly, delivery) | EA | $10,000 | $15,000 | 4 | $40,000 | $60,000 | Simpler version. |
| Filtration Media (material, delivery) | CY | $750 | $1,500 | 11 | $8,250 | $16,500 | Based on material unit costs, plus procurement, testing, delivering, and handling. |
| Structural Platforms, including piers and structure, and equipment | EA | $20,000 | $40,000 | 4 | $80,000 | $160,000 | Very rough estimate based on relatively simple access but heavy weight 20k lbs. |
| General Labor for Structure and BMP Installation on Piers | EA | $20,000 | $40,000 | 4 | $80,000 | $160,000 | Four-person crew for construction, two-week duration per unit, prevailing wage |
| Stormwater Conveyance System, e.g., trough, pipe, fittings, appurtenances, brackets, and supports (materials, fabrication, delivery, and installation) | LF | $150 | $300 | 520 | $78,000 | $156,000 | Reinforced fiberglass or metal trench to avoid many fittings. Will require a scaffold to be constructed for construction. |
| Subtotal | $440,000 | $810,000 | |||||
| General Construction Requirements | |||||||
| Mobilization/Demobilization (2-5% of construction costs) | LS | $8,000 | $40,000 | 1 | $8,000 | $40,000 | |
| Environmental Monitoring/Protection During Construction (1-2% of construction costs) | LS | $4,000 | $16,000 | 1 | $4,000 | $16,000 | |
| Health and Safety Management/Oversight (1-2% of construction costs) | LS | $4,000 | $16,000 | 1 | $4,000 | $16,000 | |
| Material Inspection and Quality Control (2-5% of material costs) | LS | $8,000 | $40,000 | 1 | $8,000 | $40,000 | |
| Traffic Control (local bridge) | Day | $500 | $1,000 | 30 | $15,000 | $30,000 | |
| Temporary Power and Facilities, Construction Tools/Equipment, Stockpiling, etc. (2-5% of construction costs) | LS | $8,000 | $40,000 | 1 | $8,000 | $40,000 | |
| Subtotal | $50,000 | $180,000 | |||||
| Design and Construction Subtotal | $760,000 | $1,510,000 | |||||
| Line Item | Units1 | Unit Cost Low | Unit Cost, High | Quantity | Total Cost, Low ($) | Total Cost, High ($) | Assumptions |
|---|---|---|---|---|---|---|---|
| Overhead | |||||||
| Construction Management and Overhead, Insurance, and Bonding (10%) | $76,000 | $151,000 | 1 | $76,000 | $151,000 | ||
| Contractor Oversight (2.5%) | $19,000 | $37,750 | 1 | $19,000 | $37,750 | ||
| Construction Contingency (25%) | $190,000 | $377,500 | 1 | $190,000 | $377,500 | ||
| Overhead Subtotal | $290,000 | $570,000 | |||||
| Opinion of Total Probable Costs | $1,100,000 | $2,100,000 | |||||
1Unit definitions: LS: lump sum, EA: each, CY: cubic yard, LF: linear foot
Table 34. Rough order of magnitude routine O&M cost for Case Study 3.
| O&M Cost | Units | Unit Cost | Quantity | Total |
|---|---|---|---|---|
| Vacuum operation and disposal | Day | $3,000 | 2 | $6,000 |
| Hand Labor (two-person crew) | Day | $1,800 | 2 | $3,600 |
| Materials and Disposal for Each BMP | EA | $750 | 4 | $3,000 |
| Traffic Safety | Day | $1,000 | 2 | $2,000 |
| Sum | $14,600 |
Table 35. Rough order of magnitude system rehabilitation costs for Case Study 3.
| O&M Cost | Units | Unit Cost | Quantity | Total |
|---|---|---|---|---|
| Hoist Truck and Flatbed with Operator | Day | $2,000 | 4 | $8,000 |
| Hand Labor (two-person crew) | Day | $1,800 | 4 | $7,200 |
| Materials and Disposal for All BMPs | LS | $15,000 | 1 | $15,000 |
| Traffic Safety | Day | $1,000 | 4 | $4,000 |
| System Rehabilitation (two-person crew, half day) | EA | $1,800 | 4 | $7,200 |
| Sum | $41,400 |
Steps 3 and 4: Evaluate Design Alternatives and Identify Additional Considerations
The options for treatment on this bridge are severely constrained by the proximity of the design flood elevation to the bottom of the girders. Treatment at the abutments is likely the only option. However, other configurations beyond what was presented here are possible.
If the platform supports cannot be within the flood plain, attachment directly to the abutment could be considered. In such a case, the percent capture criterion should be revisited, as using an 80% capture standard over a 90% capture standard would eliminate an entire media unit at each corner of the bridge, which would be beneficial from a structural support standpoint.
Another potential option would be to further investigate the existing grades surrounding the abutment and approaches. It may be possible to place the BMPs further back towards the approaches and sink them into the ground surface so the top of the BMPs is at- or nearly at-grade. This would require a thorough geotechnical evaluation but could potentially be done without triggering floodplain issues.
Overall, the main concern with this approach is the exceptional cost for relatively little water quality benefit provided. The level of investigation and design required to implement treatment is highly disproportionate to the 0.2 acres of land area treated. Additionally, there are significant construction challenges associated with installing a capture and conveyance system below the bridge.
Finally, except when the creek is at flood stage, much of the bridge drains to grassy areas below the bridge, which naturally provide filtration and pollutant removal. The incremental water quality benefit of providing treatment here is very minor.
Case Study 4: Molise Viaduct, Italy (Actual Design)
Overview of Case Study Relevance
Stormwater BMPs are being designed for both spill containment and stormwater treatment on a long bridge over a water supply reservoir in Italy. This is part of a larger project to rehabilitate the bridge. This example is not directly transferrable to US bridges. However, it does contain some relevant information, including:
- Drivers that resulted in the decision to mount BMPs below the bridge deck and perform maintenance by boat
- Capture and conveyance options used to capture water from distributed discharge points
- Structural mounting approach
- Design features to support boat-based maintenance without heavy equipment
- Available construction cost estimates
The stormwater system retrofits were driven primarily by spill containment to protect a drinking water reservoir and included innovative features to accomplish this goal. It should be noted that NCHRP Report 778 found that containment of spills is not a necessary design objective for bridges in the United States (Taylor et al. 2014a). Therefore, this part of the case study would only be of potential relevance in extenuating circumstances with stringent source water protection requirements.
Project Setting
The primary objective of the proposed project is to provide spill containment and stormwater filtration. This case study presents a summary of the proposed design for the retrofit installation of proprietary on-bridge stormwater treatment and spill containment structural best management practices (referred to generally as BMPs) on the Molise Viaduct over Lake Guardialfiera in the Molise region of Italy (Figure 63 and Figure 64). The bridge is also referred to as the Lçiscion Bridge in some literature and on some maps shown in this case study. The construction of the bridge covered the period from 1966 to 1974. The project to retrofit the bridge with stormwater treatment and spill containment is in the final planning/design phases, with construction expected to happen between 2025 and 2026. The design firm for the project and developer of the proprietary treatment and containment BMPs is the Italian consulting firm Stormwater Italia Group (SWI Group Srl), which is based out of Venice, Italy.

Figure 63. Vicinity and location map for the Molise Viaduct over Guardialfiera Lake.
Environmental Setting
The Molise Viaduct crosses over Lake Guardialfiera, an artificial reservoir that was created by the construction of the Ponte Lçiscion Dam across the Biferno River between 1967 and 1973. The dam was originally constructed to retain flood flows and store water for irrigation purposes in the surrounding region (see Figure 64). Recently, the reservoir has been used as a drinking water source for the entire Molise region. Additionally, the entire reservoir area is protected
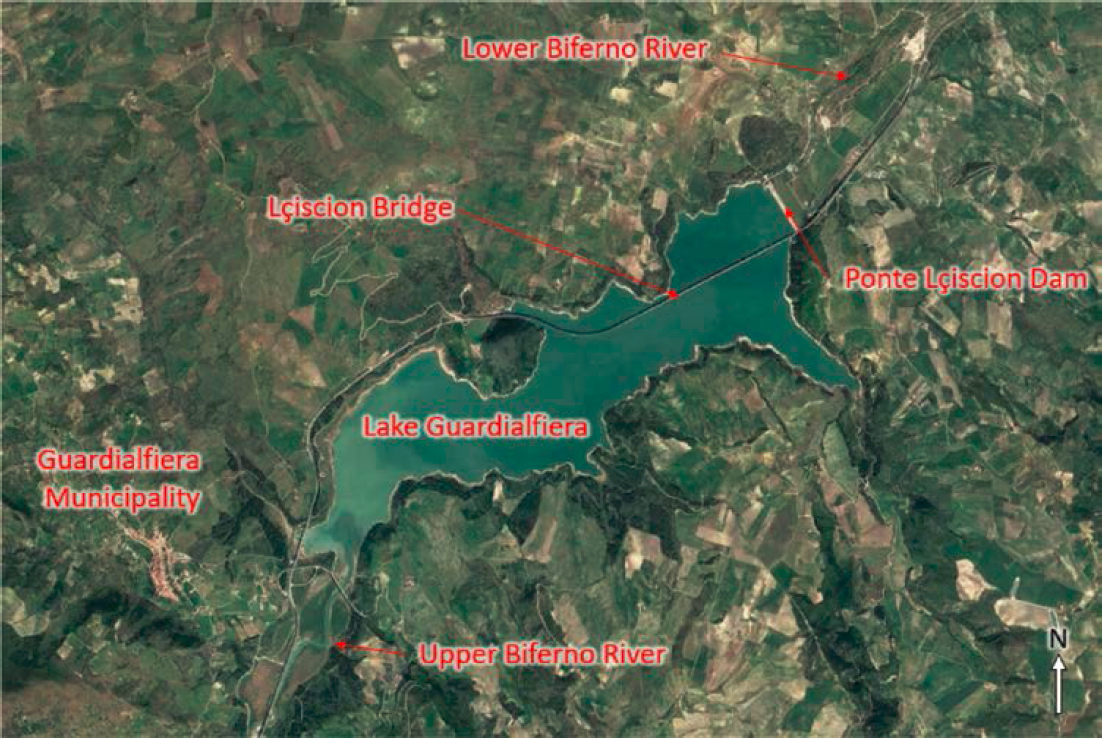
Figure 64. Key vicinity features for the Molise Viaduct over Guardialfiera Lake.
under various environmental regulations in Italy. Protection of the reservoir’s water quality is thus critical and is the motivation for the proposed installation of stormwater treatment and spill containment BMPs on the Molise Viaduct.
Precipitation patterns in Italy are characteristic of a Mediterranean climate. The wetter months of the year in this part of Italy are from roughly September through May, although it rains year-round. The average annual precipitation is approximately 17 inches. The wettest month of the year is November, with an average precipitation of 2.3 inches.
Bridge Setting
The highway is a major east-west highway connecting the central part of Italy to the eastern coast. The Molise Viaduct (Figure 65) carries the highway along the longitudinal axis of the reservoir between Guardialfiera Municipality and the Ponte Lçiscion Dam. The bridge is divided into three different segments separated by on-land sections of roadway. The structural design of the bridge appears to be similar for the different sections. Only two of the sections pass over the open water of the reservoir, with the other section of the bridge running parallel to the upper
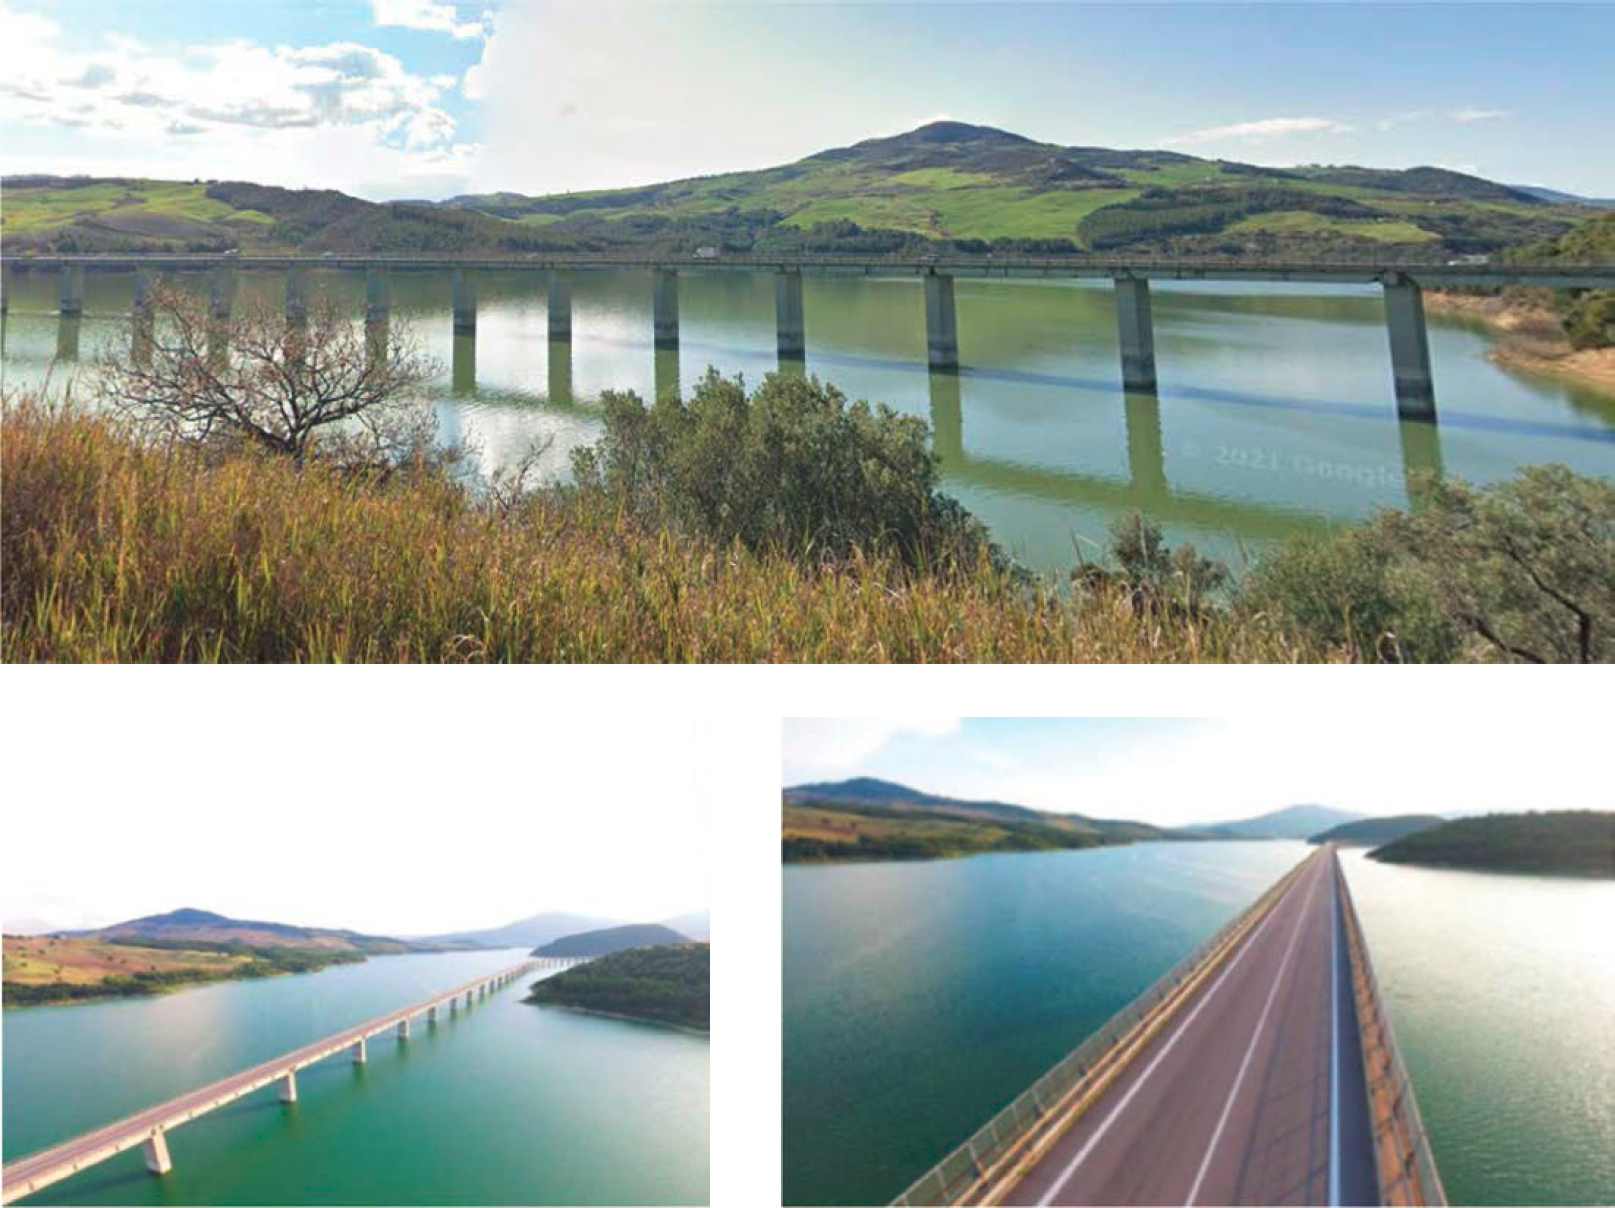
Figure 65. Photographs of the Molise Viaduct.
Biferno River upstream of the reservoir. This project encompasses the installation of BMPs on the sections of the bridge that directly pass over Guardialfiera Lake.
Regulatory Setting
In Italy, stormwater management has been regulated since 1986, but government action has only recently begun to enforce these regulations with increased scrutiny of the environmental impacts of highway runoff. The installation of stormwater runoff management systems is now mandatory for new infrastructure. For new construction (including new bridges), approximately 91% of the average annual stormwater runoff volume would need to be captured and treated. However, this project is not subject to those requirements because it is a retrofit project. This project is primarily driven by drinking water protection goals. The goal of this project was to provide sufficient stormwater treatment capacity to the maximum extent feasible based on the existing conditions of the bridge and the need to install spill containment facilities.
Characterization of Existing Conditions
Basic Bridge Characteristics and Structural Configuration
The main defining factor is that the bridge is very long and relatively flat. Routing runoff to shore would be expensive due to the need for large conveyance piping (at a minimum, a one-mile pipe would be needed) or potentially infeasible due to the pipe slope needed to convey water. Therefore, it was concluded that on-bridge installations would be more feasible and economically efficient.
The bridge is supported by vertical concrete piers (Figure 66) that consist of either one large vertical column that spans the entire bridge superstructure or two to four smaller columns on either side of the bridge (the arrangement differs along the length of the bridge). The bridge is located approximately 20 to 50 meters (65 to 165 ft) above the water surface of the lake, which regularly fluctuates (typically with seasons). The edge barrier differs along different sections of the bridge but generally consists of a short concrete curb and a metal guard rail.
Existing Bridge Drainage
The crown of the roadway divides runoff to both sides of the bridge. The existing drainage infrastructure differs along different sections of the bridge. On some sections of the bridge,
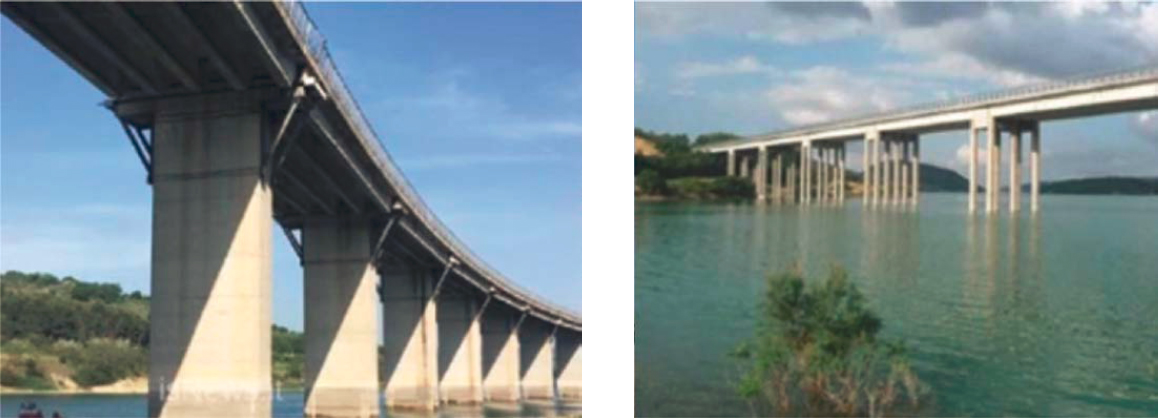
Figure 66. Concrete piers supporting the superstructure of the Molise Viaduct.
runoff is managed by catch basin inlets, and on other sections, runoff is managed by small, circular side drains through the concrete curb spaced approximately every 15 ft. Currently, runoff from all areas of the bridge deck is freely discharged with no treatment to the reservoir below.
Proposed On-Bridge Retrofits
Screening and Selection of BMP Locations
Early in the design process, the SWI Group design team determined that the only viable BMP mounting location was on the piers. Construction and maintenance will be achieved by boat.
The key factors that led to this conclusion were:
- This highway is a major regional transportation corridor without reasonable detour options. The existence of only two lanes of travel on the bridge would greatly interrupt traffic, making lane closures for construction or maintenance from the bridge deck very undesirable. However, protection of the water source is mandatory.
- Bridge piers provide suitable structural strength to tolerate the additional load. The bridge is now over 50 years old, and it is questionable whether edge barriers would support added weight regardless of whether lane closures are allowed.
Selection of BMP Type
It is infeasible to provide both spill containment and treatment in a single system without having active control. Therefore, a remote monitoring and actuation system was the primary option to meet project goals.
The basic concept behind the proposed proprietary T&C BMP device is to provide a single, dual-function unit that can perform both treatment and containment functions and can be affixed to the concrete piers of the bridge superstructure. Stormwater runoff or spilled substances will be routed through new piping from catch basins on the bridge deck to the BMP. The proprietary device uses a real-time monitoring and control system (SWI Group’s SWERM® system) to differentiate between normal stormwater runoff and spilled hazardous substances and to route the influent stream to the appropriate treatment or containment system.
A diagram of the proposed system is provided in Figure 67. The basic configuration of the BMP system includes the following features:
- Real-time monitoring devices to differentiate between normal stormwater runoff and spilled hazardous substances.
- Real-time hydraulic control equipment to route the runoff or spilled substances to the appropriate treatment or containment device.
- Additional monitoring and communication instruments to assist in ongoing operations and maintenance of the system.
Capture and Conveyance System
New capture and conveyance infrastructure is proposed to be installed to route stormwater runoff and any spills from the bridge deck to the proposed treatment/containment system attached to the bridge piers (Figure 68). This will include the installation of new piping to connect to existing drainage points and concentrate runoff to bridge piers, where vertical piping will convey water to the T&C BMP. New inlets are being installed as part of the overall bridge modifications. New plastic conveyance piping connected to the catch basins will be suspended on both sides of the bridge under the bridge deck. The piping from both sides of the bridge will combine at a vertical T junction before connecting to the BMPs. The new piping will combine flows from several catch basins to a common BMP.

Figure 67. Conceptual overview of the proposed on-bridge treatment and control BMP device.

Figure 68. Conceptual overview of the proposed T&C BMP and associated conveyance piping.
The T&C BMPs will be distributed such that the bridge deck drainage area to each BMP is approximately 0.5 acres; as such, the proposed design calls for the installation of 21 T&C BMPs to be installed on the bridge. Each unit serves about 1,200 linear ft of roadway.
In order to prevent the release of hazardous substances, the conveyance piping will be watertight to prevent exfiltration. Additionally, the entire pipe network will be hydraulically connected such that, during a spill event, if one system is closed by a valve, filled to capacity, blocked, or otherwise unable to accept flow, the spilled substance or stormwater will back up the piping and flow to another system for additional containment.
Details of BMP Design
The device includes an upper chamber for the stormwater treatment system and a lower chamber for the spill containment tank. The dimensions of the rectangular device are 7.1 ft long by 4.4 ft wide and 5.6 ft tall. The device is split at mid-height to form a top and bottom chamber (Figure 69).
The storage capacity of the containment tank for emergency spills is approximately 90 cu ft plus additional capacity in the collection pipes.
The upper chamber consists of a series of media compartments or bays in which media can be placed inside modular cartridges. Flow through the media is horizontal. The direction of flow can be switched to help preserve the life of the filter. The surface area of the media in the direction of flow is approximately 12 sq ft. The filter media includes a blend of perlite, zeolite, and granular activated carbon. It supports a treatment flowrate capacity of approximately 320 gpm, translating to a media flow rate of about 26 gpm per sq ft (2,500 in/h). BMP systems are designed to treat runoff from about 1.2 inches per hour of rainfall. Therefore, systems of this size can treat up to about 0.55 acres of roadway runoff.
Structural Approach for On-Bridge BMPs
For the reasons introduced earlier, the BMP will be attached to the concrete piers of the bridge superstructure. The device will rest on a metal support frame that will either be affixed
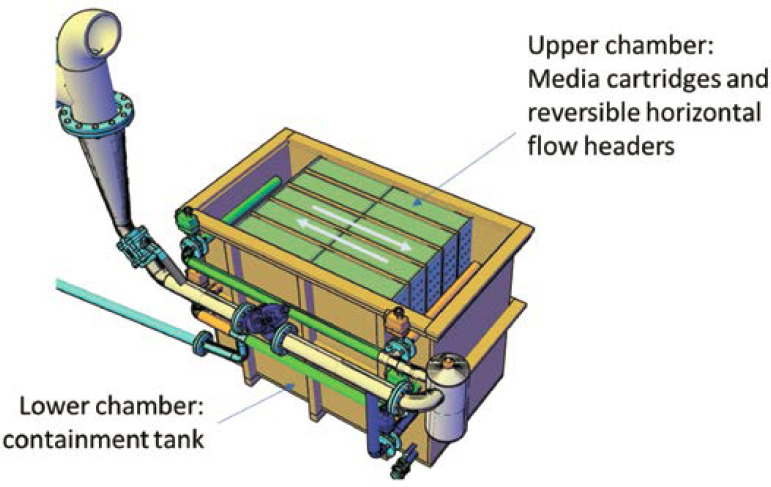
Figure 69. Treatment and containment vessels of SWI Group’s proprietary device.
to the side of the concrete pier (on sections of the bridge with only one column) or will span the distance between two or four smaller piers on opposite sides of the bridge deck (on sections where piers are comprised of multiple smaller columns). The frame will also support a metal grate walkway with side railings for safety and other equipment/infrastructure associated with the BMP. The structural frame and attachment to the bridge piers will be designed by a structural engineer and will account for both full dead load conditions when the containment tank and piping network are filled to capacity.
The research team has performed approximate calculations to estimate the design weight of each unit, inclusive of structure, media, and spill containment (assuming all are fully saturated), which is reported in Table 36.
Capital Cost Estimates
The total capital cost for materials/equipment, fabrication, and construction/installation of the BMPs is estimated to be approximately $155,000 U.S. dollars per unit (2023 dollars). There are
Table 36. Estimated design weight of individual BMPs.
| Component | Approximate Weight, lbs | Assumptions |
|---|---|---|
| Saturated Media and Full Spill Containment Chamber | 11,000 lbs | Assumed density of water. Media is lighter than water, so it may have a slightly lower saturated unit weight. |
| Box Structure | 500 to 2,500 | Assuming range between reinforced HDPE and 3/8” steel. |
| Structural Frame | 2,500 | Rough estimate. |
| Maintenance Personnel | 500 | Assume two people may access the structure for maintenance. |
| Piping | 20,000 to 30,000 | Assume range between plastic pipe and ductile iron pipe, assuming 1,200 linear foot pipe run for each BMP and pipe filled with water. |
| Estimated Point Load of BMP | 15,000 to 17,000 | At the piers supporting the BMP. |
| Estimated Total Extra Load on Bridge Segment, including piping | 30,000 to 40,000 | Spread over 1,200 ft. |
Note: Weight estimates calculated by the research team based on dimensions provided by SWI Group. This is not an official design estimation.
21 units proposed, and the total project cost is estimated to be approximately $3,400,000 including the engineering design costs and piping costs. This translates to approximately $340,000 per acre of bridge runoff treated for only the BMP units and peripherals (see Table 37). The research team has not attempted to translate costs to US labor and material rates; however, it is likely that the cost of a similar DOT project in the US would be considerably higher.
In addition to these costs, some installation and maintenance activities will be performed by the local civil works department that operates and maintains the bridge. The civil works department is responsible for installing collection and conveyance features, which would involve approximately 3 miles of piping and connections. This would add additional costs not shown. Additionally, the bridge will be closed for rehabilitation work, so there are some savings in construction costs.
Operations and Maintenance
Monitoring and Inspection
SWI Group has developed a digitalized scheduling and reporting system based on interpretation of sensor signals to assist with ongoing operations and maintenance of the T&C BMPs. Additionally, the use of sophisticated instruments and control equipment requires additional ongoing maintenance to ensure proper functionality of the system. This includes regular inspection and cleaning of the water quality sensors and valves.
To manage the BMPs and associated sensors and control equipment, SWI Group has developed maintenance management software that can be interfaced with a supervisory control and data acquisition (SCADA) system and is available in a smartphone app for increased accessibility. This software includes the following features:
- Technical checklist for each BMP.
- Detailed record keeping of maintenance events.
- Regular scheduling of inspection and maintenance activities.
- Software to document the inspections, including a database with photographic reports.
Maintenance of the BMPs includes both regular, ongoing (i.e., scheduled) maintenance, as well as automatically triggered maintenance requirements in the event of instrumentation failures or spills of hazardous substances.
Table 37. Estimated capital costs for design and installation of the T&C BMPs for the Molise Viaduct.
| Major Cost Item | Total Cost (USD), full bridge |
|---|---|
| Engineering and Product Development | $150,000 |
| Materials and Fabrication of T&C BMPs (base without instrumentation) | $1,250,000 |
| Instrumentation of T&C BMPs | $1,250,000 |
| Installation and Commissioning of T&C BMPs | $300,000 |
| Local Conveyance System Materials and Installation (does not include new inlets and piping along the bridge) | $300,000 |
| Additional Capital Costs | $150,000 |
| Total Capital Cost, full bridge | $3,400,000* |
*Engineer’s estimate for services to be provided by SWI Group. Additional labor and equipment are to be provided by the local civil works department.
Maintenance Access and Activities
As introduced earlier, maintenance is proposed to occur from the underside of the bridge. To achieve this, each BMP structure will be installed with a ladder from the base of the pier and a crane/pulley system to raise and lower heavy equipment. Figure 70 shows an illustration of maintenance access features.
Assuming media is divided between ten removable cartridges, the weight of each cartridge when dry is about 230 lbs.
For areas of the bridge over land or over areas of the reservoir that recede during portions of the year, the BMPs can be accessed by overland vehicles or on foot. During portions of the year with high water levels and for BMPs attached to the bridge over areas of the reservoir that are continuously inundated with water, the BMPs will be accessed by boat.
The SWI Group design team estimates the following O&M effort will be needed for the stormwater treatment compartment:
- Every six months.
- Maintenance carried out by two operators: site visit, visual inspection of the equipment, and sensor calibration (costs are mostly due to labor). We estimate 30 minutes for each system, 1 hour for moving between the bridge piers, totaling about 60 personhours and four days of boat usage.
- Every 24 months.
- Disposal of exhausted filter media, refilling with new filter media. Each system has a small crane to move heavy loads. In this phase, an electric boat could be used. The time requirements are to be determined. This would require about 1 cu yd of media per unit or about 20 cu yd of media overall. Media would be transported in bags small enough for a person to carry. The research team has not independently evaluated this lifespan estimate.
In the event of a spill of hazardous substances, the owner/operator of the BMPs will be notified by the electronic software system. This will trigger the need for immediate maintenance and emptying of the containment tanks so as to ensure adequate storage capacity is available as quickly as possible in the event of further spills. A vacuum truck will be used to empty the tank, which will access the containment tanks from the bridge deck using extendable hoses. Based on

the capacity of the vacuum trucks and the size of the tanks, emptying of each BMP can occur in less than 30 minutes, minimizing potential impacts to bridge operations.
Summary of Transferrable Case Study Findings
As discussed at the beginning of this case study, the primary project objective of spill containment has limited transferability to DOT bridges in the US. Additionally, performing routine O&M work from the water would be well outside of typical DOT maintenance practices and is likely a fatal flaw in the US. However, within this case study, there are several concepts or solutions that could help serve as a reference for design teams:
- In the event of extenuating circumstances where BMPs need to be placed in a location that can only be accessed by water, this example shows how built-in O&M equipment can help make maintenance activities manageable without a barge and barge-mounted crane. For example, access ladders, a platform, and a small permanently installed crane or hoist.
- This case study illustrates the potential role of remote monitoring to be used to detect maintenance needs. This could help optimize maintenance intervals without on-bridge inspections.
- This provides a worked example of the very high costs of on-bridge retrofits. If translated to US construction costs and if not supported by additional work by the bridge civil works department as part of the overall rehabilitation projects, it is possible that costs could exceed $20M for a similar project in the US, and perhaps much more if this was not performed in coordination with the reconstruction of the bridge.
Case Study 5: Broadway Bridge, Multnomah County (Completed Project)
Case Study Relevance
This case study focuses on stormwater treatment retrofits installed on the Broadway Bridge in Portland, Oregon. Stormwater retrofits were installed in the early 2000s, and some information has been lost to time or could not be readily obtained. For example, the research team was able to obtain relatively little information about the overall design process, decisions regarding design development, and construction costs. However, the existing design is well described, and systems are still being operated and maintained by Multnomah County on an ongoing basis. Therefore, this case study focuses on the systems that were constructed and the O&M that is required.
While the setting may be relatively uncommon for DOT bridge projects, relevant aspects of this case study include:
- Example of how BMPs were incorporated into an existing bridge
- The potential role of very compact proprietary BMPs in a bridge stormwater treatment plan
- Illustration of the conditions that made it feasible to locate BMPs within the bridge deck
- Choices of construction materials
- Method of structural reinforcement
- O&M requirements
The Burnside Bridge was also retrofitted with stormwater controls around the same time following a similar approach. For brevity and simplicity, this case study focused on the Broadway Bridge.
Project Setting and Site Characterization
Broadway Bridge was originally constructed in 1913 and is owned by Multnomah County. The bridge is a metal truss drawbridge with a twin-leaf bascule design. It supports four lanes of
vehicular traffic, inclusive of streetcar tracks, plus separate bike/pedestrian paths on the outside of the truss. The total span is about 1,600 ft, including about 900 over water. The bridge has a 270 ft bascule center span that opens as twin leaves for ship traffic. The bridge is about 70 ft wide and has 90 ft of clearance from the normal river level. In 2019, the bridge supported around 30,000 vehicles per day, which was a primary route to downtown Portland, including a primary connection between downtown and Interstate 5.
Figure 71 shows the general location and proximity of these bridges. Figure 72 includes a collection of photographs illustrating the bridge context.
Stormwater Retrofit Project Elements
Stormwater treatment retrofits were designed by Multnomah County in partnership with Oregon DOT and implemented in the early 2000s as part of a larger project to refurbish the bridge. The project results in construction of 12 new catch basins, two new access manholes, and ten custom Stormwater Management™ StormFilter® units to capture and treat stormwater.
Drainage Patterns and Stormwater Capture
New catch basins were installed at 12 locations along the bridge, aligned with piers. These catch basins collect water from the curb line of the bridge. The spacing between inlets is about
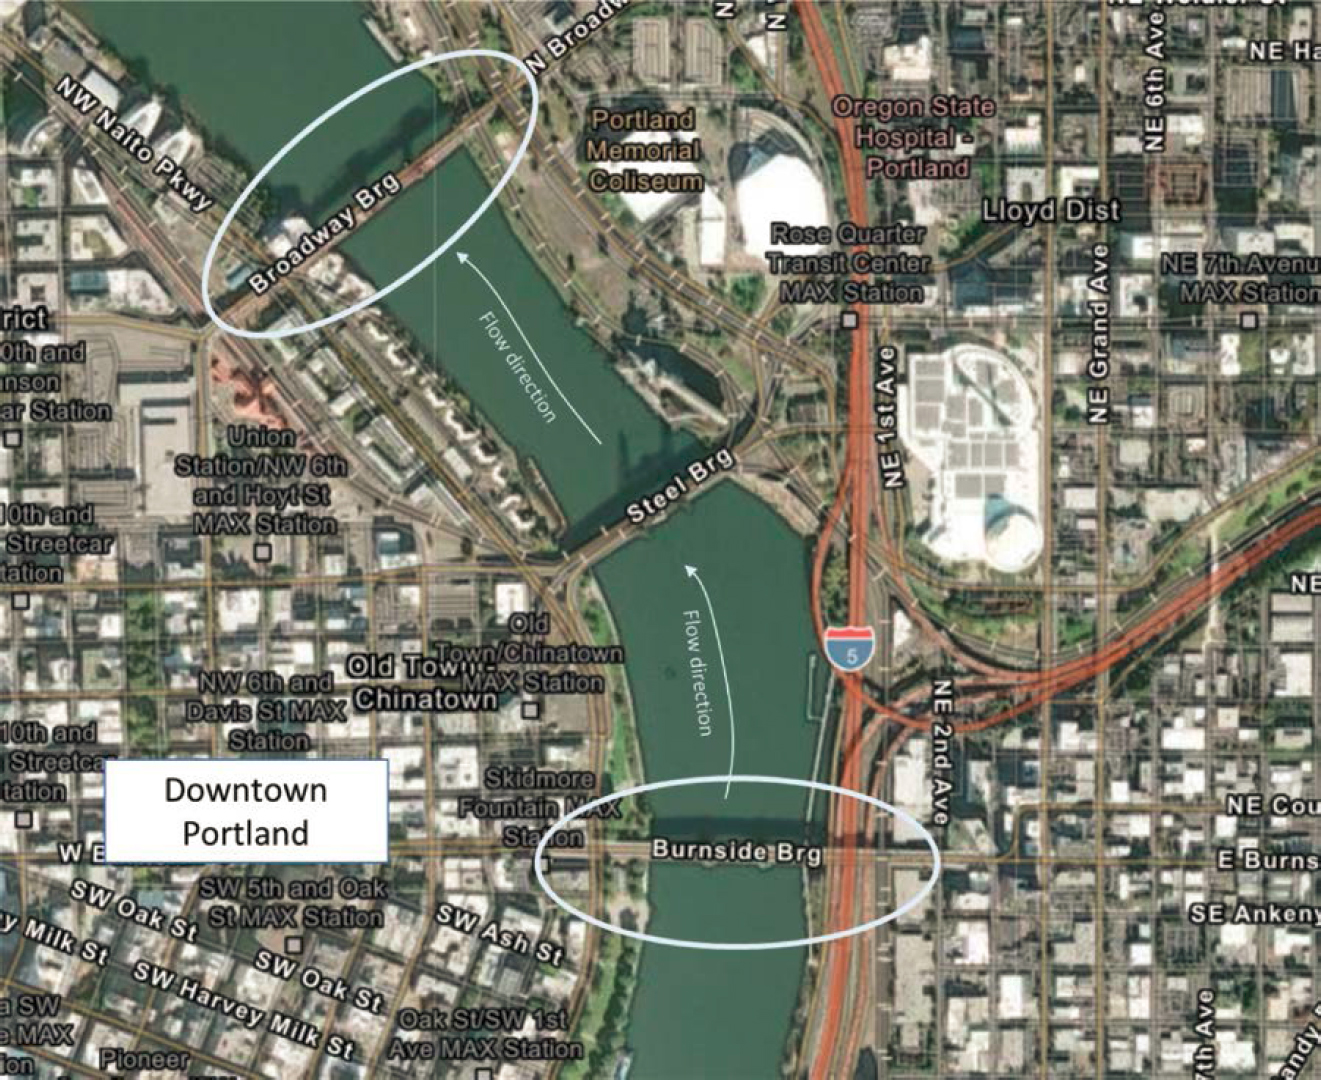
Figure 71. Vicinity and location of Broadway and Burnside Bridges.

250 ft, and the typical drainage area is about 8,000 to 10,000 sq ft. This assumes water flows laterally across streetcar tracks. In practice, some water is likely channeled in streetcar tracks and flows longitudinally off the bridge in smaller storms. Figure 73 shows the general site layout, catch basin locations, and flow directions.
BMP Design
The BMPs used for the project are StormFilter® cartridge media filters housed in custom metal boxes and grates. At the time of the project, this product was supplied by Stormwater Management, Inc. This proprietary product is currently supplied by Contech Engineered Solutions.
For the eight locations that are not adjacent to the bascule drawbridge span, the StormFilter® cartridges are housed in custom catch basins and are located directly in the curb line receiving direct runoff. Catch basin dimensions are approximately 2′5″ by 4′9″. Fiberglass piping was used to convey the BMP discharge points down the bridge piers.
Figure 74 shows an example of a custom design and Figure 75 shows examples of constructed units.

Figure 73. Site layout, drainage features, and drainage areas.

Figure 74. Design details of StormFilter® units in custom catch basins.

Figure 75. Photographs of StormFilter® units in custom catch basins.
For four locations that abut the bascule drawbridge segment, an alternative design was used, including a traditional catch basin in the gutter line with fiberglass pipes conveying water below the bridge to a StormFilter® cartridge box below the bridge deck on the top of the pier. This space is accessed via a hatch outside of the travel lanes. This alternative design allows the catch basins and piping to rotate with the lifting of the bridge while allowing the StormFilter® units to remain fixed to the top of the pier.
Figure 76 shows design details and Figure 77 shows pictures of the constructed system and O&M access features.
Structural Elements
The BMPs themselves have an estimated dry weight of 650 lbs per manufacture design drawings. If internal space were to be fully loaded with saturated sediment, this could add more than 3,000 lbs. However, this has not been observed to occur. The catch basins are HS-20 rated for a vehicle load of 20,000 lbs.
The design called for saw cutting through the entire concrete slab to create the openings for the manholes and catch basins. The design included provisions for mitigating impacts to the structural capacity of the slab, including:
- Requirements to retain existing rebar as part of saw cuts in order to strengthen the interface between existing and new sections.
- Full reconstruction of the curb line for the entire bridge to enable continuous reinforcement on the curbside of the catch basins.
- Addition of new steel support beams extending between the metal girder with studs embedded into the newly poured concrete around the catch basin.
- Structural steel catch basins with HS-20 load rating.
Figure 78 and Figure 79 show an example of the new lateral steel support beams, which were constructed on either side of the new catch basins to provide four sides of support.
Figure 80 shows an example of the saw cut and reconstruction sequence for catch basins.
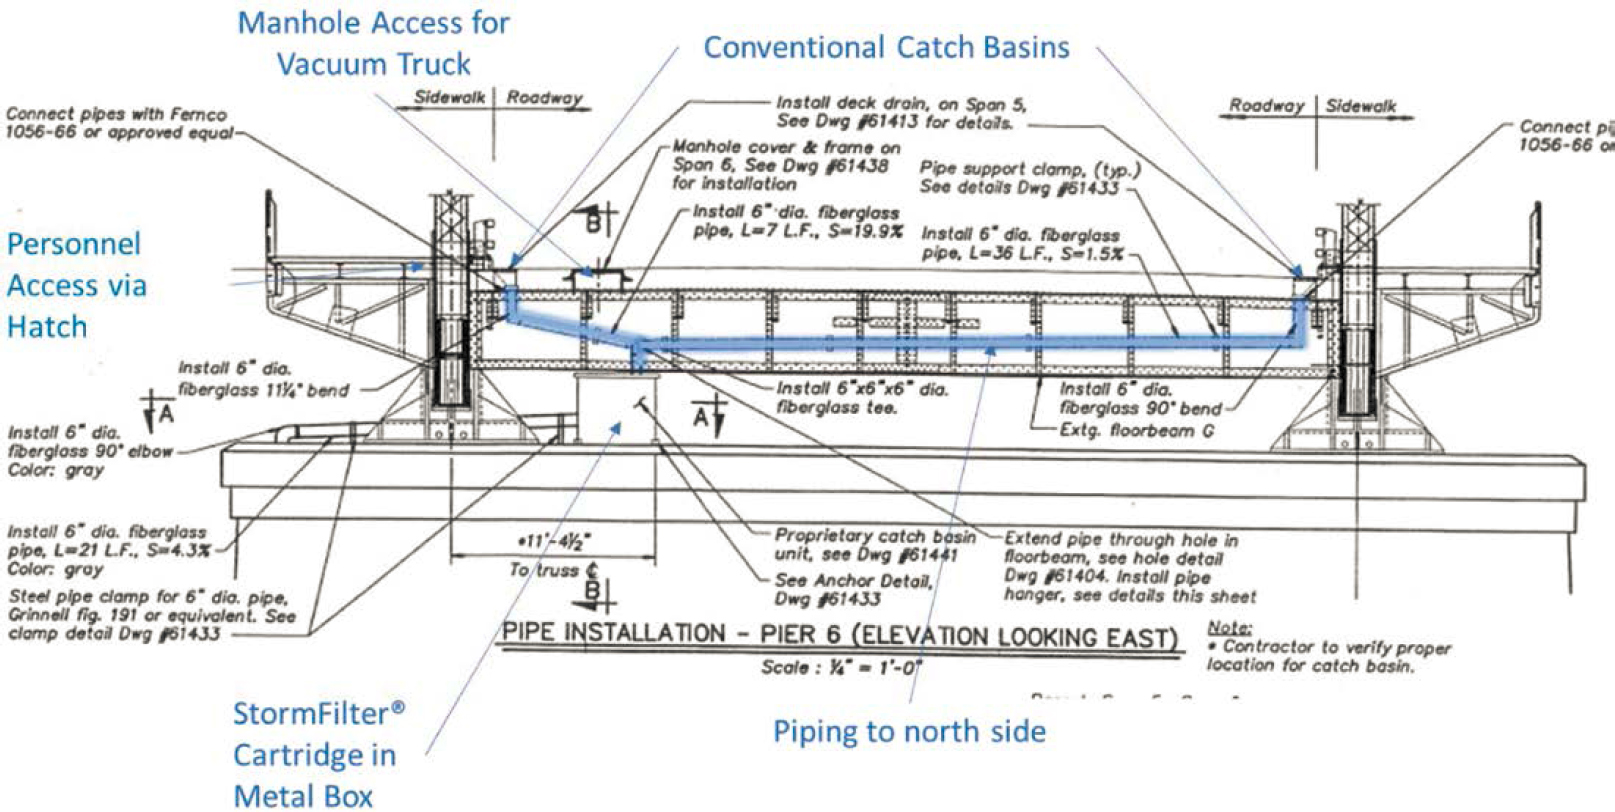
Figure 76. Design details of StormFilter® units below the bridge deck.
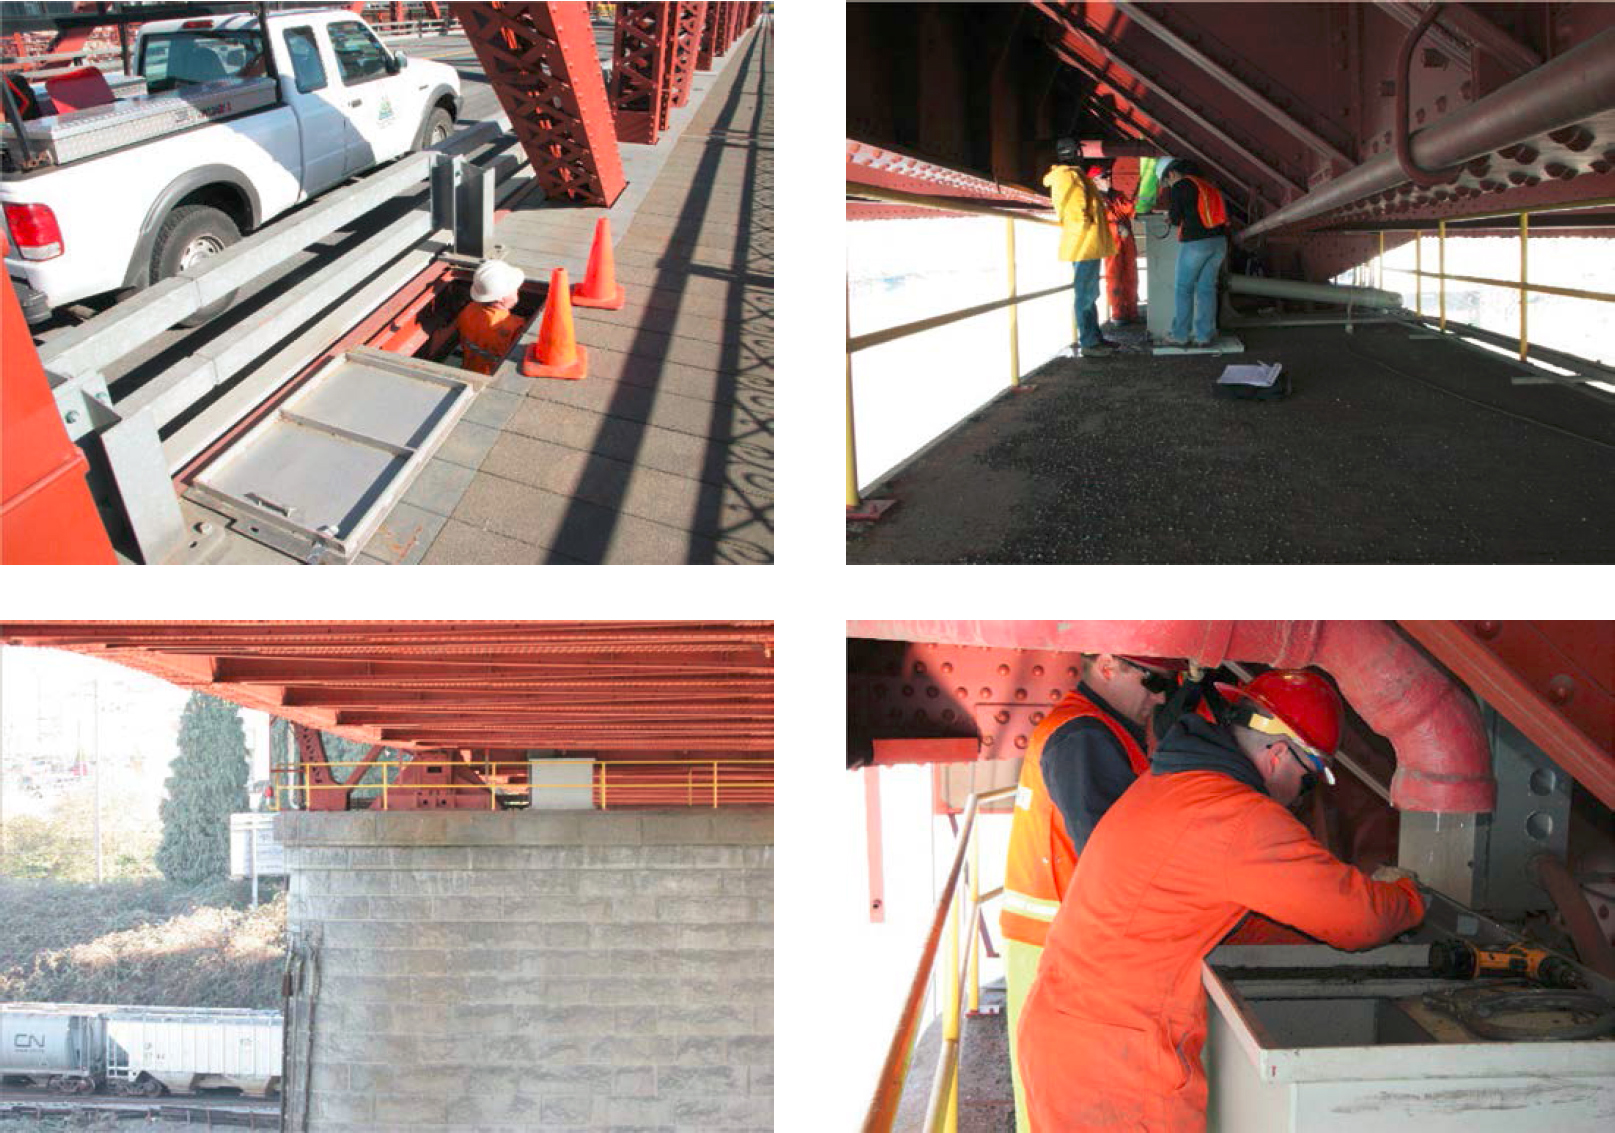
Figure 77. Example photographs of StormFilter® units below the bridge deck, including maintenance access features.

Figure 78. Example detail of added steel support beams.
Approximate Runoff Capture Estimates
Each 18-inch tall StormFilter® cartridge has the capacity to treat about 7.5 gpm (0.017 cfs) based on current TAPE approvals for zeolite-perlite-granular activated carbon (ZPG) media. Assuming an average drainage area of about 8,000 sq ft and a runoff coefficient of 0.9, this flow rate translates to a precipitation intensity of 0.10 in/h. Consulting the sizing tables in Chapter 4, Step 2b, this translates to the treatment of about 60 percent of long-term runoff volume.
Actual sizing calculations could not be obtained. It is possible that StormFilter® systems had a higher rated capacity when the project was constructed. It is also possible that a higher sizing flow rate was initially targeted, but a compromise was needed to limit the size of penetrations within the bridge deck.
O&M Protocols and Observations
Per input from Multnomah County maintenance personnel, the BMPs have been maintained on a two-year interval, including cleaning the systems using a vacuum truck and replacing the


Figure 80. Example of removal and construction sequence with saw cuts to preserve existing rebar.
StormFilter® cartridges. Currently, the County has a maintenance contract with a private company to perform cleaning and replacement.
Each maintenance event costs about $4,000, including disposal, plus about $2,400 for replacement cartridges. Cleaning and replacement may be triggered more frequently than the two-year interval if backups are noted. However, the County has not observed a reason to change the two-year interval. This is an urban area with limited sources of sediment or windblown dust.
Maintenance events require the closure of one lane and are normally done during off-hour times. Figure 81 shows a maintenance event occurring for the BMPs located in catch basins. Earlier photos (Figure 77) show maintenance occurring for BMPs mounted below the bridge deck. Both sets of pictures were taken before maintenance was contracted out. Figure 81 shows an example of the material accumulation in the pre-treatment chamber.
Discussion of Transferability
This case study presents a rare case of BMPs constructed within the bridge environment. This shows how the unique opportunities and constraints within a bridge guided the design and supported a system that was feasible to construct and maintain.
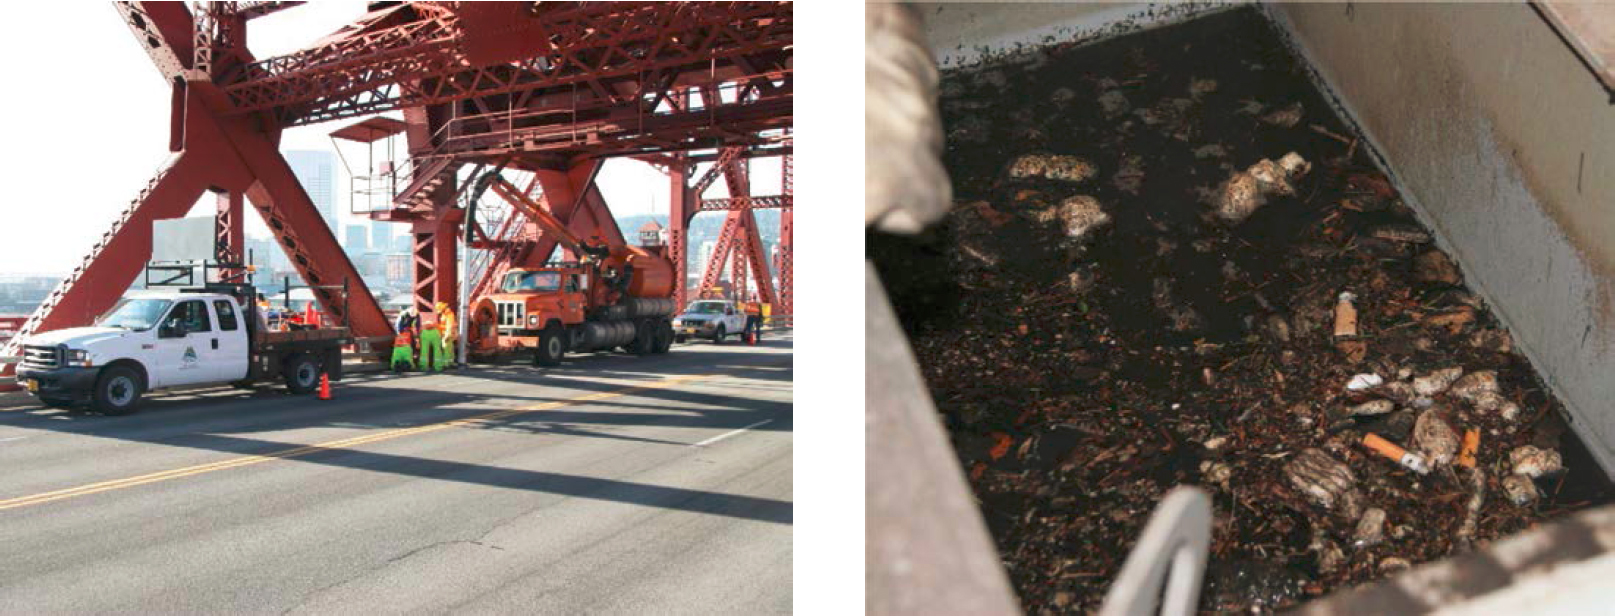
Figure 81. Photos from representative maintenance activities.
Some factors that appear to have contributed to a feasible design include:
- Relatively lower traffic and lower speed bridges than many freeway bridges, reducing the safety risks and traffic impacts associated with construction and maintenance.
- Multiple lanes in each direction, reducing the traffic impact of lane closures.
- Clear diurnal traffic patterns, allowing daylight work outside of peak commute hours.
- Relatively few cold weather events that require traction grit (ordinarily 1 to 2 times per year), but the relatively low frequency of events likely presents limited issues.
- Highly urban area without significant sediment sources.
- Ability to drain the bridge to discrete points where catch basins can intercept flow.
- Use of a proprietary design that limits the size of openings in the top slab. The footprint is about 12 sq ft. In comparison, the prototype BMP described in this guide would require a footprint of about 20 sq ft to treat a similar fraction of long-term runoff volume and could require O&M considerably more frequently.
- Steel girder superstructure construction, allowing for the addition of reinforcing beams at catch basin locations. Bridges in which the girders and the bridge deck are reinforced and constructed as integral would likely have much greater impacts associated with saw-cut openings in the bridge deck.
- Thoughtful specification of saw cut phasing to preserve existing rebar connections at interfaces.
- Identification of bridge-specific opportunities to site BMPs below the deck but still accessible from the deck.
From the complexity of the construction methods and reliance on custom designs, it appears that this project was likely costly to construct. Unfortunately, the costs of construction isolated to the BMP retrofits were not available to confirm this. Regardless, it would be challenging to translate costs from 20 years ago.
Overall, this resulted in a design that has relatively little impact on bridge operations and has a manageable O&M program. The performance of the BMPs would not meet current sizing standards, calling for 90 percent long-term capture, and do not have TAPE certifications for metals. Currently, alternative StormFilter® media is available that does have TAPE phosphorus removal certification at a higher flowrate.
Similar approaches were used for the Burnside Bridge around the same time. The Burnside Bridge has many of the same favorable conditions that supported a feasible design here.
Abbreviations and acronyms used without definitions in TRB publications:
| A4A | Airlines for America |
| AAAE | American Association of Airport Executives |
| AASHO | American Association of State Highway Officials |
| AASHTO | American Association of State Highway and Transportation Officials |
| ACI–NA | Airports Council International–North America |
| ACRP | Airport Cooperative Research Program |
| ADA | Americans with Disabilities Act |
| APTA | American Public Transportation Association |
| ASCE | American Society of Civil Engineers |
| ASME | American Society of Mechanical Engineers |
| ASTM | American Society for Testing and Materials |
| ATA | American Trucking Associations |
| CTAA | Community Transportation Association of America |
| CTBSSP | Commercial Truck and Bus Safety Synthesis Program |
| DHS | Department of Homeland Security |
| DOE | Department of Energy |
| EPA | Environmental Protection Agency |
| FAA | Federal Aviation Administration |
| FAST | Fixing America’s Surface Transportation Act (2015) |
| FHWA | Federal Highway Administration |
| FMCSA | Federal Motor Carrier Safety Administration |
| FRA | Federal Railroad Administration |
| FTA | Federal Transit Administration |
| GHSA | Governors Highway Safety Association |
| HMCRP | Hazardous Materials Cooperative Research Program |
| IEEE | Institute of Electrical and Electronics Engineers |
| ISTEA | Intermodal Surface Transportation Efficiency Act of 1991 |
| ITE | Institute of Transportation Engineers |
| MAP-21 | Moving Ahead for Progress in the 21st Century Act (2012) |
| NASA | National Aeronautics and Space Administration |
| NASAO | National Association of State Aviation Officials |
| NCFRP | National Cooperative Freight Research Program |
| NCHRP | National Cooperative Highway Research Program |
| NHTSA | National Highway Traffic Safety Administration |
| NTSB | National Transportation Safety Board |
| PHMSA | Pipeline and Hazardous Materials Safety Administration |
| RITA | Research and Innovative Technology Administration |
| SAE | Society of Automotive Engineers |
| SAFETEA-LU | Safe, Accountable, Flexible, Efficient Transportation Equity Act: A Legacy for Users (2005) |
| TCRP | Transit Cooperative Research Program |
| TEA-21 | Transportation Equity Act for the 21st Century (1998) |
| TRB | Transportation Research Board |
| TSA | Transportation Security Administration |
| U.S. DOT | United States Department of Transportation |


