Resilience in Transportation Networks, Volume 2: Network Resilience Toolkit and Techniques (2024)
Chapter: 1 Matrix of Existing Network Resilience Analysis Methods and Tools
1 Matrix of Existing Network Resilience Analysis Methods and Tools
A number of tools have been developed to assess the resilience of transportation networks. The following summary categorizes the tools according to the stage of the resilience cycle (see Figure 1) they address.

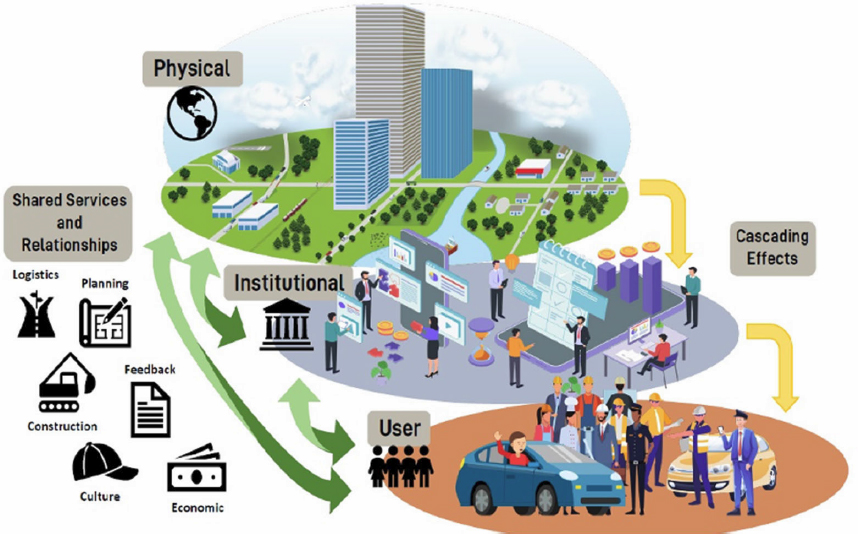
Of the 25 summarized tools in this web-only document, 20 focus on assessing the resilience of physical infrastructure, while the remaining five focus on assessing the resilience of institutional arrangements. (See Figure 2 for a visualization of the resilience ecosystem, including physical infrastructure and institutional arrangements.) Similarly, most of the resilience tools focus on preparation, the first stage of the resilience cycle, while fewer focus on subsequent stages.
- Preparation: 20
- Response: 2
- Short-term recovery: 2
- Long-term recovery: 4
Table 1: Resilience Tools Used in Practice
This document links the tools summarized in this matrix to solution sets described in NCHRP Report 732: Methodologies to Estimate the Economic Impacts of Disruptions to the Goods Movement System (Georgia Tech Research Corporation et al. 2012) and NCFRP Research Report 39: Freight Transportation Resilience in Response to Supply Chain Disruptions (Meyer et al. 2019).
Figure 3 identifies where each of the tools in this toolkit fit with solution sets for transportation sustainability, risk, and resilience. These sources outline step-by-step procedures for decision-makers to use as reference points in terms of solutions that address pertinent issues. Utilizing this knowledge, these analytical structures can be used by project managers to assess plans for new transportation infrastructure. Given the freight transportation and supply-chain context of the solutions sets, users can understand the nuanced risk and resilience parameters for sustainability and economic efficiency.

NCHRP Report 732: Methodologies to Estimate the Economic Impacts of Disruptions to the Goods Movement System provides a baseline framework for estimating the economic impacts of disruptions to the goods movement system. The decision/analysis tool was designed with three objectives in mind. First, it prioritizes analysis of the present-day economic impacts caused by transportation disruptions and synthesizes a framework for detailing the relationships between cause and effect. Next, it presents a conceptual roadmap that estimates these economic impacts and the methodologies that follow both geographically and temporally (see Figure 4).
___________________
1Georgia Tech Research Corporation, Parsons Brinckerhoff, Inc., A. Strauss-Wieder, Inc. NCHRP Report 732: Methodologies to Estimate the Economic Impacts of Disruptions to the Goods Movement System, Transportation Research Board of the National Academies, Washington, DC, 2012, https://doi.org/10.17226/22702.
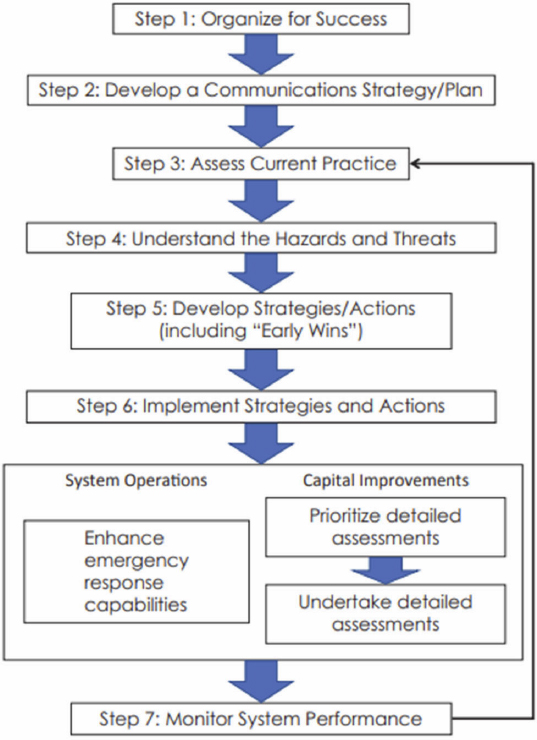
Meyer et al. (2019) developed a framework to assess the risks and resilience of freight transportation networks. The process is shown in Figure 4. The primary goal of this study is providing stakeholders with easily digestible guidelines to assess the resilience of supply chains. Key insights include physical infrastructure, financial, and regulatory metrics that help detail performance assessments that can “quantify operational concerns.”
___________________
2Meyer, M., S. McLeod, T. Fidell, H. Gajjar, D. Sood, M. Kamali, R. Wingate, D. Willauer, F. Southworth, NCFRP Research Report 39: Freight Transportation Resilience in Response to Supply Chain Disruptions, Transportation Research Board, Washington, DC, 2019, https://doi.org/10.17226/25463.
Table 2 - FHWA INVEST3
| Tool Name | FHWA INVEST |
| Developed By | Federal Highway Administration |
| Dimension | Physical |
| Stage in Resilience Cycle | Long-Term Recovery |
| Relationship to NCHRP Report 732: Methodologies to Estimate the Economic Impacts of Disruptions to the Goods Movement System(Fig 3) | Applies to Step 1: Identifies the direct and immediate physical effects of a network disruption |
| Relationship to NCFRP Research Report 39: Freight Transportation Resilience in Response to Supply Chain Disruptions(Fig 4) | Applies to Step 4: Understand Hazards and Threats and their Impacts/Consequences (Input) Step 5: Develop Strategies, Actions, and Plans (Output) Chapter 7: Building redundancy and extra capacity into the system is good for both maintenance (in that no single facility handles all the demand) and resilience |
| Key Inputs |
|
| Key Outputs | “Evaluate and improve the sustainability and climate resilience of their projects and programs” |
___________________
3“FHWA Invest Tool – Infrastructure Resiliency Criteria,” Adaptation Clearinghouse, October 2012, https://www.adaptationclearinghouse.org/resources/fhwa-invest-tool-eo-infrastructure-resiliency-criteria.html.
Table 3 CMIP Climate Data Processing4
| Tool Name | CMIP Climate Data Processing Tool 2.1 |
| Developed By | FHWA |
| Dimension | Physical |
| Stage in Resilience Cycle | Preparation |
| Relationship to NCHRP Report 732: Methodologies to Estimate the Economic Impacts of Disruptions to the Goods Movement System(Fig 3) | Applies to Step 2: Identifies current and future affected network flows by facility and link. |
| Relationship to NCFRP Research Report 39: Freight Transportation Resilience in Response to Supply Chain Disruptions(Fig 4) | Applies to Step 5: Develop Strategies, Actions, and Plans (Output) Step 6: Implement Strategies and Actions Chapter 7: Building redundancy and extra capacity into the system is good for both maintenance (in that no single facility handles all the demand) and resilience |
| Key Inputs |
|
| Key Outputs |
“Relevant statistics for transportation planners and designers” i.e.:
|
___________________
4“CMIP Home Page,” Climate Data Processing Tool, n.d., https://fhwaapps.fhwa.dot.gov/cmip.
Table 4 Sensitivity Matrix5
| Tool Name | Sensitivity Matrix |
| Developed By | US DOT |
| Dimension | Physical |
| Stage in Resilience Cycle | Preparation |
| Relationship to NCHRP Report 732: Methodologies to Estimate the Economic Impacts of Disruptions to the Goods Movement System(Fig 3) | Applies to Step 4: Models the response of the supply chain to disruptions Step 5: Models the economic impacts of network disruptions |
| Relationship to NCFRP Research Report 39: Freight Transportation Resilience in Response to Supply Chain Disruptions(Fig 4) | Applies to Step 4: Understand Hazards and Threats and their Impacts/Consequences (Input) Step 5: Develop Strategies, Actions, and Plans (Output) Chapter 7: Building redundancy and extra capacity into the system is good for both maintenance (in that no single facility handles all the demand) and resilience. |
| Key Inputs |
|
| Key Outputs |
Generates specified impact reports for all combinations of an asset type and climate stressor:
|
___________________
5“Tools - Climate Change Adaptation,” U.S. Department of Transportation/Federal Highway Administration, n.d., https://www.fhwa.dot.gov/environment/sustainability/resilience/tools/.
Table 5 VAST6
| Tool Name | Vulnerability Assessment Scoring Tool (VAST) |
| Developed By | US DOT |
| Dimension | Physical |
| Stage in Resilience Cycle | Preparation |
| Relationship to NCHRP Report 732: Methodologies to Estimate the Economic Impacts of Disruptions to the Goods Movement System(Fig 3) | Applies to Step 4: Models the response of the supply chain to disruptions |
| Relationship to NCFRP Research Report 39: Freight Transportation Resilience in Response to Supply Chain Disruptions(Fig 4) | Applies to Step 4: Understand Hazards and Threats and their Impacts/Consequences (Input) |
| Key Inputs |
|
| Key Outputs | The result is a set of vulnerability scores that can be used to rank assets by vulnerability or inform other analysis of the results. |
___________________
6“U.S. DOT Vulnerability Assessment Scoring Tool,” U.S. Department of Transportation/Federal Highway Administration, n.d., https://www.fhwa.dot.gov/environment/sustainability/resilience/tools/scoring_tools_guide/page02.cfm.
Table 6 Transportation Adaptation Guide7
| Tool Name | Guide to Assessing Criticality in Transportation Adaptation Planning |
| Developed By | FHWA |
| Dimension | Institutional |
| Stage in Resilience Cycle | Preparation |
| Relationship to NCHRP Report 732: Methodologies to Estimate the Economic Impacts of Disruptions to the Goods Movement System(Fig 3) | Applies to Step 2: Identifies current and future affected network flows by facility and link |
| Relationship to NCFRP Research Report 39: Freight Transportation Resilience in Response to Supply Chain Disruptions(Fig 4) | Applies to Step 3: Assess Current Practice Emphasizes designing key infrastructure with resilience in mind. |
| Key Inputs |
|
| Key Outputs |
|
___________________
7“Assessing Criticality in Transportation Adaptation Planning,” U.S. Department of Transportation/Federal Highway Administration, n.d., https://www.fhwa.dot.gov/environment/sustainability/resilience/publications/assessing_criticality/index.cfm.
Table 7 HEC-258
| Tool Name | Updated Hydraulic Engineering Circular 25; Highways in the Coastal Environment |
| Developed By | FHWA |
| Dimension | Physical |
| Stage in Resilience Cycle | Preparation |
| Relationship to NCHRP Report 732: Methodologies to Estimate the Economic Impacts of Disruptions to the Goods Movement System(Fig 3) | Applies to Step 1: Identifies the direct and immediate physical effects of a network disruption |
| Relationship to NCFRP Research Report 39: Freight Transportation Resilience in Response to Supply Chain Disruptions(Fig 4) | Applies to Step 4: Understand Hazards and Threats and their Impacts/Consequences |
| Key Inputs |
|
| Key Outputs |
|
___________________
8“Highways in the Coastal Environment,” U.S. Department of Transportation/Federal Highway Administration, January 2020, https://www.fhwa.dot.gov/engineering/hydraulics/pubs/hif19059.pdf
Table 8 HEC-1799
| Tool Name | Updated Riverine Hydraulic Engineering Circular |
| Developed By | FHWA |
| Dimension | Institutional |
| Stage in Resilience Cycle | Preparation |
| Relationship to NCHRP Report 732: Methodologies to Estimate the Economic Impacts of Disruptions to the Goods Movement System(Fig 3) | Applies to Step 1: Identifies the direct and immediate physical effects of a network disruption |
| Relationship to NCFRP Research Report 39: Freight Transportation Resilience in Response to Supply Chain Disruptions(Fig 4) | Applies to Step 4: Understand Hazards and Threats and their Impacts/Consequences |
| Key Inputs | Rainfall, Runoff, Base Flow, Historical Discharges |
| Key Outputs |
|
___________________
9“Bridges & Structures - Hydraulics Publications,” U.S. Department of Transportation/Federal Highway Administration, 2022, https://www.fhwa.dot.gov/engineering/hydraulics/library_arc.cfm?pub_number=16&id=162.
Table 9 Green Infra Techniques10
| Tool Name | Green Infrastructure Techniques for Improving Coastal Highway Resilience |
| Developed By | EPA |
| Dimension | Physical |
| Stage in Resilience Cycle | Long-Term Recovery |
| Relationship to NCHRP Report 732: Methodologies to Estimate the Economic Impacts of Disruptions to the Goods Movement System(Fig 3) | Applies to Step 2: Identifies current and future affected network flows by facility and link Step 3: Identifies supply chain characteristics and parameters Step 4: Models the response of the supply chain to disruptions |
| Relationship to NCFRP Research Report 39: Freight Transportation Resilience in Response to Supply Chain Disruptions(Fig 4) | Applies to Step 3: Assess Current Practice Step 4: Understand Hazards and Threats and their Impacts/Consequences |
| Key Inputs |
|
| Key Outputs | Conduct a site assessment to restore coastal shorelines to a more natural condition. Can be combined with gray infrastructure such as sea walls and jetties. |
___________________
10“Coastal Resiliency,” Environmental Protection Agency, July 2022, https://www.epa.gov/green-infrastructure/coastal-resiliency.
Table 10 State DOT GIS Application Examples
| Vermont Agency of Transportation11 | The Transportation Resilience Project Tool, a GIS-based application, is designed to give VTrans a measure of where the department is in terms of flood resilience. The application combines calculations of criticality for each of the transportation assets, together with those assets’ vulnerability to three different components of riverine flooding, inundation, erosion, and deposition, for 10-, 50-, and 100-year storm events. |
| Colorado DOT12 | The core of the study, relying on GIS, examined the risk of future climatic event together with the consequence of an asset failure. This includes both the cost t the state to repair a roadway and the cost to the public (and business) when the roadway was inoperable. The core questions were these: How much would cost to buy down the risk, and would it be worth the investment? In this way, CDOT sought to develop a defensible methodology for understanding the return on investment of proactive infrastructure improvements. |
| Maryland State Highway Administration13 | This has resulted in the Climate Change Vulnerability Viewer (CCVV), a support tool for MDOT SHA senior managers, planners, and other transportation agencies throughout the state. The CCVV is an Esri ArcGIS Online web application that showcases geospatial data products related to climate change (in particular, sea level changes) and the potential effects on State of Maryland transportation infrastructure. “The CCVV visualizes our analyses,” says Toria Lassiter, assistant chief, Innovative Planning & Performance Division, MDOT SHA. “We have a hazard vulnerability index analysis for all state-owned pavements, and the FHWA’s VAST [Vulnerability Assessment Scoring Tool] has been used on bridges statewide.” |
| Southeast Michigan Council of Government14 | The Flooding Risk tool, which launched in 2020, helped SEMCOG identify areas at risk of flooding, including roads, bridges, culverts, and pump stations, for the seven counties in the southeast region of Michigan. By calculating a criticality score and a vulnerability score for each asset in a GIS-enabled dashboard, SEMCOG was able to analyze the areas of greatest risk and highest impact from climate events to help cities and counties better prepare for the damage serious flooding could cause to their roads and other infrastructure. |
___________________
11“Preparing for Weather Disasters: Vermont Builds Resilience into Infrastructure Plans,” Esri, n.d., https://www.esri.com/en-us/lg/industry/transportation/vermont-builds-resilience-into-infrastructure-plans.
12“Colorado Dot: Building Back Better and Smarter for a More Resilient Transportation System,” Esri, n.d., https://www.esri.com/en-us/lg/industry/transportation/colorado-dot-building-back-more-resilient-transportation-system.
13“How Maryland Dot Is Making Its Infrastructure More Resilient,” Esri, n.d., https://www.esri.com/en-us/lg/industry/transportation/stories/how-maryland-is-mapping-to-make-its-infrastructure-more-resilient.
14“Designing Resilient Transportation Networks with GIS,” Esri, 2021, https://www.esri.com/content/dam/esrisites/en-us/media/ebooks/climate-resiliency-for-transportation.pdf.
Table 11 Flood Resiliency15
| Tool Name | VTrans Flood Resiliency App |
| Developed By | Vermont Agency of Transportation |
| Dimension | Physical |
| Stage in Resilience Cycle | Preparation |
| Relationship to NCHRP Report 732: Methodologies to Estimate the Economic Impacts of Disruptions to the Goods Movement System(Fig 3) | Applies to Step 2: Identifies current and future network flows by facility and link |
| Relationship to NCFRP Research Report 39: Freight Transportation Resilience in Response to Supply Chain Disruptions(Fig 4) | Applies to Step 3: Assess Current Practice Step 4: Understand Hazards and Threats and their Impacts/Consequences Step 5: Develop Strategies, Actions, and Plans |
| Key Inputs |
|
| Key Outputs |
|
___________________
15“Methods and Tools for Transportation Resilience Planning: Identifying and Reducing Flood and Erosion Risks on Vermont Roads,” Vermont Agency of Transportation, 2018, https://vtrans.vermont.gov/sites/aot/files/planning/documents/planning/Research/Poster%20VTrans%20Resiliency.pdf.
Table 12 Climate Change Snapshot16
| Tool Name | Local Climate Change Snapshot |
| Developed By | Cal-Adapt |
| Dimension | Physical |
| Stage in Resilience Cycle | Preparation |
| Key Inputs | Address |
| Relationship to NCHRP Report 732: Methodologies to Estimate the Economic Impacts of Disruptions to the Goods Movement System(Fig 3) | Applies to Step 1: Identifies the direct and immediate physical effects of a network disruption |
| Relationship to NCFRP Research Report 39: Freight Transportation Resilience in Response to Supply Chain Disruptions(Fig 4) | Applies to Step 5: Develop Strategies, Actions, and Plans |
| Key Outputs | This visualization shows the most likely outcome and a range of future projections of Annual Average Maximum Temperature. This table provides a snapshot of Annual Average Maximum Temperature for three 30-year time periods. |
___________________
16“Climate Tools,” Cal-Adapt, 2021, https://cal-adapt.org/tools/.
Table 13 CanVis17
| Tool Name | CanVis |
| Developed By | US Climate Resilience Toolkit |
| Dimension | Institutional |
| Stage in Resilience Cycle | Preparation |
| Relationship to NCHRP Report 732: Methodologies to Estimate the Economic Impacts of Disruptions to the Goods Movement System(Fig 3) | Applies to Step 1: Identifies the direct and immediate physical effects of a network disruption Step 2: Identifies current and future affected network flows by facility and link |
| Relationship to NCFRP Research Report 39: Freight Transportation Resilience in Response to Supply Chain Disruptions(Fig 4) | Applies to Step 5: Develop Strategies, Actions, and Plans Step 6: Implement Strategies and Actions |
| Key Inputs |
By importing photographs from a place in their community, users can
|
| Key Outputs | Visualize future changes related to sea level rise, storm surges, and flooding. |
___________________
17“U.S. Climate Resilience Toolkit,” CanVis, July 2019, https://toolkit.climate.gov/tool/canvis.
Table 14 Shoreline Analysis18
| Tool Name | Digital Shoreline Analysis System |
| Developed By | USGS |
| Dimension | Physical |
| Stage in Resilience Cycle | Preparation |
| Relationship to NCHRP Report 732: Methodologies to Estimate the Economic Impacts of Disruptions to the Goods Movement System(Fig 3) | Applies to Step 1: Identifies the direct and immediate physical effects of a network disruption Step 2: Identifies current and future network flows by facility and link |
| Relationship to NCFRP Research Report 39: Freight Transportation Resilience in Response to Supply Chain Disruptions(Fig 4) | Applies to Step 3: Assess Current Practice Step 4: Understand Hazards and Threats and their Impacts/Consequences Step 5: Develop Strategies, Actions, and Plans |
| Key Inputs |
ArcGIS layers:
|
| Key Outputs | Calculates rate-of-change statistics from multiple historical shoreline positions. It provides an automated method for establishing measurement locations, performs rate calculations, provides the statistical data necessary to assess the robustness of the rates, and includes a beta model of shoreline forecasting with the option to generate 10- and/or 20-year shoreline horizons and uncertainty bands. |
___________________
18“Digital Shoreline Analysis System (DSAS),” U.S. Geological Survey, October 2018, https://www.usgs.gov/centers/whcmsc/science/digital-shoreline-analysis-system-dsas.
Table 15 Urban Economic Recovery & Resilience19
| Tool Name | Urban Economic Recovery and Resilience Diagnostic and Planning Tool |
| Developed By | UNCDF |
| Dimension | Physical |
| Stage in Resilience Cycle | Long-Term Recovery |
| Relationship to NCHRP Report 732: Methodologies to Estimate the Economic Impacts of Disruptions to the Goods Movement System(Fig 3) | Applies to Step 5: Models the economic impacts of network disruptions |
| Relationship to NCFRP Research Report 39: Freight Transportation Resilience in Response to Supply Chain Disruptions(Fig 4) | N/A |
| Key Inputs |
Analysis of capacity:
|
| Key Outputs | Resilience Performance Matrix using scores |
___________________
19“Urban Economic Recovery and Resilience,” United Nations Capital Development Fund, February 2021, https://urbanresiliencehub.org/wp-content/uploads/2021/03/Resilience-Diagnostic-Planning-Tool-Feb2021.pdf.
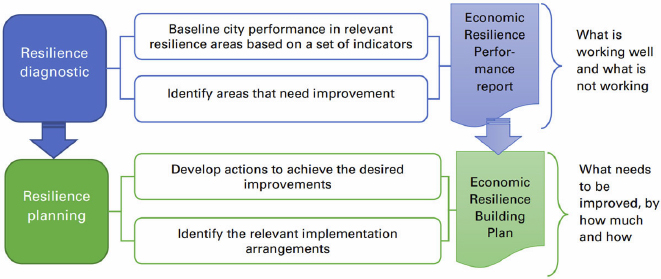
Table 16 Earthquake Traffic20
| Tool Name | Earthquake Traffic Tool |
| Developed By | SOGA Research Group: UC Berkeley |
| Dimension | Physical |
| Stage in Resilience Cycle | Short-Term Recovery |
| Relationship to NCHRP Report 732: Methodologies to Estimate the Economic Impacts of Disruptions to the Goods Movement System(Fig 3) | Applies to Step 1: Identifies the direct and immediate physical effects of a network disruption |
| Relationship to NCFRP Research Report 39: Freight Transportation Resilience in Response to Supply Chain Disruptions(Fig 4) | Applies to Step 4: Understand Hazards and Threats and their Impacts/Consequences |
| Key Inputs |
|
| Key Outputs | Scenario and Probabilistic Analysis under different disaster scenes |
___________________
20“City-Scale Modeling,” Soga Research Group, n.d., http://geomechanics.berkeley.edu/research/city/.

Table 17 Hierarchal Systems21
| Tool Name | Hierarchical Systems Tool |
| Developed By | Soga Research Group: UC Berkeley |
| Dimension | Physical |
| Stage in Resilience Cycle | Short-Term Recovery |
| Relationship to NCHRP Report 732: Methodologies to Estimate the Economic Impacts of Disruptions to the Goods Movement System(Fig 3) | N/A |
| Relationship to NCFRP Research Report 39: Freight Transportation Resilience in Response to Supply Chain Disruptions(Fig 4) | N/A |
___________________
21“System of Systems,” Soga Research Group, n.d., http://geomechanics.berkeley.edu/research/system-of-systems/.
| Key Inputs | “A key question underpinning the city-scale research is to quantify the contributions of individual components toward the performance of the bigger system. In various applications and case studies, we have found the interactions between subsystems cannot be neglected. This has big policy implications and emphasis on the necessity of strengthening the corporations between various sectors to maximize the benefits or minimize the negative impacts in urban infrastructure governance. Specifically, we aim to develop digital twin systems at various scales that combine data and models from appropriate subsystems to better aid the understanding and transition toward better living environments.” |
| Key Outputs | 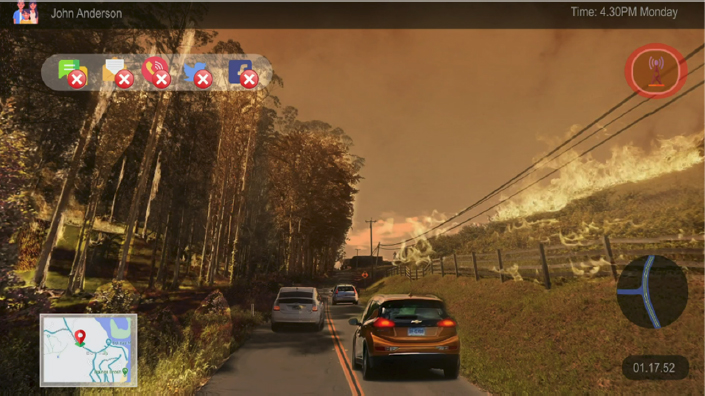 |
Table 18 Hazard Mitigation22
| Tool Name | Hazard Mitigation Cost Effectiveness Tool |
| Developed By | Federal Transit Administration |
| Dimension | Physical |
| Stage in Resilience Cycle | Preparation |
| Relationship to NCHRP Report 732: Methodologies to Estimate the Economic Impacts of Disruptions to the Goods Movement System(Fig 3) | Applies to Step 4: Models the response of the supply chain disruptions Step 5: Models the economic impacts of network disruptions |
| Relationship to NCFRP Research Report 39: Freight Transportation Resilience in Response to Supply Chain Disruptions(Fig 4) | Applies to Step 5: Develop Strategies, Actions, and Plans Step 6: Implement Strategies and Actions |
| Key Inputs |
|
| Key Outputs |
Resilience Cost Benefit Analysis Sheet designed to:
|
___________________
22“Hazard Mitigation Cost Effectiveness Tool,” Federal Transit Administration, October 2017, https://www.transit.dot.gov/funding/grant-programs/emergency-relief-program/hazard-mitigation-cost-effectiveness-tool.
Table 19 Resilience Exploration Engine23
| Tool Name | Gulf Tree: Tools for Resilience Exploration Engine |
| Developed By | Gulf Alliance |
| Dimension | Physical |
| Stage in Resilience Cycle | Preparation |
| Relationship to NCHRP Report 732: Methodologies to Estimate the Economic Impacts of Disruptions to the Goods Movement System(Fig 3) | N/A |
| Relationship to NCFRP Research Report 39: Freight Transportation Resilience in Response to Supply Chain Disruptions(Fig 4) | N/A |
| Key Inputs |
|
| Key Outputs | Search engine outputs list of relevant tools based on input query |
___________________
23“Gulf Tree: Filtered Search,” Gulf Tree, n.d., http://www.gulftree.org/filtered-search.
Table 20 Climate Resilience24
| Tool Name | Climate Resilience |
| Developed By | SEMCOG |
| Dimension | Physical |
| Stage in Resilience Cycle | Response |
| Relationship to NCHRP Report 732: Methodologies to Estimate the Economic Impacts of Disruptions to the Goods Movement System(Fig 3) | Applies to Step 1: Identifies the direct and immediate physical effects of a network disruption |
| Relationship to NCFRP Research Report 39: Freight Transportation Resilience in Response to Supply Chain Disruptions(Fig 4) | Applies to Step 3: Assess Current Practice |
| Key Inputs |
|
| Key Outputs |
Products of a recently completed Climate Resiliency study will support transportation planning and stormwater management activities. Dashboard: Top 5 Road Segments at Risk
|
___________________
24“Climate Resilience,” Southeast Michigan Council of Governments, n.d., https://semcog.org/plans-for-the-region/environment/climate-resilience.
Table 21 UCINET Simulation25
| Tool Name | UCINET Simulation Tool |
| Developed By | California State University Long Beach |
| Dimension | Institutional |
| Stage in Resilience Cycle | Response |
| Relationship to NCHRP Report 732: Methodologies to Estimate the Economic Impacts of Disruptions to the Goods Movement System(Fig 3) | Applies to Step 2: Identifies current and future affected network flows by facility and link |
| Relationship to NCFRP Research Report 39: Freight Transportation Resilience in Response to Supply Chain Disruptions(Fig 4) | Applies to Step 4: Understand Hazards and Threats and their Impacts/Consequences |
| Key Inputs | Two path failure strategies (selective and random) using betweenness centrality as a metric |
| Key Outputs | “Calculate reliability by considering the critical paths of a transportation network using the UCINET simulation tool” |
___________________
25“Introducing the Resilience into the State Transportation Network,” National Center for Sustainable Transportation, January 2018, https://ncst.ucdavis.edu/research-product/introducing-resilience-state-transportation-network.
Table 22 Resilient Transportation Systems26
| Tool Name | Tools for Analyzing Resilient Transportation Systems |
| Developed By | TRB |
| Dimension | Physical |
| Stage in Resilience Cycle | Preparation |
| Relationship to NCHRP Report 732: Methodologies to Estimate the Economic Impacts of Disruptions to the Goods Movement System(Fig 3) | Applies to Step 5: Models the economic impacts of network disruptions |
| Relationship to NCFRP Research Report 39: Freight Transportation Resilience in Response to Supply Chain Disruptions(Fig 4) | Applies to Step 5: Develop Strategies, Actions, and Plans |
| Key Inputs | Incorporate the cost and benefits of resilience into the decision-making process, including project prioritization, weighing trade-offs, and making informed decisions on future infrastructure investments |
| Key Outputs | “Accurately assess the value of resilience in future infrastructure investments” |
___________________
26“TRB Webinar: Measuring Resiliency – Tools for Analyzing Resilient Transportation Systems,” National Academies of Sciences, Engineering, and Medicines, March 2021, https://webinar.mytrb.org/Webinars/Details/1463.
Table 23 Iowa State Transportation Resilience27
| Tool Name | Assessing and Enhancing Transportation Resilience for the State of Iowa |
| Developed By | Bridge Engineering Center Iowa State University |
| Dimension | Physical |
| Stage in Resilience Cycle | Long-Term Recovery |
| Relationship to NCHRP Report 732: Methodologies to Estimate the Economic Impacts of Disruptions to the Goods Movement System(Fig 3) | Applies to Step 4: Models the response of the supply chain to disruptions |
| Relationship to NCFRP Research Report 39: Freight Transportation Resilience in Response to Supply Chain Disruptions(Fig 4) | Applies to Step 3: Assess Current Practice Step 4: Understand Hazards and Threats and their Impacts/Consequences |
| Key Inputs | Historical repair costs from past events |
| Key Outputs | A multi-scale resilience index (MRI) to assess the impact of different failure consequences and “evaluate the likelihood of damages to the transportation network due to flood events, estimate the direct and indirect losses associated with such closures, and use the results as a tool to prioritize different projects while considering the long-term implications of mitigation efforts on the life cycle of assets considering the likelihood of flood events.” |
___________________
27“Assessing and Enhancing Transportation Resilience for the State of Iowa,” Bridge Engineering Center, October 2020, http://publications.iowa.gov/35175/2/assess_and_enhance_transportation_resilience_for_Iowa_t2.pdf.
Table 24 RAND Logic Model28
| Tool Name | Logic Model |
| Developed By | RAND |
| Dimension | Institutional |
| Stage in Resilience Cycle | Preparation |
| Relationship to NCHRP Report 732: Methodologies to Estimate the Economic Impacts of Disruptions to the Goods Movement System(Fig 3) | Applies to Step 2: Identifies the current and future affected network flows by facility and link Step 3: Identifies supply chain characteristics and parameters Step 4: Models the response of the supply chain to disruptions |
| Relationship to NCFRP Research Report 39: Freight Transportation Resilience in Response to Supply Chain Disruptions(Fig 4) | Applies to Step 3: Assess Current Practice Step 4: Understand Hazards and Threats and their Impacts/Consequences |
| Key Inputs |
|
| Key Outputs |
|
___________________
28Sarah Weilant, Aaron Strong, and Benjamin Miller, “Incorporating Resilience into Transportation Planning and Assessment,” RAND Corporation, 2019, https://doi.org/10.7249/rr3038.
Table 25 EJI29
| Tool Name | Environmental Justice Index |
| Developed By | ATSDR (Agency for Toxic Substances and Disease Registry) |
| Dimension | Physical |
| Stage in Resilience Cycle | Preparation |
| Relationship to NCHRP Report 732: Methodologies to Estimate the Economic Impacts of Disruptions to the Goods Movement System(Fig 3) | Applies to Step 1: Identify direct and immediate physical effects of network disruption |
| Relationship to NCFRP Research Report 39: Freight Transportation Resilience in Response to Supply Chain Disruptions(Fig 4) | Applies to Step 3: Assess Current Practice Step 4: Understand Hazards and Threats and their Impacts/Consequences |
| Key Inputs | State, County -> Select Block Group on Map |
| Key Outputs |
|
___________________
29“EJI Dashboard,” Centers for Disease Control and Prevention, n.d., https://onemap.cdc.gov/Portal/apps/opsdashboard/index.html#/4bcbcf78d4aa4a679df127259f081235.
Table 26 Transportation Toolkit30
| Tool Name | Transportation Toolkit |
| Developed By | Rural Health Information Hub |
| Dimension | Physical |
| Stage in Resilience Cycle | Preparation |
| Relationship to NCHRP Report 732: Methodologies to Estimate the Economic Impacts of Disruptions to the Goods Movement System(Fig 3) | Applies to Step 1: Identifies the direct and immediate physical effects of a network disruption |
| Relationship to NCFRP Research Report 39: Freight Transportation Resilience in Response to Supply Chain Disruptions(Fig 4) | Applies to Step 3: Assess Current Practice |
| Key Inputs |
|
| Key Outputs | Provides information and resources for rural communities interested in implementing a rural transportation program. |
___________________
30“Rural Transportation Toolkit,” Rural Health Information Hub, n.d., https://www.ruralhealthinfo.org/toolkits/transportation.
Table 27 – TranSight31
| Tool Name | TranSight |
| Developed By | REMI |
| Dimension | Physical |
| Stage in Resilience Cycle | Preparation |
| Relationship to NCHRP Report 732: Methodologies to Estimate the Economic Impacts of Disruptions to the Goods Movement System(Fig 3) | Applies to Step 4: Models the response of the supply chain to disruptions Step 5: Models the economic impacts of network disruptions |
| Relationship to NCFRP Research Report 39: Freight Transportation Resilience in Response to Supply Chain Disruptions(Fig 4) | Applies to Step 5: Develop Strategies, Actions, and Plans Step 6: Implement Strategies and Actions Step 7: Monitor System Performance |
| Key Inputs | Key Outputs |
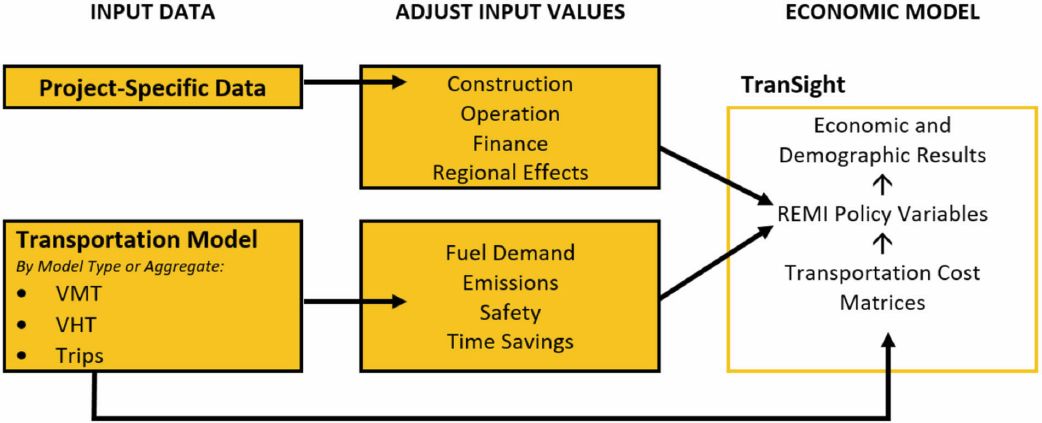 Models delays in transportation networks and demonstrates how resilience can be integrated into macroeconomic modeling via the transportation planning model REMI TranSight. | |
___________________
31“TranSight Models,” REMI, n.d., https://www.remi.com/model/trans-sight/.


