Resilience in Transportation Networks, Volume 2: Network Resilience Toolkit and Techniques (2024)
Chapter: 4 Cascading Effects of Disruptions on Small Urban Networks
4 Cascading Effects of Disruptions on Small Urban Networks
4.1 Cascading Effects Flagstaff Demonstration (Recipe)
Objective
The cascading-effects model identifies critical links in the Flagstaff roadway network and identifies where and how disruption of these links could have the greatest impact on travel times and accessibility between key trip origins and destinations, as well as the impact that failures might have on supply chains, job access, and resident’s access to basic goods and services.
Data
Most of the data required to conduct the cascading-effects analysis came from the Flagstaff MPO’s travel demand model. Necessary data files include:
- Roadway network links from the travel demand model, including the following attributes:
- Functional classification,
- Flow data for morning, evening, night, and off-peak periods,
- Volume-to-capacity ratios.
- Travel-time skims – Travel times between the centroids of all pairs of travel analysis zones (TAZs) in the region; this analysis used estimates from the metropolitan planning organization’s travel demand model.
- Transit data – Transit stop locations with ridership statistics, specifically boardings and alightings.
- Trucking data – The volume of freight/commercial truck traffic between origin-destination TAZs.
Flagstaff MPO’s travel demand model does not include detailed data on activity centers and employment within TAZs, therefore, additional data on employment is needed to estimate cascading-effects from network disruptions, including:
- Employment data from the U.S. Census Bureau’s Longitudinal Employer-Household Dynamics data set.
Two software packages are also needed to run the cascading effects model:
- TRANSCAD/CUBE, which is needed to obtain data from the travel demand model.
- ArcGIS, which is necessary to perform geospatial analysis.
Procedure
Step 1. Identify Critical Roadway Links: Create an index ranking roadway network links by roadway functional classification.
- Merge flow data (morning, evening, night, and off-peak periods) from the travel demand model with the roadway network.
- Categorize the resulting dataset by functional classification by four classes: freeways, local roads, arterials, and collectors.
- For each link, create four attributes to indicate whether a link adheres to the following four variables:
- A link is a ramp,
- A link has transit volume,
- A link is an interstate highway that exceeded the TAZ boundary, and
- A link was in the top 25% of links with trucking activity.
- For each link, include two quantitative attributes including:
- The ratio of the volume on the link to the maximum volume in each functional class subset, and
- The ratio of the Volume-Capacity ratio of the link to the maximum Volume-Capacity ratio of each functional class subset.
- These six attributes are equally weighted and thus a score is assigned for each link.
- The scores are then summed to create an index score for each link.
- This score is then used to rank the top 50 links by the previously described functional classification categories.
- These values can then be mapped in ArcGIS to identify potential clusters of selected critical roadway links.
Step 2. Identify Critical Zones: Create an index to further identify potential impacts on disrupted links based on employment sensitivity, trip volumes inside a TAZ, and origin and destination zones associated in previously identified critical links.
- Create an attribute for the TAZs based on NAICS employment data codes and categorize each TAZ as either sensitive or not sensitive. See Figure 18, which identifies NAICS Codes to be considered sensitive.

Figure 18 – Sensitive Business Types by NAICS Code - Create an attribute for each TAZ based on traffic volumes of links within the TAZ and categorize each TAZ as either low volume, or high volume.
- Based on the previous two steps, create an index attribute identifying each TAZ as one of the following four categories:
- Low Volume, Low Sensitivity
- Low Volume, High Sensitivity
- High Volume, Low Sensitivity
- High Volume, High Sensitivity
- Assign a score to each link based on the employment sensitivity/volume index attribute create in the previous step and the origin/destination zones associated with the trips occurring on the critical links.
- The average of this score index and the composite score from the network link analysis can be used to create a final ranking of the links.
Step 3. Identify Impacts of Critical Links on Transit: As an additional step, calculate transit impacts using local transit data and link volumes.
- Identify transit stops along, or in close range of, the selected critical segments.
- Calculate the average boardings and alightings at each transit stop.
- Calculate the volumes coming to and going from each of the transit stops.
- Calculate the “total flow disrupted” to quantify the impacts that the critical links have on transit.
Validation
An important part of this process is taking the time to validate your results. This can be done in multiple ways. The first is to review and validate your data sources prior, during, and after you have completed the process. Review the data collected and verify that roadway volumes, classifications, TAZ boundaries, and other data appear accurate. Be sure to “scrub” or clean any data to remove any apparent anomalies or errors. Also, be sure to truth test created or derived data to ensure results are within expectations. Finally, review the results of both tabular and geospatial data, identifying and reviewing any anomalies for accuracy.
There are often multiple datasets related to roadway conditions from various sources. Take time to review like datasets and identify potential areas of concern within the modeling links used for this exercise.
In addition to a thorough data review, truth test your results by sharing them with local planners and other experts. Provide them with sufficient mapping and tabular information and ask them to review and apply their local knowledge to determine which results made sense to them and which results seem to be out of place.
Results
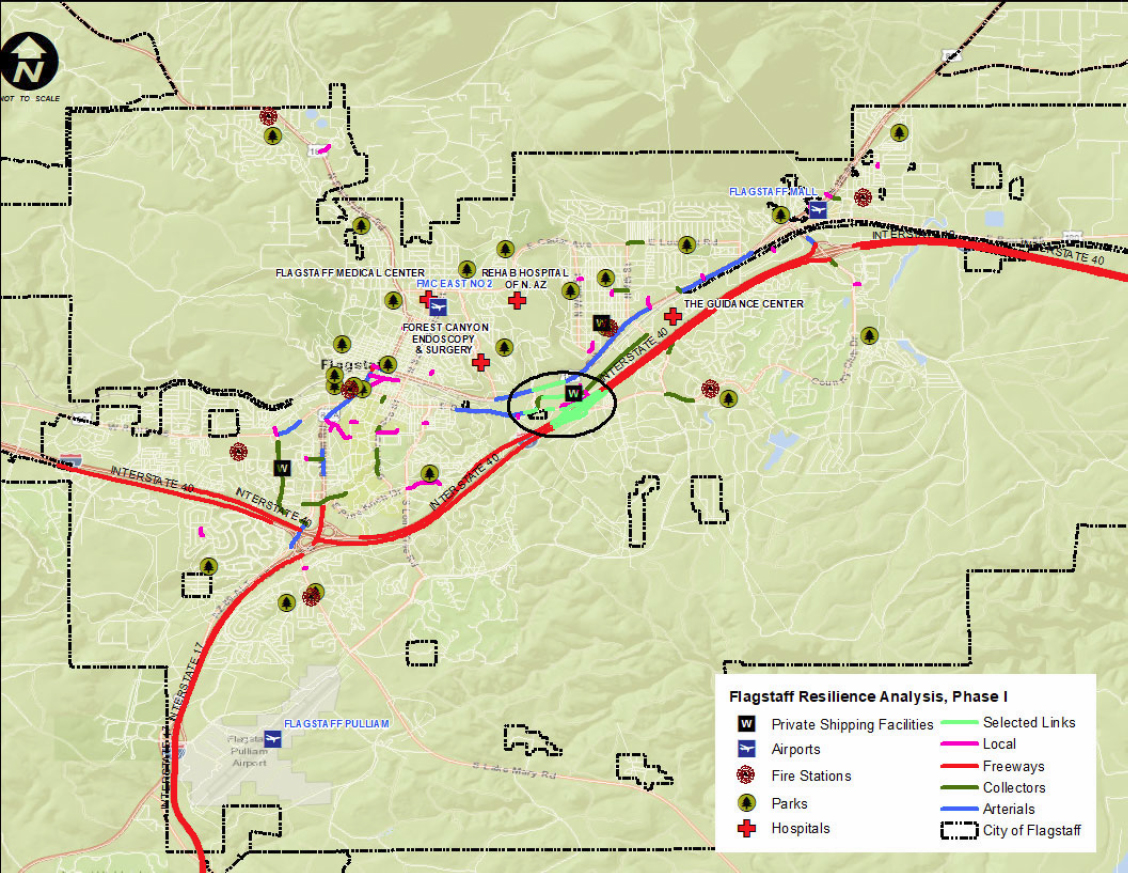
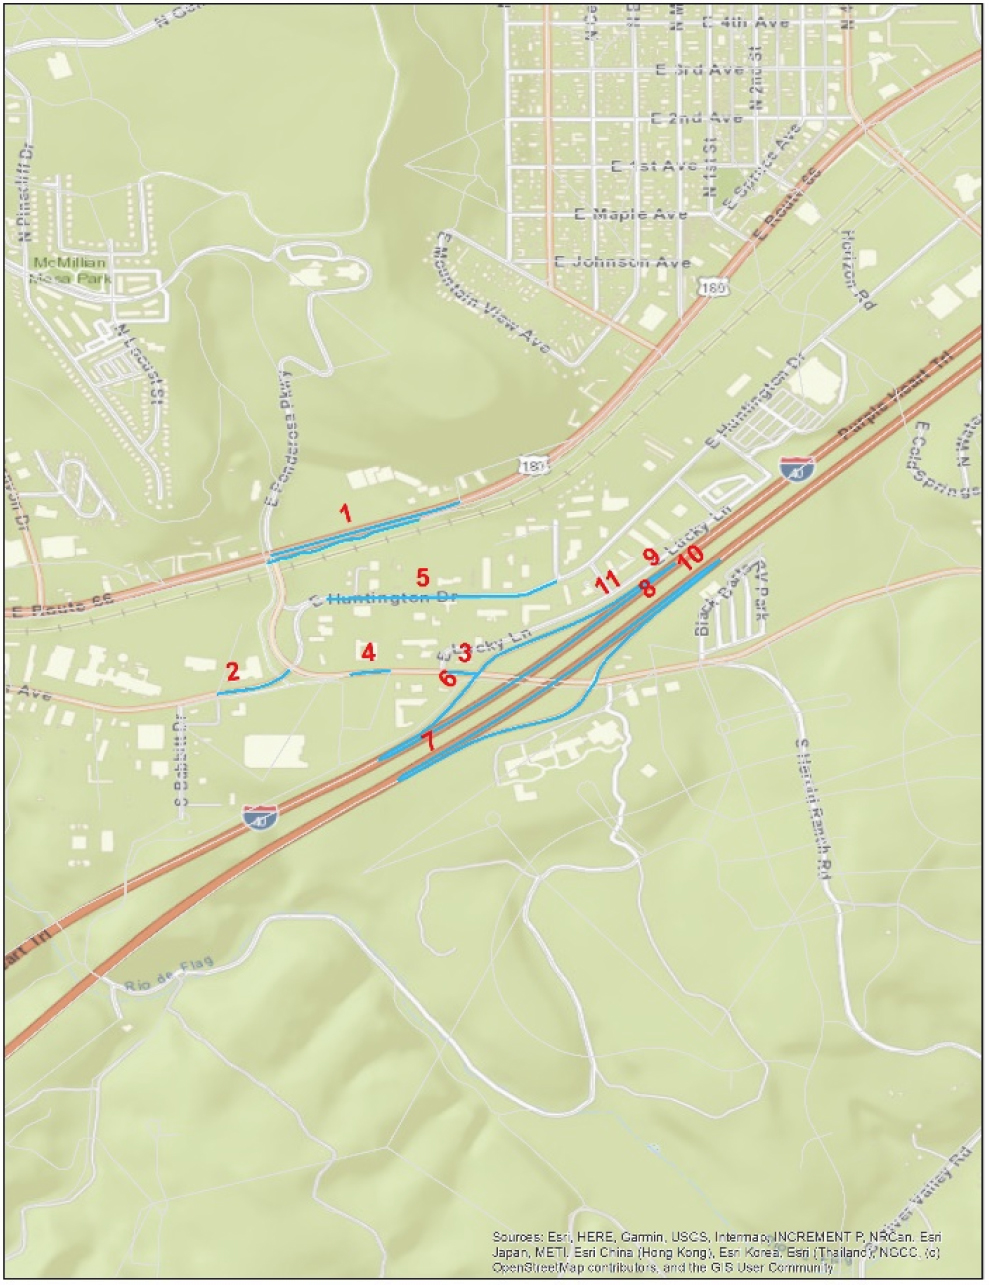
The results from the exercise described above can be illustrated visually in both mapping and tabular formats. In the Flagstaff use case, the mapping in Figure 19 illustrates the results of Step 1, the identification of critical roadway links. As shown on the mapping, the results of Step 1 identified a small cluster of roadways near Route 66, the Ponderosa Parkway, and Interstate 40 in Flagstaff as critical, based on the index score of the six attributes created during Step 1.
With these results, the planners then applied Step 2 by applying the volume/sensitivity index to the TAZs in the Flagstaff region, as shown in Figure 20.

Notably, the analysis identified that the area along Interstate 40 and in the areas corresponding to the critical links are identified as High Volume/High Sensitivity.
Based on the composite results of Steps 1 and 2 a final index is created, as shown in Figure 21, identifying the final rankings of the critical links in our cluster area.
Finally, Step 3, the impact of critical links on transit can be illustrated in a tabular format as shown in Figure 22.

The results show the calculated disruption to transit riders if these roadways are impacted by a potential closure or other event.
Conclusions
In conclusion, the methodology described in this document provides appropriate results for the Flagstaff, Arizona exercise. The data collection and analysis are complete, accurate, and easy. The method is easy to implement using industry-standard software. As with any data collection effort, it is important to truth test and identify any anomalies in the data before beginning your analyses. This can be done in multiple ways. In addition, it is important to identify individuals with local or technical knowledge of the data you are using that can help with potential sticking points during analysis and data manipulation.
The first step of the process identified critical links within the Flagstaff roadway network that could be considered pinch points during a disruption. Utilizing traffic volumes and functional class, along with other attributes, can be helpful when flagging potential trouble spots. Step 2 further clarifies the links’ sensitivity to disruptions by overlaying existing employment types and roadway volumes in the TAZs and creating a composite overview. Rankings generated from this composite identify a potential hierarchy to address potential disruptions along these critical roadways allowing planners and decision-makers to further study and apply solutions.
As is evident with Step 3, this process can be taken a step further and be applied to situations where transit is present. Identifying transit pinch points and potential displacements of ridership could be used by transit authorities and planners to identify potential alternative routing for transit vehicles during disruptions or emergency situations.
Finally, the exercise in Flagstaff provided results that indicate the process is methodologically sound and can be used to establish resilience priorities at the small to medium size city level. These priorities could be readily used by planners and city administrators to identify areas for further study and potentially apply solutions that could improve mobility and resilience in their roadway network.
4.2 Cascading Effects Flagstaff Applications (Context)
As part of the NCHRP 20-125: Incorporating Resilience in Transportation Networks investigation, three test cases were identified for testing network resilience tools designed during Phase I of this research. The MPO in Flagstaff, Arizona, was identified for pilot-testing these network resilience tools in their community. Site testing includes working with local stakeholders, integrating local models and data, and developing processes for engagement that will enhance network resilience capacity. This document will share the results from our stakeholder outreach and the findings of our test case in Flagstaff, Arizona.
Community Resilience Challenges
Flagstaff, Arizona is a small metropolitan region with a population of approximately 77,000 people in 2022. National forest land surrounds the urbanized area, limiting expansion opportunities. Northern Arizona University is the largest employer in Flagstaff by a factor of two or three times. However, the university’s economic and travel impacts are blunted by the fact that it is active only nine months of the year when the university is in session.
At the conclusion of the initial testing, the research team enlisted the help of a transportation planner at the Flagstaff MPO to provide feedback on the results of the cascading-effects model. The research team presented an overview of the cascading-effects analysis methodology and the analysis results. After the presentation, the planner participated in a short discussion regarding the methodology and the findings. The section below includes the most pertinent information shared during that conversation.
During the discussion, the planner identified key travel disruptions that could occur in the Flagstaff region. Some of those disruptions include forest fires, flooding, and other environmental disasters due to the proximity of the national parks. At the time of this document’s writing, Flagstaff is experiencing one of these disruptions. The planner mentioned that during this disruption, they have had to close Highway 89 and other local roadways for safety reasons due to the wildfires plaguing the area. This has resulted in a large amount of out-of-direction travel for residents to reach goods and services in the region. The hardest hit areas have been the Northern Arizona University campus and the Flagstaff downtown area.
The planner also identified construction zones as a travel disruption in the Flagstaff area. In particular, he identified a construction zone on I-40 westbound that is currently causing a travel delay of approximately 30 minutes. He also noted that the roadway system in Flagstaff is not very redundant due to the constraints of the prevailing mountainous geography of the area.
When asked which local agencies are involved and what they care about, the planner identified several agencies that participate in local planning efforts. Those identified include the public works department, the city engineer’s office, state and county officials, and the Mountain Line transit agency (formerly Northern Arizona Intergovernmental Transportation Authority). Mountain Line is the local transit agency. The planner noted that Flagstaff’s resilience planning efforts are like many other regions, involving managing critical sites, finding ways to harden existing infrastructure, developing potential alternative routing, identifying economic factors, and recovery planning in the event of a
disruption. The planner noted that disaster response planning for the area is primarily led by the county. He also noted that the area does not have a formal evacuation plan and that there has been no call for one by the local agencies.
Another topic during the discussion surrounded the identification of key business and industry sectors that may be impacted by a transportation disruption. The first sector identified was the medical sector. There are multiple clusters of medical services in Flagstaff, including Flagstaff Medical Center in the northern section of Flagstaff, Northern Arizona VA Healthcare Center in the southwestern corner of Flagstaff, and the North County Healthcare Center in northwest Flagstaff. Additionally, a manufacturer of critical medical devices, W.L. Gore & Associates, is located in the western portion of Flagstaff.
It was noted that another very large sector that could be disrupted by travel delays and closures would be the area’s tourism industry. The planner noted that there are several recreational destinations in the area, including the Arizona Snowbowl, primarily a ski resort but open year-round for various activities. The surrounding mountains also provide trails and other destinations for visitors to Flagstaff. He noted that most tourism locations are well distributed throughout the region. Thus resilience planning may not be as important to this industry as it may be to the previously mentioned sectors, which are more centrally located.
When asked whether freight was an important factor in resilience planning in the Flagstaff area, the planner replied that it could be important. While there are no major area manufacturers shipping goods outside of the Flagstaff area, smaller local manufacturers and industries could be affected by a disruption event. Many of the local manufacturers rely on parts and materials coming in from outside the region.
Regarding the cascading-effect model and his reactions to the demonstration provided by the project team, the planner provided multiple pieces of relevant feedback. His initial reaction was that the analysis might be stronger if it compared multiple clusters. This comparative analysis might provide better context to planners and provide a means to make more definitive decisions. He also mentioned that when performing this analysis, it must be clear how a cluster is determined. Another reaction was that an economic approach to the analysis might be better suited than an infrastructure approach. The current cascading-effect model does not include an economic component.
The planner did note that the cascading-effect model makes the need for resilience planning “feel more real.” It may make agencies more willing to talk about the need to discuss resilience and the need to plan for potential transportation disruptions. Finally, he noted that it might be a great tool for individual businesses. Individual businesses may be able to identify potential critical links for their workforce and supply chain.
Findings
The results from the cascading-effect model in the Flagstaff area identified several areas that had critical links (see Figure 23).

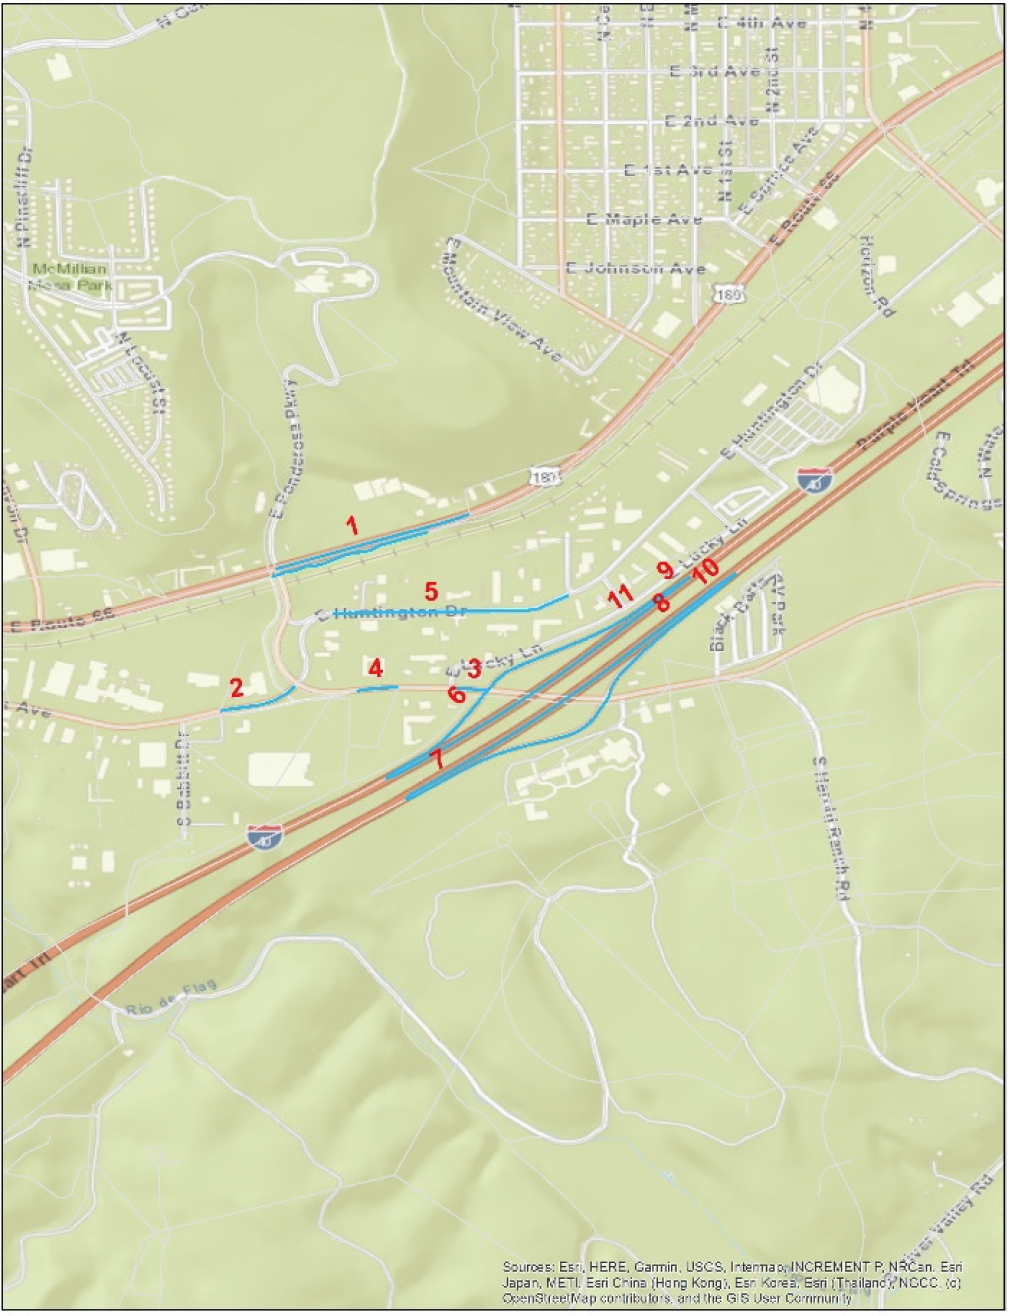
From these areas, a cluster near the intersection of Historic Route 66, Ponderosa Parkway, and I-40 was selected for further analysis (see Figure 24). This cluster was selected primarily because of the equal distribution of roadway function classification categories identified as critical links in the Flagstaff region. This cluster also represents a location where multiple critical roadways for east–west travel through the region converge into a relatively small geographic area. A disruption in this area is very likely to cause travel delays from one side of Flagstaff to the other.
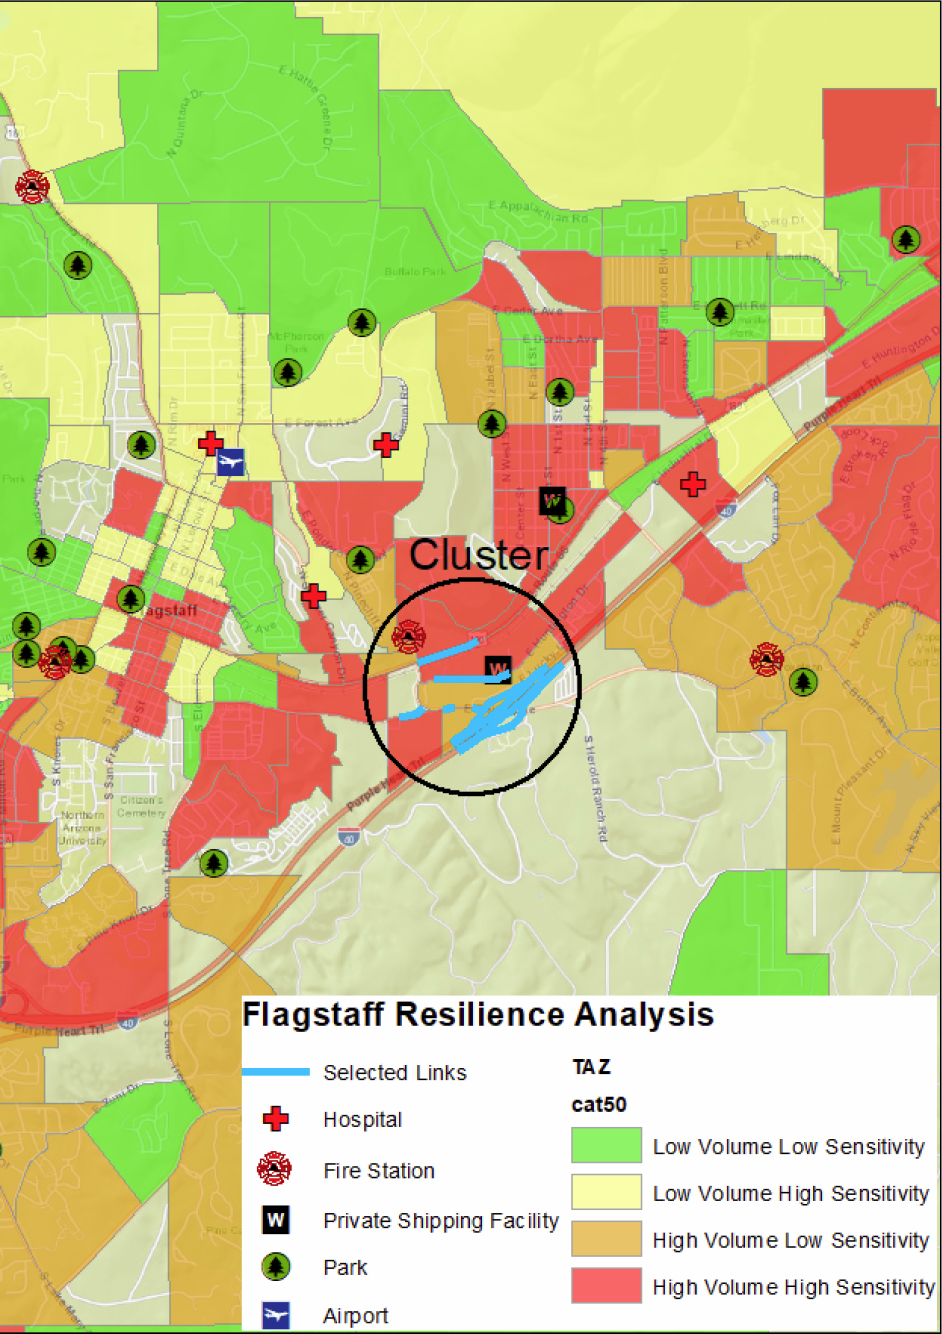
With these results, the planners then applied Step 2 by applying the Volume and Sensitivity index to the TAZs in the Flagstaff Region, as shown in Figure 25.
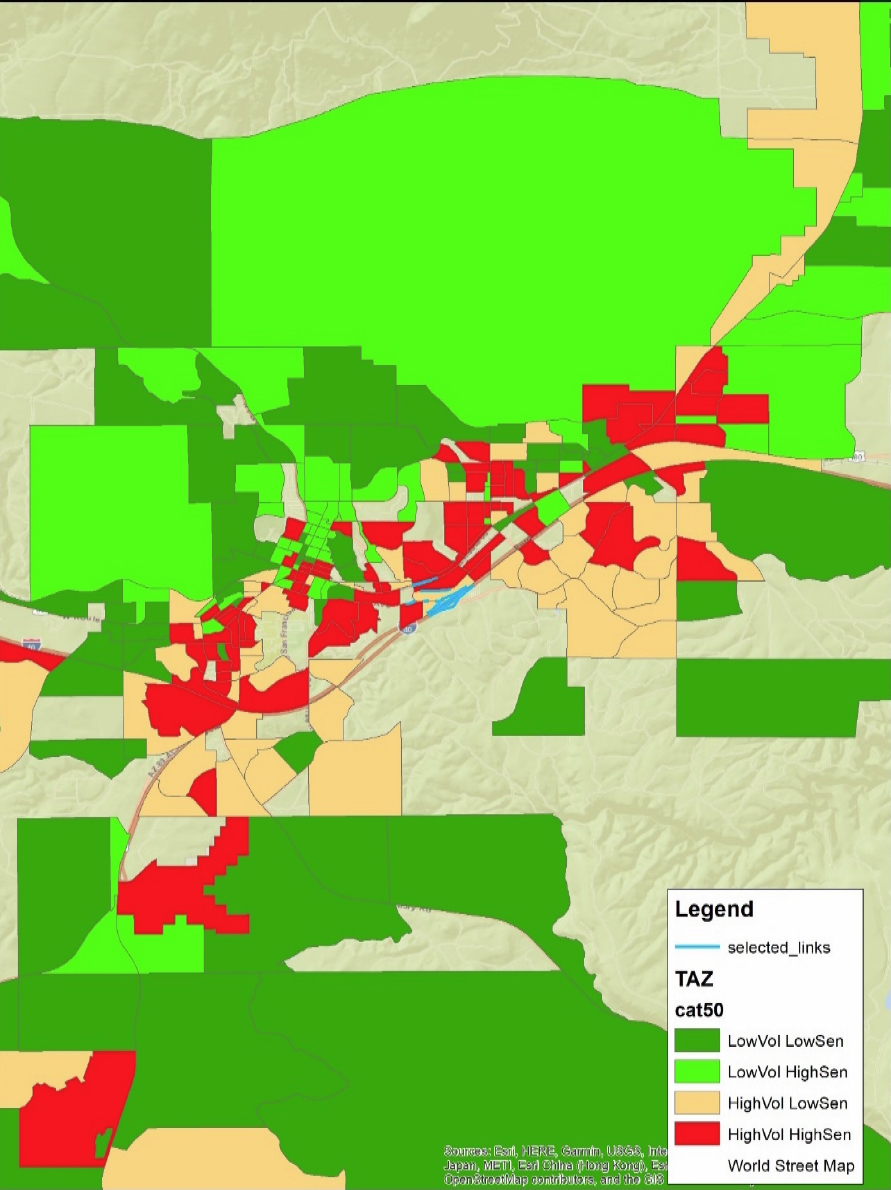
It is notable that these results identified that the area along Interstate 40 and in the areas corresponding to the critical links are identified as High Volume/High Sensitivity.
Based on the composite results of Steps 1 and 2, a final index was created, as shown in Figure 26, identifying the final rankings of the critical links in the analyzed cluster.
When asked if the results of this analysis appeared to be accurate, the Flagstaff planner confirmed that the area selected was critical; however, he pointed out that there are other areas in Flagstaff that are also important. However, he felt the links he identified are generally ranked accurately.
Finally, the impact of critical links on transit was determined, as shown in Figure 27.

The results show the calculated disruption to transit riders if these roadways are impacted by a potential closure or another disruptive event would be approximately 1,642 riders.
As a result of this analysis, additional information can be extrapolated regarding the characteristics of the cluster chosen in Flagstaff. Below are three examples of how this analysis might lead to insights that could help planners as they review disruption scenarios for a specific cluster.
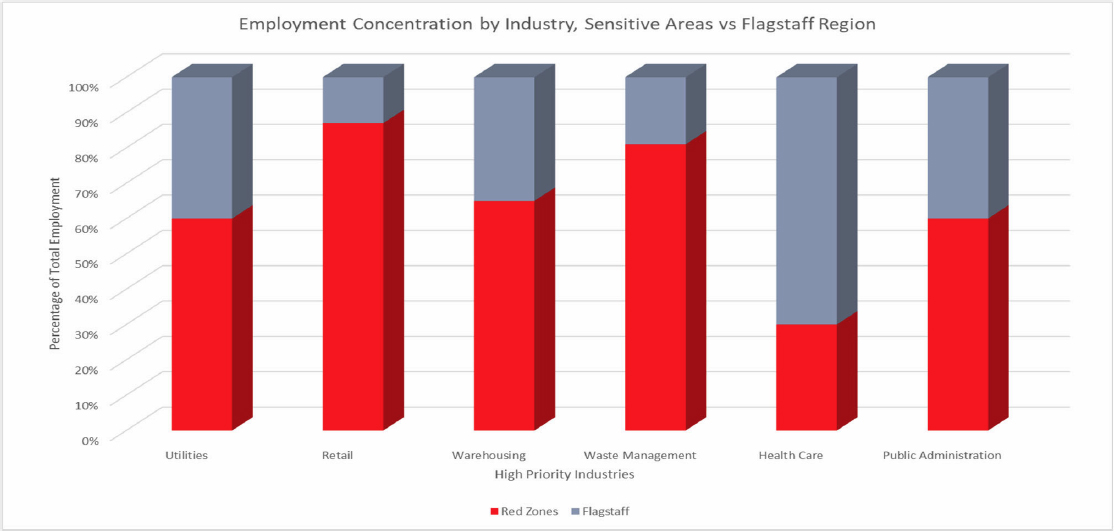
The first example, Figure 28, compares the employment concentration of the selected cluster against that of the entirety of the Flagstaff region. Sensitive areas affected by the disruption can be further broken down using the employment data to illustrate the impacts of specific key industries should there be a disruption in the selected cluster. The chart shows that this specific cluster would affect a high proportion of the high-priority industries in the region, with the exception of health care. This information could be further used by planners to make decisions regarding route planning to help alleviate disruptions to these key industries.
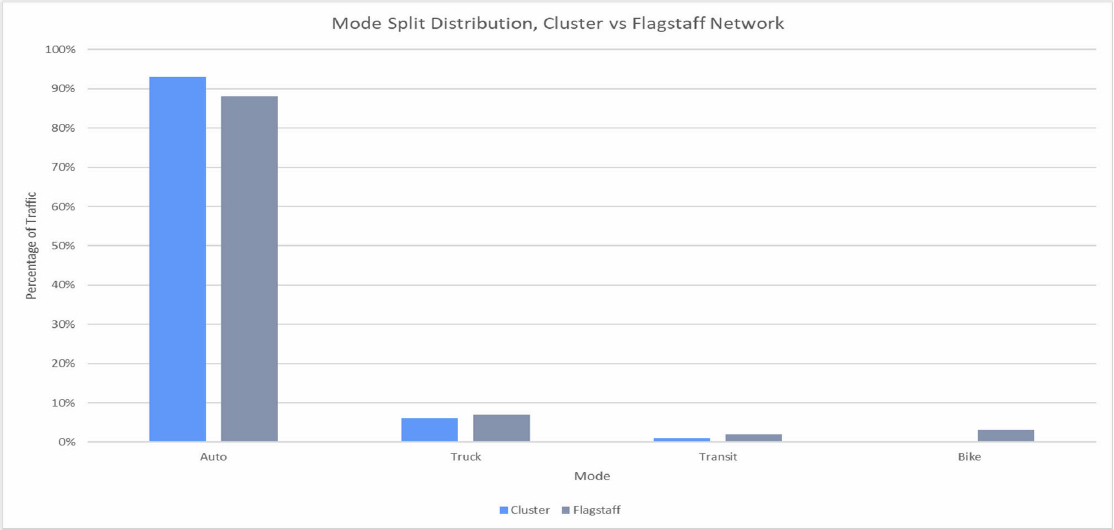
The second example of how the cluster might be further analyzed focuses on mode distribution, as shown in Figure 29. As expected, a high percentage of the trips flowing through the cluster are automobile-based, and a relatively low proportion of trips are made by other modes. Another observation from the analysis is that a greater proportion of automobiles use the selected critical links than is typically seen on the network as a whole. This result emphasizes the importance of the links within the cluster to the mobility of the network.
The third example focuses on socioeconomic information derived from the cascading-effect analysis. Figure 30 shows the mean income of the TAZs affected by the critical links, and it also shows that the highest volume and highest sensitivity zones have the lowest median income. This discovery could lead to additional studies regarding equitable solutions should a disruption occur.

Finally, Figure 31 identifies the percentages of the population by sensitivity and volume that may be affected by a potential disruption on the selected critical links. Approximately 67% of the population residing in the affected TAZs are considered high volume, but of those, only 31% are considered high sensitivity.

The examples illustrate how the cascading-effects model can be expanded using existing data sets to provide additional insights that could help practitioners find details that may provide additional contextual clues regarding a study area for resilience planning purposes.
Critical locations
The cascading-effect analysis helped identify several key facilities and areas within Flagstaff that could be potential trouble areas should a disruption occur (see Figure 23). As would be expected, the interstates were identified as critical links in the network. Because of prevailing geography and terrain, I-40 is a major east–west route through Flagstaff. The cascading-effects model provided clear evidence that any disruptions to that facility could be costly for those traversing the city. Similarly, I-17 provides access to the southern portions of the city. The analysis also identified several links along this interstate as critical to the network.
In addition, multiple arterials were identified as critical to the network. Those arterials include Milton Road and US 180, both of which provide north–south access in the western portion of Flagstaff. These facilities are in proximity to the Flagstaff Medical Center, a high-priority job center. Finally, Historic Route 66 is another east–west connection that was identified as a critical arterial by the cascading-effects model. It serves as the primary surface street and is host to many local businesses and services in the Flagstaff region. It also serves as a primary transit route in the Mountain Line
System. Potential disruptions to this facility would create difficulty accessing those services for residents and visitors.
These results align closely with the discussions documented earlier with the Flagstaff MPO planner. The interstates and arterials identified by the cascading-effects model closely correlate with key industries and sectors identified, including Northern Arizona University and the various medical facilities located throughout the Flagstaff region.
Conclusions
Based on the findings of the cascading-effects model and a conversation with the Flagstaff MPO, it appears that the results of the analysis closely aligned with the concerns and priorities of the local planning agency. The model identified several key facilities, which were also identified by the local planning agency as critical areas within the Flagstaff region. It is clear that the cascading-effects model could provide information that would be valuable to local planners as they consider the resilience of their regional transportation network. Some information that could be derived from the analysis includes employment distribution, travel mode split, socioeconomic information, and beyond. While the cascading-effects model can broadly identify critical areas, it can provide insight and identify specific areas of need. Thus, these areas could be further studied to identify potential solutions to strengthen the resiliency of the regional transportation network.


