Resilience in Transportation Networks, Volume 2: Network Resilience Toolkit and Techniques (2024)
Chapter: 7 Robustness & Recoverability Modeling for MPOs and Statewide Networks
7 Robustness & Recoverability Modeling for MPOs and Statewide Networks
As part of the NCHRP 20-125: Incorporating Resilience into Transportation Networks investigation, three test cases were identified for the testing of network resilience tools design during Phase I of this project. Flagstaff, Arizona; Atlanta, Georgia; and Illinois’ statewide freight network were identified for pilot-testing network resilience tools. With different sizes, population, transportation network characteristics, and types of disruptions, these three case studies provide a wide variety of challenges for implementation, data needs and analyses, and interpretations of results. As a result, they provide helpful guidelines and lessons for MPOs and DOTs intending to implement the robustness analysis tool. Site testing includes working with local stakeholders, integrating local models and data, and developing processes for engagement which will enhance network resilience capacity. This report documents the process, analysis, and results for the network robustness methodology applied to these three case studies.
Key terms and definitions:
- Transportation network: physical infrastructure composed of roads and road connections that supports the mobility of people and movement of freight.
- Links: roads in the transportation network.
- Nodes: juncture points in the transportation network such as street intersections and road merging points.
- Disruption: corresponds to making a node (or link) in the network unable to move people and freight through it. For example, when a segment of highway is closed due to an accident.
- Iteration: a complete cycle of disruptions to the network that drops its functionality to zero.
Description of the Test Sites
Flagstaff, AZ
Located about 100 miles north of Phoenix, the city of Flagstaff, AZ is home to about 73,000 people. The most common disruptions include wildfires and other natural disasters. These disruptions affect the population centers and businesses around the city. The largest employer in Flagstaff is Northern Arizona University and other large employers include hospitals and facilities related to medical care. In terms of freight transportation, Flagstaff does not have critical manufacturing facilities, but it does constitute a passing point for Interstate 40, a major east–west highway running from Barstow, CA to Wilmington, NC, and Interstate 17, which connects Flagstaff to Phoenix. Hence, the traffic through the city can have statewide impacts in Arizona and across the western United States. Finally, touristic attractions for outdoors and skiing in the area represent a substantial source of income for the city.
In 2022, the closure of Highway 89 and several local streets produced major delays to the inhabitants of Flagstaff. Commuters in the city of Flagstaff increased travel times by approximately 30 minutes.
Atlanta, GA
The Atlanta-Sandy Springs-Alpharetta metropolitan statistical area is the eighth most populated MSA in the country. Main arterials include Interstate 285, Interstate 85, Interstate 75, and Interstate 20. These are among the most traffic-heavy roads in the region and the country.
In 2014, a snowstorm forced commuters to leave 10,000 vehicles abandoned on the roads. Heavy precipitation and high heat account for most of the Atlanta region extreme weather events. These extreme weather events impact commuters and freight traffic by impeding accessibility or imposing high costs of transportation.
Illinois
With more than 1.2 billion tons of combined freight, 116 airports, and 16,000 miles of roadway, the state of Illinois is one the most important freight hubs in the United States. Illinois is considered “one of the nation’s premier logistics hubs because of its strategic location and access to multimodal transportation infrastructure.”42 The value of freight traveling through Illinois in 2018 totaled almost $3 billion.
___________________
42“Illinois State Freight Plan,” Illinois Department of Transportation, June 2018, https://idot.illinois.gov/Assets/uploads/files/Transportation-System/Reports/OP&P/Freight/IDOT_Freight_Plan_ExecSummary_v9.pdf
Critical Infrastructure and Most Common Disruptions
Flagstaff: Challenges of a College Town
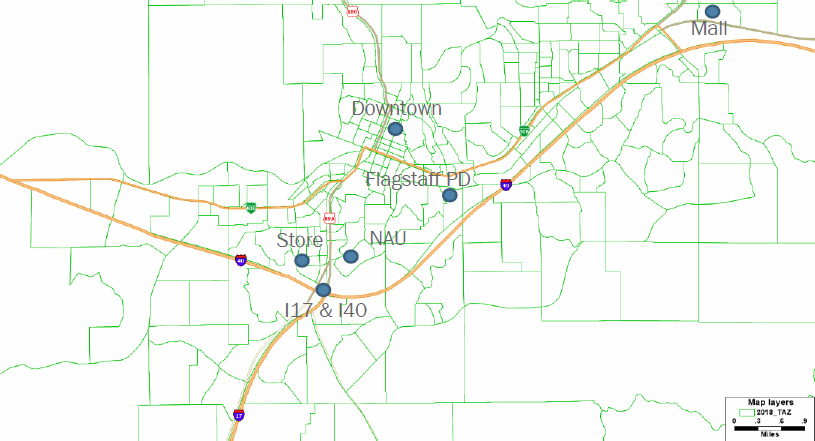
The city of Flagstaff has a very unique shape. U.S. Highway 89 grants access to the city from the northeast. U.S. Highway 180 runs through the central business district from the northwest. Interstate 40 runs east to west just south of downtown. And Interstate 17 provides a direct route from Phoenix to the south into central Flagstaff. I-40 and I-17 share a substantial segment around Flagstaff. Worth mentioning are Northern Arizona University, a number of stores, population centers, in public services such as the police department, fire department in others.
The most common disruptions in the city of Flagstaff correspond to road closures. Any closure of the highways entering the city or its major arterials produces substantial disruptions to traffic flows and travel times. Figure 115 shows a map of Flagstaff, including all the entry points and point of interest inside the city.

Atlanta: Activity Centers in a Large Metro Area
There are more than 2,500 bridges in metro Atlanta. Around 5% of these bridges were reported deficient by TRIP, a national transportation research nonprofit. A prominent example of the potential impacts of such disruptions occurred on March 30, 2017. On this date, construction materials stored under the bridge caught on fire, causing a portion of the I-85 bridge to collapse. The repairs of the bridge took 43 days, affecting commuters and freight flows. With traffic volumes of more than 250,000 vehicles per day, the collapse produced major delays and thousands of commuters were forced to find alternative routes.
The most common disruptions in the Atlanta metro are weather related. It is also possible to have disruptions due to the large number of bridges in the region, as shown in the 2017 I-85 bridge collapse. This implies that a random representation of disruptions is appropriate to capture a wide variety of scenarios and produce helpful insight regarding the performance of the transportation network. However, it is possible to test the robustness of the network subject to targeted disruptions by deleting specific nodes (or links) in the network. A common approach is to consider high volume links in the network and observe the new traffic assignment. Similarly, it is possible to delete nodes representing intersections with several incoming links and few alternative routes. This probably represents the worst-case scenario for planning a disruption: high convergence without alternatives.
Illinois: Freight Corridors and Trade Centers
In terms of disruptions, the state of Illinois’ most common events include storms, extreme heat, and drought. Floods cause road and rail closures, utility outages, disruptions in freight traffic, sewer overflow, and other transportation related disruptions. Heat waves affect individuals in the form of illness, hospitalization, and death. Extreme heat also can damage infrastructure and produce drought impacting the agricultural sector, water supply, and natural areas.43
Illinois’ freight infrastructure includes an extensive multimodal network of roadways, rail, airports, waterways, and ports. The port of Chicago is one of the largest freight ports and freight hub in the country. Hence, Cook County, which includes Chicago, represents the top origin and destination of cargo by weight and value in the state. Cereal grains, coal, and agricultural products top the list of commodities originating in the state, followed by animal feed and fuel oils.
Since 2018, the state of Illinois put forward five network development strategies to help the freight system grow. The strategies are:
- Establish district and corridor programs,
- Assure supply chain fluidity,
- Continue multimodal programs,
- Cultivate public-private partnerships, and
- Provide truck parking.
Among these strategies, assuring supply chain fluidity is the closest related to NCHRP 20-125. Supply chain fluidity is a function of the routes, connectivity, and capacity of the network. Connectivity is the metric utilized when analyzing the robustness of the network in the methodology described in this report.
The most common disruptions in Illinois correspond to road closures due to flooding, construction, and weather-related events. Closure of major highways traversing the state can produce substantial disruptions to traffic flows and travel times. However, it is important to note that the transportation network in Illinois contains major highways that ensure the availability of routes connecting the state.
___________________
43“Plan for Climate Resilience,” Chicago Metropolitan Agency for Planning, n.d., https://www.cmap.illinois.gov/2050/environment/climate-resilience.
Network Preprocessing
The resilience of a transportation network is its “ability to prepare and plan for, absorb, recover from, and more successfully adapt to adverse events” or disruptions. Preparing, planning, and, more specifically, the capacity to absorb the effects of disruptions can be quantified using robustness analysis. A network exhibiting appropriate robustness will be able to maintain functionality when some components of the network stop working either completely or partially. This methodology allows the quantification of robustness by simulating consecutive disruptions to the transportation network until its functionality drops to zero. A perfectly robust network would lose only the component that has been affected without interruption to the rest of the network. This would be equivalent to, for example, having every home in a community with its own power generation, storage, and distribution. When one home loses electricity, the rest are not affected. While this might seem an “ideal” situation, it would impose great economic costs. On the other end, a network with little to no robustness would face catastrophic failure when a single (or a handful of) component fails. Obviously, this is not ideal. Transportation planners, policy makers, and private sector need to aim at finding the balance between cost reduction and robustness of the network.
The objectives of this study are to 1) provide a methodology for quantifying robustness and 2) apply the methodology to the cases of the Flagstaff, Atlanta, and Illinois. As part of the application of the robustness network analysis to each case study, key findings are worth mentioning related to the reduction of the network and interpretation of results.
Flagstaff
Being a city of 79,000 inhabitants and a network with about 4,000 nodes and 10,000 links, Flagstaff is a relatively small network for transportation planning purposes. However, for an optimization model these can be significant numbers. The preprocessing of the network requires identifying points of interest within the city and routes connecting them to the highway system. Places such as malls, large stores, and public services are relevant.

For the analysis of robustness of the transportation network from a strategic planning perspective, it is recommended to analyze the city in terms of its points of interest, key routes, and entry points. Flagstaff has six main entry points for automobiles and trucks. This can potentially produce issues of traffic congestion, delays, and lack of connectivity.
Atlanta
The first approach to analyzing the ARC network considered the use of the entire urban transportation network. This corresponds to more than 17,000 nodes and a total of almost three hundred million origin-destination pairs. It is infeasible to input a network of this scale when analyzing the robustness of the network using an optimization model at the core of the methodology and it is impractical for the analysis of strategic planning decisions. It suffices to say that modeling a single disruption to a network with a grid of 400 by 400 nodes, 16,000 nodes total, takes almost one hour to solve using state-of-the-art optimization software. Considering that the optimization needs to be repeated every time a disruption occurs, the complexity of the network makes execution times prohibitively long.
In the case of Atlanta, the livable centers initiative that uses 165 activity centers as a unit of analysis provides the right level of aggregation to obtain rich analysis and reasonable network size. The role of the transportation network in connecting the activity centers allows the analysis of strategic planning decisions such as the reinforcement of specific nodes in the network or the need for alternative routes between nodes.
Illinois
Considering the entire state road network is inappropriate from both computational and application standpoints. From a computational standpoint, the city of Chicago, the largest in the state and one of the most important ports in the country, represents an intricate transportation network that is very expensive to store, manipulate, and visualize. On the other hand, the objective applying the methodology is analyzing the robustness of the network, not traffic operation management. Hence, there is no need to include every intersection and street in the analysis. Instead, only the most relevant routes and destinations are necessary. The preprocessing of the network requires the identification of points of interest within the state and routes connecting them to the highway system. Only major population centers and connecting routes are of relevance for this study.
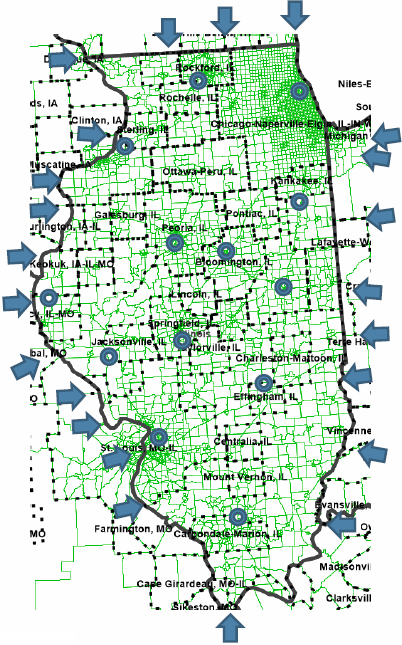
For the analysis of robustness of the transportation network from a strategic planning perspective, it is recommended to analyze the state in terms of its points of interest, key routes, and entry points. For the purpose of this report, 24 entry points from the states of Wisconsin, Iowa, Missouri, Kentucky, and Indiana have been considered.

Network Data
Points of Interest in the City of Flagstaff
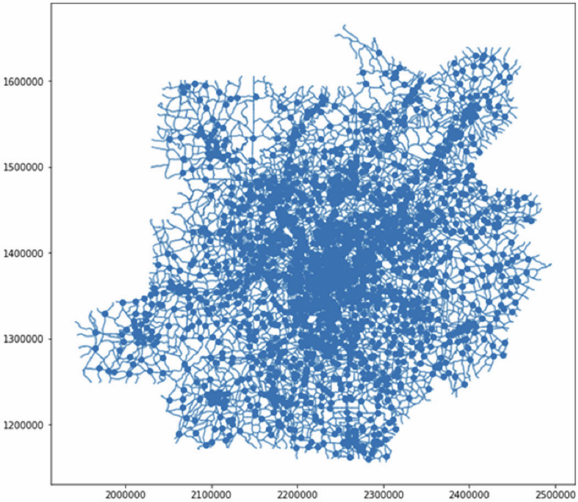
Figure 121 shows the transportation analysis zones (TAZs) in Flagstaff, AZ. One approach is to consider all TAZs in the city to perform the connectivity analysis. An alternative approach includes identifying points of interest, then finding the set of routes that connect these points within the city and creating a network from them.
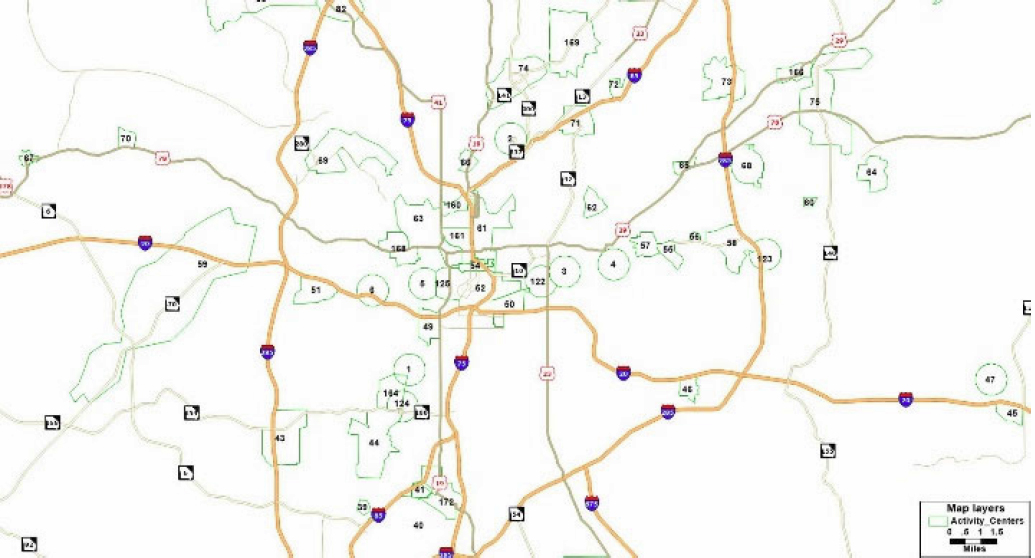
Activity Centers in the Atlanta Regional Commission (ARC)
Developed by the Atlanta Regional Commission (ARC), the activity centers indicate geographic locations that concentrate commerce, population, and relevant activities located within the 20-county Atlanta region as shown in Figure 122 below. The activity center areas were digitized in (ArcGIS) ArcMap based on the orthophotography of traditional municipal downtowns and significant regional centers. In total, 165 activity centers are included.
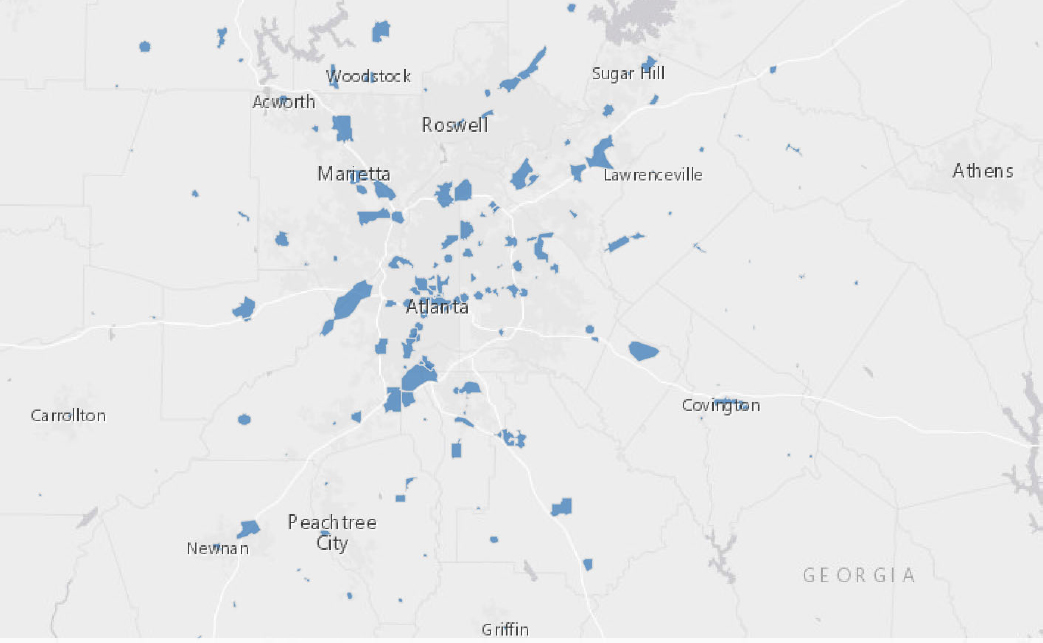
Source: Research & Analytics Division of the Atlanta Regional Commission
When measuring the robustness of a transportation network, it is important to consider the operation of the transportation network in the presence of the mobility patters in the study region. Mobility patters such as traffic flows, freight trip generation, or large traffic generators are of relevance in the analysis of robustness. For example, a network considering large traffic generators and freight patters is suitable to understand the role of the transportation network in supporting commercial supply chains. In this case, disruptions represent the drop in functionality of, for example, the port or a warehouse. In the case of Atlanta, the transportation network supports a large metropolitan area. The activity centers represent a suitable level of analysis for strategic planning decisions. Figure 123 and Figure 124 show the region, the activity centers, and the transportation network considered.


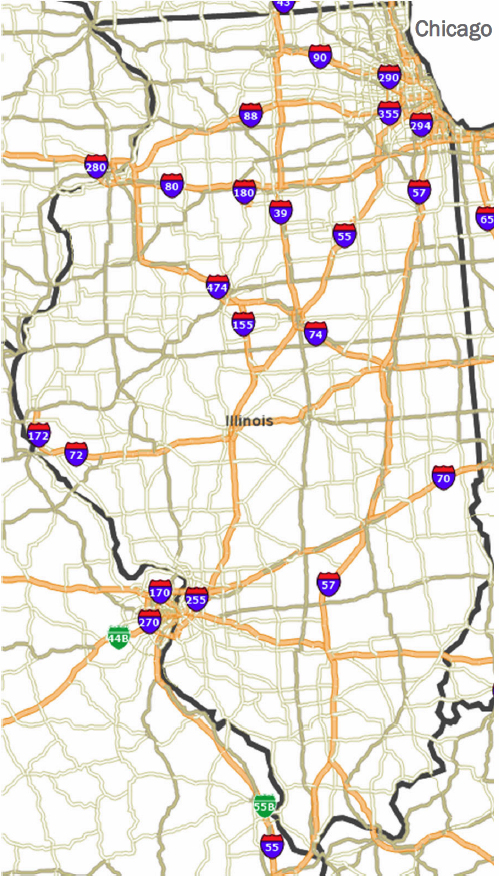
Illinois Freight Corridors and Trade Centers
Figure 125 shows Illinois, the 23 entry points to the state, and some of the points of interest inside the state. In total, 67 nodes and 245 links were considered for the analyses.
Procedure
The modeling of the area under analysis considered all major highways entering as entry points of flow and the transportation network connecting the points of interest as nodes in the network. The network robustness analyzes the connectivity between the entry points and the center of the city. However, the evaluation can use different performance metrics such as freight flows or traffic assignment. The method uses four steps in a loop until the performance metric drops to zero:
Step 1: Reduce the network to a size that is reasonable for optimization purposes. Key considerations include, but are not limited to, considering major arterials, avenues, and streets, identifying points of importance inside the region under analysis (e.g., ports and seaports, freight hubs, airports), and connecting the network to the nation’s highway system.
Step 2: Determine the performance metric to use. Options include:
- Connectivity in the network (i.e., the capacity to reach points of importance from entry points to the networks),
- Traffic flows assignment, and
- Freight trip generation.
Step 3: Create a disruption of the network. A disruption can be a deletion of a node or a link in the network. In addition, the selection of the node to disrupt can be random or targeted. A random disruption of the network best represents natural disasters while a targeted disruption can represent a terrorist attack or worst-case scenario planning. For the latter, it is possible to use a ranking of nodes according to measures of network importance such as the number of links that converge to the node (i.e., node incidence).
Step 4: Recreate the new state of the network considering the disruption and repeat the steps until the performance metric drops to zero (or a level that makes the network unusable).
Step 5: Analysis of results. This includes identifying the nodes in the network that produce large drops in functionality. A helpful illustration of the performance of the network is shown in Figure 126 below. This figure shows the drop in functionality of the network in the vertical axis and the number of disruptions affecting the network in the horizontal axis. The figure shows that drastic drops in functionality occur as a consequence of losing a specific node in the network. It also shows the magnitude of the loss. A perfectly resilient network would show a 45-degree decaying drop in functionality. This implies that when a single disruption occurs only the node destroyed becomes unusable; the network is absorbing the impacts of new disruptions in an optimal manner.
Steps 1 to 4 should be repeated for consistency purposes. It is important to note that multimodal networks can be evaluated by modifying the attributes of the network and the function of performance under study. Changing the attributes of, for example, a seaport versus a network hub will allow the tool to account for multimodal transportation networks. Then, multiple resilience strategies and networks can be compared. The network robustness tool allows a graphical representation of the destruction of the network when disrupted.
Results
Flagstaff
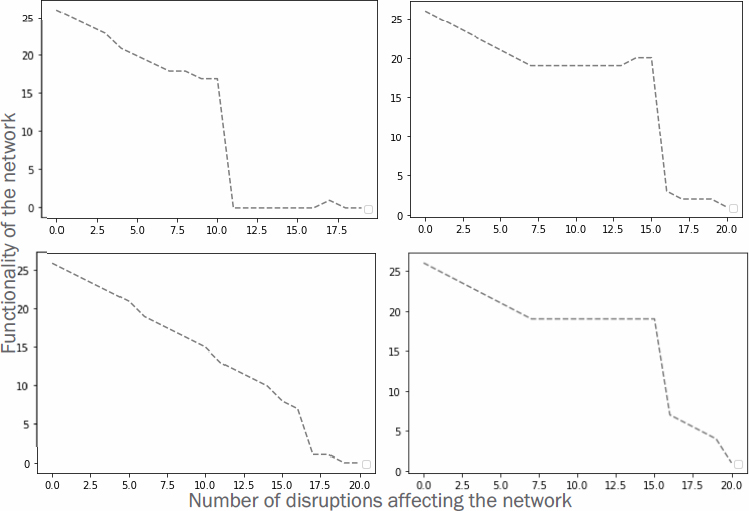
As an introduction to the analysis of robustness, the figures below show the results for the analysis for four iterations of the process (see Figure 127). The vertical axis represents the performance metric of the network, connectivity. The horizontal axis shows the number of disruptions performed. The number of disruptions can be thought of as time between events or consecutive node disruptions in the network. In addition to this, the research team recorded the nodes that are disrupted to map the drop in functionality. Several things are important to highlight:
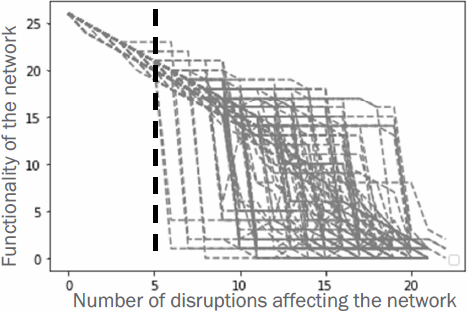
- The network is fully destroyed between ten and 15 disruptions for most scenarios. There is only one instance in which the network exhibits a robust behavior in the bottom-left graph. Figure 128 shows 100 iterations of the destruction process. This figure shows that there is a fraction of iterations that will destroy the network in as little as five disruptions (marked with the vertical dashed line).
- The results show the existence of a handful of nodes that drop the connectivity considerably. This happens in as few as five disruptions on the network. That is a small number of disruptions to have such a large impact on the network and implies that the Flagstaff network is prone to lose its connectivity.
- The results are consistent with the size of the network and the limited number of routes, and the fact that there is only a handful of five points to the city.
Network Modifications to Increase Robustness
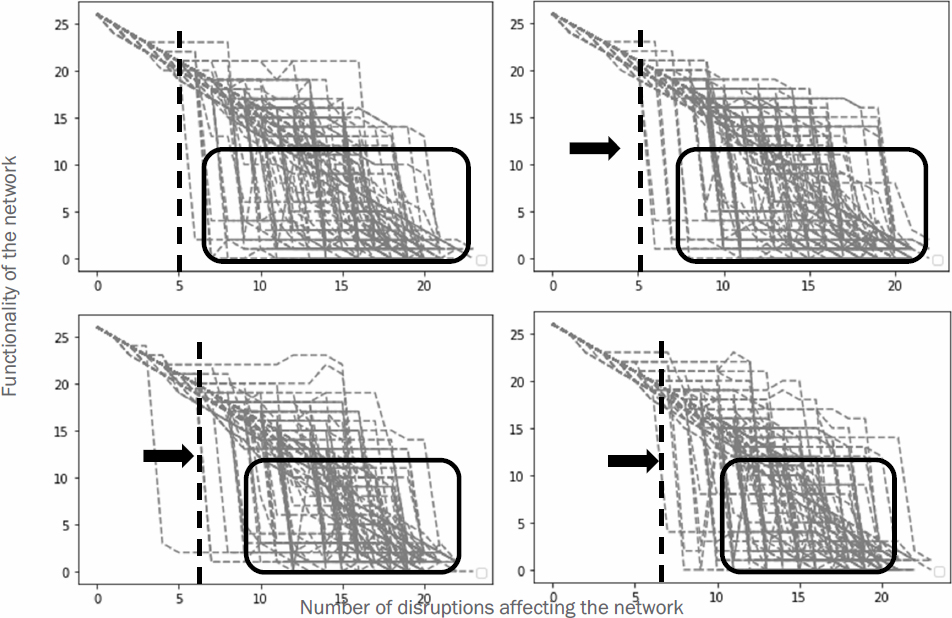
The following modification were made to the network:
- Addition of route connecting I-40 to city center (top left)
- Addition of route connecting I-40 with the Walmart south of Flagstaff (top right)
- Addition of route connecting I-40 to city center (bottom left)
- Additional of two alternative routes to enter the city from I-17 in the south (bottom right)
Two important results are worth mentioning:
- The number of disruptions that produce catastrophic failure on the network moves consistently to the right as the improvements to the network help increase connectivity. In other words, there are fewer iterations in which the network fails as a consequence of the additional routes.
- The variability in performance of the transportation network, visually represented by the black rectangle, moves to the right (better performance) and compacts. In other words, the network exhibits a more predictable (and improved) performance. What is not desired is a network that will dramatically vary its functionality for different iterations.
Atlanta
Figure 130 shows the results of the analysis of four different scenarios, each with 50 disruptions. The analysis in the case of Atlanta is different than before. Instead of looking for the robustness of the entire network, the purpose is to identify critical nodes in the network. In addition to registering the number of disruptions that occurred in the network, the research team recorded the nodes that are disrupted to map the decline in functionality. Several things are important to highlight:
- The network is fully destroyed at around 30 disruptions for most scenarios. This represents about 20% of the network. The beginning of the random disruptions, however, exhibits a relatively flat decreasing grade. This represents an acceptable performance because it shows that the network in ARC is capable of absorbing consecutive disruptions without dramatic decline in functionality. This is true until some specific nodes are destroyed.
- Consistently, there is a handful of nodes that drop the connectivity considerably. This happens in as few as 15 disruptions on the network. This does not represent a large number of disruptions for an area like Atlanta. Hence, it is important to address potential issues with key pieces of infrastructure.

When analyzed, the nodes that produce the most damage to the performance of the network correspond to the intersections between major transportation highways. As shown in Figure 131, the blue dots marking intersections to the north and south of downtown Atlanta (node 52 in the ARC model) create major disruptions for the intermodal transportation network.

Illinois
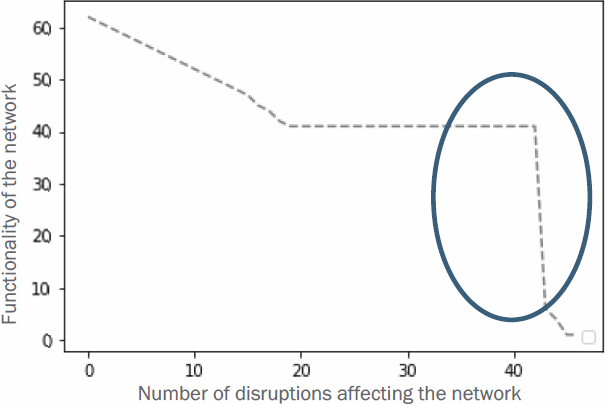
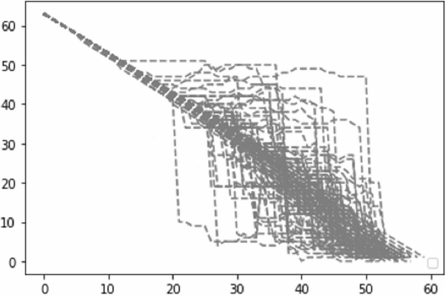
The case of Illinois represents a network exhibiting robust performance. Figure 132 shows that the performance of the transportation network in the state of Illinois is very much aligned with the 45-degree downward angle. The research team ran 100 iterations of the method and received consistent results.
Conclusions
Flagstaff, Atlanta, and Illinois offer a diverse perspective on the analysis of robustness for the transportation networks. The sizes and characteristics of the three networks are very different.
Flagstaff is a relatively small area, with as few as five entry points. This makes the network vulnerable to disruptions. This is mainly due to the lack of redundancy in the transportation network of the city. For example, the closure of I-17 going south would require traffic to be diverted through smaller roads in rural areas or take a substantial detour to connect to I-40 on the east or the west. Downtown Flagstaff can be accessed from north, south, and east using local roads. This means that, again, any road closure will increase travel times and produce delays. The analyses in this report showed the steps that can be taken to improve its performance. Results show that by adding alternative routes north, west, and south of Flagstaff would increase produce such improvements on the network.
In the case of Atlanta, the research team identified two critical areas in the region: north and south of the city in the intersections of I-85 and I-75, and I-85 and I-20, respectively. The main recommendation in this particular case would be to prioritize the recovery of disruptions happening in these areas. Finally, Illinois showed good results in terms of network robustness.
The main challenge when running this model is to identify the right performance metric and running the iterations for the model. In terms of analysis, the robustness model allows to determine the performance of the network under consecutive disruptions. As part of the analysis, a number of improvements to the network allow to enhance its robustness by decreasing the probability of catastrophic failure and increasing the predictability of the performance of the network.
It is important to consider that modern supply networks work in tandem with other support infrastructures. Along those lines, it would be beneficial to extend the analysis to multiple networks. However, this requires the identification of dependencies and interdependencies between the interacting networks.


