Resilience in Transportation Networks, Volume 2: Network Resilience Toolkit and Techniques (2024)
Chapter: 3 Cascading Effects of Disruptions on Large Urban Networks
3 Cascading Effects of Disruptions on Large Urban Networks
3.1 Cascading Effects Atlanta Demonstration (Recipe)
Objective
Two test sites were chosen for resilience analyses: Flagstaff and the metropolitan Atlanta region. Identifying the most critical links from a resilience standpoint is the most important discussion when looking at Atlanta. The Atlanta metropolitan region was chosen because it is one of the largest metropolitan areas in the United States and has a mix of travel modes. With approximately 6 million residents, and depending on the functionality and availability of links within the area, cascading effects can create monumental issues. Some community issues that can arise from these cascading effects are impacts on transit access and ridership, the difficulty of emergency services to operate efficiently, walkability via transit to walking destinations, and many more.
The analysis that was performed can help transportation planners, agencies, and departments adopt resilience strategies in their short-range and long-range plans.
Data
The Atlanta Regional Commission’s (ARC) activity-based travel demand model (ARC ABM) was used as the primary source for the overall analysis of the test site. The modeling region contains 5,922 TAZs in 21 counties, and the year 2020 travel demand model was used for this analysis. The site analysis was split into two phases. In Phase 1, important links within the modeling region were identified, and the concentration of those important links was identified to select the area. Upon the selection of the area, Phase 2 began. Because link failures can create cascading impacts on nearby connected infrastructure, links were evaluated and compared based on the impacts they create if they fail. Critically impacted zones are identified if all links become inactive due to failure. Moreover, the Phase 2 analysis explored and identified impacts on transit ridership.
Software used to complete the analysis includes Microsoft Suite Products, such as Microsoft Word. Other software used in the analysis is Citilabs’ Cube and ESRI’s ArcMap. R was used for statistical computing and analysis. Data for the analysis include:
- ARC Activity-Based Travel Demand Model - Primary Source for roadway link information
- Network attributes such as link speed, travel time, roadway capacity, volume-to-capacity ratio
- Origin-destination trip tables
- Origin-destination skim tables (travel time and distance)
- Socioeconomic data that included population, households, and employment
- Transit data – Transit stop locations with ridership statistics, specifically boardings and alighting
Procedure
Phase 1:
Step 1: Screen highway links in the entire model region. Create sets of criteria that represent link characteristics.
- Total number of vehicles
- Volume-to-capacity ratio (VC ratio)
- Transit links
- Truck volumes
- Ramps
- Externals
- River crossing links
Step 2: Develop a normalized score for each link to create a composite score.
- Data was collected for the relevant criteria in each link in the network. Then for each link, a normalized score was developed for each criterion, then combined into a composite score. The procedure to reach this composite score is below.
- The maximum daily volume within all the links was selected for the total number of vehicles. The volume for each link was then divided by the maximum volume. A score between 0 and 1 was then generated for each link.
- The maximum VC ratio was estimated for the volume-to-capacity ratio (VC ratio). The VC ratio on each link was then divided by the estimated VC ratio to generate a score between 0 and 1 for each link.
- For transit links, all highway links that have transit service were selected and assigned a score of 1. The rest of the links were assigned a score of 0.
- For truck volumes, the top 25 percentile links were selected. Those links received a score of 1, and the rest of the links were assigned a score of 0.
- For ramps, ones located within the modeling region were assigned a score of 1, and the rest were assigned a score of 0.
- For externals, if they are connected to interstates or major roads connecting to regions outside of the modeling area, they received a score of 1. The rest received a score of 0.
- The composite score was calculated as = ∑ (Scorecriterion 1 × Weightcriterion 1)
- Weight is equal (1/7) = %14.3
- Compare links within each functional classification.
- Consolidate into three major categories under the new name “FC_NEW.”
- Interstates/Freeways
- Arterials
- Collectors
- Highlight the top 250 links within each of the three new functional classifications.
Phase 2:
Step 1: Identify the zones each link serves and what activities occur in those zones.
- Divide into the following steps:
- Identify the origin and destination zones of the trips that pass through the link and develop an origin-destination (OD) trip matrix.
- Develop a composite score for each link based on the origin and destination trips in each zone and the activities in that zone.
- It is possible to simplify the process by developing a daily assignment script and running the assignment with fewer than 200.
- Combine all modes to develop a total trip table. For each zone, average all OD trips to calculate and then export.
Step 2: Allocate the select link trips in proportion to zonal activities.
- Eight categories of employment.
- Calculate each zone’s share of each of the eight employment categories.
- Allocate trips by zone calculated in the previous section to the employment categories in proportion to their shares.
Step 3: Develop composite scores and ranking.
- Weights for each category are kept equal %12.5(1/8)
Composite Score = ∑ (Scoretrip_emp_cat × Weightemp_cat)
- Develop final rankings by combining the scores from Phase 1 and Phase 2 using the weighted average.
Step 4: Measure impacts to find cascading impacts:
- Analyze which zones are critical and get impacted:
- Use results of the select link analysis of the eight links in the selected area.
- Combine OD trips from all eight links.
- Calculate the average of OD trips to estimate trips by each zone.
- Categorize zones into low and high trips, and low and high sensitivity areas.
- Calculate 75 percentile threshold value from all zones that contain trips passing the area (one or more of the eight links).
- Zones that have trips less than the threshold value are low volume zones, and ones that have trips more than the threshold value are high volume zones.
- Aggregate employment into low and high sensitivity employments.
- Categorize high sensitivity employment values to categorize the zones into lower high sensitivity areas.
- Use the 75-percentile threshold to calculate high sensitivity employment from zones containing select link trips.
- Categorize into four categories:
- Low volume, Low sensitivity
- Low volume, High sensitivity
- Categorize into four categories:
- High volume, Low sensitivity
- High volume, High sensitivity
Step 5: Grab data from the ARC model for three access modes:
- Park and Ride (PNR)
- Kiss and Ride (KNR)
- Walk
- Combine daily PNR, KNR, and walk trips from each zone to Lindbergh Station.
- Calculate trips based on the station-to-station flows from Lindbergh Station.
- Analyze the impact on transit access and ridership.
Validation
Reviewing data to be sure it is correct can be one way to check for validity and relevance. Speaking to local planners – and even residents – can be a way to ensure relevance. Anomalies can occur within GIS analysis and data analysis, so these should be checked for accuracy. Checking in with local planners goes a long way to ensure accurate information and data. Moreover, hunting for additional data or multiple analysis approaches ensures enough context and information are provided.
Results
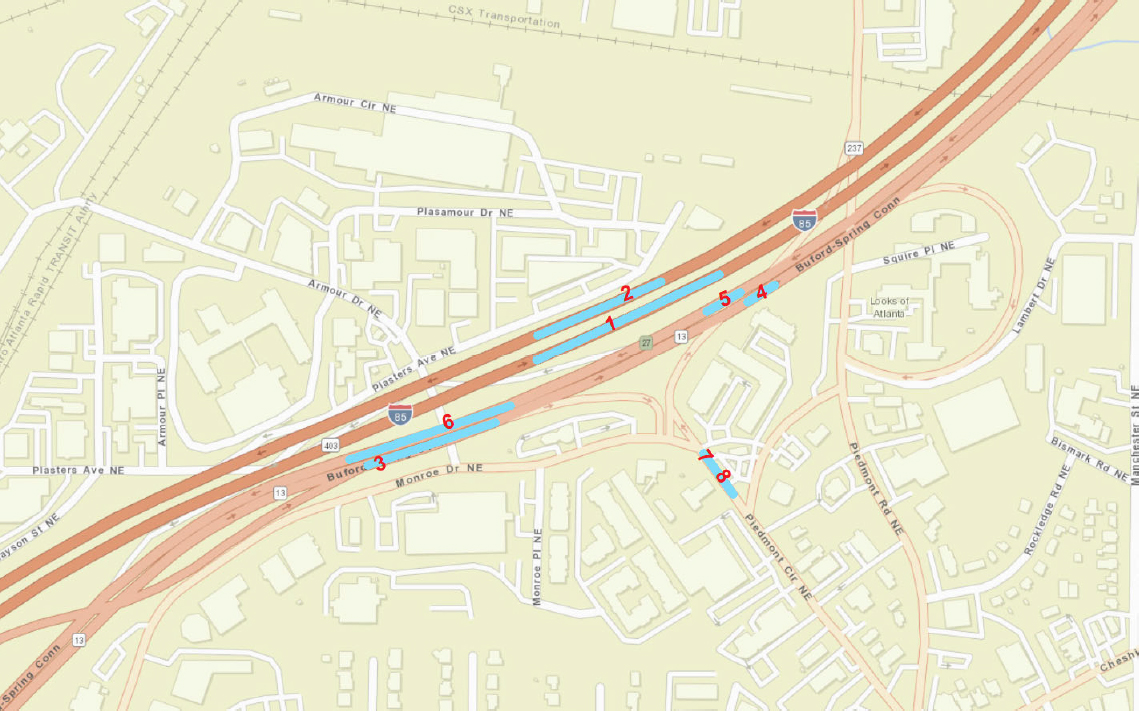
- As a result of the composite scores from links based on zonal activities, the link importance rankings are highlighted in the map below (Figure 9). These important links are located primarily on the Northeast Expressway (I-85) and the Buford Spring Connector. The importance rankings are expected as I-85 is one of the busiest interstate connectors in the United States.
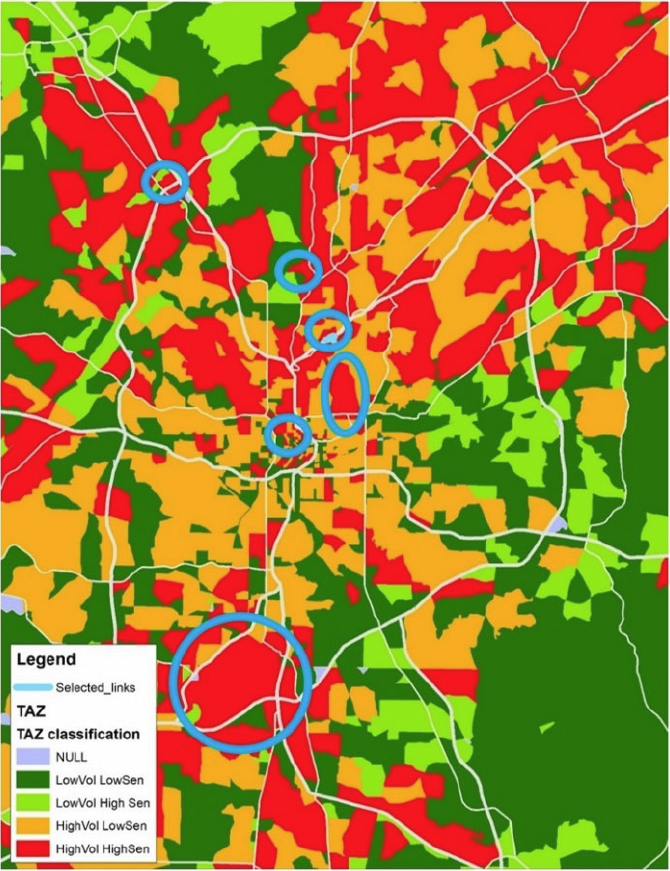
Based on the calculations above, areas with low volume/low sensitivity, low volume/high sensitivity, high volume/low sensitivity, and high volume/high sensitivity were determined in Figure 10.
Figure 10 shows a concentration of high volume/high sensitivity TAZs near the center of Atlanta, with a preponderance of low volume/low sensitivity TAZs as you move away from the central business district. It is also worth noting that areas along major highways appear to have consistently higher volumes and higher sensitivities, particularly along I-85 to the northeast.

Figure 11 highlights the combined PNR, KNR, and walk trips from each to Lindbergh Station.
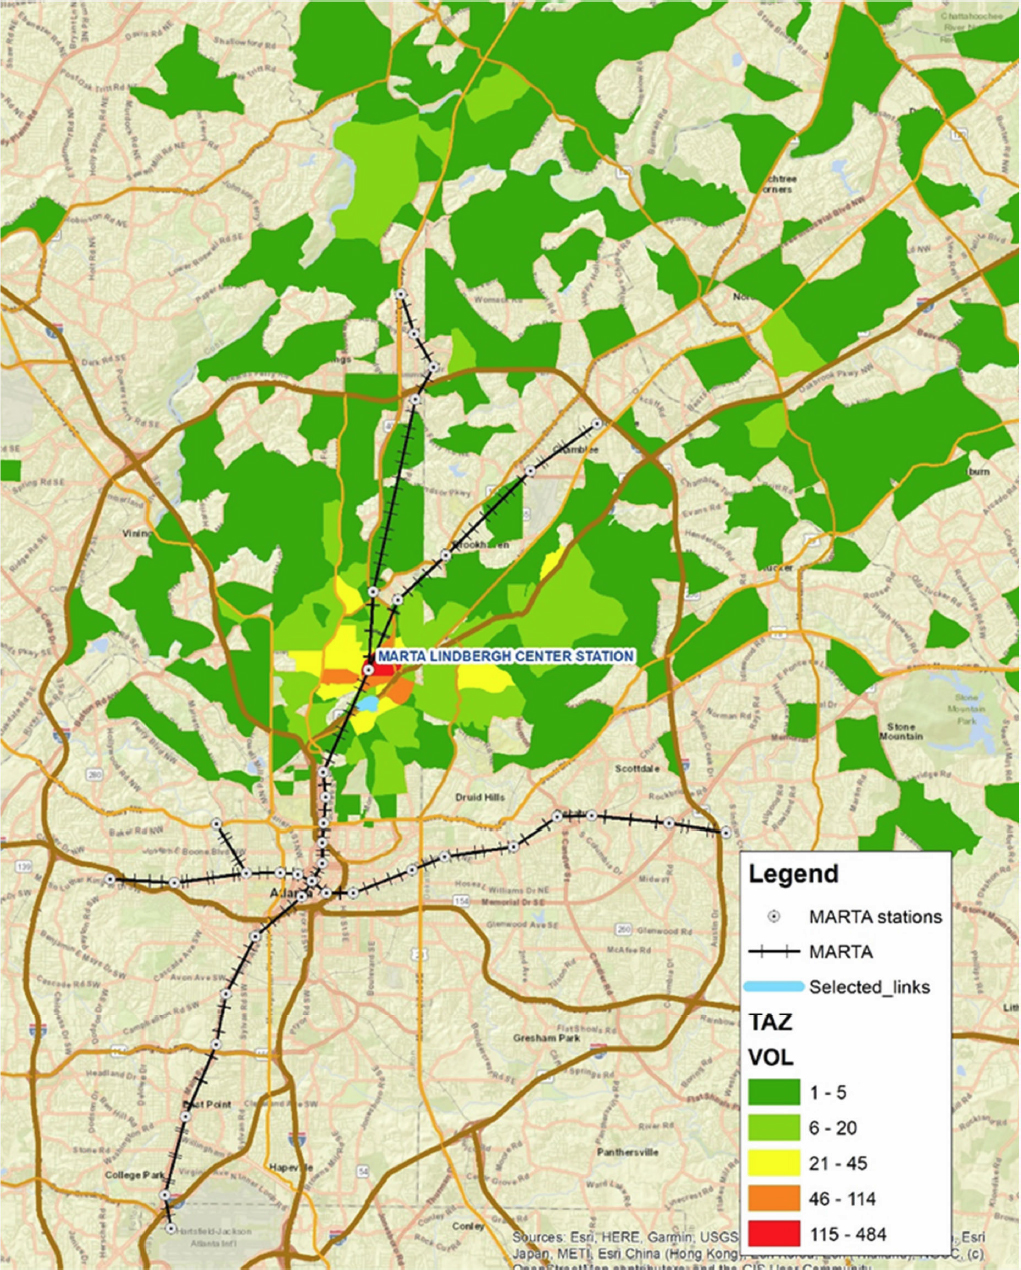
Zones located closer to Lindbergh station have more volumes and gradually diminish as zones get farther away from the station.
Conclusion
The methodology used to study the Atlanta Regional Commission area was sufficient in its findings for the relevant analysis. The sourced data is accurate and provides a clear understanding of link criticality, cascading impacts, and highlights which zones are impacted the most. One of the main challenges in this case study is ensuring that the data is relevant.
3.2 Cascading Effects Atlanta Applications (Context)
As part of the NCHRP 20-125: Incorporating Resilience in Transportation Networks investigation, three cases were identified to test network resilience tools. The Atlanta Regional Council was identified for pilot-testing network resilience tools. Testing includes working with local stakeholders, integrating local models and data, and developing processes for engagement that will enhance network resilience capacity. This document will share the results from our stakeholder outreach and the findings of our test case in Atlanta, Georgia.
Community Resilience Challenges
Extreme weather events are some of the most important resilience issues facing the Atlanta region. For example, a severe snowstorm in January 2014 significantly impacted the region’s transportation infrastructure, including over 10,000 vehicles abandoned on public roads. Other important climate-related issues in the region include an increased frequency of heavy precipitation and extreme heat events. These extreme weather events can impact numerous sectors of urban and transportation infrastructure. Flooding, pavement cracking/deterioration, thermal misalignment, icy roads, wildfires, and maintenance inability are all examples of climate-induced resilience issues. Affected sectors can include public health, economic growth, air quality, urban growth, etc.
Types of disruption scenarios that are the most critical to the region include disasters that affect the interstate system, the Downtown Connector, Spaghetti Junction, as well as the collapse of the bridge on I-85. The study area chosen in the analysis is also quite close to rail transit (MARTA) infrastructure. If MARTA infrastructure is disrupted, individuals that rely on MARTA rail, bus, and general mobility will have to find alternative ways of travel. For the fiscal year 2022 to date, ridership for rail, bus, and general mobility totaled 35.6 million riders. Some constraints on regional accessibility in the region include flooding due to clogged drainage systems, extremely high daily traffic volumes, closure of arterial systems, homeless population issues, and snow events which usually shut down most of the city. Construction on freeways and roads also contributes to regional traffic and transportation disruptions. In 2017, a bridge collapsed on I-85, severely damaging infrastructure and traffic flow. Moreover, a large section of the interstate was closed to traffic for 43 days. Traffic on the Beauford Spring Connector has trouble merging because the connector is a lot older and the on and off ramps are quite short.
Commuter Challenges
One of the most critical resilience issues that faces the region is congestion. According to a 2021 estimate from the U.S. Census Bureau, the Atlanta-Sandy Springs-Alpharetta metropolitan statistical area (MSA) is the eighth most-populated MSA in the United States. With one of the largest population centers in the country, traffic flows within and around the region are heavily affected by large traffic volumes. I-285, I-85, I-75, and I-20 are the most traffic-heavy roads in the region and the country. Congestion and bottlenecks are present throughout the year in the Atlanta region and pose some of the most prominent disruptions.
Facility Maintenance
In March 2017, a portion of the I-85 bridge in Atlanta collapsed. The loss of the bridge caused a massive disruption to transportation infrastructure in the region. The resulting fire burned for over
an hour, tearing commuters away from their usual way of life. Daily traffic volumes on I-85 can reach over 250,000 vehicles a day, so thousands of commuters had to find alternative methods of travel during the rebuilding of the bridge. The Georgia Department of Transportation (GDOT) responded to the bridge collapse with the expedited building of a replacement bridge deck.
Freight Impacts
There are numerous freight shipping hubs located in the region whose operations and functionality can be impacted by disruption scenarios. Such facilities include Pilot Freight Services, UPS Air Cargo, New Life Transport Part Center, XPO Logistics, Delta Cargo, UPS SMART Hub, Coyote Logistics, Southeastern Freight Lines, and many more. These logistics and distribution centers are vital to the region’s economy and to connecting Atlanta with other states and countries. Freight is reliant on interstate travel to and from the region. If roadway networks such as interstate routes are disrupted, freight in the region would also be heavily affected.
Findings
The results from the cascading-effects model in the Atlanta area identified several areas with critical links (see Figure 12).
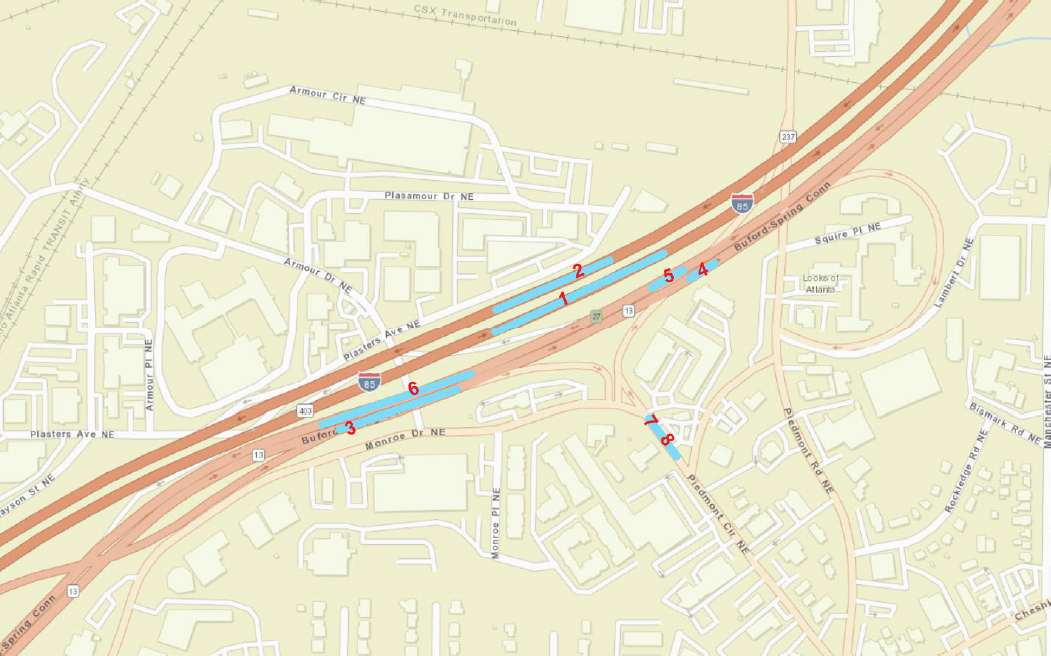
The critical links are highlighted in Figure 12. These important links are located primarily on the Northeast Expressway (I-85) and the Buford Spring Connector. I-85 is one of the busiest interstate connectors in the United States, and it feeds traffic from surrounding areas and carries traffic
through downtown Atlanta. The entire region is likely to be affected if disruptions occur within this road network.

When looking at the findings through this particular methodology, the map highlights some zones that contain business sectors with high volume and high sensitivity zones. High volume zones are located in zones with high activity centers, such as tourism and commercial sectors.
As a result of the analysis, additional information can be extrapolated regarding the characteristics of the cluster chosen in Atlanta. Below are some examples of how this analysis might lead to insights that could help planners as they review disruption scenarios for a specific cluster.
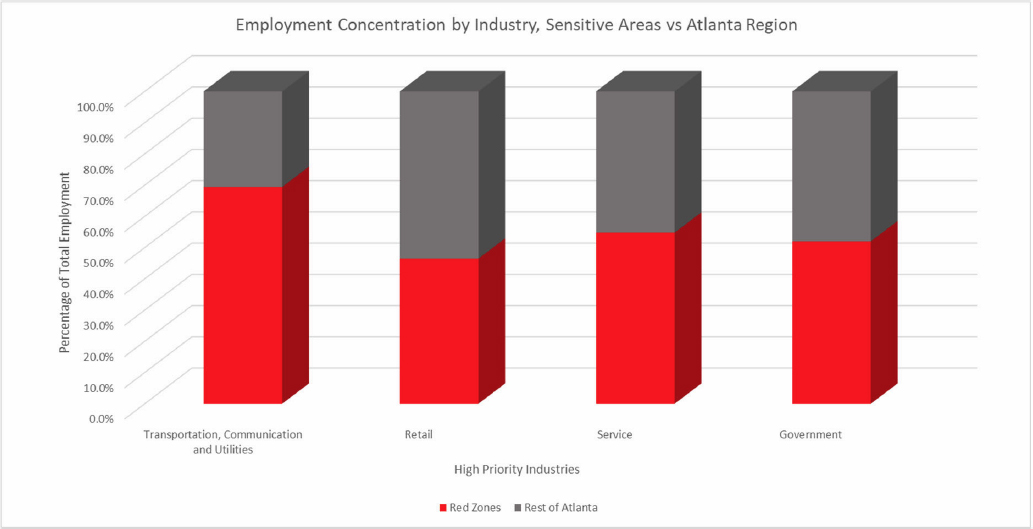
Figure 14 compares the employment concentration of the selected cluster against that of the entirety of the Atlanta region. By using the employment data, practitioners can further break down sensitive areas affected by the disruption to illustrate the impacts on specific key industries should there be a disruption in the selected cluster. As shown in the chart, this cluster would affect a high proportion of most of the high-priority industries in the region. Retail is the least affected, while transportation, communication, and utilities are the most affected. Planners could further use this information to make decisions regarding route planning to help alleviate disruptions to these key industries.

Figure 15 highlights mode split distribution. As expected, automobiles are the most popular travel mode in the region, making up approximately 80 percent of the distribution in the network, with approximately 77 percent within the cluster. Trucks are the only other mode analyzed, making up around 19 percent of the distribution in the network, while making up 23 percent in the cluster. This result highlights the significance of the links within the cluster to the mobility of the network.
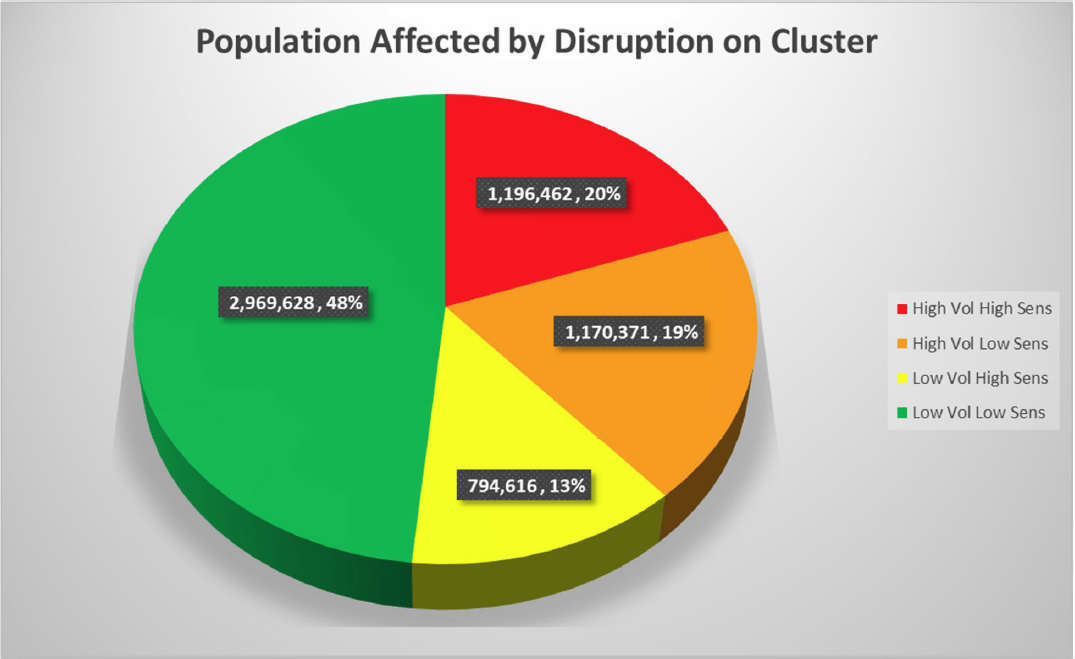
Nearly half of the population affected by disruptions in the clusters among the four categories occur in low volume/low sensitivity zones. The other three categories are split relatively evenly for the rest of the population.
Critical Locations
The Downtown Connector, also known as I-75/I-85, is among the most critical facilities in Atlanta. The Downtown Connector is a concurrent roadway link belonging to I-75 and I-85, which cuts through downtown Atlanta. This facility is critical because of its connections for commuters trying to reach different regional areas. Moreover, traffic flows on the Downtown Connector are heavy, so if this facility were disrupted, many vehicles and individuals would be affected. Spaghetti Junction, which is the intersection of I-85 and I-285, is another facility that is considered extremely critical. As a critical junction point between two high volume interstate routes, this facility’s failure would severely impact civilian and commercial traffic. According to a 2018 assessment, the Spaghetti Junction already tops U.S. charts of the worst freight mobility due to bottlenecks. Moreover, interstate routes in the region are particularly critical due to the sheer volume of daily traffic flows on those roads. MARTA infrastructure in the region would also lead to significant disruptions, especially at Lindbergh Station.
Truist Park is a large baseball stadium located northwest of downtown Atlanta. Ranking third in average attendance per home game (roughly 37,000 attendees) among Major League Baseball stadiums, Truist Park is a key industry and business asset to the region, attracting many visitors and economic gains from within and around the area.
Hartsfield-Jackson Atlanta International Airport (ATL) is one of the most critical facilities in the region and the country; according to 2021 statistics, it is the busiest airport by passenger traffic in the world. If ATL airport were to be heavily disrupted, or even mildly disrupted, cascading effects would be numerous and devastating for both air and commuter traffic. Ridesharing vehicles, taxis, buses, and light rail traveling to and from the airport would also be affected. Disruptions involving cargo traveling aircraft would create logistical issues radiating from the affected region. Popular tourism destinations in the region include Georgia Aquarium, Atlanta Botanical Gardens, National Center for Civil and Human Rights, and the Atlanta History Center. When comparing these popular tourist destinations with the zones identified on the map, there is a connection between high volume/high sensitivity zones and local perceptions of possible problem areas regarding resilience. Locations of popular business, commercial, and tourism sectors are highlighted with blue circles on the map in Figure 17.
Conclusions
The methodology used for the Atlanta Regional Council can improve resilience planning and awareness by applying a scoring and ranking system. With each zone in the region categorized into four categories, planners can easily highlight zones that require particular attention regarding network disruptions and resilience issues. As highlighted above, high volume/high sensitivity zones correlate with facilities and areas that network disruptions would heavily impact.
Based on the overall findings of the cascading-effects model and through a conversation with the Atlanta Regional Council, it appears that the analysis results closely aligned with the concerns and priorities of the local planning agency. The model identified several critical facilities that align with the concerns voiced by members of the Atlanta Regional Council. The cascading-effects model results could provide information valuable to local planners as they consider the resilience of their regional transportation network. Information that can be derived from the analysis includes employment distribution, travel mode split, affected populations, and many more. While the cascading-effects model can broadly identify critical areas, it can also provide insight and identify specific areas of need. Thus, these areas could be further studied to identify better potential solutions for strengthening the resilience of the regional transportation network.


