Resilience in Transportation Networks, Volume 2: Network Resilience Toolkit and Techniques (2024)
Chapter: 6 Cascading Effects of Disruptions on Multimodal Facilities in a State
6 Cascading Effects of Disruptions on Multimodal Facilities in a State
6.1 Cascading Effects for Intermodal Facilities – Illinois
Objective
This document describes cascading effects resulting from the disruption of intermodal facilities in Illinois. It shows how the failure of intermodal facilities can impact access to trade centers and jobs, as well as how disruptions affect access to employment of residents in different income categories.
Data Sources
Transearch 2019 data is used as the primary source for analyzing commodity flows and identifying the top intermodal facilities. Illinois Statewide Travel Demand Model (ILSTDM) data from 2017 was the source used to identify the impacted truck corridors and the trade centers and the hinterlands. The datasets from the travel demand model include the following:
- Traffic analysis zone (TAZ) boundary
- 2017 model network
- Truck trip tables by four periods
- Socioeconomic data – includes population households, average income by TAZ
Other data sources include:
- Employment by TAZ – Data from the Longitudinal Employer-Household Dynamics (LEHD) dataset provides the number of employees in various industry sectors working in each TAZ.
Software used for the analysis includes TransCAD, ArcGIS, Microsoft Excel, and R.
Procedure
Step 1: Identify critical intermodal facilities
The Transearch database records commodity flows between defined origin and destination regions by freight mode. Boundaries for regions within Illinois are defined as county boundaries, while boundaries for regions outside of the state are defined as county boundaries or larger. Using Transearch data, the total inbound, outbound, and internal tonnage for each shipment mode, water, rail, and air, was determined for each region. The counties with highest total trade tonnage are Madison County for water and Cook County for rail and air.
Step 2: Tonnage transfer to other modes
For each of the shipments analyzed, some of the inbound/outbound commodities (defined by the 4-digit Standard Transportation Commodity Code) were transferred to/from a primary mode to a secondary mode at intermodal facilities. For instance, commodities shipped by water mode often get transferred to truck or rail, and commodities shipped by rail mode often get transferred to truck or water. These transfers are determined from Transearch. However, when Transearch lacks detailed
data on secondary modes, commodities shipped by air are assumed to be transferred only to truck and are analyzed using data from the Freight Analysis Framework (FAF). Commodities not transferred to secondary modes are assumed to be consumed locally (within the destination county). The steps for assigning shipments to specific modes are described below:
Water Mode
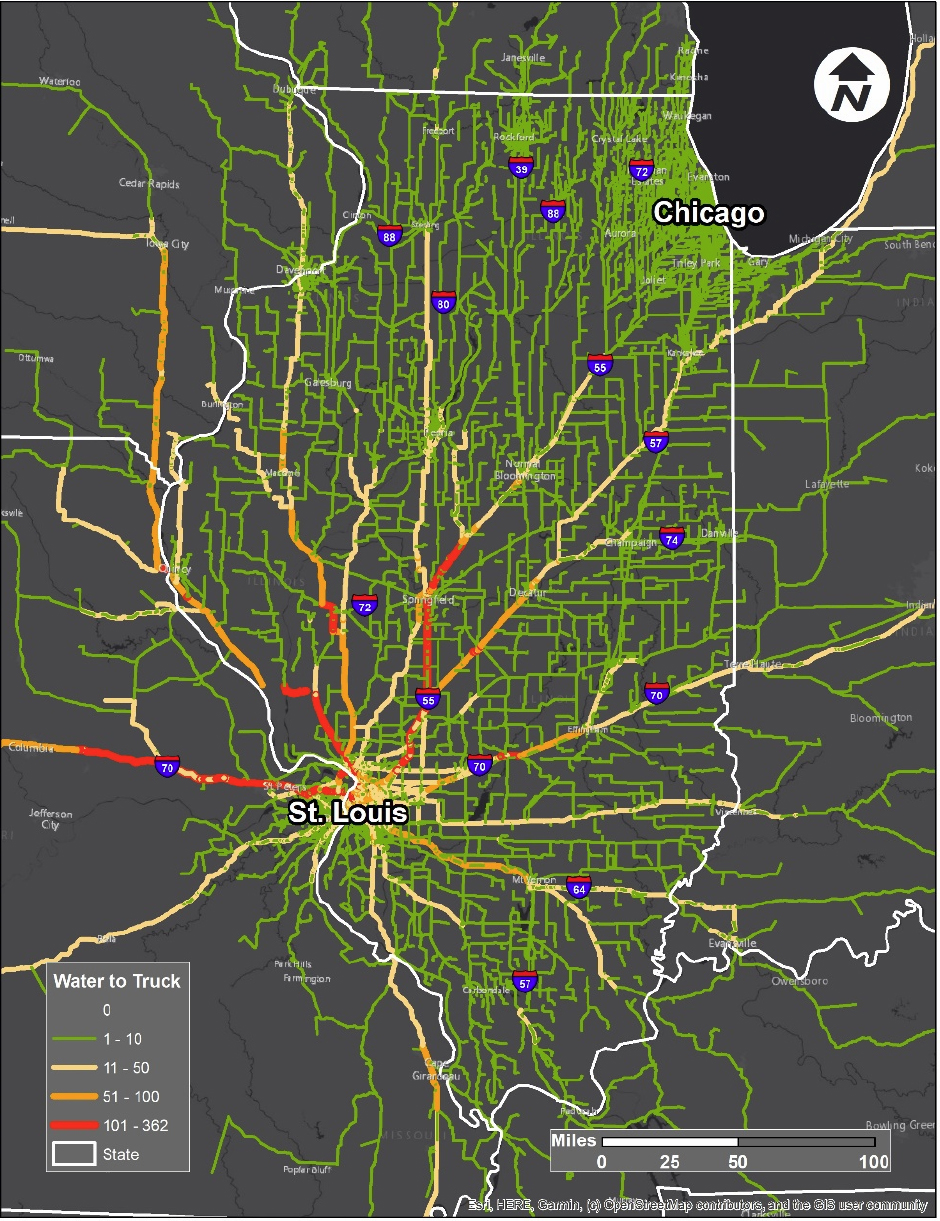
- When the primary shipment mode is by water, process Transearch data to develop OD flows with either the origin or the destination region as Madison County (see Figure 60).
- Calculate the inbound, outbound, and internal commodity flows by Standard Transportation Commodity Code (STCC) for each of three modes: primary mode water, and the secondary (transfer modes) modes truck and rail.
- Join the inbound water to outbound truck and rail by STCC. If the water tonnage for any commodity is less than the total tonnage of rail and truck, then the tonnage is allocated to rail and truck in their proportions. If the water tonnage is more than the total tonnage of rail and truck, then only the tonnage equal to the total of rail and truck tonnage will be allocated to the secondary modes. The remaining tonnage is assumed to be consumed locally. The tonnage that does not get allocated for any STCC is also assumed to be consumed locally.
- Tonnages transferred to trucks are filtered out. Results are a table of outbound truck tonnage by STCC code.
- The processes outlined in steps c) and d) are repeated for outbound water tonnage with inbound secondary modes. Results are a table of inbound truck tonnage by STCC code.
- The processes outlined in steps c) and d) are repeated with internal water tonnage allocated to internal truck and rail tonnages. Results are a table of internal truck tonnage by STCC code.
- The outbound truck tonnage (from inbound water) is distributed to various destination regions based on the share of all trucks by STCC from Madison County to those destinations.
- The inbound truck tonnage (to outbound water) is distributed to various origins based on the share of all trucks by STCC from those origins to Madison.
- The internal truck tonnage is from Madison County to Madison County.
- The inbound, outbound, and internal tonnage are combined in a single file. The tonnage is converted to daily truck trips using load factor of 20 (trucks to tons) and an annualization factor of 365.
Rail Mode
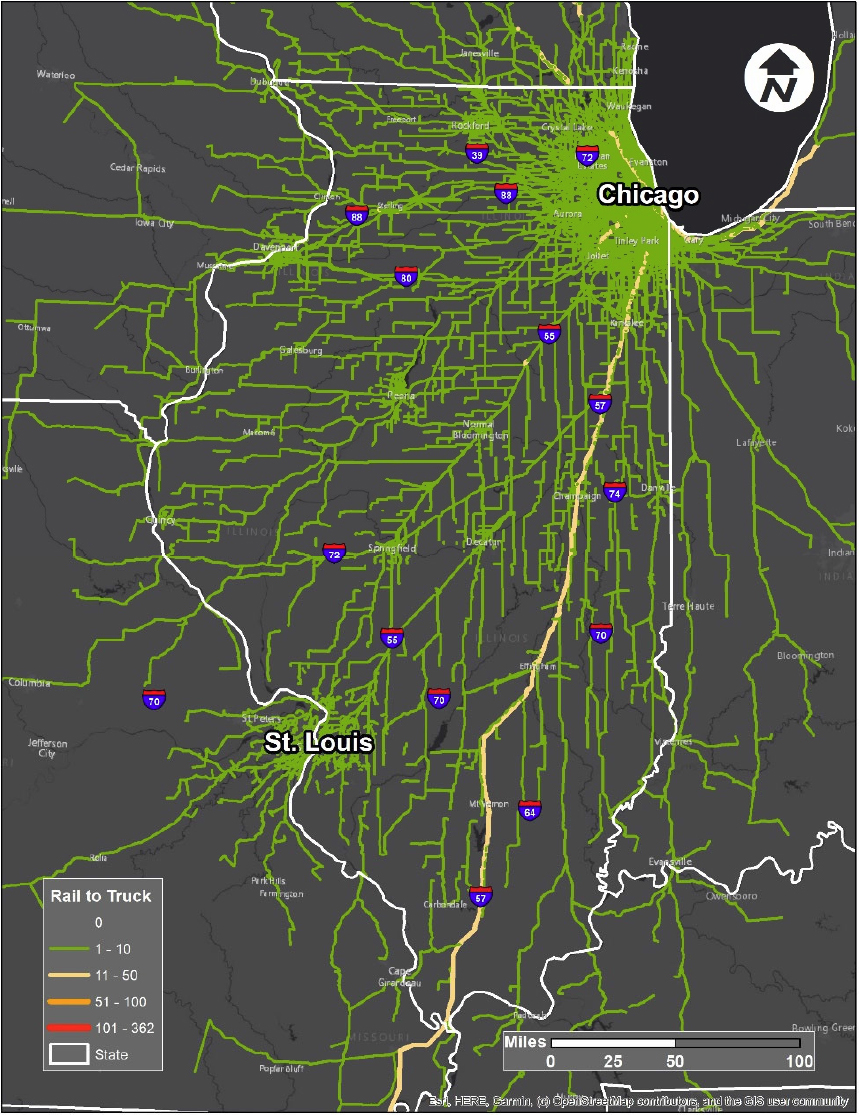
- When the primary shipment mode is rail mode, process Transearch data to develop OD flows with either the origin or the destination region in Cook County (see Figure 61).
- The secondary modes (transfer modes) are water and truck.
- The process to calculate the commodity transfers by STCC is the same as for water.
- Daily trucks are calculated in the same manner as for water from the annual tons.
Air Mode
- FAF data provide tonnage flows for each of the 42 FAF commodities (defined by Standard Classification of Transported Goods [SCTG] code) by air to/from Cook Country, and then to/from domestic destinations within Illinois via truck (see Figure 62).
- Results are tonnage by FAF commodity between the three FAF zones.

Step 3: Trips Matrix Development
Daily truck trips from each mode (water, rail, and air) are disaggregated to develop TAZ-to-TAZ trip matrices. This requires a correspondence table (called equivalency) between the ILSTDM TAZ and the Transearch region (for water and rail) or FAF region (for air). The process to develop this equivalency is described below:
Water and Air Modes
Equivalency between Transearch region and TAZ was developed using existing data on daily truck trips from the base year ILSTDM model. The procedure is as follows:
- Trips by TAZ were calculated using the average of total origin and total destination trips for that TAZ.
- The region boundary and the TAZ boundary were spatially joined using ArcGIS.
- Region-to-TAZ shares were calculated.
- If the region is same or smaller than the TAZ, then all the trips in the region will be assigned to the TAZ in which it lies, and therefore region-to-TAZ share will be 100%.
- If the region is bigger than the TAZ, then the region-to-TAZ share for each TAZ in that region is calculated using its share of daily truck trips in the existing base year ILSTDM model.
The equivalency is used to disaggregate the trips from region to TAZ. The equivalency is joined with origin and destination regions providing origin shares and destination shares of region to TAZ. The TAZ-to-TAZ truck trips are obtained by multiplying the region-to-region truck trips with the origin and destination shares.
Air Mode
The equivalency between FAF zones and TAZ was developed using the LEHD data and a regression-based process. The procedure is as follows:
- Using regression, develop relationship between each commodity and LEHD’s North American Industry Classification System (NAICS) employment as a percentage of each employment category.
- For each commodity, develop inbound and outbound employment totals for each TAZ by multiplying individual TAZ’s employment in each NAICS category with its respective percentage for that commodity.
- The total inbound and outbound employment of TAZs is aggregated to FAF zones and share of FAF zones are calculated for each TAZ. The outbound employment provides origin shares while inbound employment provides destination shares of FAF to TAZ.
- The TAZ-to-TAZ tonnages are obtained by multiplying the FAF-to-FAF zone tonnages with the origin and destination shares.
- Combine the tonnage for all commodities and convert it to daily truck trips using a load factor of 20 and an annualization factor of 365.
Step 4: Perform traffic assignment
Assign daily traffic to the highway network for each mode by using the trip tables developed above in Step 3. The Traffic assignment is based on the shortest path. The results of the assignment provide truck trips by each link and direction.
Step 5: Process the data, analyze the impacts, and develop reports in the form of maps and summaries
The impacted facilities and zones due to the disruption to intermodal facility are determined. The assignment results show the impacted facilities. The origin or destination zones of the trucks that carry transferred commodities to/from intermodal facilities are the impacted zones and obtained from the trip table.
5a: Traffic-volume and sensitive employment maps: The analysis quantifies the number of truck trips that carry commodities transferred from the primary mode (called selected trips) to the zones served by those trips (called selected zones).
- Estimate the proportion of the region’s sensitive and non-sensitive employment in selected zones using LEHD employment data.
- Calculate the average of total origin and destination selected truck trips by zone.
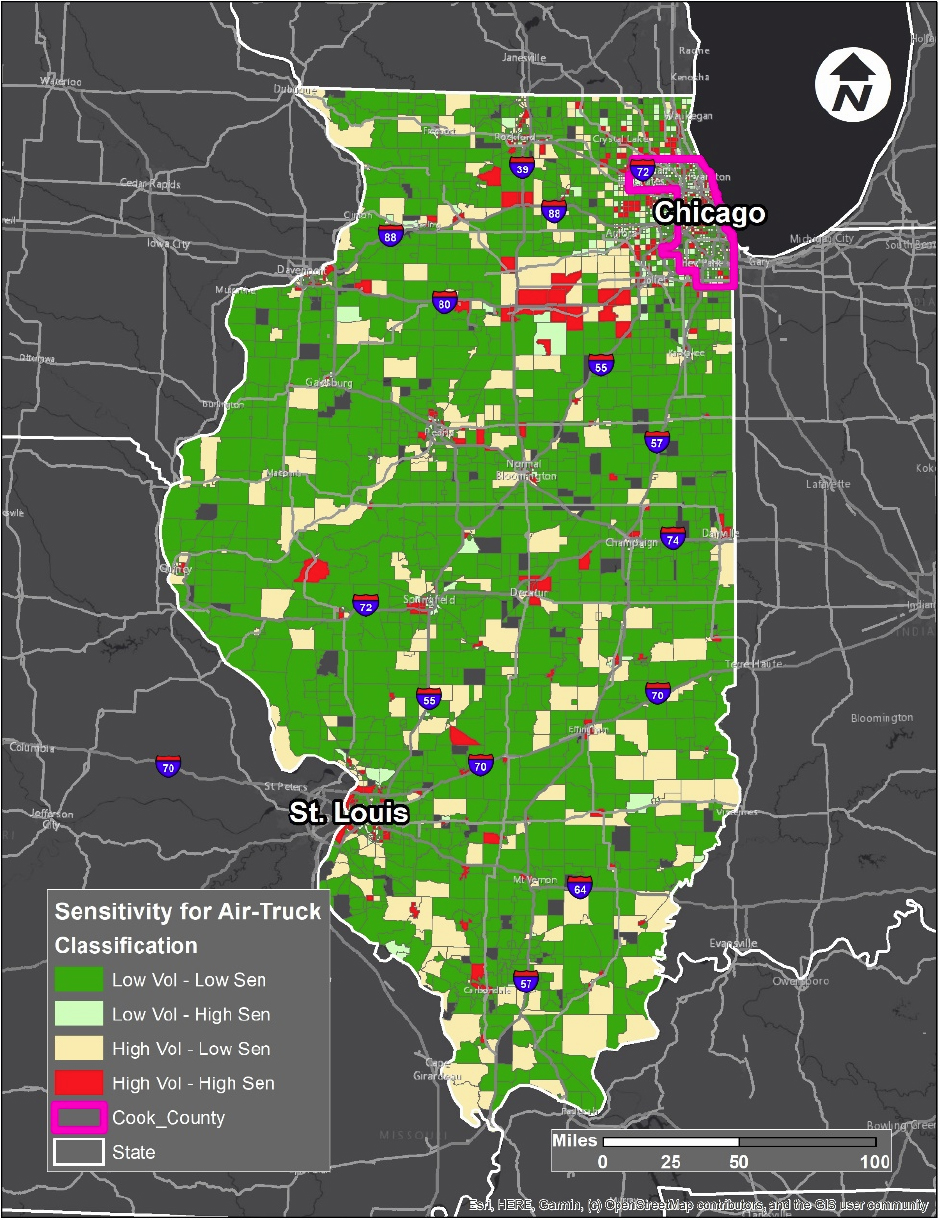
- Determine the top twenty-five percentile zones based on volume and label them high volume (with remaining as low volume) and determine the top twenty-five percentile zones based on the high sensitivity employment and label them high sensitivity (with remaining as low sensitivity).
- Develop map of zones categorized into the four classifications.
5b: Summaries for trucks trips, household by poverty (below or above), and employment by sensitivity for each mode: A spreadsheet can be used to develop input data for graphs, maps, and tables.
- For each mode, calculate the following input data at the TAZ level:
- Average of origin/destination total truck and impacted trips for each TAZ
- Employment by NAICS code and sensitivity level (low or high)
- The number of households by poverty level (below poverty and above poverty)
- The TAZ variables (trips, employment, number of households, etc.) were aggregated to regions that include seven trade centers and seven hinterlands. Following maps were developed for each mode:
- Number of impacted trips by region.
- Share of state’s sensitive employment in each region.
- Share of state’s households below poverty in each region.
Results
Volume-Employment Sensitivity
Figure, Figure , and Figure 65 highlight zones that are impacted by disruption of an intermodal facility serving water, rail, and air modes, respectively. During disruptions to water-borne freight modes, more impacts are seen in the TAZs closer to Madison County. For rail and air modes, more impacts are seen in and around Cook County.


Impacted Employment and Households
The bar graphs in Figure 6 Figure 66 show the impacted employment (total and sensitive) and households (total and below poverty) as a share of statewide values for water mode. Figure 67 and Figure 68 show the same for rail and air mode, respectively.


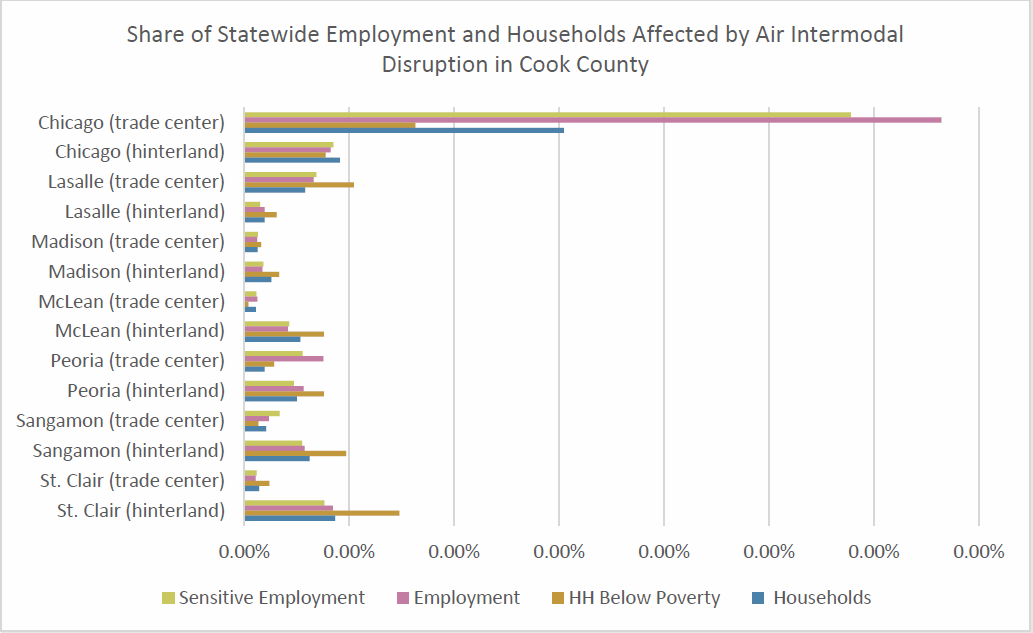
Figure 69 shows the number of trips impacted in each region (trade center and hinterlands) from a disruption to a water freight-focused intermodal facility.
Figure 70 and Figure 71 show trips impacted by region from disruptions to rail and air intermodal facilities, respectively.
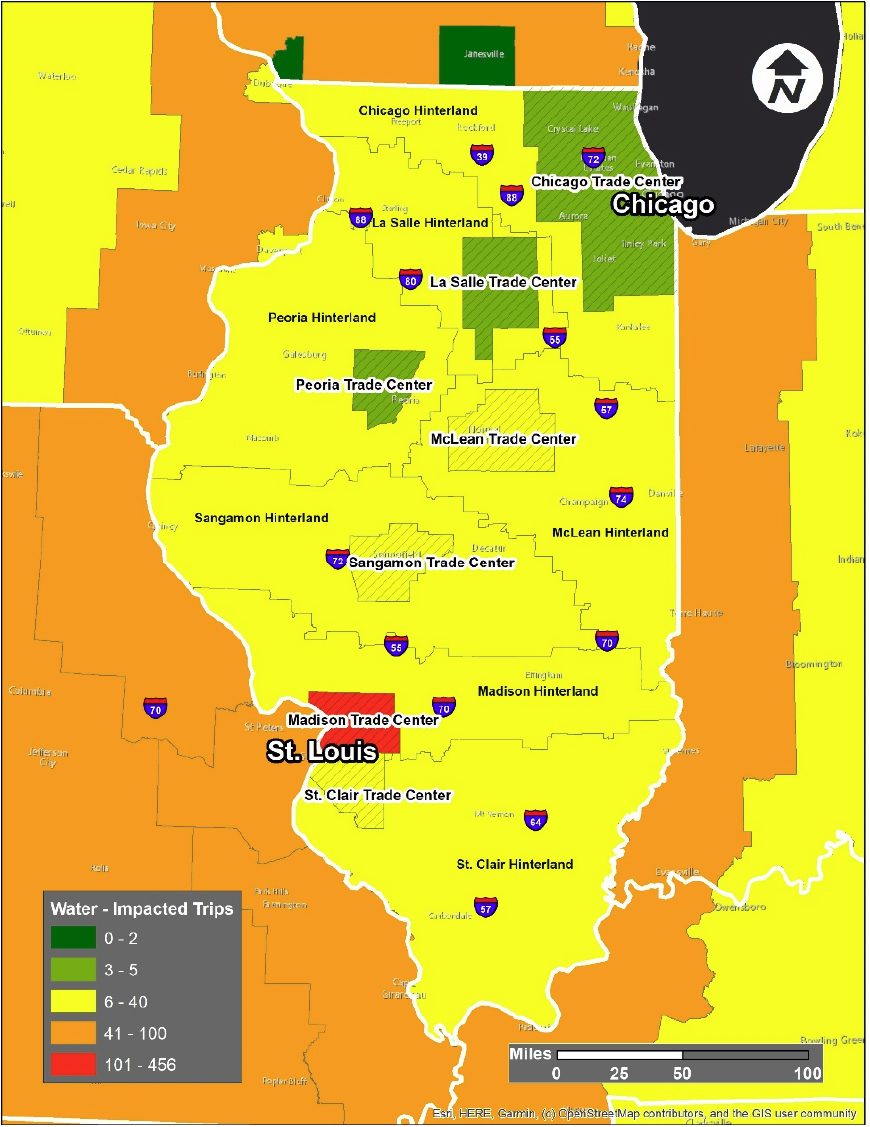

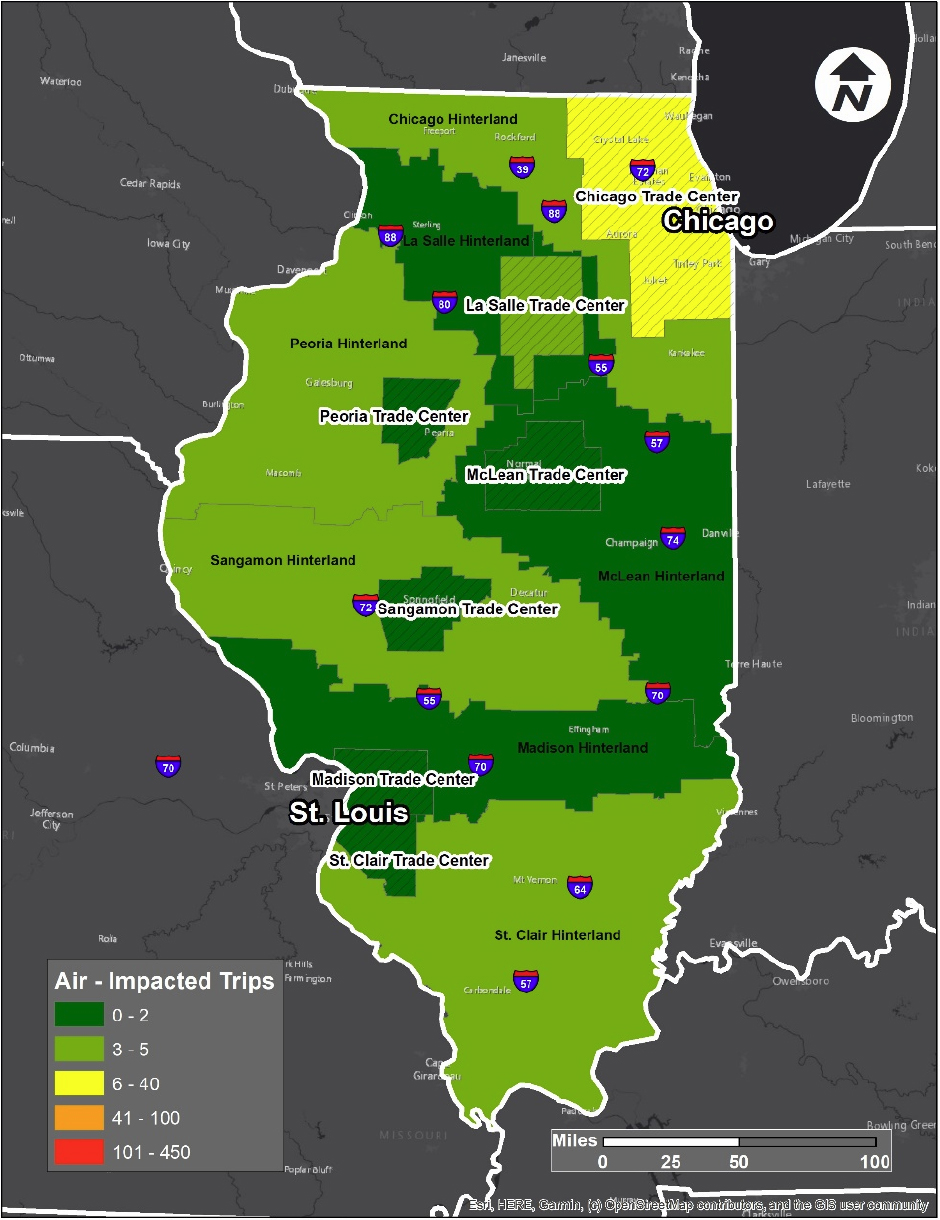
Figure 72 shows the percentage of sensitive employment impacted by a disruption in water intermodal facility to the total sensitive employment in the region. Variable values are weighted by impacted trip shares and divided by total value of that variable in the region.
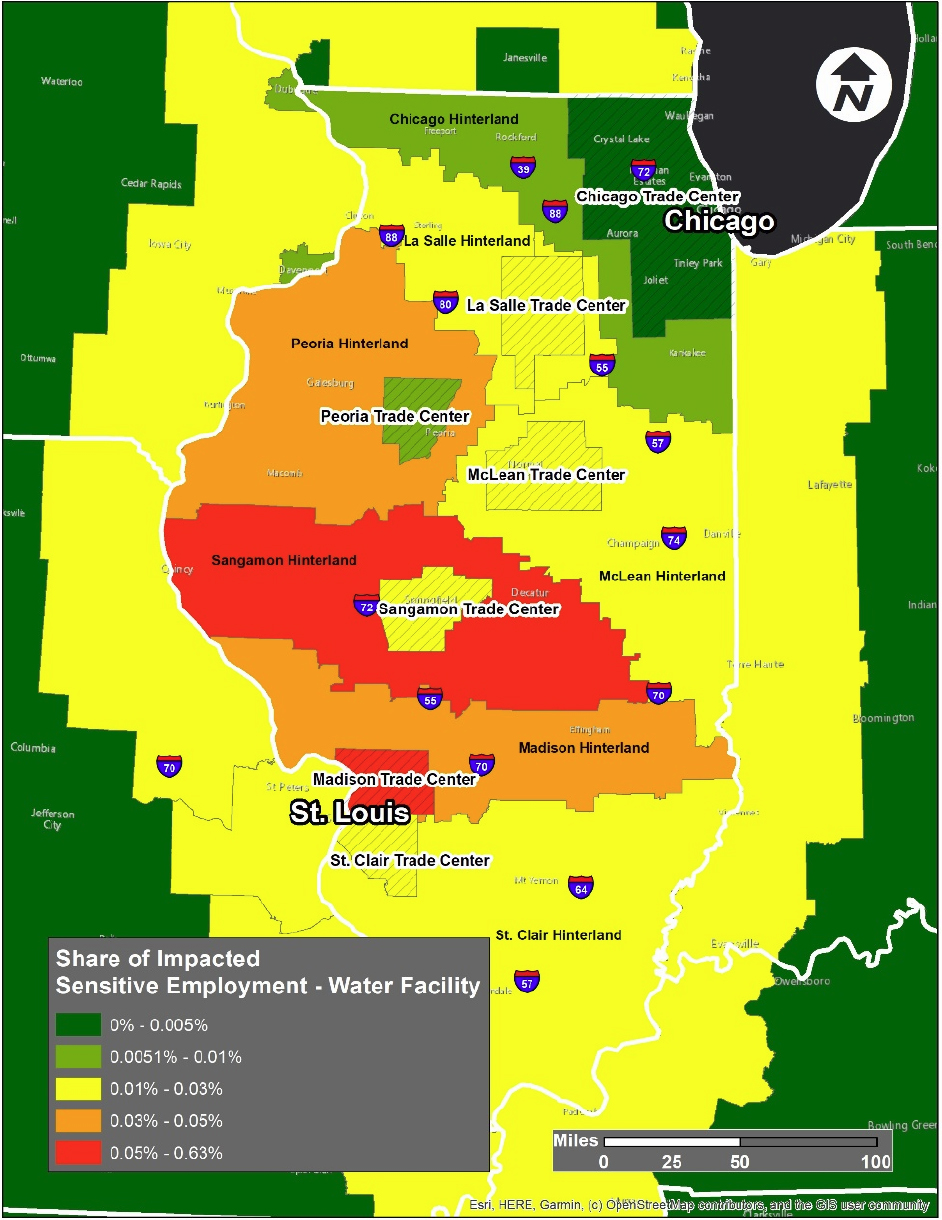


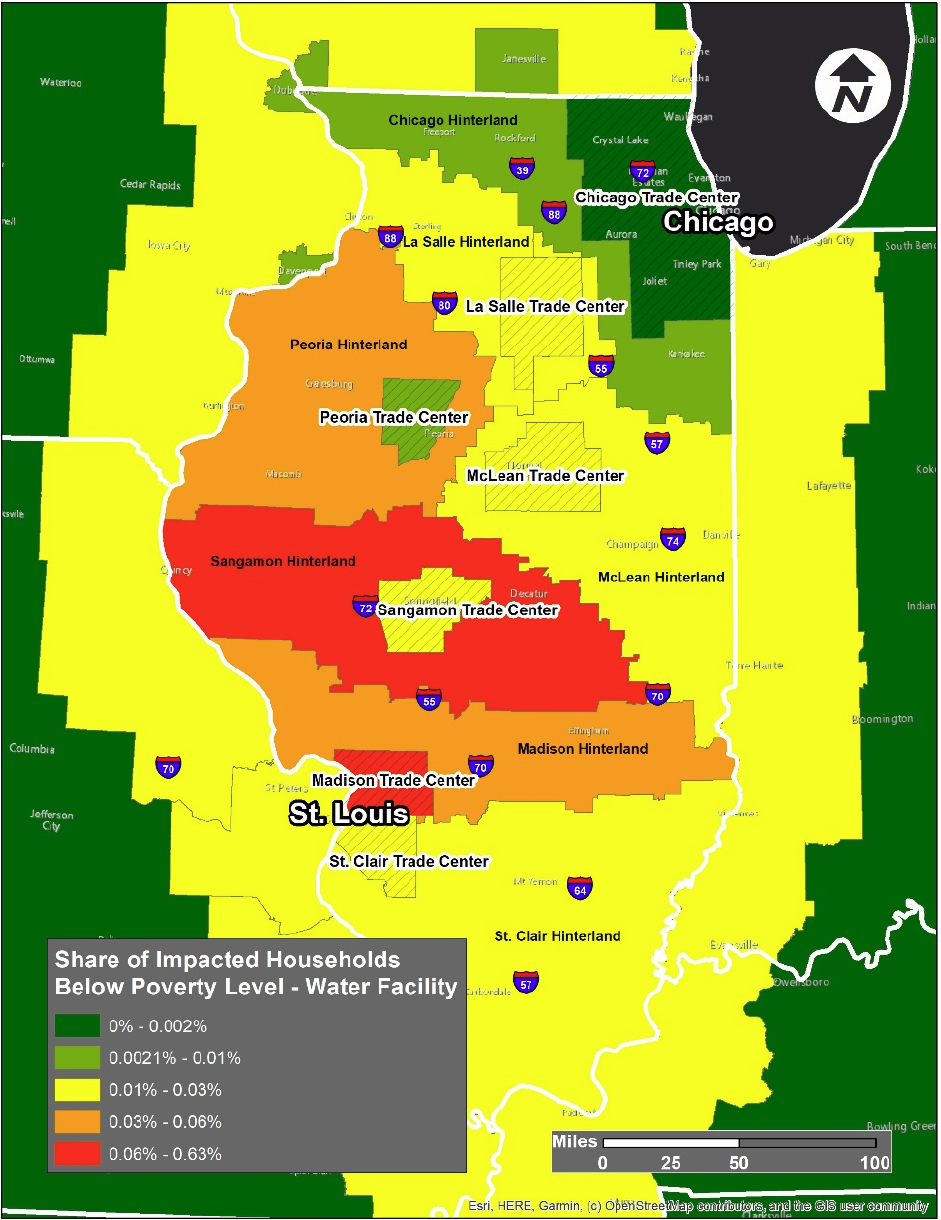
Figure 75 shows the share of households below poverty impacted by disruption to a water intermodal facility compared to the total households below poverty in the region. Variable values are weighted by impacted trip shares and divided by total value of that variable in the region.

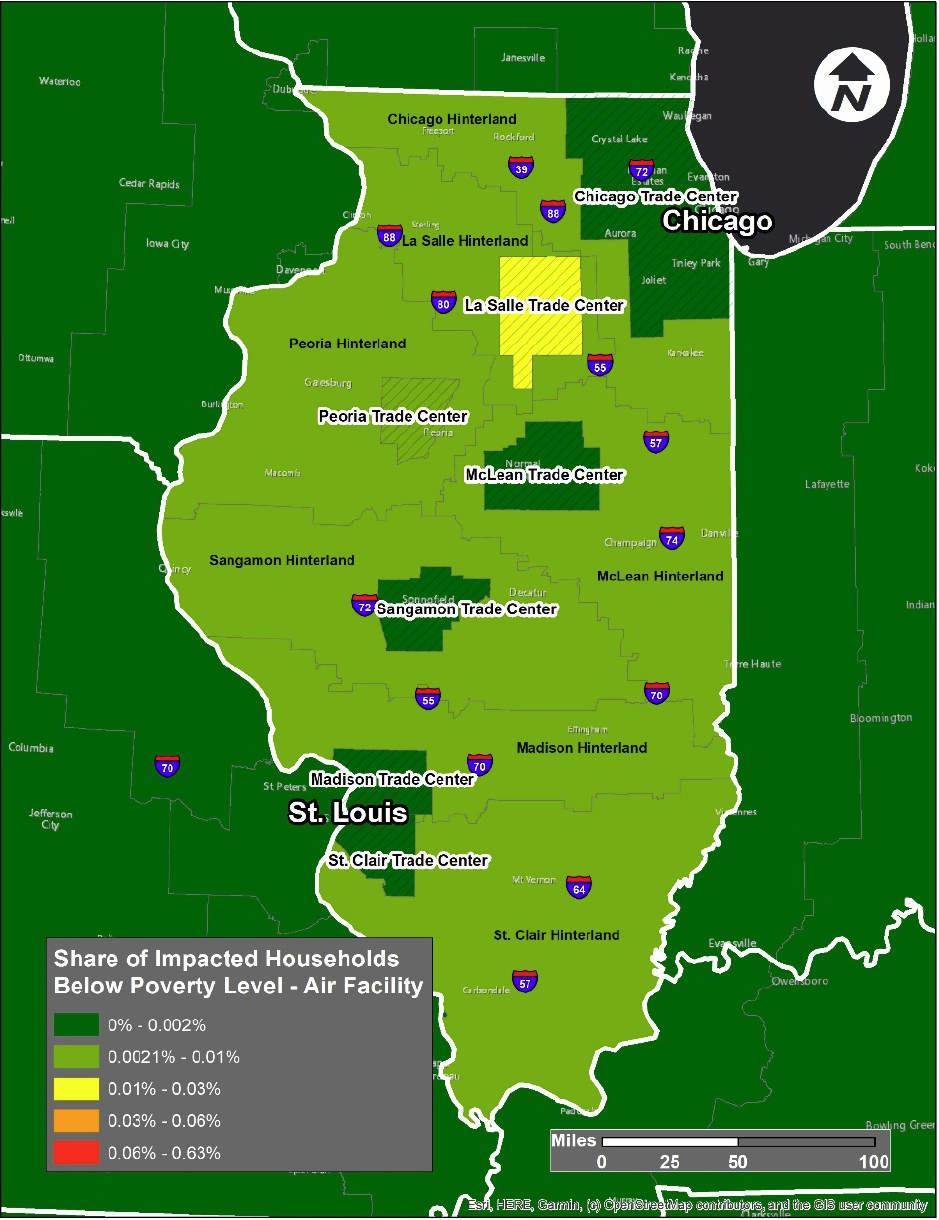
TAZ Maps
Figure 78 shows the number of trips in each TAZ affected by disruption to a water intermodal facility. Figure 79 and Figure 80 show the same for disruption to rail and air intermodal facilities, respectively.

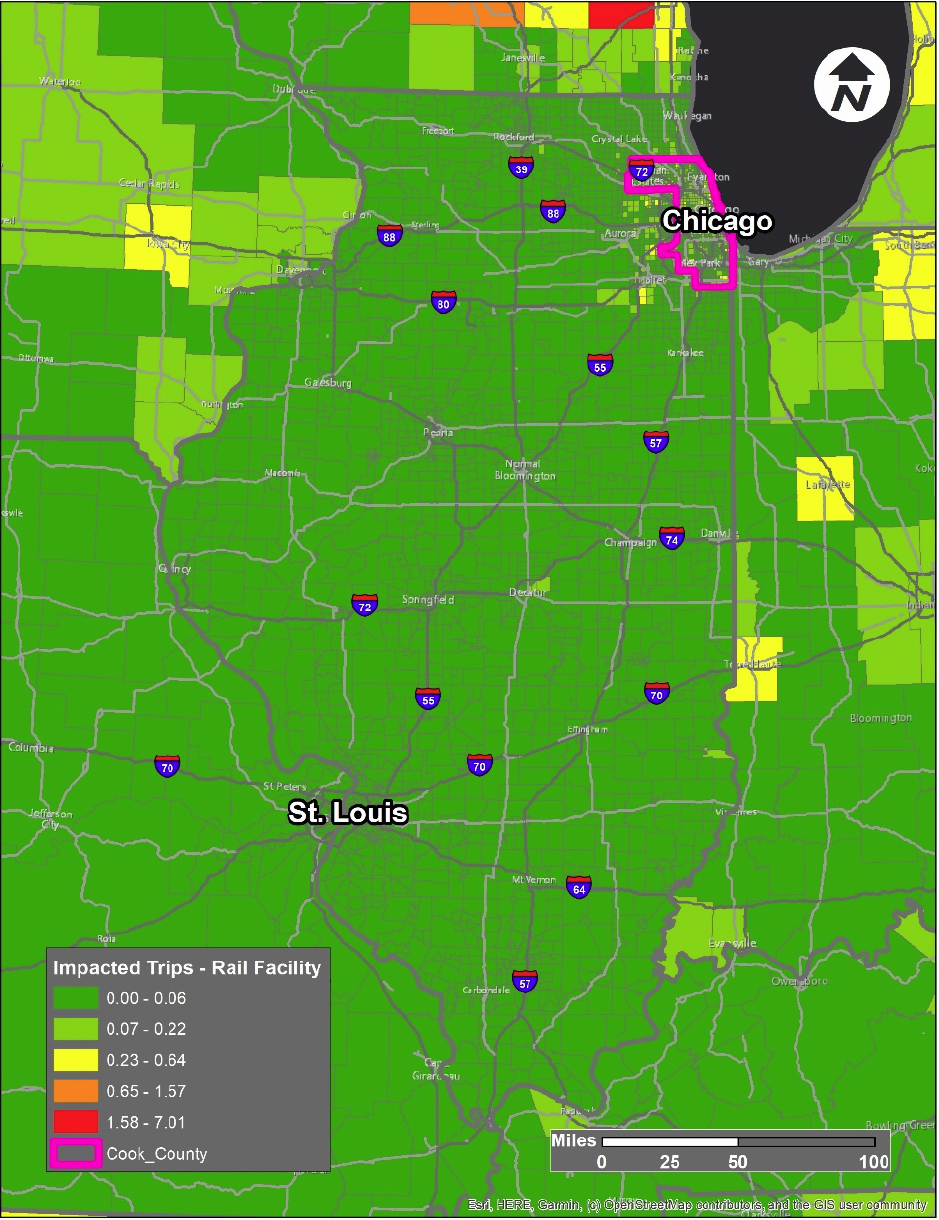

Figure 81 shows the number of households above and below the poverty level affected by disruption to a water intermodal facility. Figure 82 and Figure 83 show the same from disruption to rail and air intermodal facilities, respectively.
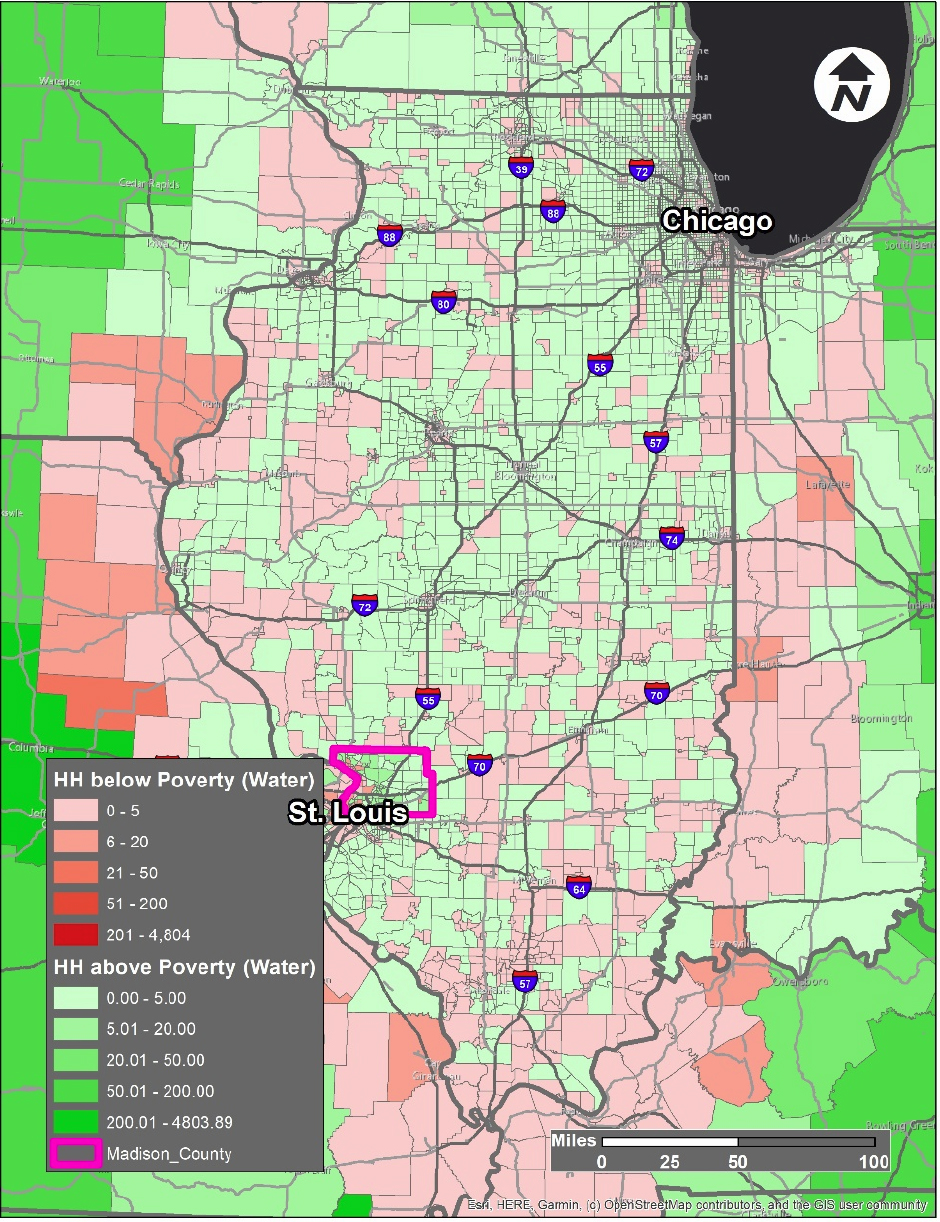
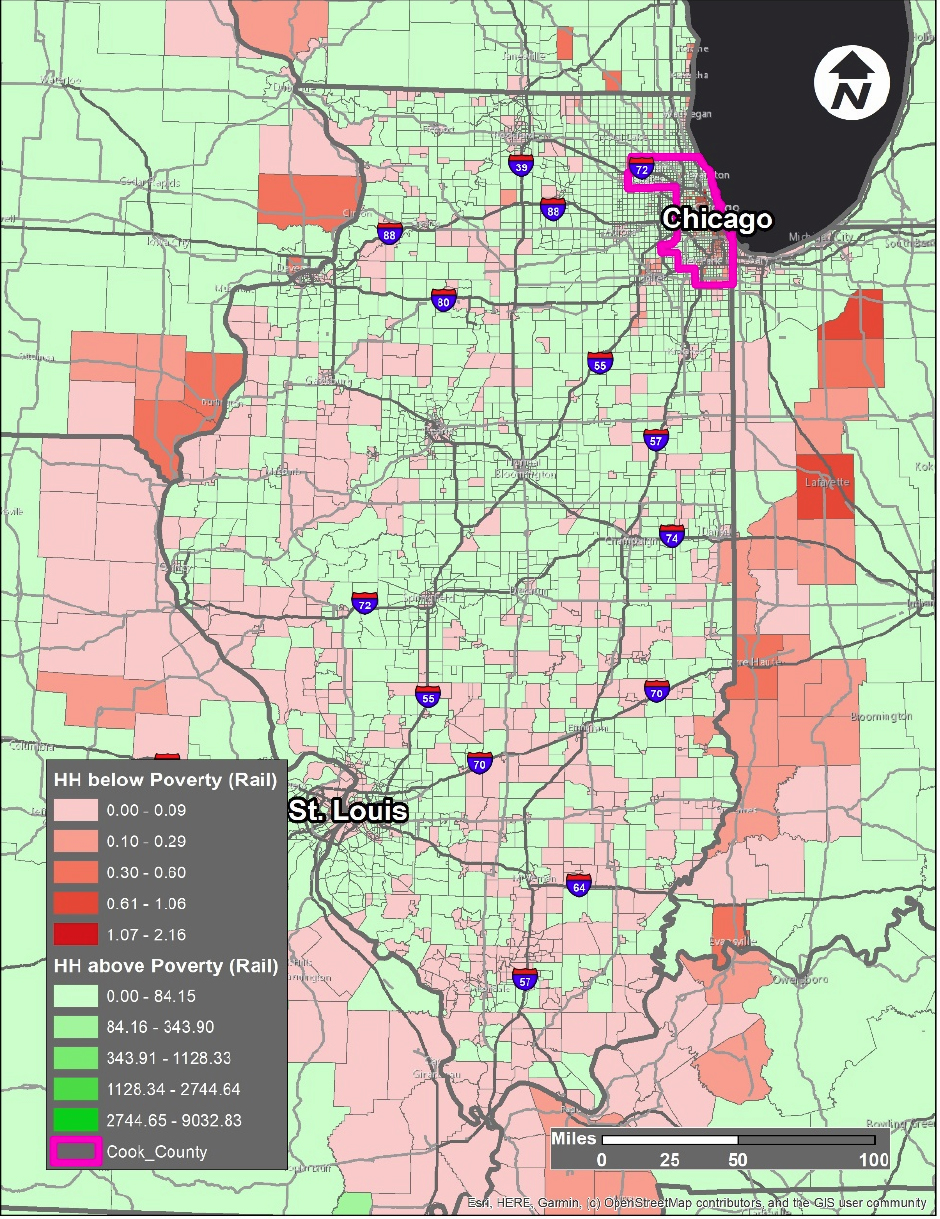
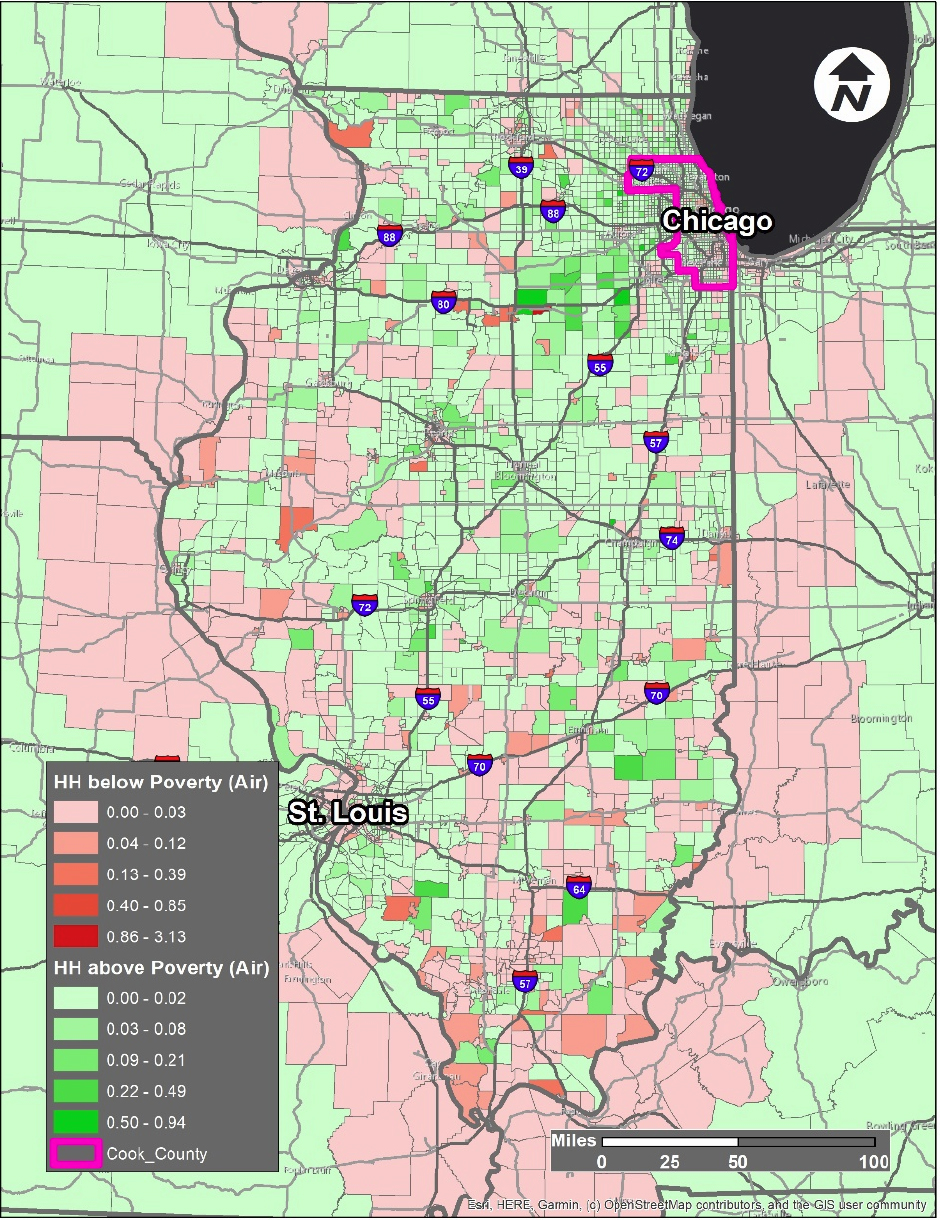
Figure 84 shows the regional share of employment (by zone) in high sensitivity categories weighted by share of impacted trips from disruption to a water intermodal facility.


6.2 Planning Context for Cascading-Effects Analysis in Illinois
Illinois’ statewide freight network is one of three test cases selected for pilot-testing network resilience tools as part of the NCHRP 20-125: Incorporating Resilience in Transportation Networks. Site testing includes working with local stakeholders, integrating local models and data, and developing processes for engagement that will enhance network resilience capacity. This document shares findings from both the stakeholder outreach and the cascading-effects analysis in Illinois.
Community Resilience Challenges
Illinois’ transportation network is susceptible to disruption on many fronts. The state is home to numerous transportation facilities such as international airports, railway networks, and expansive interstate highway connections. Its proximity to Canada and neighboring states creates the potential for far-ranging cascading effects, not only affecting counties and cities within Illinois, but also on neighboring states and even neighboring countries. With a population exceeding 12 million people, Illinois was the sixth most-populated state in the nation in 2022. Congestion is a large problem within Illinois, especially around Chicago. The I-90 and I-94 are some of the busiest highways in the United States, with average annual daily traffic counts on the I-90 totaling well over 300,000 vehicles. With so many vehicles traveling on this highway, crashes are bound to happen. One of the most severe crashes that took place on the I-90 in recent years is a multiple-fatality crash caused by a driver going the wrong way down a portion of the corridor in McHenry County, Illinois in July 2022. Moreover, in September 2022, a fatality occurred on the I-90 near Huntley, Illinois.
Severe weather impacts much of Illinois, especially during the colder months. Snowstorms, icy roads, black ice, and wind can affect millions of travelers on an annual basis. Typically, Illinois receives 30 to 40 inches of snow a year. In February of 2022, a severe snowstorm contributed to a 100-car pileup on the I-39 highway near El Paso, Illinois. That portion of the I-39 was closed off for almost 12 hours. Other highways around Illinois, such as the I-95 and I-74, also were affected by the snowstorms that swept through the state that winter.
Findings
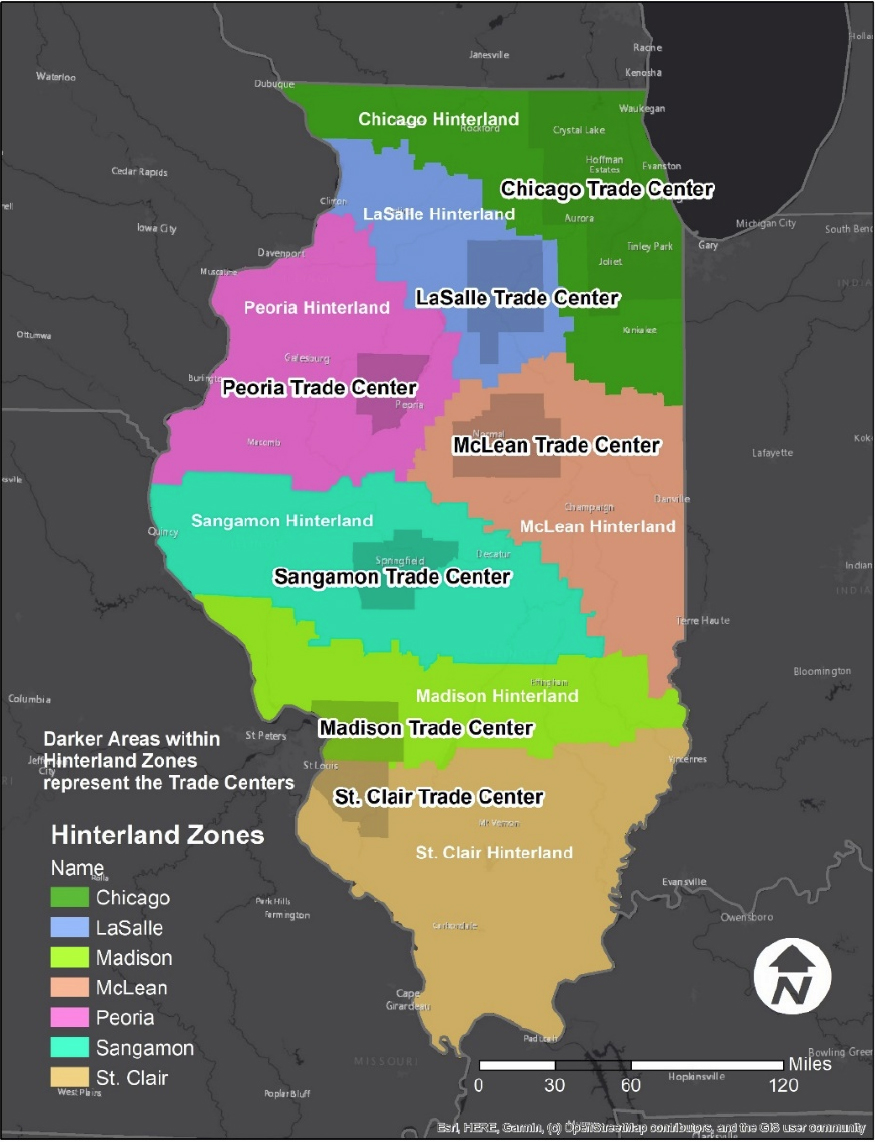
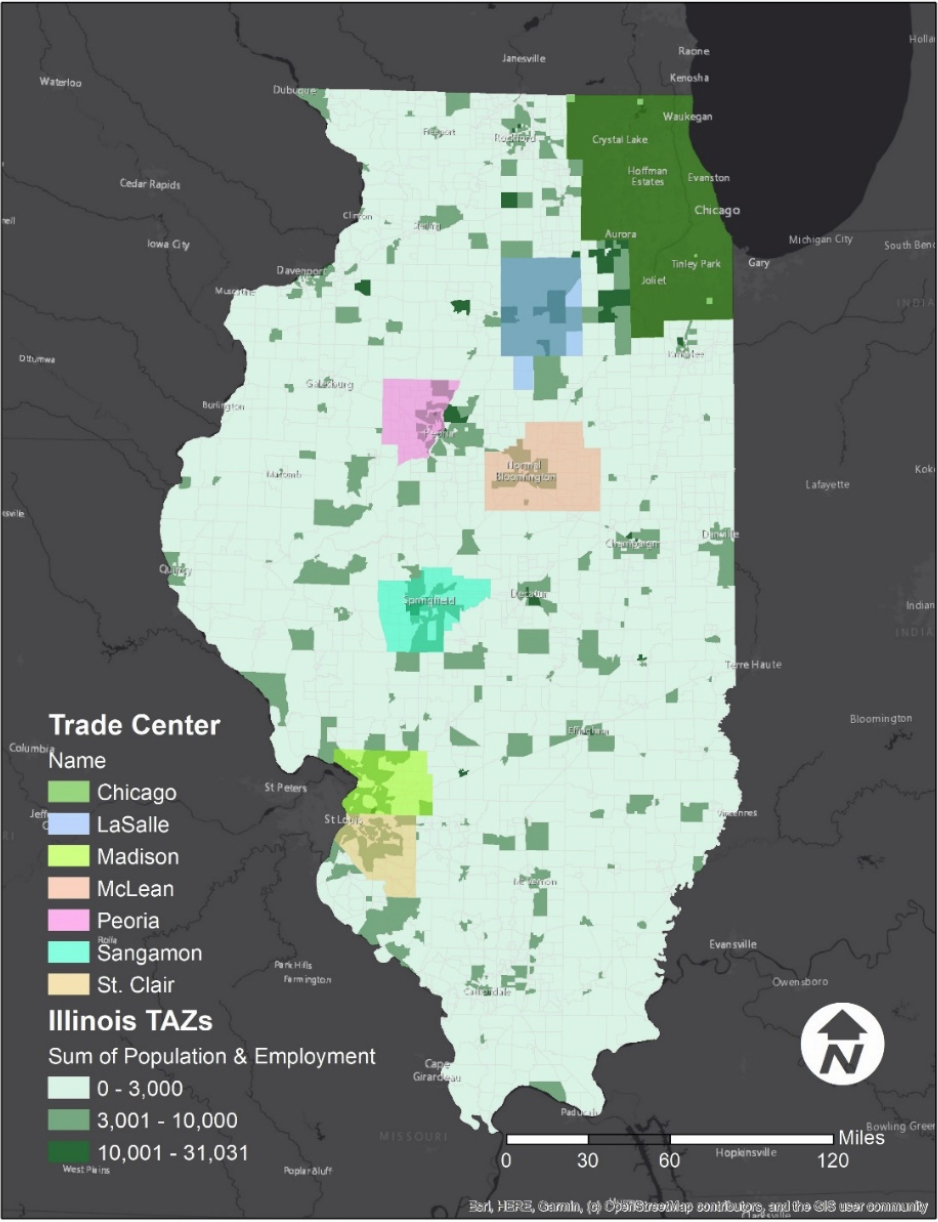
Figure 87 highlights statewide trade centers and hinterlands. Trade centers are major metropolitan areas within the state where economic activity revolving around freight occurs. Hinterlands are linked economically to trade centers. Employment by TAZ is the number of employees in various industry sectors working in each TAZ from Longitudinal Employment Household Dynamics (LEHD) data. Figure 88 highlights the TAZs.
Critical corridors were identified by analyzing truck trip matrices, link volumes, and a distance-based assignment script. Based on the volumes, the corridors were categorized into three tiers. One route in each tier was selected to serve as an example:
- Tier 1: I-55 and IL Route 66 between Mclean and Chicago – They are parallel routes, and both the routes were analyzed together.
- Tier 2: I-70, east of Madison and St. Clair trade centers.
- Tier 3: IL Route 29 between Peoria and Springfield.
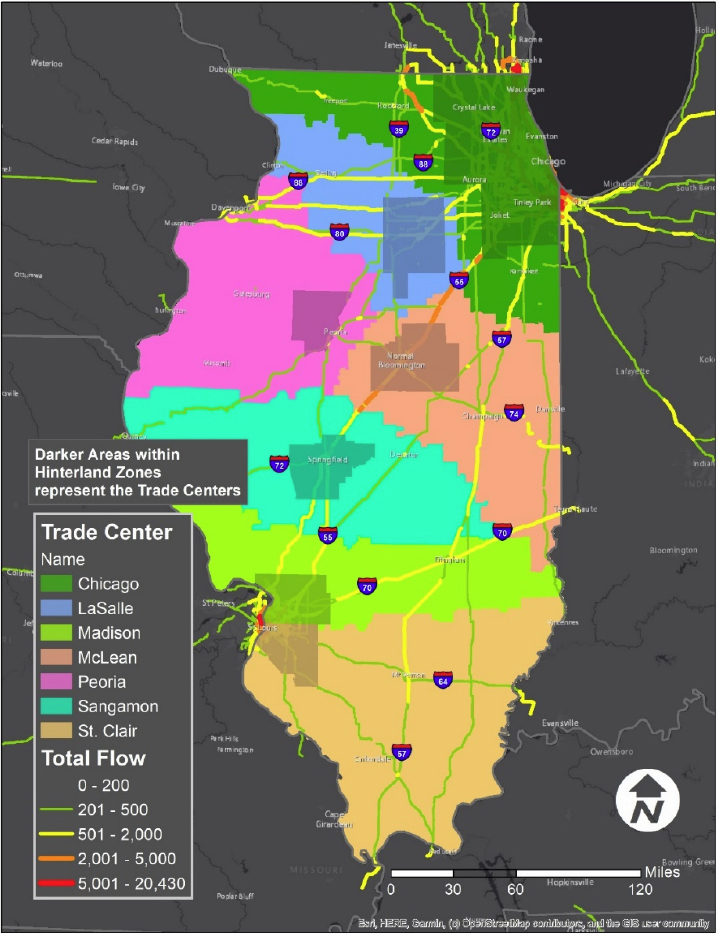
Tier 1 (Red) is the most truck-traffic heavy (inter-region); Tier 2 (Orange) is a medium-level truck-traffic (inter-region) route; and Tier 3 (Yellow) is a relatively low-level truck-traffic (inter-region) route.
Figure 89 highlights link volumes on various roadway segments within Illinois. Five classifications are listed; however, only four are shown, as the 0-200 category range is ubiquitous throughout the map if shown. The I-55 corridor stretching from Chicago to the edge of the Sangamon County hinterland is a significant road segment as link volumes are quite high for in-state freight travel (see Figure 89).
Region Maps
Figure 90 highlights the cascading effects from a disruption of the I-55 and IL Route 66 corridors (Tier 1 routes) on TAZs within Illinois. On this map and the next two maps, the trend is quite similar. TAZs that are close to the selected roadway segment are most affected by the disruption. For Figure 90, the affected TAZs are situated quite close to the selected route. There are numerous TAZs scattered around Illinois that are also affected by a Tier 1 disruption.

Figure 91 highlights TAZs impacted by disruptions to the I-70 corridor (Tier 2 route). TAZs affected by the Tier 2 route disruption are vast. Almost the entire southern half of Illinois looks to be affected by a disruption to the Tier 2 route.

Figure 92 shows cascading effects of a disruption to IL Route 29 (Tier 3) on TAZs within Illinois. For the Tier 3 route disruption scenario, TAZs that are affected are close to the disrupted route, as well as being quite scattered throughout the entire state.

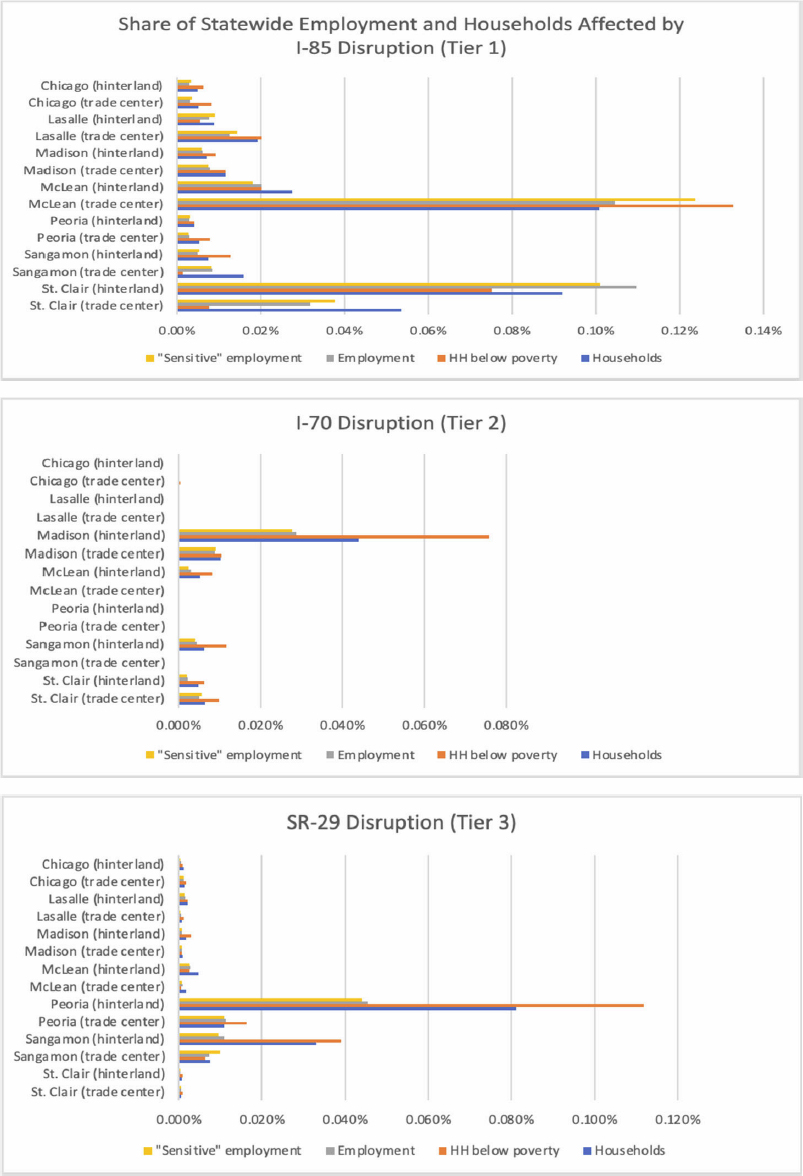
In Figure 93, impacts of disruptions to key freight corridors (Tier 1, Tier 2 & Tier 3) are shown as the statewide share of households, households living in poverty, employment, and employment in “sensitive” job categories affected in each trade center and hinterland. For example, a disruption to I-55 south of Chicago would have the greatest impacts on employment and mobility in the McLean and in St. Clair areas. In McLean alone, the number of households living in poverty affected by a disruption to I-55 represents approximately 12 of every 10,000 households living in poverty statewide.
Figure 94 highlights where a disruption on the I-55 and IL Route 66 corridors (Tier 1) would affect freight trips by region. Regions within Illinois include seven trade centers and seven hinterlands. Regions adjacent to Illinois include three MPO service areas in Iowa, Missouri, and Wisconsin, as well as the “halo” region bordering Illinois. Trips to the rest of United States beyond Illinois and its halo are aggregated into Northeast, North-Central, Northwest, Southeast, South-Central, and Southwest. Trips to regions outside of Unites States include Canada and Mexico. The white boxes on the map indicate the number of impacted trips in regions beyond Illinois and its halo, including remaining regions of United States, Canada, and Mexico.
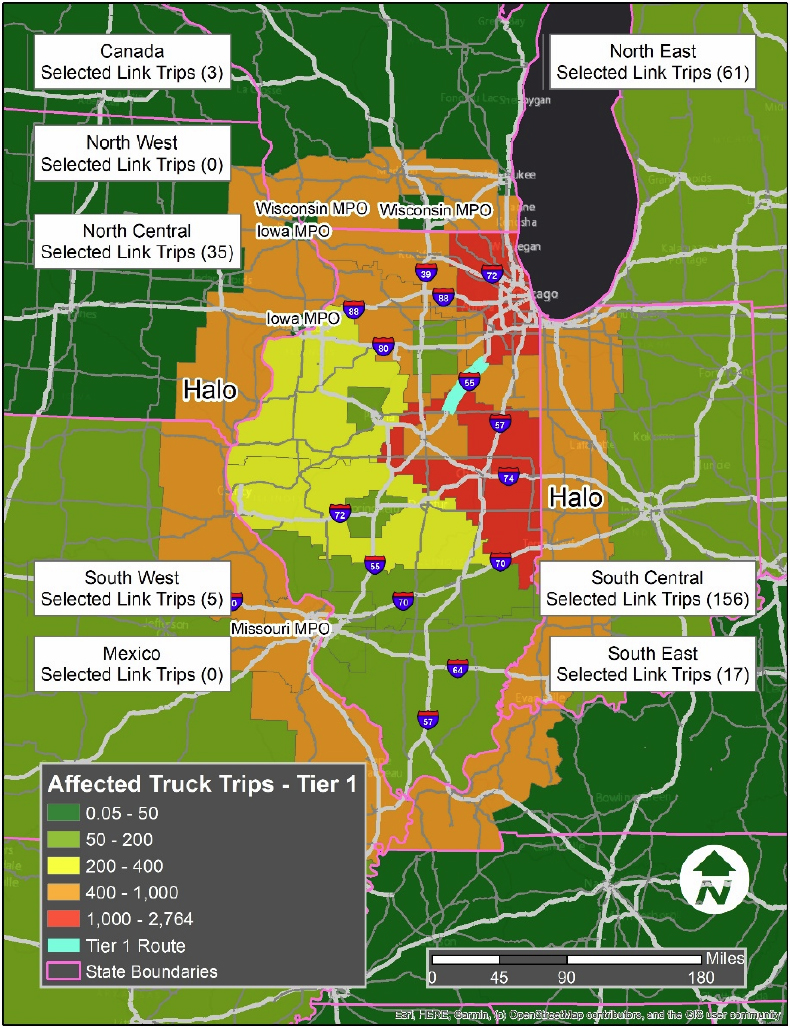
Figure 95 shows the regional share of employment in sensitive sectors impacted by disruption to the I-55 and IL Route 66 (Tier 1) freight corridor. Values are weighted by select-link trip shares and divided by total value of that variable in the region to create regional share. A large portion of the eastern region in Illinois has a particularly high employment sensitivity impacted by the Tier 1 corridor disruption.

Figure 96 shows the regional share of households below poverty impacted by a disruption to the I-55 and IL Route 66 corridor. Variable values are weighted by select-link trip shares and divided by total value of that variable in the region to create regional share. There is a high percentage share of households below poverty impacted by a Tier 1 corridor disruption on the eastern side of Illinois. There is also a significant number of households below poverty that are affected in the central and western portion of Illinois.

Figure 97 shows the number of truck trips that would be affected by a disruption on the I-70 (Tier 2) corridor. The white boxes on the map indicate the number of impacted trips to regions beyond Illinois and its “halo,” including trips to other regions of United States, as well as Canada and Mexico.

Figure 98 shows the regional share of employment in sensitive categories that would be impacted by a disruption to the I-70 (Tier 2) corridor east of the Madison and St. Clair trade centers. Variable values are weighted by select-link trip shares and divided by total value of that variable in the region to create regional share. From this calculation, we can see there is a particularly large region that looks like a red belt that is heavily impacted by a Tier 2 disruption.

Figure 99 highlights the regional share of households below poverty impacted by a disruption to the I-70 corridor (Tier 2). Variable values are weighted by select-link trip shares and divided by total value of that variable in the region to create regional share. The red belt appears again with the calculations, and parts of eastern Missouri (St. Louis area) are affected by a Tier 2 disruption scenario.
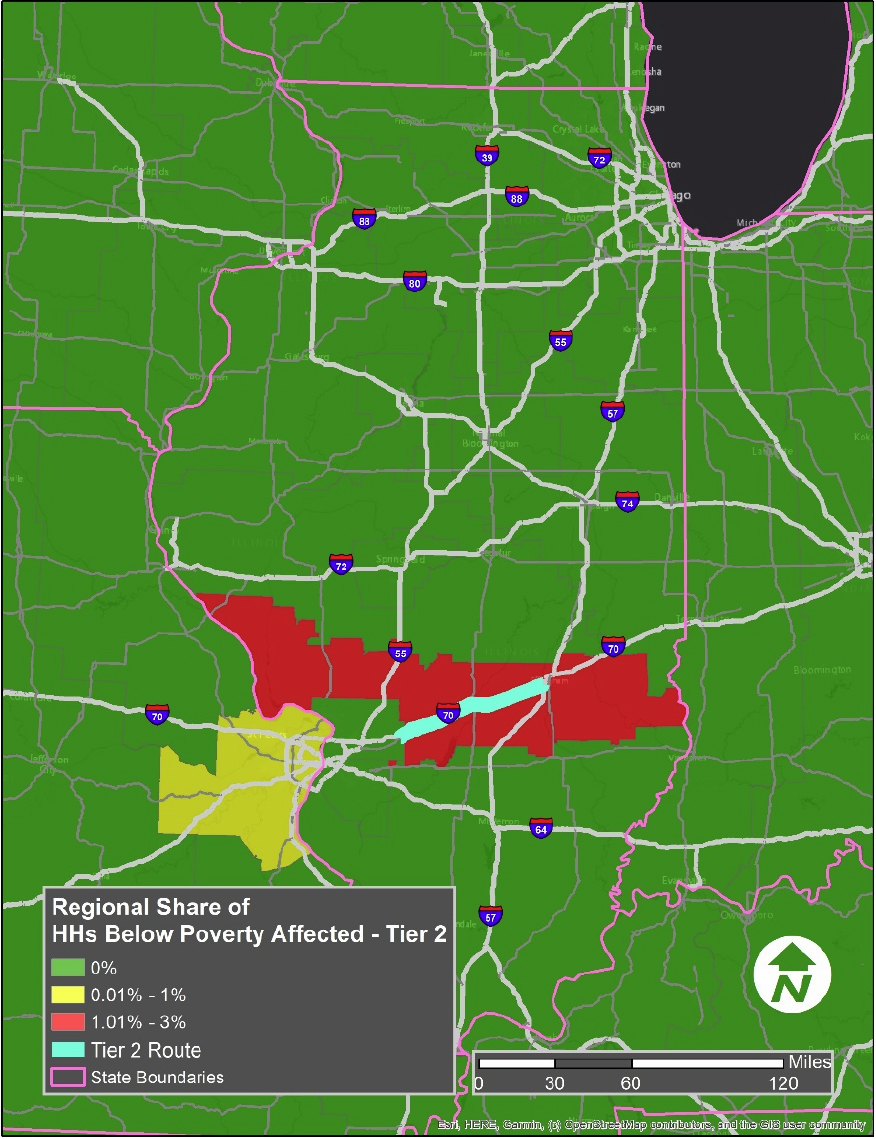
Figure 100 indicates the number of truck trips that would be affected by a disruption on the IL Route 29 corridor (Tier 3). The white boxes on the map indicate the number of impacted trips to regions beyond Illinois and its “halo,” including other regions of United States, Canada, and Mexico.
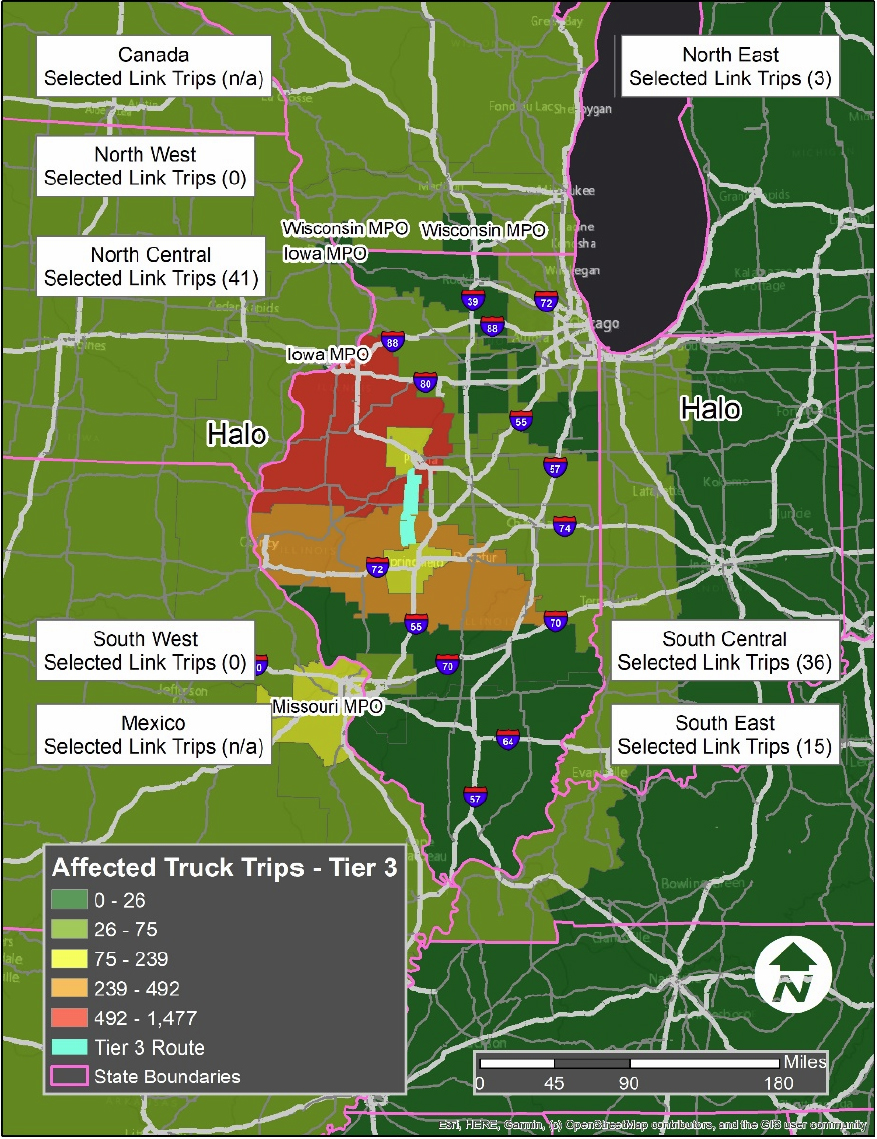
Figure 101 highlights the regional share of employment in sensitive categories impacted by a disruption to the IL Route 29 corridor (Tier 3). Variable values are weighted by select-link trip shares and divided by total value of that variable in the region to create regional share. From this calculation, we can see there is a particularly large region located within the northwestern part of Illinois that is affected by a Tier 3 disruption.
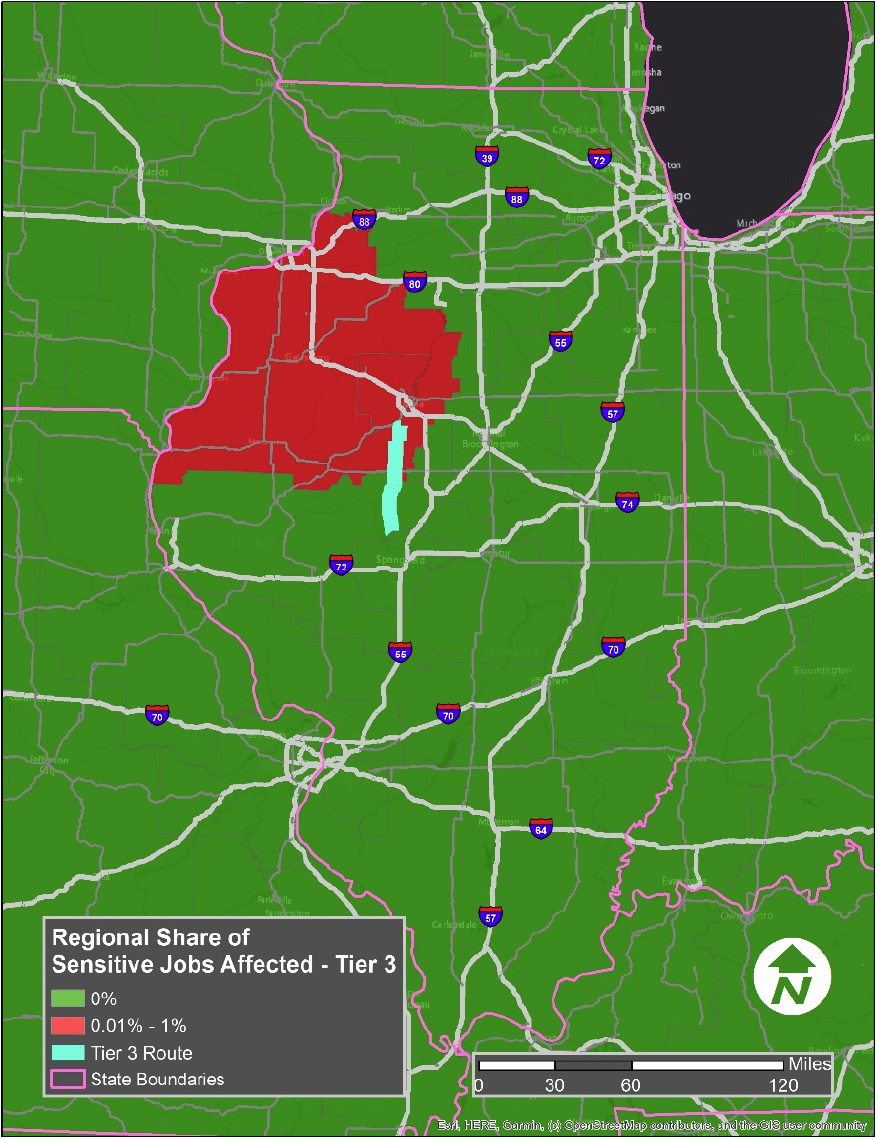
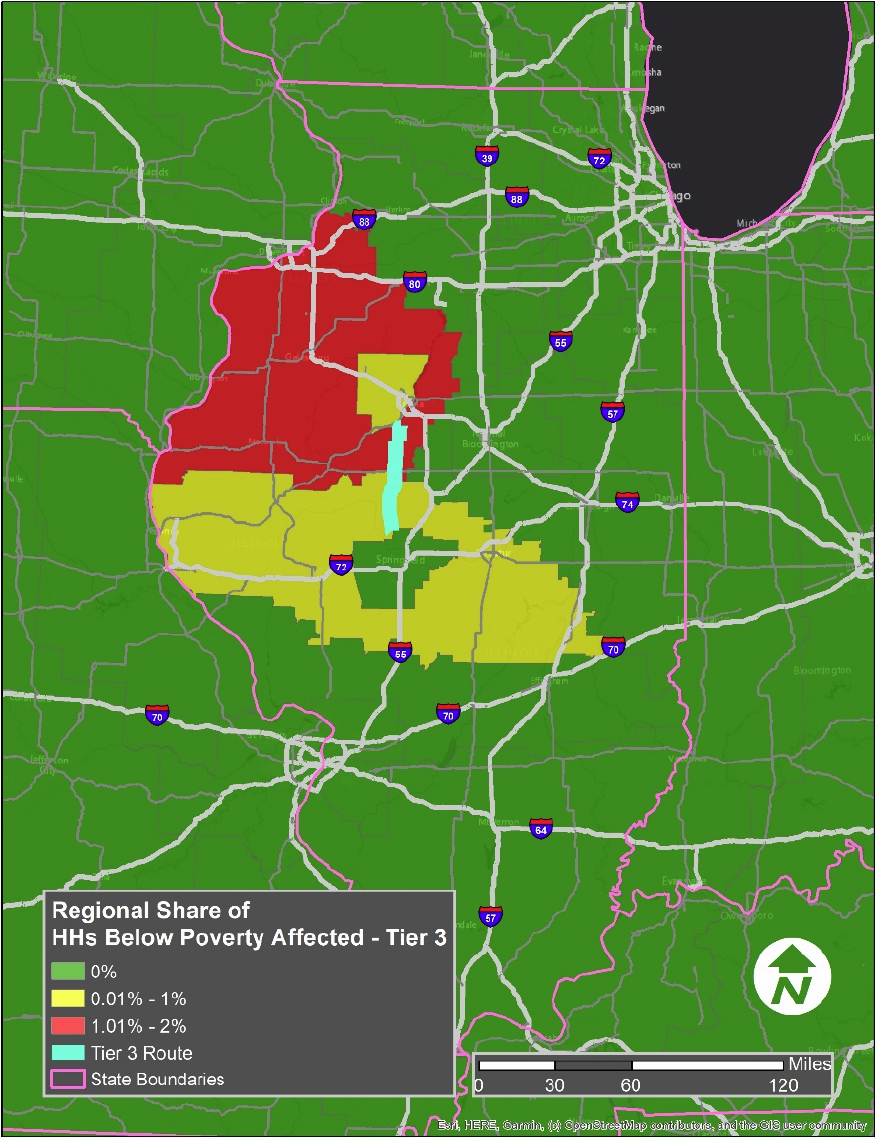
Figure 102 shows the percentage of households below poverty impacted by a disruption to the IL Route 29 (Tier 3). Variable values are weighted by select-link trip shares and divided by total value of that variable in the region to create regional share. Based on the calculations, the northwest portion of Illinois seems to have the most impact households below poverty based on a Tier 3 disruption. Moreover, households within the central Illinois seem to be affected as well.
TAZ Maps
Figure 103 shows the number of households below the poverty level affected by a disruption to the I-55 and IL Route 66 (Tier 1) corridor between Mclean and Chicago.

Figure 104 shows the number of households above the poverty level affected by a disruption to the I-55 and IL Route 66 (Tier 1) corridors between Mclean and Chicago, east of Madison and St. Clair trade centers.

Figure 105 shows the number of freight trips by TAZ affected by a disruption to the I-55 and IL Route 66 (Tier 1) corridor. Most zones are primarily located right on the border of Illinois. As expected, zones are located close to the selected corridor. Other zones are scattered throughout the state as well as the region.
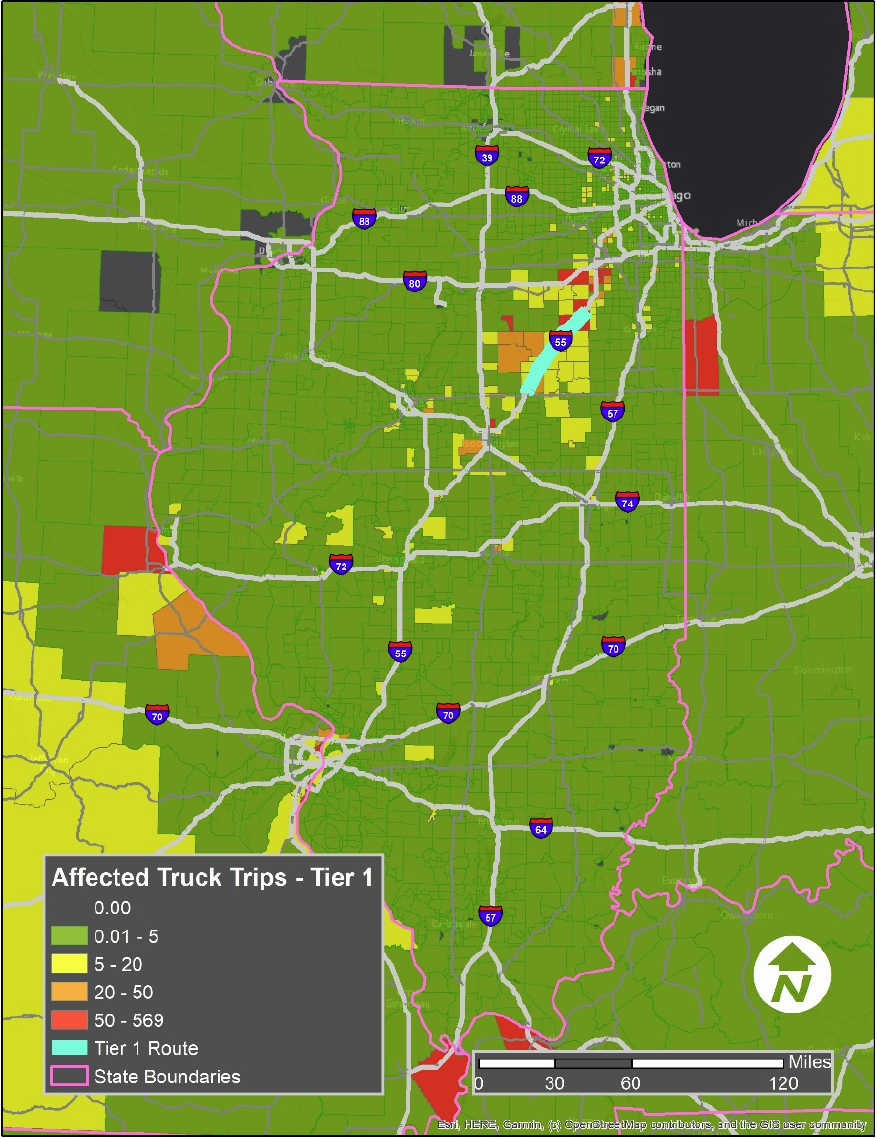
Figure 106 shows the number of jobs in high sensitivity categories (by zone) affected by a disruption to the I-55 and IL Route 66 (Tier 1) corridor weighted by share of trips using the corridor. As shown on the map, zones with relatively high sensitivity are located on the Tier 1 route, along with zones being affected in and out of Illinois. A large number of zones are affected within Missouri.
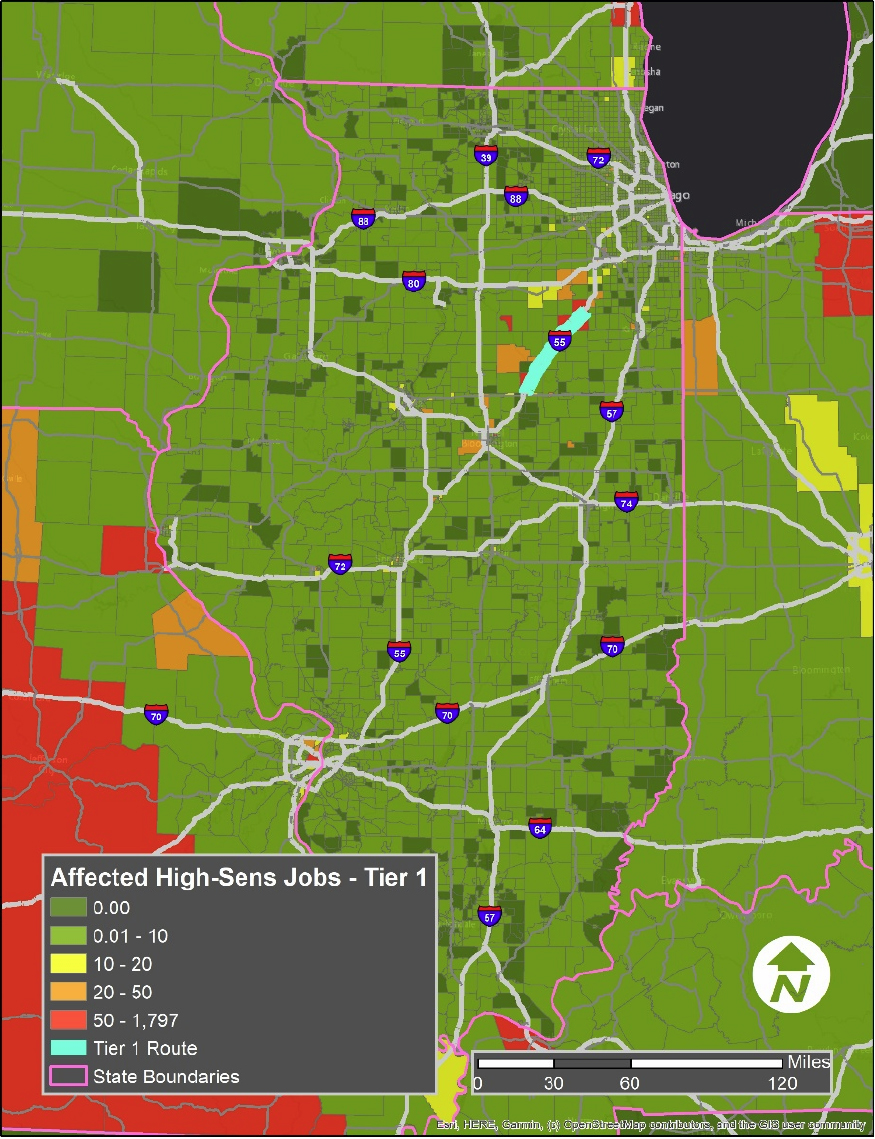
Figure 107 shows the number of households below the poverty level affected by a disruption to the I-70 (Tier 2) corridor east of the Madison and St. Clair trade centers.
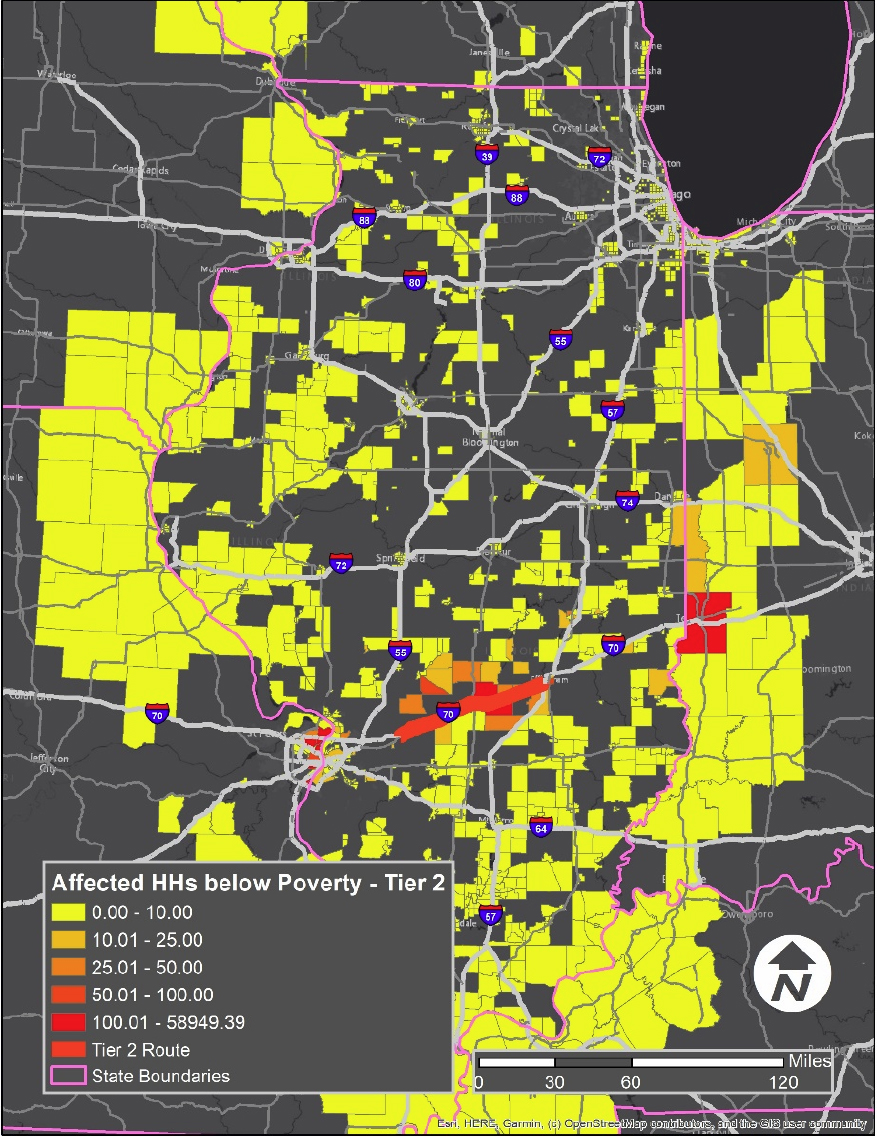
Figure 108 shows the number of households above the poverty level affected by a disruption to the I-70 (Tier 2) corridor east of the Madison and St. Clair trade centers.

Figure 109 shows the number of trips by TAZ affected by a disruption to the I-70 (Tier 2) corridor. Based on the map, there are not many trips taking the Tier 2 route. The most significant zones are the ones located in Indiana close to the eastern border of Illinois. There are also a few zones located in the southern portion of Illinois, along with zones in St. Louis, Missouri, near the western border of Illinois.
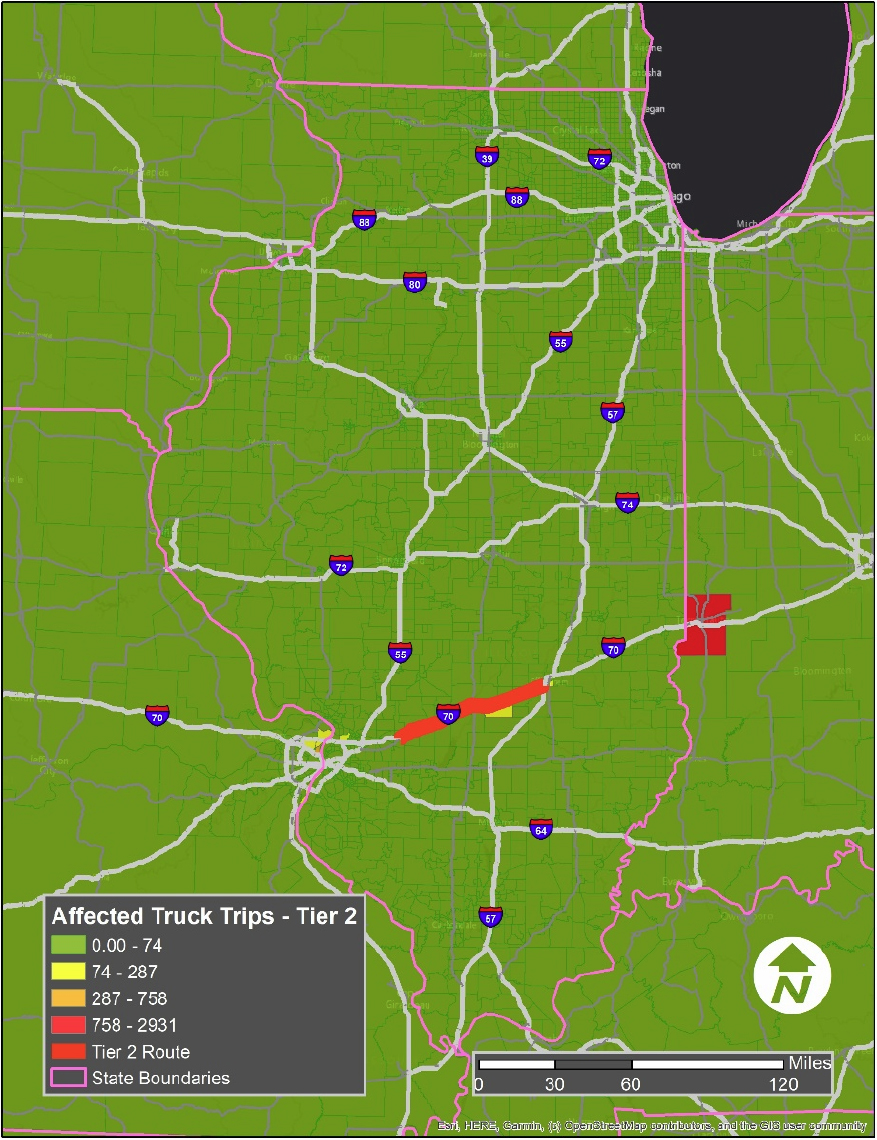
Figure 110 shows the number of jobs in high sensitivity employment categories affected by a disruption to the I-70 (Tier 2) corridor weighted by share of trips using the corridor. The most affected zones are in Indiana, near the eastern border of Illinois, Indianapolis, Indiana, and many zones located within central Missouri. Interestingly, there are essentially no zones within Illinois.
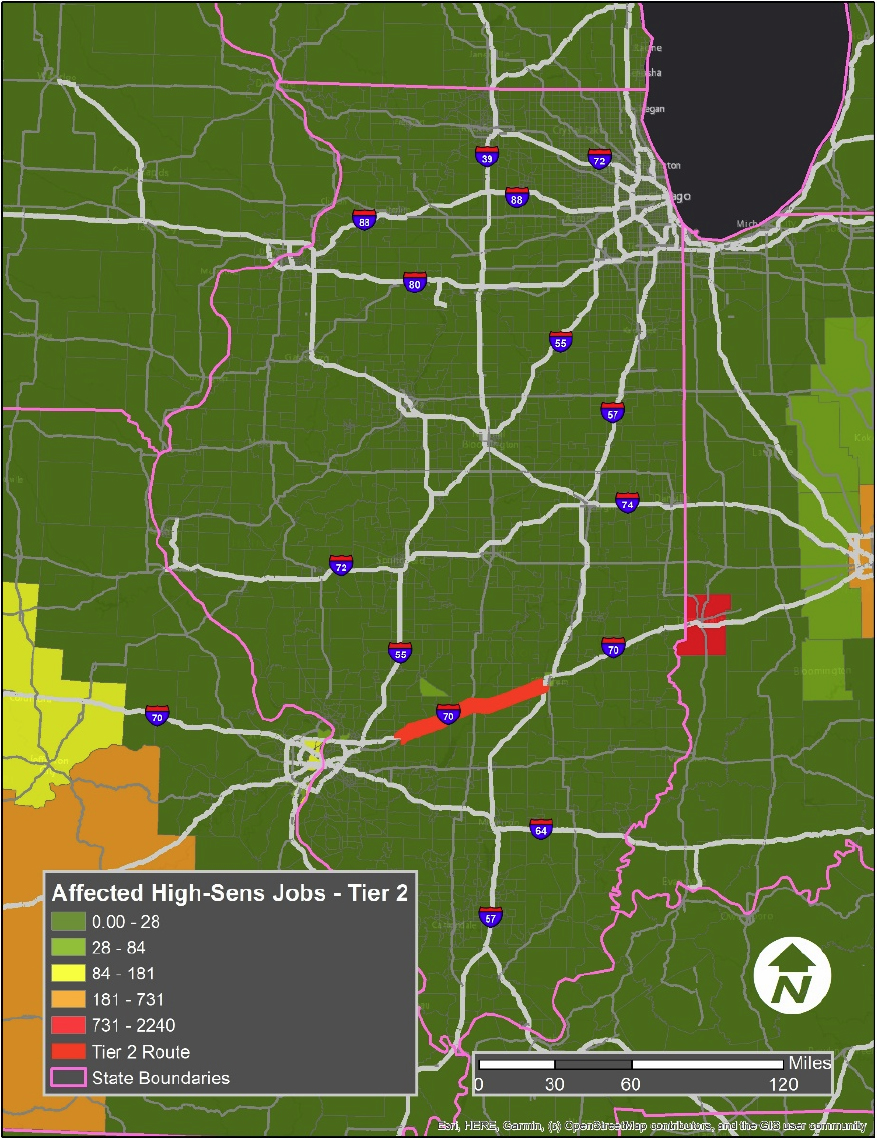
Figure 111 shows the number of households below the poverty level affected by a disruption to the IL Route 29 (Tier 3) corridor.

Figure 112 shows the number of households above the poverty level affected by a disruption to the IL Route 29 (Tier 3) corridor.
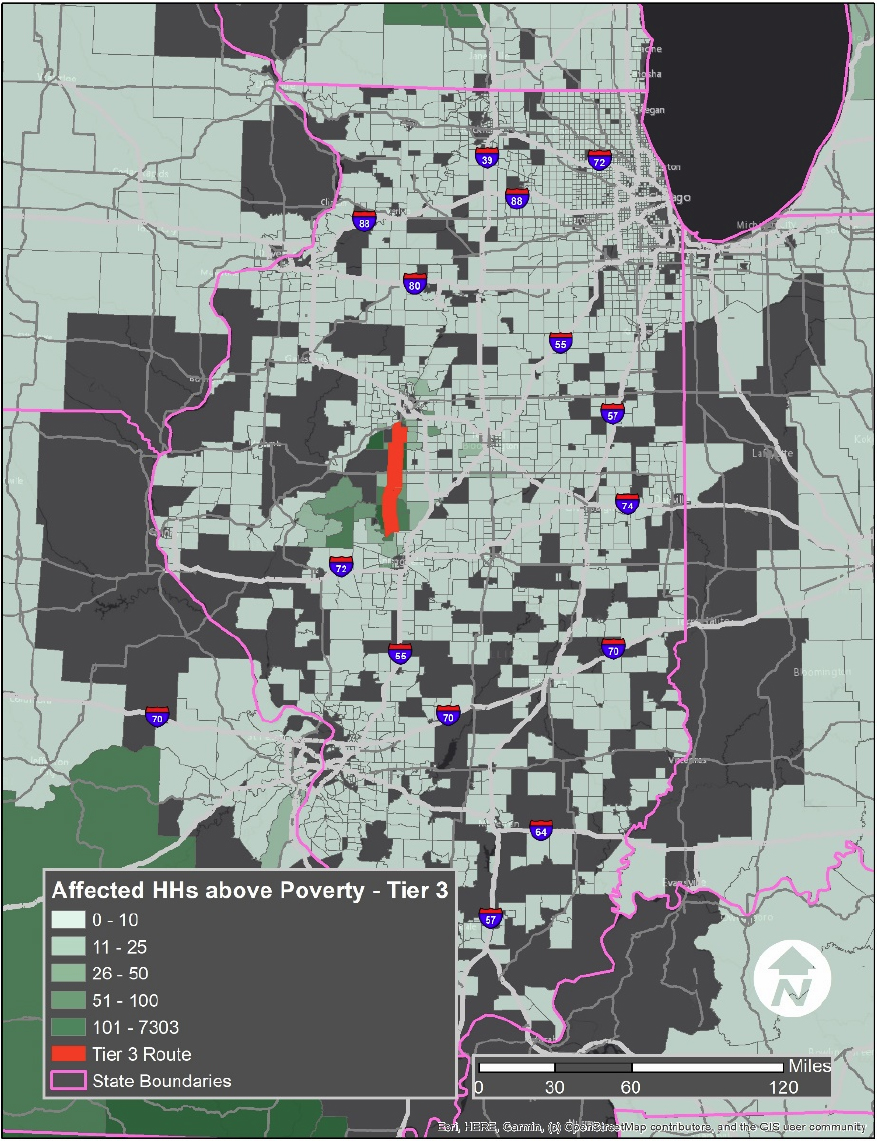
Figure 113 shows the number of trips by TAZ affected by a disruption to the IL Route 29 (Tier 3) corridor. Based on the map, the highest number of trips using the selected corridor occur in zones close to the corridor itself. Other trips are scattered throughout the region.

Figure 114 shows the number of jobs in high sensitivity employment categories (by TAZ) affected by a disruption to the IL Route 29 (Tier 3) corridor weighted by share of trips using the corridor. Most affected zones are located close to the selected corridor. More affected areas outside of Illinois are primarily located in Missouri, as outlined by the orange masses located on the map below.

Conclusion
The methodologies that were used in this pilot site were successful in highlighting many different cascading effects that may occur using three selected roadway corridors (Tiers 1, 2, and 3). The analysis is sufficient in its findings for the relevant analysis. The sourced data is accurate and provides a clear understanding of cascading impacts for the three routes that were selected.


