Methods for Assigning Short-Duration Traffic Volume Counts to Adjustment Factor Groups to Estimate AADT (2024)
Chapter: 3 State of Practice
CHAPTER 3. STATE OF PRACTICE
INTRODUCTION
The research team conducted a survey to obtain information from states about their current practices and future needs with respect to developing adjustment factor groups and assigning factors to SDCs. The purpose of the survey was to:
- Document relevant state practices.
- Capture potential implementation considerations and challenges.
- Identify states’ needs and potential areas for improvement.
- Identify agencies that could potentially provide the research team with probe data in Phase II of the project.
The survey was initially disseminated in October 2021, and the research team received responses from 20 DOTs. In February 2022, the survey was resent, and an additional 10 DOTs responded. A total of 30 complete responses were received. The survey was distributed to each state’s TRB representative asking them to forward the invitation to an appropriate staff member responsible for traffic monitoring. A copy of the survey transmittal letter and a full list of survey questions can be found in Appendix A. The survey contained 31 questions, which were divided into the following topics:
- Data collection (12 questions).
- Adjustment factor groups (6 questions).
- Assignment of SDCs to adjustment factor groups (9 questions).
- Implementation process (4 questions).
The list of responding agencies can be found in Appendix B, along with all survey responses grouped by question. The next section summarizes key findings from the survey.
SURVEY RESULTS
Figure 4 shows a histogram for the number of SDC sites used by states on all functional classes and lower functional classes (6R, 7R, 7U). The number of sites varies widely, but the most common responses were a total number of sites in the 5,000–10,000 range, of which 0–5,000 were located on lower functional classes. Three respondents indicated that their agency does not maintain any SDC sites on lower functional classes. One state indicated that 30,000 SDC sites are consistently counted every four years, but another 123,000 historical and new sites remain active and counted on an as needed basis. One state reported that since the implementation of the Model Inventory of Roadway Elements requirements, they have dramatically increased the number of short-term count sites from 40,000 to 215,00 sites that are counted on 1-, 3-, 5-, or 15-year cycles, depending on the type of road.
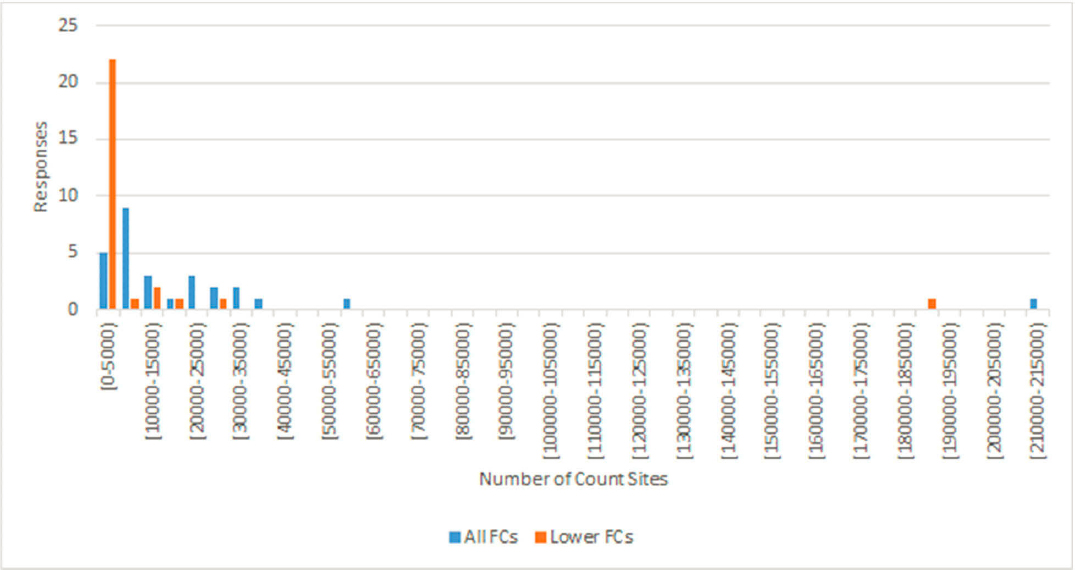
Figure 5 summarizes states’ responses about the days of the week on which they conduct SDCs. The most common practice is to exclude Fridays and the weekend, although some states do count on these days.

Figure 6 shows the months in which states conduct SDCs. All respondents conduct counts in May, June, September, and October, and 11 states count in all months of the year. Most states exclude one or more months in the winter, while one state also excludes summer months
(July and August). Six respondents noted in comments that they sometimes conduct counts in February, March, October, and November, weather permitting, or with restrictions based on geographic area or period (e.g., count only in the first two weeks of November, or stop counting in mid-October or November when snow falls).
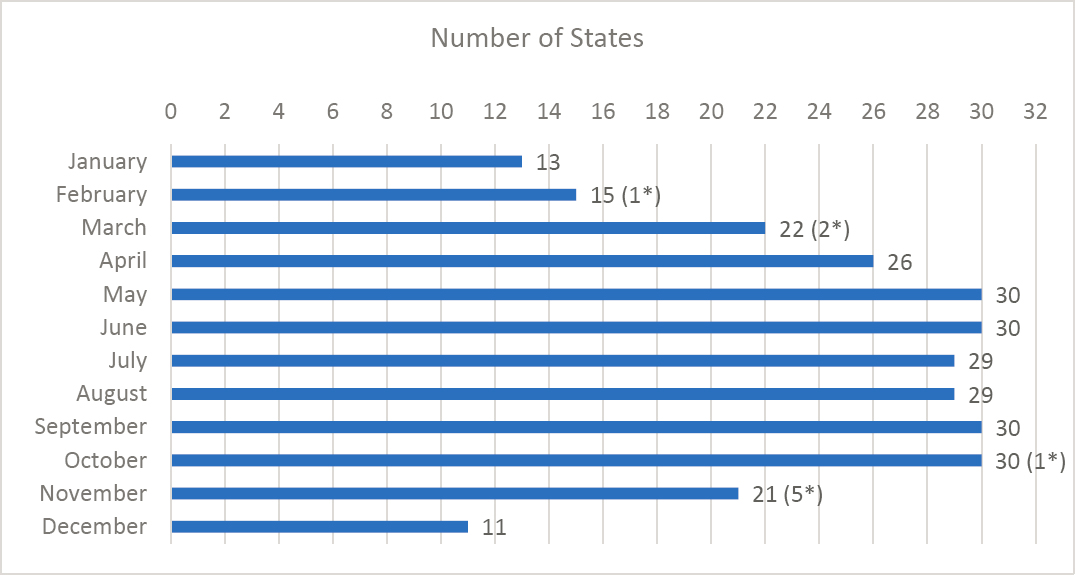
*Responses indicating that counts in this month are restricted by weather conditions, geographic area, and/or holiday periods.
Figure 7 shows the typical duration of SDCs. Most states conduct 48-hour counts. Some respondents indicated that the duration depends on the purpose (e.g., 72 hours for volume and 7 days for classification) and the technology (e.g., they typically conduct 48-hour counts, but they reduce them to 24 hours if video has to be used). The three “other” responses noted that the state conducts counts shorter than 24 hours for turning movement or classification purposes.

Figure 8 shows states’ responses about their plans for using probe data/estimates. The majority of respondents are open to the idea of using probe data. Two respondents mentioned that they have a current pilot or test underway, while two other respondents stated that they intend to use probe data once approved by FHWA.

Figure 9 shows how the respondents currently calculate adjustment factors for each permanent site. Most states rely on a vendor to calculate adjustment factors. In-house methods vary and include Excel or Access, SQL, mainframes, and R.

Figure 10 shows the methods that states use to develop adjustment factor groups. Roadway functional class and rural/urban designation are by far the most common grouping attributes. In the “other” category, respondents mentioned having summer seasonal and winter seasonal groups, groups for rural interstate segments, combinations of two or more methods (e.g., functional class and volume), inherited geographical system, separate factors for city and state, and coefficient of variation methods.
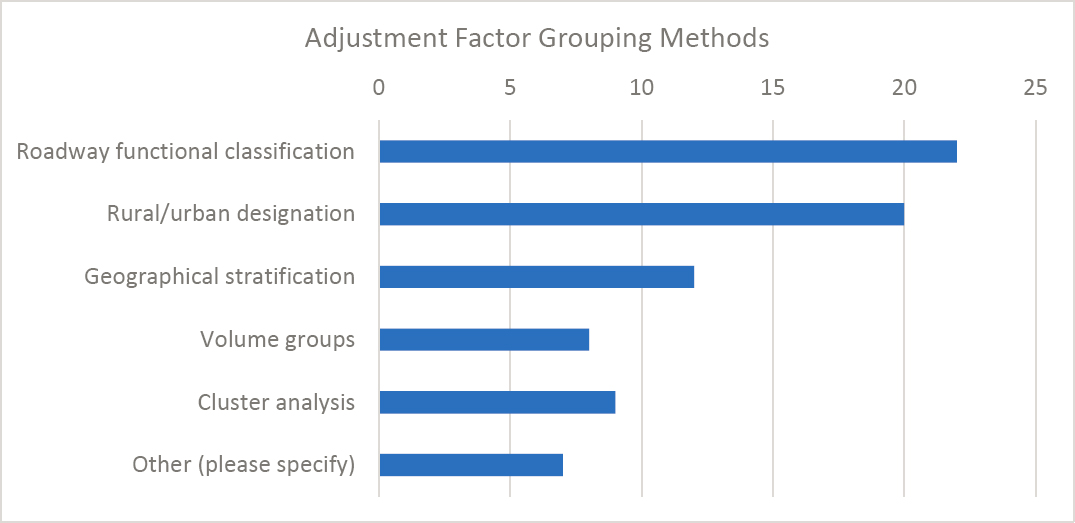
Figure 11 shows how states assign counts to factor groups. The most common practices are to use functional class and/or rural/urban designation. “Other” responses to this question mentioned a combination of functional class and rural/urban, interstate segments, seasonal travel patterns, truck percentage, day-of-week patterns, local knowledge, low/medium/high variance group, region, geography, and engineering judgment.
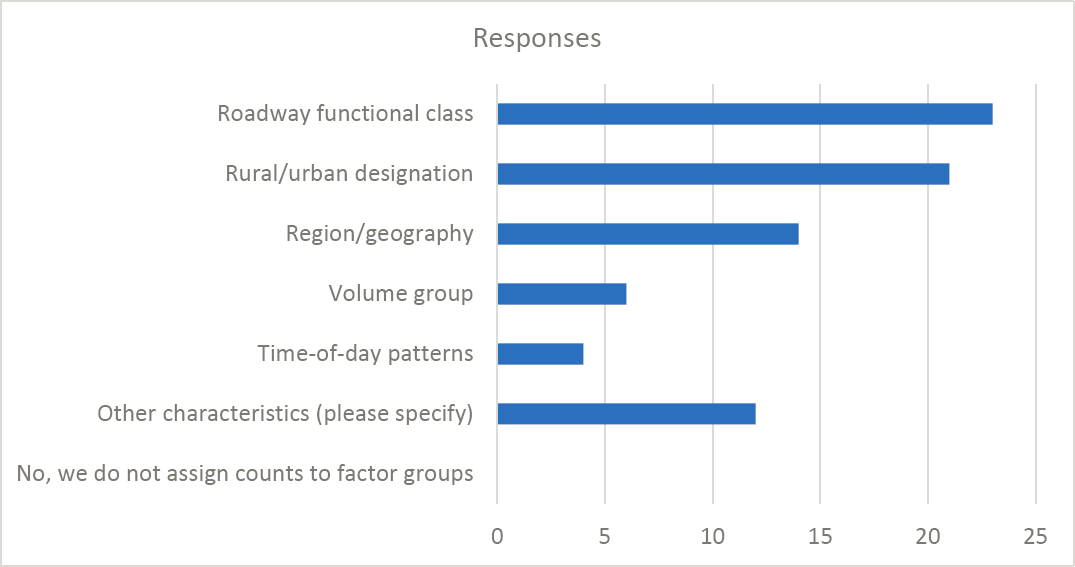
Figure 12 shows which adjustment factors survey respondents use to annualize SDCs. Not surprisingly, the majority of respondents use 84 MDWFs, with MFs being the second most common response. This finding can be partially explained by the fact that relevant exercises and training are provided to practitioners as part of a TMG course. Five states reported “other,” with three of them noting the use of axle-correction factors. One state mentioned using hourly factors of the day, day of the week, and month of the year for 48-hour counts, and only monthly factors for 168-hour counts. The fifth state that reported “other” relied on monthly and day-of-week factors.

Figure 13 shows what software states are using to assign SDCs to factor groups. The majority of respondents use a third-party vendor’s software for this process.

Figure 14 shows how states deal with SDCs on lower functional class roads. Most respondents do factor such counts, although these respondents are about evenly split between
those who develop adjustment factors for lower functional classes (based on rural/urban designation, functional class, etc.) and those who simply apply factors from higher functional classes. Similar to the grouping methods used for all roads (see Figure 10), the use of roadway functional class is more common for lower functional classes, but otherwise the ranking of grouping methods is unchanged. The “other” responses to this question mentioned cluster analysis, a combination of functional class and rural/urban code, engineering judgment, and the application of the closest seasonal cluster match and rural/urban code for future counts.

Figure 15 shows states’ practices for updating the assignment of an SDC site to a factor group. Most states responded that updates are relatively infrequent, with assignments being updated every 6–10 years or less for most states. The “other” responses indicated that factor group assignments are rarely changed but may be reviewed if there are changes to the functional class, the land use around the site, or the counts taken in an odd time of year, or if analysts notice a data anomaly.

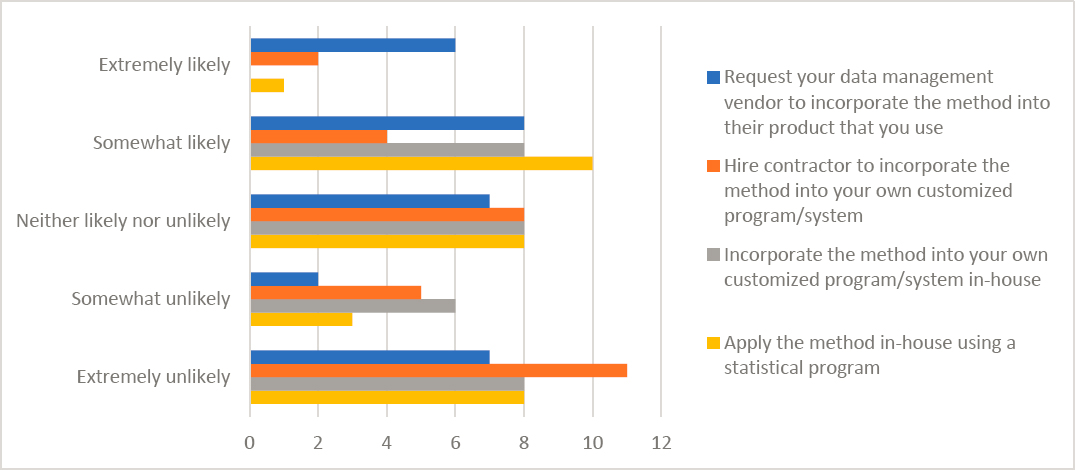
Figure 16 shows states’ opinions of different scenarios for implementing a new statistical method. Note that the only scenario rated as “extremely likely” was asking a vendor to implement the new method. Some respondents indicated an openness to implementing methods in-house, but more than half of states rated these scenarios as “neither likely or unlikely,” “somewhat,” or “extremely unlikely.” Hiring a contractor to implement a method in a customized program or system received the lowest ratings of the four scenarios.
Q29 asked respondents to create a ranked list of potential barriers to implementing a statistical method. Table 15 shows the average ranking of each potential barrier, sorted from low (most important) to high (least important). “Other” responses to Q29 included concerns about the impact to AADT values if there was a large change in the adjustment factors, FHWA approval of statistical methods, vendor support for implementation, no need for a statistical method, staff
training, and the need to research the benefits of any new methods. The ranking of these potential barriers suggests that states are primarily concerned about the difficulty of implementing a statistical method, particularly if it requires more resources, time, or input data than their existing practices.
Table 15. Summary of Responses to Q29 about Barriers to Implementing a Statistical Method.
| Potential Barrier | Avg. score (1: most important, 8: least) |
|---|---|
| Limited resources (budget and staff) | 2.6 |
| Limited time | 3.6 |
| Difficult to incorporate method into existing systems | 3.8 |
| Difficult to gather, process, and incorporate new data variables | 4.4 |
| Limited knowledge in statistics and programming | 4.5 |
| Lack of statistical software | 5.0 |
| Difficult to interpret and communicate results | 5.1 |
| Other (please specify) | 7.0 |
Q30 asked respondents what kind of information and research products would help them select and adopt an assignment method. The majority of the respondents indicated that a guide, approval of new assignment methods by FHWA, training materials, and coding in R and Python would be keys to selecting and adopting a different method in the future. Figure 17 shows what resources states are currently using to select and implement traffic monitoring methods (Q31). FHWA’s TMG is the most widely used. The N/A (not applicable) category includes respondents who did not identify any resources as well as two respondents who noted that their methods have been in place for many years and did not know the resources used to develop them.


