Developing a Research Agenda on Contrails and Their Climate Impacts (2025)
Chapter: 3 Atmospheric Measurements
3
Atmospheric Measurements
Atmospheric measurements of meteorology, naturally occurring aerosols, and contrail properties are necessary to validate contrail prediction models and to improve scientific understanding of where contrails form and persist. Such measurements may be from ground- and space-based remote sensors, as well as airborne in situ platforms such as aircraft and balloons. This chapter describes measurement needs for identifying ice-supersaturated regions (ISSRs) in the atmosphere and discusses research to characterize the naturally occurring atmospheric aerosol background of the upper troposphere.
Model predictions of atmospheric ice supersaturation and contrail formation/persistence can be improved by ingesting cruise altitude meteorological observations, of which the measurement of water vapor is the most critical. There is a need to develop new in situ water vapor sensors with improved reliability and accuracy to fly autonomously and downlink data from the commercial aircraft fleet in near real time. These in situ aircraft measurements are the most relevant and cost-effective approach to improving numerical weather prediction models, as demonstrated by current airborne observation networks complemented by weather balloons and satellite remote sensing. Satellite temperature and water vapor soundings (i.e., vertical profiles) hold promise for global model improvement, while space- and ground-based imagers aid in contrail detection and monitoring that could be enhanced by collocation with aircraft flight track information. Methods for assimilating remote sensing observations into models are an important area of active research. Camera imagery (ground, airborne, and satellite) captures the essence of contrails as human fingerprints on the Earth system and presents opportunities for public outreach and education as well as citizen-science activities to develop robust data sets for testing model predictions and remote sensing retrievals. Finally, this chapter highlights the need for improved characterization of upper tropospheric background aerosols to better understand the role of these particles in contrail formation for “soot-poor” engines as well as to quantify the aviation emissions impacts on aerosol-cloud interactions within naturally occurring cirrus clouds.
MEASUREMENTS OF ATMOSPHERIC STATE PARAMETERS
As discussed in Chapter 1, contrails form when the cooling aircraft engine exhaust plume becomes supersaturated with respect to liquid water (i.e., the Schmidt–Appleman criterion; Appleman 1953; Schmidt 1963; Schumann 1996), which depends on the atmospheric state parameters (temperature, pressure, winds, and humidity), as well as engine and fuel characteristics. The contrail ice crystals further persist and grow into a contrail cirrus cloud as long as the surrounding atmosphere is supersaturated with respect to ice; otherwise, the contrail sublimates. Since only persistent
contrail cirrus are climatically relevant, it is critical to be able to forecast and diagnose these ISSRs of the atmosphere, which are thought to be horizontally vast (~hundreds of kilometers) but vertically shallow (~hundreds of meters) (Sausen et al. 2024; Spichtinger and Leschner 2016). However, this understanding is limited by the generally coarse vertical resolution of current satellite remote sensors (~2–3 km) and a dearth of in situ observations of temperature and humidity, particularly away from land-based radiosonde networks.
Finding: A large uncertainty in characterizing the location and extent of persistent contrail formation is the ability to observe and/or predict ISSRs. Ice supersaturation depends on the upper tropospheric temperature and humidity.
Recommendation: NASA should support research and observational studies to improve the understanding of the extent and frequency of ice-supersaturated regions (ISSRs) and the level of skill in simulating ISSRs and contrails.
Aircraft-, balloon-, and satellite-based observations are critical, complementary data for constraining numerical weather prediction model forecasts and nowcasts that underpin the ability to diagnose ISSRs as well as broader societal weather concerns. In the United States, observational data are ingested into the National Weather Service (NWS) Meteorological Assimilation Data Ingest System (MADIS), including the following:
Radiosondes measuring temperature and humidity profiles are released one to four times per day and have good coverage over North America and Europe (typically <500 km horizontal separation), but they are sparse or non-existent over much of the globe. Radiosondes are costly (about $300 each) and also raise concerns about their ecological impacts. Aircraft-based operational soundings overcome these limitations through deployment of reusable sensors that bring the cost of a sounding down significantly (Marshall 2024), but commercial sensors certified for commercial aircraft currently lack adequate accuracy and reliability to measure humidity at cruise altitudes. Meanwhile, satellite soundings possess global coverage, but their limited vertical resolution is not a replacement for the high-quality information afforded by in situ atmospheric sensors.
Finding: Accurate, high spatial (particularly vertical) resolution measurements of humidity and temperature are needed to constrain model forecasts/nowcasts of contrail-forming conditions (i.e., Schmidt–Appleman criterion) and cruise-level ISSRs.
Aircraft are particularly attractive platforms for capturing cruise-level temperature and humidity data and studying contrail formation. There are a small number of research aircraft worldwide that are equipped to comprehensively study the atmospheric composition and dynamics, and these aircraft routinely conduct process-level studies and field campaigns related to contrail formation and ISSRs. Large research aircraft such as the recently retired NASA DC-8 and its much anticipated 777-200ER replacement (expected 2026 entry into service) can host a large number of in situ and remote sensing instrument groups. Recent large aircraft experiments such as the 2023 NASA Boeing ecoDemonstrator and 2018 NASA DLR ECLIF-2/ND-MAX campaigns included broad industry, academia, and international participation. Smaller research aircraft such as the NASA Gulfstream III and V aircraft,
___________________
1National Oceanic and Atmospheric Administration (NOAA), “Radiosonde Dataset,” National Centers for Environmental Prediction, https://madis.ncep.noaa.gov/madis_raob.shtml, accessed December 1, 2024.
2NOAA, “Aircraft Based Observation (ABO) Dataset,” National Centers for Environmental Prediction, https://madis.ncep.noaa.gov/madis_acars.shtml, accessed December 1, 2024.
3NOAA, “Satellite Sounding Dataset,” National Centers for Environmental Prediction, https://madis.ncep.noaa.gov/madis_satsnd.shtml, accessed December 1, 2024.
the DLR Falcon and HALO G-V, and the NCAR G-V are also suitable for targeted studies employing a more limited number of instruments and/or investigators. Some recent relevant small aircraft flight campaigns over the past decade include 2024 CODEX, 2021–2023 DLR VOLCAN, 2021 DLR ECLIF-3, 2021 DLR CIRRUS-HL, 2013-2014 NASA DLR ACCESS, and 2014 DLR ML-CIRRUS.
While such studies are invaluable for advancing the scientific understanding of these phenomena and case study validation and verification, they are too infrequent and spatially sparse to be relied on for operational weather forecast data assimilation. Commercial aircraft, on the other hand, are much more relevant to forecast model ingest and assimilation given their large spatiotemporal coverage at cruise altitudes. These aircraft are also not designed to readily fly complex, state-of-the-art scientific instrumentation or bulky inlets. Instruments must be designed to be easily integrated into existing airframes and avionics, which can be a limiting factor in the number of available meteorological observations. Fortunately, temperature, pressure, and wind sensors are also important flight parameters and are readily available on all commercial aircraft. Water vapor sensors are currently much more limited both in terms of instrument accuracy and calibration stability as well as deployment across the global commercial fleet.
Meteorological Observations from Commercial Aircraft
Commercial aircraft have long provided meteorological soundings of temperature as well as wind speed and wind direction during ascent and descent through the World Meteorological Organization (WMO) Aircraft Meteorological Data Relay (AMDAR4) program. In the United States, the National Oceanic and Atmospheric Administration’s (NOAA’s) Aircraft-Based Observation Program contributes to AMDAR and MADIS through the Aircraft Communications, Addressing, and Reporting System (ACARS). Data are purchased contractually from Collins Aerospace as the ACARS communications provider who owns the air-to-ground very-high-frequency (VHF) communications infrastructure and has subcontracting relationships with almost all of the U.S. commercial airlines. The contract was held by the Federal Aviation Administration (FAA) from the late 1990s until 2016 and then transitioned to the NWS in 2017. Currently, the United States procures and provides about 3 million AMDAR soundings per year worldwide covering 3,500 aircraft in the U.S. commercial fleet. A subset of United Parcel Service and Southwest aircraft (approximately 135 in number) additionally provide water vapor soundings through the Water Vapor Sensing System (WVSS) program. Many of the WVSS program aircraft are older and in line for retirement in the near future, which motivates the need for newer, replacement sensors that can be certified for installation on the current and future commercial aviation fleet. Aircraft profile data are collected at shorter intervals for the landing and take-off cycle (6, 20, and 60 seconds for take-off, climb, and approach segments, respectively). En route cruise altitude data are collected at 3-min intervals (roughly 45 km distance assuming a nominal airspeed of 900 km/hr), and it is an open question whether this measurement frequency is sufficient to resolve ISSRs. The challenge of data frequency is even more acute for satellite communications pathways such the Automatic Dependent Surveillance-Contract datalink system currently providing temperature and winds data with 14 min (i.e., 210 km distance) resolution. The longer en route data intervals are not due to instrument response time and are driven by the need to balance data volume with the communications costs and throughput limitations associated with the VHF and satellite downlink.
While the existing air-to-ground communications and NWS ingest pathways are suitable for connecting aircraft temperature, pressure, and humidity measurements to weather forecasting objectives, there are opportunities to improve and optimize the system specifically to inform ISSR and contrail prediction. First, research is needed to understand the necessary measurement spatiotemporal resolution to resolve vertically thin but horizontally large ice-supersaturated layers, which involves both the number of aircraft sensors deployed across the fleet and their reporting intervals. Second, incorporating meteorological information into new and existing communications technologies could facilitate significant cost and efficiency savings. A particularly promising approach would be to leverage broadband communications pathways currently available for in-flight Internet connectivity
___________________
4World Meteorological Organization, “The WMO AMDAR Observing System,” https://community.wmo.int/en/activity-areas/aircraft-based-observations/amdar, accessed December 1, 2024.
in the passenger cabin to increase the information available from the aircraft as a comprehensive atmospheric sensor; however, attendant cybersecurity concerns would need to be considered before connecting aircraft data systems with the in-cabin network. Another approach would be to use the existing weather element placeholder for water vapor to broadcast this information alongside temperature and wind data via the Automatic Dependent Surveillance-Broadcast (ADS-B) system.
In Situ Water Vapor Sensors on Commercial Aircraft
Instrumenting commercial aircraft with a minimum complement of in situ sensors is a promising method for increasing the observational coverage of ISSRs. As discussed above, robust methods for measuring static temperature, static pressure, and winds are commonplace across the fleet, but a key gap is a similarly robust water vapor sensor that has sufficient sensitivity and accuracy to capture the low mixing ratios of the upper troposphere. Figure 3-1 shows the water vapor sensor measurement ranges necessary for the calculating Schmidt–Appleman criterion and ice supersaturation prerequisites for contrail formation and persistence as well as some examples of current sensors that would cover this range. For typical atmospheric temperatures at cruise altitudes (200–300 hPa pressure levels), an instrument with 1–2 ppm accuracy down to 20–30 parts per million by volume (ppmv) is a reasonable goal that would allow for accurate calculations of relative humidity with respect to ice (RHi) near 100 percent at

NOTE: IAGOS, In-service Aircraft for a Global Observing System.
temperatures as cold as −68°C. While an upper measurement range of only several hundred parts per million by volume is required for studying contrail formation and persistence, it would be ideal for in situ sensors to also be able to measure near-surface humidity profiles relevant for numerical weather prediction (exceeding 104 ppmv) that are relevant for the convective weather and broader aviation weather concerns.
Most of the sensors listed in Figure 3-1 and Table 3-1 are research-grade instruments, and only two instruments are currently operationally deployed on commercial aircraft and reporting cruise altitude measurements: (1) the FLYHT (formerly SpectraSensors) Water Vapor Sensing System (WVSS-II), which operates via tunable diode laser (TDL) spectroscopy; and (2) the In-Service Aircraft for a Global Observing System (IAGOS) thin film capacitive moisture sensor. While the current generation WVSS-II is generally better suited for lower-altitude (i.e., higher
TABLE 3-1 Instrument Specifications and Selected References for Candidate Water Vapor Instruments for Measuring Atmospheric Ice Supersaturation from Commercial and Research Aircraft Shown in Figure 3-1
| Instrument | Technique | Installation | Range (ppm) | Resolution(s) | Uncertainty | References |
|---|---|---|---|---|---|---|
| Water Vapor Sensing System (WVSS-II), Currently Operational on Commercial Aircraft | Tunable Diode Laser (TDL) Absorption Spectrometry | Inlet | 50–60000 | 0.25–2 | 5% or 50 ppm | Ford 2011; Vance et al. 2015 |
| IAGOS Thin Film, Currently Operational on Commercial Aircraft | Thin Film Capacitive Sensor | External | 10–500 | 60–180 | 5–10% in relative humidity | Helten et al. 1998; IAGOS 2024 |
| Atmospheric Ionization Mass Spectrometer (AIMS) | Mass Spectrometry | Inlet | 1–500 | 0.25 | 7–15% | Kaufmann et al. 2016; Thornberry et al. 2013 |
| Fast In Situ Stratospheric Hygrometer (FISH) | Lyman-α Fluorescence | Inlet | 1–1000 | 1 | 6% or 0.4 ppm | Afchine et al. 2018; Meyer et al. 2015; Schiller et al. 2009 |
| NOAA Water Instrument | TDL Absorption Spectrometry | Inlet | 0.5–2500 | 1 | 5% or 0.23 ppm | Thornberry et al. 2015 |
| Diode Laser Hygrometer (DLH) | TDL Absorption Spectrometry | Open Path | 0.5–40000 | 0.05 | 5% or 0.1 ppmv | Diskin et al. 2002 |
| Vertical Cavity Surface Emitting Laser (VCSEL) | TDL Absorption Spectrometry | Open Path | 0.1–40000 | 0.04 | 5% | Zondlo et al. 2010 |
| High Altitude Lidar Observatory (HALO) | Differential Absorption Lidar (DIAL) | Open Path | 1–25000 | Variable 5–60 s (horiz.), 250 m (vertical) | Depends on resolution, 5–15% | Carroll et al. 2022 |
| Frostpoint Hygrometer | Chilled Mirror Hygrometer | External | 0.8–25000 | 10–20 | 0.2 K frostpoint or 10% | Stuefer and Gordon 2018 |
| Sophisticated Hygrometer for Atmospheric ResearCh (SHARC) | TDL Absorption Spectrometry | Inlet | 10–50000 | 1 | 5% or 1 ppm | Kaufmann et al. 2018 |
| Instrument | Technique | Installation | Range (ppm) | Resolution(s) | Uncertainty | References |
|---|---|---|---|---|---|---|
| Aerodyne Small Business Innovation Research (SBIR) Prototype | TDL Absorption Spectrometry | Inlet | 10–6000 | 1 | 0.11 ppm | https://techport.nasa.gov/projects/154493 |
| Hygrometer for Atmospheric Investigations (HAI) | TDL Absorption Spectrometry | Inlet | 20–40000 | 1 | 4.3% or 3 ppm | Afchine et al. 2018; Buchholz et al. 2017 |
| Water vapoR ANalyzer (WARAN) | TDL Absorption Spectrometry | Inlet | 100–40000 | 0.4 | 5% or 50 ppm | Afchine et al. 2018 |
| Picarro H2O Analyzer | Cavity Ringdown Spectrometry | Inlet | 100–30000 | 2.8 | 5% or 100 ppm | Karion et al. 2013; Picarro n.d. |
| Chilled Mirror Hygrometer | Chilled Mirror Hygrometer | External | 500–11000 | 50–150 (moist-to-dry transition lag times) | 0.7 K dewpoint (~5 ppm at 11 km assuming a standard atmosphere) | Buck Research Instruments 2024; PST 2024; Vance et al. 2015 |
water vapor concentration) measurements, efforts are under way to extend the measurement range of the WVSS-II and to develop new TDL-based sensors that meet the 20–30 ppmv lower sensitivity requirement. Another key challenge is ensuring calibration stability and minimizing sensor-to-sensor variability that has been observed both in flight and in the laboratory. The Department of Energy’s (DOE’s) Advanced Research Projects Agency–Energy (ARPA-E) has funded a number of promising technology development projects through its Predictive Real-Time Emissions Technologies Reducing Aircraft Induced Lines in the Sky5 (PRE-TRAILS) program, and NASA and DOE have funded water vapor sensor development through their Small Business Innovation Research6 programs. Meanwhile, the IAGOS thin film sensor has performed well across its fleet of specially equipped aircraft, but the sensors have been shown to require regular maintenance and calibration that would be infeasible for routine global airline operations at scale.
Finding: Current in situ sensor systems lack the reliability and calibration stability necessary for widespread deployment across the commercial fleet. Accuracy of 1–2 ppm is desired down to a lower detection limit of 20–30 ppm. Sensors need to integrate with existing aircraft data downlink systems and be certified for new and existing aircraft.
Analysis of data from the IAGOS and WVSS networks provides important insights into the utility of high-accuracy water vapor measurements from commercial aircraft, particularly when assessed in a statistical and climatic sense. However, these networks cover only a small fraction of the global flight routes with a concentration of observations over North America and Europe (Figure 3-2). There is a need to extend these observations to include observations in oceanic flight corridors as well as the rest of the world in order to improve global model predictions of ISSRs and contrail formation and persistence.
___________________
5Advanced Research Projects Agency–Energy, “Document - Pre Trails Project Descriptions,” https://arpa-e.energy.gov/document/pre-trails-project-descriptions, accessed December 1, 2024.
6NASA, “Humidity Probe for Contrail-Cirrus Avoidance,” TechPort, https://techport.nasa.gov/projects/154493, accessed December 1, 2024.

SOURCE: Courtesy of Canadian Meteorological Center, Environment and Climate Change Canada.
SOURCES: Courtesy of FAAM Airborne Laboratory/National Centre for Atmospheric Science and FLYHT Aerospace Solution, https://flyht.com/weather-sensors/tamdar.
Finding: Deployment of a large number of science-quality water vapor sensors across the commercial fleet would be valuable to model cruise-level ice supersaturation for NOAA, FAA, and other national and international stakeholders.
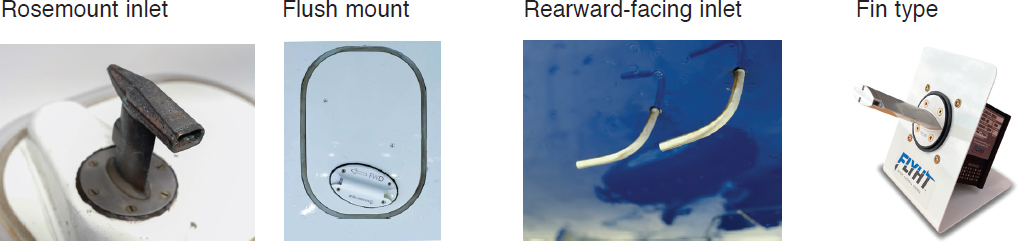
Airframe integration is also another driving consideration, because a suitable water vapor sensor would need to be positioned forward of any doors or other sources of contamination (e.g., in the forward avionics bay) and avoid the need for pumps or other mechanical systems that would wear out quickly and/or increase the maintenance and complexity of the instrument. Flush-mounted, aspirating inlets like that used for the WVSS-II are a promising approach, but also may be susceptible to ingesting water or other contaminants (Figure 3-3).
These considerations were highlighted in a recent WMO workshop on aircraft-based water vapor measurements that took place in December 20237 and the International Air Transport Association “In-Depth” report Aviation Contrails and Their Climate Effect Tackling Uncertainties and Enabling Solutions (IATA 2024).
The information from the temperature, pressure, and water vapor sensors allows for theoretical calculation of whether a contrail will form and persist (to within the sensor uncertainties), but there are other engine and fuel specific parameters that also feed into the calculation of the Schmidt–Appleman criterion that may not be known. Thus, there is also some value to be gained from contrail imaging cameras (e.g., visible and/or infrared) to validate
___________________
7World Meteorological Organization, “Workshop on Aircraft-Based Water Vapour Measurement for Aviation Application,” December 7–8, 2023, https://community.wmo.int/en/meetings/wvm-workshop-2023, accessed December 1, 2024.
if the aircraft is actually forming a contrail in order to account for these additional sources of uncertainty. However, cameras are limited in their ability to determine contrail persistence, and there would be a need for onboard imaging processing and contrail detection in order to limit the necessary bandwidth of information to be downlinked (Figure 3-4). Additionally, there are workload concerns associated with involving the flight crew in monitoring, reporting, or validating contrail formation via in-flight sensors or camera observations, and it is paramount that any crew involvement not impede safety priorities.
Widespread deployment of water vapor sensors, and also possibly cameras, across the commercial fleet serves two important objectives: first, the data can be assimilated into numerical weather prediction models to constrain their prediction skill for forecasting ISSRs, and second, the data can be used to diagnose contrail formation for individual aircraft flights. The key is to achieve an acceptable global coverage while also minimizing the number of sensors that need to be installed on aircraft. Observations are particularly needed for remote oceanic regions where current information is most scarce. Of course, the key question then is how many aircraft will need to incorporate new water vapor sensors in order to meaningfully inform these contrail management objectives. NASA is well positioned to employ its global atmospheric models (discussed in Chapters 4 and 5) to answer this question

through observing system simulation experiments that study the best way to maximize coverage with the minimum capital and operational expenditure.
Finding: The number and distribution of necessary sensors deployed across the fleet have yet to be optimized and will depend on the operational avoidance and verification goals and whether these are to be realized at the individual flight or fleet level.
Recommendation: NASA should support observing system simulation experiments to define widespread water vapor sensor deployment to best inform contrail forecasts systems and individual verification and avoidance efforts.
In Situ and Remote Sensing Measurements on Research Aircraft
Recent NASA Science Mission Directorate (SMD) and Aeronautics Research Mission Directorate flight campaigns to study aircraft engine emissions and contrail formation at cruise altitudes (e.g., 2024 NASA CODEX, 2023 NASA Boeing ecoDemonstator, 2018 NASA DLR ECLIF2/ND-MAX) using NASA’s flying laboratories serve as ideal test beds, both for obtaining high-quality atmospheric data to validate models, as well as for flying new and in-development water vapor sensors to assess their performance under real-world conditions. The NASA Airborne Science Program’s state-of-the-art water vapor measurement capabilities in the Science Directorate at Langley Research Center include the Diode Laser Hygrometer8 (DLH) and the High Altitude Lidar Observatory9 (HALO). Both offer advantages in terms of accuracy and precision over the small sensors discussed earlier due to the open-path nature of their measurement techniques that do not require extractive inlets or tubing. This is because water tends to stick to surfaces, so care must be taken with inlets and internal tubing (e.g., heating and flushing with dry gases) to obtain comparable levels of accuracy with cabin-mounted instruments. However, the open-path research instruments also have external lasers that may pose eye safety concerns or bulky standoffs that would be impractical for integration on commercial aircraft. An example of such standoffs is shown in Figure 3-5 for the short-path DLH. However, these are not concerns for NASA research aircraft.
The traditional DLH instrument laser path extends from a window-mounted transceiver to a retroreflector mounted on a wingtip or engine nacelle (Diskin et al. 2002), and a new short-path version of the instrument has been recently developed and flown that transmits between two arms on a single window blank. As such, the instrument makes a local, in situ measurement of water vapor in close proximity to the aircraft. The nadir-pointing HALO instrument laser extends from the aircraft altitude to the surface and remotely senses a vertically resolved water vapor curtain below the aircraft from light backscattered toward the aircraft (Carroll et al. 2022). Both instruments use differential absorption techniques at multiple absorption spectral lines (near 935 and 1404 nm for HALO and DLH, respectively). The vertical resolution of the HALO lidar water vapor curtain (e.g., Figure 3-6) is particularly advantageous for characterizing the vertical extent of ISSRs typically using model reanalysis temperature profiles that can be further constrained by nearby dropsonde or radiosonde observations.
NASA’s fleet of research aircraft available through the SMD Earth Science Division Airborne Science Program10 have multiple aircraft that would be suitable both for evaluating new airborne temperature and humidity sensors alongside either the in situ DLH instrument or while flying in tandem with the HALO remote sensor. The DC-8 flying laboratory was retired in 2024, and NASA is currently standing up a Boeing 777-200ER to be its replacement (expected start of service in 2026). Multiple Gulfstream aircraft (currently G-III and G-V variants) are also available that have the requisite ceiling, payload, and range capabilities for studying contrails, upper tropospheric aerosols, and ice supersaturation, likely at substantially lower operating costs than the relatively larger 777-200ER.
___________________
8NASA, “Diode Laser Hygrometer,” Airborne Science Program, https://airbornescience.nasa.gov/instrument/DLH, accessed December 1, 2024.
9NASA, “High Altitude Lidar Observatory,” Airborne Science Program, https://airbornescience.nasa.gov/instrument/HALO, accessed December 1, 2024.
10NASA, “Airborne Science Program,” https://airbornescience.nasa.gov, accessed December 1, 2024.

SOURCE: Courtesy of NASA/Richard Moore.

SOURCE: Courtesy of NASA/Amin Nehrir.
In addition to NASA, there are a number of other government and industry research and engineering test bed aircraft that could be suitable for evaluating water vapor sensor performance in flight. Examples of some government-funded aircraft include the DLR HALO G-V and Falcon research aircraft, the National Center for Atmospheric Research G-V, and the United Kingdom–based FAAM BAe-146. Examples of some industry-funded aircraft include the Boeing ecoDemonstrators, the GE Aerospace Flying Test Bed, the Pratt & Whitney Flying Test Bed, and Airbus and airline demonstrators. While acknowledging that flight testing is the gold standard for evaluating sensor performance under real-world conditions, it is also worthwhile and less expensive to evaluate sensors and intercompare their performance in the laboratory. Numerous government, academic, and industry research institutions, including NASA, have the necessary laboratory equipment and expertise to carry out such intercomparisons, which may be a valuable prerequisite to flight testing.
In November 2024, NASA and GE Aerospace conducted a joint flight test series called the Contrail Optical Depth Experiment (CODEX) to demonstrate how the NASA HALO lidar could be used to evaluate promising sensors and test forecast tools to identify ISSRs and contrail formation regions. The HALO lidar was integrated on the Langley Research Center G-III and measured vertical profiles of atmospheric water vapor mixing ratio (shown in Figure 3-7) and aerosol extinction and backscatter coefficients below the aircraft. The G-III chased the GE Aerospace 747 Flying Test Bed, which was equipped with an in situ WVSS-II water vapor instrument, allowing comparisons to be made between the two different sensors as well as dropsondes launched from the G-III to further constrain the atmospheric temperature and water vapor profiles. The vertical information provided by the lidar allowed for real-time optimization of the in situ aircraft flight altitude to position the aircraft within the ISSR. The CODEX project highlights one promising, two-aircraft concept of operations to study the distribution of ISSRs and evaluate forecast model predictions as well as support the testing of new water vapor sensors being developed for deployment across the commercial aircraft fleet (Figure 3-8).

SOURCE: Courtesy of NASA/Tim Marvel.

SOURCES: (a) Courtesy of NASA/David Bowman; (b–d) Courtesy of NASA/Richard Moore.
Finding: NASA is uniquely positioned to test novel in situ temperature and humidity sensors using existing Science Mission Directorate Airborne Science Program aircraft and state-of-the-art research instruments.
Recommendation: NASA should support the development, testing, and certification of advanced and accurate commercial-aircraft-capable humidity and temperature sensors for contrail-forming regions as well as onboard contrail-detecting cameras and automated contrail-detection image-recognition algorithms.
Satellite and Ground-Based Remote Sensing Measurements
Spaceborne remote sensing instruments provide important additional information of atmospheric temperature and humidity profiles and contrail formation/evolution across regional-to-global scales. Skyward-pointing cameras on the ground bridge these scales to fill in the local-to-regional context and allow for validation of contrail formation and persistence.
Satellite sounding data have, to date, not been widely explored for contrail applications but hold great promise for improving numerical weather predictions of ISSRs. Currently, these instruments are limited to polar-orbiting satellites in low Earth orbit (LEO), but the next generation of geostationary (GEO) satellites set to launch in this decade by Japan and Europe (Japan Meteorological Agency and European Organisation for the Exploitation of Meteorological Satellites, respectively), and in the next decade by the United States (National Oceanic and Atmospheric Administration) promise to combine the high vertical resolution of today’s LEO satellites with the high temporal and horizontal resolution achievable from GEO. China already has a GEO sounder in space, but the data and ability to collaborate is complicated by the geopolitical landscape. The expected geographical coverage and nominal launch years are shown in Figure 3-9.

SOURCE: Courtesy of W. Smith, Jr., NASA.
Hyperspectral infrared sounders have thousands of channels that provide ~11–13 independent pieces of information on temperature and water vapor as compared to 2 independent pieces from the GOES Advanced Baseline Imager. Until the geostationary constellation comes online, there is a need to explore how today’s LEO and GEO data sets could be fused to provide high-resolution (2 km, 30 minute) temperature and humidity vertical profiles from satellites. (See Table 3-2.) Essentially, this data fusion technique extrapolates the high-vertical-resolution data from LEO sounders to the high horizontal and temporal resolution of the GEO imagers. Despite these potential advances, it is clear from Figure 3-9 that major observational gaps will remain, including critical Atlantic and Pacific Ocean flight corridors. These blind spots—along with the improved, but still relatively coarse, vertical resolution of water vapor observations from space—underscore the importance of also advancing in situ sensors on the commercial aircraft fleet. The two systems could nicely complement each other by using the satellite temperature and humidity data to benchmark the performance of individual in situ water vapor sensors on the commercial fleet and identify specific sensors for closer examination and possible maintenance if they exceed a difference threshold from the satellite benchmark. The application of LEO-GEO fusion and model assimilation for ISSR and contrail predictions is a unique and important research capability of NASA Langley Research Center’s Satellite Cloud and Radiative Property Retrieval System within SMD that needs to be further explored.
Finding: Next-generation geostationary satellite sounders that may be relevant for flight-level temperature and humidity as well as tracking persistent contrails will launch over the coming decade.
Finding: NASA fills an important research role within the United States in developing and demonstrating satellite data products and assimilating these products into models that can eventually be deployed to operational agencies (e.g., NOAA, FAA).
MEASUREMENTS OF CONTRAILS AND CONTRAIL CIRRUS
Both LEO and GEO satellite visible and infrared imagers have been used extensively to detect linear contrail features with early retrieval methods employing edge detection techniques based on 11–12 micron (or similar wavelength) infrared brightness temperature difference thresholds (e.g., Duda et al. 2013, 2019; Mannstein et al. 1999). Wang et al. (2024) incorporated multiple wavelengths and were able to detect contrails with satellite image masks designed for identifying dust (e.g., for the scene over northern France shown in Figure 3-10). More recent studies are employing artificial intelligence and machine learning to detect persistent contrails (e.g., Meijer et al. 2022; Ng et al. 2024; Zhang et al. 2018). Automated tracking algorithms have also been developed to monitor the evolution of the linear contrail features as they spread, drift, and grow into diffuse contrail cirrus (Vázquez-Navarro et al. 2010, 2015); however, the contrail cirrus become increasingly difficult to distinguish from natural cirrus after only a few hours. Consequently, most past research has focused on the early persistent contrail stages and
TABLE 3-2 Current Operational Satellite Instruments Available for LEO-GEO Data Fusion
| Function | Orbit | Pro/Con | Sensor | Satellite Series | Domain |
|---|---|---|---|---|---|
| Hyperspectral IR Sounders | Polar | High vertical resolution (~1–2 km), but with 14 km horizontal and ~6 hr temporal resolution | CrIS | NOAA JPSS | Global |
| IASI | EUMETSAT MetOp | Global | |||
| Microwave Sounders | Polar | Penetrates clouds | ATMS | NOAA JPSS | Global |
| AMSU-A | EUMETSAT MetOp | Global | |||
| MHS | EUMETSAT MetOp | Global | |||
| VIS/IR/NIR Imagers (global coverage) | GEO | High horizontal (~2 km) and temporal (~5 15 min) resolution, but with 5–10 km vertical resolution | ABI | NOAA GOES | Americas |
| AHI | JMA Himawari | Asia/Pacific | |||
| SEVIRI | EUMETSAT MSG | Europe |
SOURCE: Courtesy of W. Smith, Jr., NASA.

SOURCE: Image from NASA Worldview, https://worldview.earthdata.nasa.gov/?v=-15.732016291519663,40.44025621196383,10.529397084727265,53.5504461708871&l=Reference_Labels_15m(hidden),Reference_Features_15m,Coastlines_15m,VIIRS_NOAA21_CorrectedReflectance_TrueColor(hidden),VIIRS_NOAA20_CorrectedReflectance_TrueColor(hidden),VIIRS_SNPP_CorrectedReflectance_TrueColor(hidden),MODIS_Aqua_CorrectedReflectance_TrueColor(hidden),MODIS_Terra_CorrectedReflectance_TrueColor&lg=true&t=2020-06-23-T17%3A34%3A16Z.
much less satellite research has been done on contrail cirrus despite its importance to climate. Examination of the contrail scene in Figure 3-10 with obvious persistent contrails begs the question of what the counterfactual scene would look like if these aircraft had not flown those routes or altered their trajectories to avoid forming contrails (the subject of Chapter 6 of this report)—Would natural cirrus have formed anyway? Alternatively, would these mid-morning contrails have been avoided, but the undepleted regional water vapor budget cause more intense contrails later in the day? Absent unexpected, large-scale disruptions in air traffic, such as the September 11, 2001, terrorist attacks in the United States or the COVID-19 pandemic, such questions are currently only within the purview of modeling studies. Analyses of these events also yield mixed results, with some studies attributing changes in daily temperature range to the reduction in contrails (Travis et al. 2002, 2004), while other studies highlight confounding variability in natural cloud cover, temperature, humidity, and winds as alternate explanations that cast doubt on attempts to draw causal inferences to contrail effects (Hong et al. 2008; Kalkstein and Balling 2004). As the research community is considering operational rerouting or avoidance trials, there is an emerging need for suitable observational validation tools to quantify the (hopefully beneficial) perturbation associated with such a flight trial. Such flight trial validations need to be robust to changes in the natural atmospheric background state before, during, and after the study period that might bias a difference-based calculation of the contrail impact.
In addition, image-based identification of contrail formation and persistence (or absence), combined with aircraft position information, provides a coarse, indirect validation of model predictions of upper tropospheric temperature and humidity and whether the Schmidt–Appleman criterion and ice-supersaturation conditions are
satisfied. Such techniques are also applicable to ground-based observers. Automated camera systems integrated with ADS-B are a promising method for obtaining high-quality contrail observational data sets that could be used to train and improve models and satellite retrieval algorithms, but these are highly localized and are likely to lose sight of the persistent contrails as they advect out of the field of view (Low et al. 2024; Schumann et al. 2013). Tapping into existing networks such as the Global Meteor Network11 would greatly expand the statistical power of the contrail data set while also reducing barriers to entry in operating new cameras in target flight corridors.12
Ground-based observations can also be made from mobile phone cameras with integrated aircraft information from ADS-B, such as the augmented reality mode of the popular FlightRadar24 app (Figure 3-11). Such activities lend themselves to citizen science investigations and educating the public about aviation climate impacts (Colón Robles et al. 2020). A key challenge to these efforts is having access to a reliable database of aircraft position information and to create a curated, publicly accessible database for these contrail observations. NASA is well positioned to overcome these obstacles given its extensive experience with Earth Science data systems and integration into the Global Learning and Observations to Benefit the Environment13 (GLOBE) Cloud Observations Program.
Finding: Satellite and ground-based imagers and lidars, automated detection algorithms, and flight trajectory information from ADS-B together are important tools for validating contrail model predictions and contrail-free zones.
Finding: Artificial intelligence and machine learning are becoming more widely used for automated contrail observation and detection from satellite and ground-based imagery.
Recommendation: NASA should support satellite remote sensing research for diagnosing persistent contrails and ice-supersaturated regions in order to develop readiness for the next-generation geostationary sounders and imagers.
MEASUREMENTS OF ATMOSPHERIC PARTICLES
Aerosol particles serve as the cloud condensation nuclei on which contrails form as the water vapor–rich aircraft engine exhaust plume cools. These particles may be emitted from the aircraft and/or engine exhaust or may already exist in the upper troposphere from other natural and anthropogenic emissions sources (Figure 3-12). As discussed in Chapter 2, most current engine and fuel combinations used across the aviation fleet emit substantial numbers of particles that vastly outnumber the relatively few pre-existing background particles in the upper troposphere. For these “soot-rich” engines, the number of contrail ice crystals scales proportionally to the number of emitted soot particles and the ambient temperature difference relative to the Schmidt–Appleman contrail formation temperature (Kärcher 2018; Kärcher and Yu 2009). However, with the future adoption of lower-sooting engine technologies and sustainable aviation fuels containing zero or reduced fuel sulfur and aromatics in the coming decades, the role of pre-existing particles in the background atmosphere may become more important for contrail formation. Consequently, there is an emerging need to understand and characterize these background particles within and across flight corridors and to determine the extent to which these particle populations derive from terrestrial or aviation sources.
In addition, and as discussed in more detail in Chapters 5 and 6, modeling efforts to understand the climate impact of contrail cirrus must be able to reliably simulate the contrail formation and evolution in the atmosphere as well as the counterfactual atmospheric state where the aircraft did not fly. Essentially, the question being asked is whether natural cirrus clouds would have formed in the absence of an aviation-related perturbation via homogeneous or heterogeneous freezing pathways on existing aerosols. Thus, to answer this question and improve
___________________
11See the Global Meteor Network website at https://globalmeteornetwork.org, accessed December 1, 2024.
12Some examples of collocated ground video cameras are https://www.youtube.com/watch?v=DUIoQJUn1YU during nighttime and https://www.youtube.com/watch?v=6JxqNqtUJQc during daytime.
13See the GLOBE website at https://www.globe.gov, accessed December 1, 2024.

SOURCE: Courtesy of Flightradar24.com, https://www.flightradar24.com.

models, information is needed about the pre-existing upper tropospheric aerosol population and the presence of ice-nucleating particles.
NASA’s Science Mission Directorate has conducted airborne science field campaigns to study the remote upper troposphere (e.g., the Atmospheric Tomography Mission), and many projects involve transit flights at cruise altitudes to reposition the aircraft from its base of operations to the project deployment site. Such flights are not confined to typical airline flight corridors (and may even seek to avoid congested regions) but could yield valuable information about upper tropospheric composition if they included a small, targeted payload of particle instrumentation. Current airborne aerosol research instrumentation is mature but of sufficient complexity (e.g., use of flammable working fluids and isokinetic sampling inlets) to be impractical for widespread deployment on commercial aircraft. Condensation particle counters, optical particle sizers, and aerosol mobility sizers are routinely deployed on research aircraft operated by NASA and other national and university research institutions around the world and would be suitable for characterizing the upper tropospheric aerosol. Other aerosol properties of interest (particularly in the aviation-relevant, 5–100 nm diameter size range), include the following:
- Volatile and non-volatile particle number size distributions and concentrations,
- Particle chemical composition and mixing state, and
- Cloud and ice nucleating properties.
New aerosol instrument development efforts would be valuable that decrease the size, weight, and power requirements to enable deployment of these sensors across flight campaigns that are often payload limited. In addition, current mass-based composition measurements are challenged by the small particle sizes of aircraft engine emissions (<100 nm in diameter), and instrument development efforts in this area are needed to advance the state of the art.
Finding: Upper tropospheric aerosol number concentrations and properties are poorly understood for both continental and, especially, remote marine regions.
Finding: Natural cirrus form on ice-nucleating particles and the role of aircraft engine particle emissions in altering these aerosol-cloud interactions near flight corridors is highly uncertain.
Recommendation: NASA should identify and enable a minimum set of key aerosol instruments that can be flown on multiple missions with the goal of characterizing the aerosol composition of the upper troposphere and uncovering the contribution of aviation emissions relative to other sources.
Chapter 4 discusses modeling systems that will benefit from the improved atmospheric measurement data recommended in this chapter.
REFERENCES
Afchine, A., C. Rolf, A. Costa, N. Spelten, M. Riese, B. Buchholz, V. Ebert, et al. 2018. “Ice Particle Sampling from Aircraft—Influence of the Probing Position on the Ice Water Content.” Atmospheric Measurement Techniques 11(7):4015–4031. https://doi.org/10.5194/amt-11-4015-2018.
Appleman, H. 1953. “The Formation of Exhaust Condensation Trails by Jet Aircraft.” Bulletin of the American Meteorological Society 34(1):14–20. https://doi.org/10.1175/1520-0477-34.1.14.
Buchholz, B., A. Afchine, A. Klein, C. Schiller, M. Krämer, and V. Ebert. 2017. “HAI, A New Airborne, Absolute, Twin Dual-Channel, Multi-Phase TDLAS-Hygrometer: Background, Design, Setup, and First Flight Data.” Atmospheric Measurement Techniques 11:35–57. https://doi.org/10.5194/amt-10-35-2017.
Buck Research Instruments. 2024. “1011C Aircraft Hygrometer.” https://www.hygrometers.com/products/1011c. Accessed December 1, 2024.
Carroll, B.J., A.R. Nehrir, S.A. Kooi, J.E. Collins, R.A. Barton-Grimley, A. Notari, D.B. Harper, and J. Lee. 2022. “Differential Absorption Lidar Measurements of Water Vapor by the High Altitude Lidar Observatory (HALO): Retrieval Framework and First Results.” Atmospheric Measurement Techniques 15(3):605–626. https://doi.org/10.5194/amt-15-605-2022.
Colón Robles, M., H.M. Amos, J.B. Dodson, J. Bouwman, T. Rogerson, A. Bombosch, L. Farmer, A. Burdick, J. Taylor, and L.H. Chambers. 2020. “Clouds Around the World: How a Simple Citizen Science Data Challenge Became a Worldwide Success.” Bulletin of the American Meteorological Society 101(7):E1201–E1213. https://doi.org/10.1175/BAMS-D-19-0295.1.
Diskin, G.S., J.R. Podolske, G.W. Sachse, and T.A. Slate. 2002. “Open-Path Airborne Tunable Diode Laser Hygrometer.” In Proceedings Volume 4817, Diode Lasers and Applications in Atmospheric Sensing. International Symposium on Optical Science and Technology. https://doi.org/10.1117/12.453736.
Duda, D.P., P. Minnis, K. Khlopenkov, T.L. Chee, and R. Boeke. 2013. “Estimation of 2006 Northern Hemisphere Contrail Coverage Using MODIS Data.” Geophysical Research Letters 40:612–617. https://doi.org/10.1002/grl.50097.
Duda, D.P., S.T. Bedka, P. Minnis, D. Spangenberg, K. Khlopenkov, T. Chee, and W.L. Smith. 2019. “Northern Hemisphere Contrail Properties Derived from Terra and Aqua MODIS Data for 2006 and 2012.” Atmospheric Chemistry and Physics 19(8):5313–5330.
Ford, B. 2011. “Water Vapor Sensing System (WVSS-II), SpectraSensors.” https://www.slideserve.com/messina/water-vaporsensing-system-wvss-ii-powerpoint-ppt-presentation.
Helten, M., H.G.J. Smit, W. Sträter, D. Kley, P. Nedelec, M. Zöger, and R. Busen. 1998. “Calibration and Performance of Automatic Compact Instrumentation for the Measurement of Relative Humidity from Passenger Aircraft.” Journal of Geophysical Research: Atmospheres 103(D19):25643–25652. https://doi.org/10.1029/98JD00536.
Hong, G., P. Yang, P. Minnis, Y.X. Hu, and G. North. 2008. “Do Contrails Significantly Reduce Daily Temperature Range?” Geophysical Research Letters 35:L23815. https://doi.org/10.1029/2008GL036108.
IAGOS (In-Service Aircraft for a Global System). 2024. “Humidity Sensor (ICH, Part of Package1).” https://www.iagos.org/iagos-core-instruments/h2o. Accessed December 1, 2024.
IATA (International Air Transport Association). 2024. Aviation Contrails and Their Climate Effect: Tackling Uncertainties and Enabling Solutions. Technical Report. https://www.iata.org/contentassets/726b8a2559ad48fe9decb6f2534549a6/aviation-contrails-climate-impact-report.pdf.
Kalkstein, A.J., and R.C. Balling. 2004. “Impact of Unusually Clear Weather on United States Daily Temperature Range Following 9/11/2001.” Climate Research 26(1):1–4. http://www.jstor.org/stable/24868704.
Kärcher, B. 2018. “Formation and Radiative Forcing of Contrail Cirrus.” Nature Communications 9(1):1824.
Kärcher, B., and F. Yu. 2009. “Role of Aircraft Soot Emissions in Contrail Formation.” Geophysical Research Letters 36(1). https://doi.org/10.1029/2008GL036649.
Karion, A., C. Sweeney, S. Wolter, T. Newberger, H. Chen, A. Andrews, J. Kofler, D. Neff, and P. Tans. 2013. “Long-Term Greenhouse Gas Measurements from Aircraft.” Atmospheric Measurement Techniques 6(3):511–526. https://doi.org/10.5194/amt-6-511-2013.
Kaufmann, S., C. Voigt, T. Jurkat, T. Thornberry, D.W. Fahey, R.-S. Gao, R. Schlage, D. Schäuble, and M. Zöger. 2016. “The Airborne Mass Spectrometer AIMS—Part 1: AIMS-H2O for UTLS Water Vapor Measurements.” Atmospheric Measurement Techniques 9:939–953. https://doi.org/10.5194/amt-9-939-2016.
Kaufmann, S., C. Voigt, R. Heller, T. Jurkat-Witschas, M. Krämer, C. Rolf, M. Zöger, et al. 2018. “Intercomparison of Mid-Latitude Tropospheric and Lower Stratospheric Water Vapor Measurements and Comparison to ECMWF Humidity Data.” Atmospheric Chemistry and Physics 18(22):16729–16745. https://doi.org/10.5194/acp-18-16729-2018.
Low, J., R. Teoh, J. Ponsonby, E. Gryspeerdt, M. Shapiro, and M.E.J. Stettler. 2025. “Ground-Based Contrail Observations: Comparisons with Reanalysis Weather Data and Contrail Model Simulations.” Atmospheric Measurement Techniques 18(1):37–56.
Mannstein, H., R. Meyer, and P. Wendling. 1999. “Operational Detection of Contrails from NOAA-AVHRR-Data.” International Journal of Remote Sensing 20(8):1641–1660. https://doi.org/10.1080/014311699212650.
Marshall, C. 2024. “NOAA/NWS Aircraft-Based Observations Program.” Presentation to the committee. September 12. National Academies of Sciences, Engineering, and Medicine. https://www.nationalacademies.org/event/43604_09-2024_research-agenda-for-reducing-the-climate-impact-of-aviation-induced-cloudiness-and-persistent-contrails-from-commercial-aviation-meeting-5.
Meijer, V.R., L. Kulik, S.D. Eastham, F. Allroggen, R.L. Speth, S. Karaman, and S.R.H. Barrett. 2022. “Contrail Coverage Over the United States Before and During the COVID-19 Pandemic.” Environmental Research Letters 17(3):034039. https://doi.org/10.1088/1748-9326/ac26f0.
Meyer, J., C. Rolf, C. Schiller, S. Rohs, N. Spelten, A. Afchine, M. Zöger, et al. 2015. “Two Decades of Water Vapor Measurements with the FISH Fluorescence Hygrometer: A Review.” Atmospheric Chemistry and Physics 15:8521–8538. https://doi.org/10.5194/acp-15-8521-2015.
Ng, J.Y.H., K. McCloskey, J. Cui, V.R. Meijer, E. Brand, A. Sarna, N. Goyal, C. Van Arsdale, and S. Geraedts. 2024. “Contrail Detection on GOES-16 ABI with the Opencontrails Dataset.” IEEE Transactions on Geoscience and Remote Sensing 62:1–14.
Picarro. n.d. “CO2, CH4 and H2O Gas Concentration Analyzer.” G2301 Datasheet. https://www.picarro.com/sites/default/files/product_documents/Picarro_G2301%20Datasheet_230306.pdf. Accessed December 1, 2024.
PST (Process Sensing Technologies). n.d. “Chilled Mirror Hygrometer—Michell S8000 Remote.” https://www.processsensing.com/en-us/products/s8000-remote-chilled-mirror-hygrometer.htm. Accessed December 1, 2024.
Sausen, R., S. Hofer, K. Gierens, L. Bugliaro, R. Ehrmanntraut, I. Sitova, K. Walczak, A. Burridge-Diesing, M. Bowman, and N. Miller. 2024. “Can We Successfully Avoid Persistent Contrails by Small Altitude Adjustments of Flights in the Real World?” Meteorologische Zeitschrift 33(1):83–98. https://doi.org/10.1127/metz/2023/1157.
Schiller, C., J.-U. Grooß, P. Konopka, F. Plöger, F.H. Silva Dos Santos, and N. Spelten. 2009. “Hydration and Dehydration at the Tropical Tropopause.” Atmospheric Chemistry and Physics 9(24):9647–9660. https://doi.org/10.5194/acp-9-9647-2009.
Schmidt, E. 1963. Einführung in die Technische Thermodynamik und in die grundlagen der Chemischen Thermodynamik, 10th ed. Springer.
Schumann, U. 1996. “On Conditions for Contrail Formation from Aircraft Exhausts.” Meteorologische Zeitschrift 5(1):4–23. https://doi.org/10.1127/metz/5/1996/4.
Schumann, U., R. Hempel, H. Flentje, M. Garhammer, K. Graf, S. Kox, H. Lösslein, and B. Mayer. 2013. “Contrail Study with Ground-Based Cameras.” Atmospheric Measurement Techniques 6(12):3597–3612. https://doi.org/10.5194/amt-6-3597-2013.
Spichtinger, P., and M. Leschner. 2016. “Horizontal Scales of Ice-Supersaturated Regions.” Tellus B: Chemical and Physical Meteorology 68(1):29020. https://doi.org/10.3402/tellusb.v68.29020.
Stuefer, M., and T. Gordon. 2018. Cryogenic Frostpoint Hygrometer (CFH) Instrument Handbook. Department of Energy Office of Science, ARM Climate Research Facility. https://www.arm.gov/publications/tech_reports/handbooks/cfh_handbook.pdf.
Thornberry, T.D., A.W. Rollins, R.S. Gao, L.A. Watts, S.J. Ciciora, R.J. McLaughlin, C. Voigt, B. Hall, and D.W. Fahey. 2013. “Measurement of Low-PPM Mixing Ratios of Water Vapor in the Upper Troposphere and Lower Stratosphere Using Chemical Ionization Mass Spectrometry.” Atmospheric Measurement Techniques 6:1461–1475. https://doi.org/10.5194/amt-6-1461-2013.
Thornberry, T.D., A.W. Rollins, R.S. Gao, L.A. Watts, S.J. Ciciora, R.J. McLaughlin, and D.W. Fahey. 2015. “A Two-Channel, Tunable Diode Laser-Based Hygrometer for Measurement of Water Vapor and Cirrus Cloud Ice Water Content in the Upper Troposphere and Lower Stratosphere.” Atmospheric Measurement Techniques 8:211–224. https://doi.org/10.5194/amt-8-211-2015.
Travis, D., A. Carleton, and R. Lauritsen. 2002. “Contrails Reduce Daily Temperature Range.” Nature 418:601. https://doi.org/10.1038/418601a.
Travis, D.J., A.M. Carleton, and R.G. Lauritsen. 2004. “Regional Variations in U.S. Diurnal Temperature Range for the 11–14 September 2001 Aircraft Groundings: Evidence of Jet Contrail Influence on Climate.” Journal on Climate 17:1123–1134. https://doi.org/10.1175/1520-0442(2004)017<1123:RVIUDT>2.0.CO;2.
Vance, A.K., S.J. Able, R.J. Cotton, and A.M. Woolley. 2015. “Performance of WVSS-II Hygrometers on the FAAM Research Aircraft.” Atmospheric Measurement Techniques 8(3):1617–1625. https://doi.org/10.5194/amt-8-1617-2015.
Vázquez-Navarro, M., H. Mannstein, and B. Mayer. 2010. “An Automatic Contrail Tracking Algorithm.” Atmospheric Measurement Techniques 3(4):1089–1101. https://doi.org/10.5194/amt-3-1089-2010.
Vázquez-Navarro, M., H. Mannstein, and S. Kox. 2015. “Contrail Life Cycle and Properties from 1 Year of MSG/SEVIRI Rapid-Scan Images.” Atmospheric Chemistry and Physics 15(15):8739–8749. https://doi.org/10.5194/acp-15-8739-2015.
Wang, X., K. Wolf, O. Boucher, and N. Bellouin. 2024. “Radiative Effect of Two Contrail Cirrus Outbreaks Over Western Europe Estimated Using Geostationary Satellite Observations and Radiative Transfer Calculations.” Geophysical Research Letters 51(7):e2024GL108452. https://doi.org/10.1029/2024GL108452.
Zhang, G., J. Zhang, and J. Shang. 2018. “Contrail Recognition with Convolutional Neural Network and Contrail Parameterizations Evaluation.” Scientific Online Letters on the Atmosphere 14:132–137. https://doi.org/10.2151/sola.2018-023.
Zondlo, M.A., M.E. Paige, S.M. Massick, and J.A. Silver. 2010. “Vertical Cavity Laser Hygrometer for the National Science Foundation Gulfstream-V Aircraft.” Journal of Geophysical Research: Atmospheres 115(D20). https://doi.org/10.1029/2010JD014445.


