Leveraging Existing Traffic Signal Assets to Obtain Quality Traffic Counts: A Guide (2025)
Chapter: 9 Other Technologies
CHAPTER 9. OTHER TECHNOLOGIES
This chapter provides relevant information for pedestrian push buttons and other types of sensors such as hybrid sensors.
PUSH BUTTONS
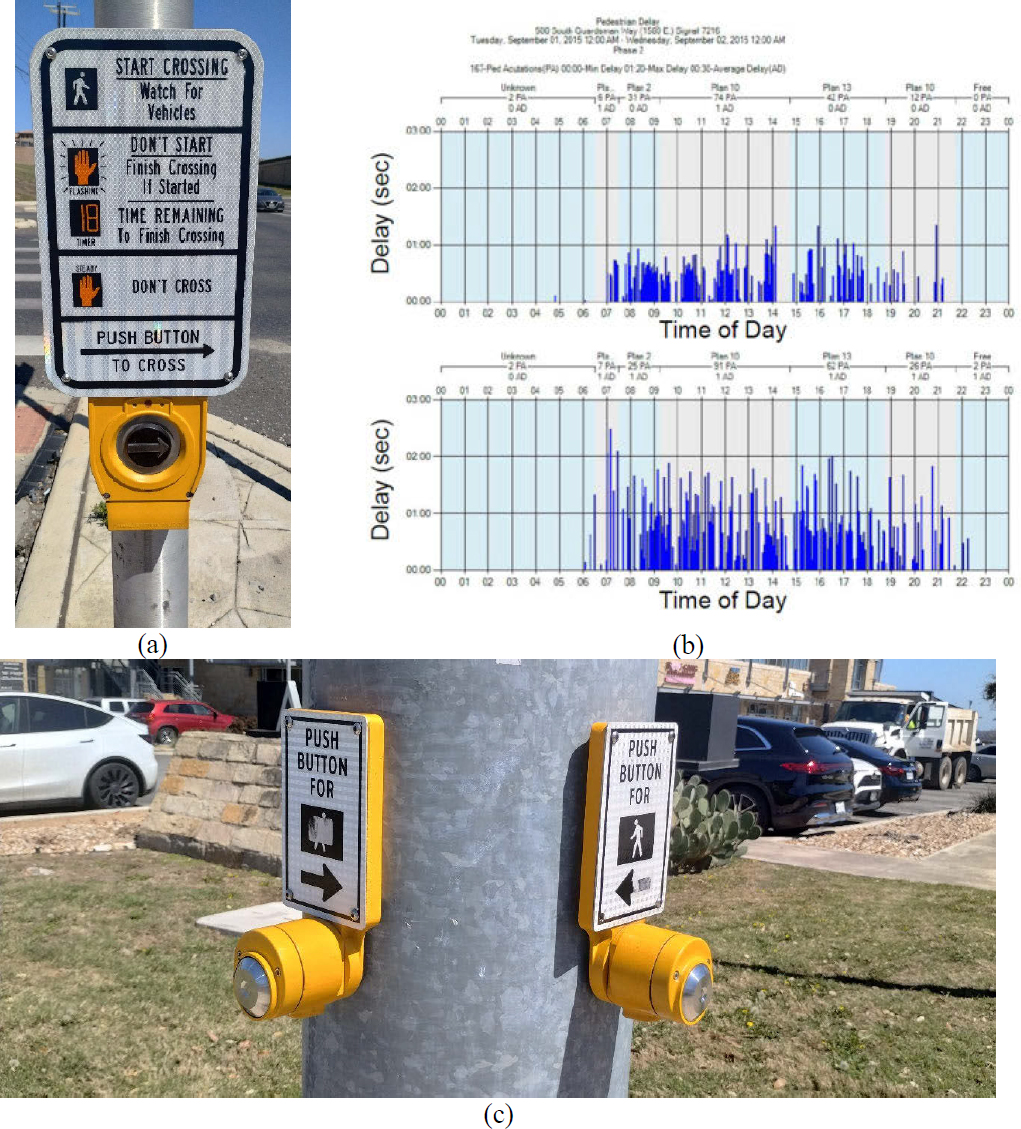
Push buttons are installed at intersections to allow pedestrians to activate the pedestrian signal phase. Typical pedestrian push buttons are shown in Figure 37a and Figure 37c. Push-button event data can be used as surrogates for pedestrian volumes (Kothuri et al., 2017). Intersection-specific factors are needed to convert the number of actuations into pedestrian counts. ATSPM data include the number and activation time of push buttons and the service time of pedestrian phases. Figure 37b demonstrates a sample of ATSPM data showing pedestrian activity and delay for a whole day.
The concept of determining pedestrian volumes based on the number of actuations of the pedestrian phase is somewhat new and needs further investigation and validation (Singleton and Runa, 2021). However, this approach is cost-effective considering that push buttons may already exist at many intersections, and the costs to obtain and process pedestrian signal actuation data are relatively low.
Strengths and Weaknesses
Table 10 lists the main strengths and weaknesses of pedestrian push buttons.
Table 10. Strengths and Weaknesses of Pedestrian Push Buttons.
| Strengths | Weaknesses |
|---|---|
| Non-Motorized Traffic Only | |
|
|
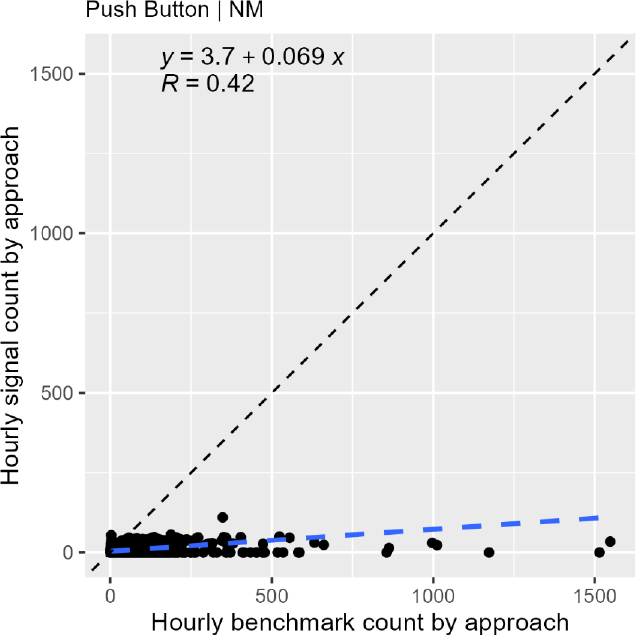
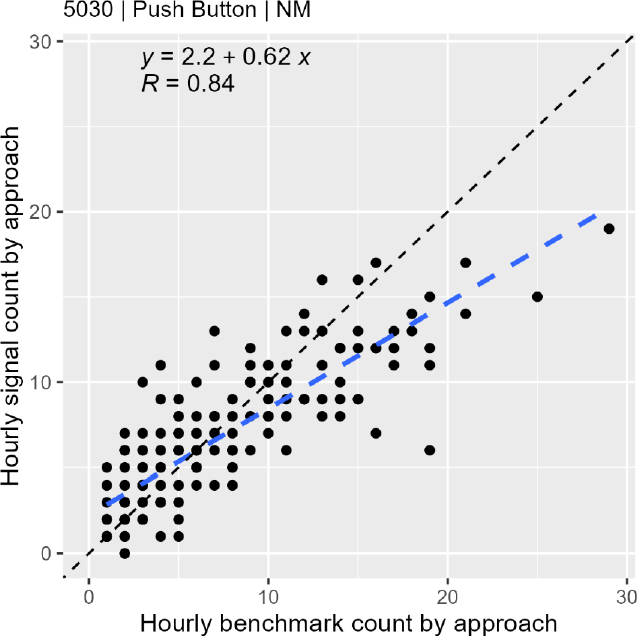
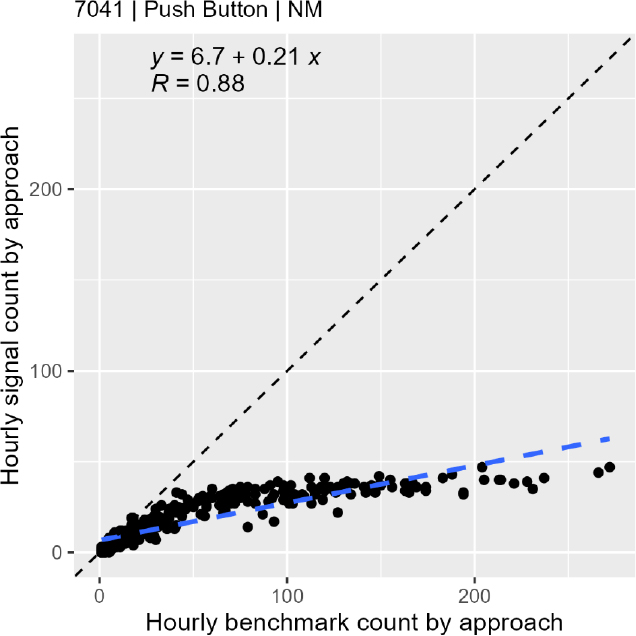
NCHRP Project 03-144 validated pedestrian push buttons installed in four states. The counting accuracy was low across all states, with average errors (WMAPE) ranging from 33.5% (WSDOT) to 171.4% (City of Wilmington, NC). A scatterplot of all push-button data validated in NCHRP 03-144 (see Figure 38) indicates that push-button activations are poorly correlated with benchmark pedestrian volumes. Pedestrian push-button counts often underestimate pedestrian activity, especially at intersections with high non-motorized traffic volumes. While push-button activations can provide reasonably accurate estimates of pedestrian traffic at low-volume intersections (see Figure 39), they fail to reliably capture pedestrian activity at high-volume intersections, as shown in Figure 40. This limitation stems from the inability of push buttons to account for pedestrians who cross without using the button, which becomes more common as pedestrian volumes increase.
Pedestrian push buttons have several sources of error, the most significant being that this method does not directly count the total number of pedestrians but the number of times the button is pushed. Some pedestrians may push the button multiple times or press the buttons for both directions if they intend to cross the intersection diagonally, leading to an overcount. Groups of pedestrians may only press the button once. Other pedestrians may decide not to press the button at all.
This guide does not provide recommendations for using raw count data from push buttons as their accuracy is generally inadequate for traffic monitoring purposes, particularly on high-volume approaches. However, push-button data may be suitable for characterizing pedestrian activity in a large area or for other high-level analyses (e.g., corridor analyses) and applications that may not require highly accurate estimates (Singleton and Runa, 2021). Studies indicate that the accuracy of pedestrian volume estimates can improve when push-button data are used as inputs into prediction models (Kothuri et al., 2017; Li and Wu, 2021; Singleton et al., 2021a, 2021b; Li et al., 2022; Kothuri et al., 2024). These modeling approaches can leverage the limited data from push buttons alongside other factors, such as time-of-day patterns, weather, and land-use factors, to produce more reliable volume estimates. However, their accuracy can vary significantly from one site to another.
OTHER SENSORS
There are other types of sensors that can be used to operate signals and collect traffic volumes. For example, V2X is a communication technology that enables vehicles to exchange information with other vehicles, infrastructure, pedestrians, and networks. Traditional V2X relies on direct communication between onboard units and roadside units without requiring
supplemental detection technologies. However, there are hybrid sensors that combine multiple detection technologies to leverage the strengths of each, often resulting in more accurate and versatile traffic monitoring. A common hybrid configuration integrates video and radar technology. Video is used for stop bar detection, while radar enables advance detection for approaching vehicles. Some V2X sensors integrate video, radar, and other capabilities to enable real-time communication between vehicles, infrastructure, pedestrians, and networks. V2X technology supports enhanced traffic safety, operational efficiency, emissions reduction, and improved autonomous driving capabilities for developing connected and autonomous vehicle systems. The effectiveness of a V2X system relies on fast, reliable communication networks, enabling vehicles and infrastructure to share data continuously and in real time. While general best practices for video and radar technologies apply to hybrid systems, their integration in V2X applications enhances overall capabilities.
NCHRP Project 03-144 presented validation results from a hybrid V2X system installed at four intersections in Phoenix, AZ. The accuracy errors (WMAPE) were low, ranging from 0.6% to 4.2%. This V2X system uses both video and radar technologies to collect data. It consists of a plug-and-play internet-of-things sensor and a control unit. The sensor is installed at each intersection approach and provides both motorized and non-motorized detection and classification data by combining machine vision with radar technology. The sensor integrates connected vehicle capabilities. The control unit is installed in the traffic signal cabinet. The system uses an AI optimization engine to aggregate data from each approach, calculate various variables, and upload data on the cloud for further processing. Further research is needed to validate other hybrid systems in diverse roadways and traffic conditions.
Given the diverse technologies incorporated in hybrid sensors, each with unique limitations, it is challenging to provide universal recommendations for their installation, calibration, maintenance, and validation. In general, agencies considering hybrid sensors for signal control and traffic monitoring should:
- Assess site-specific needs: The choice of hybrid sensor configuration should consider local traffic conditions, weather, and multimodal demands. Agencies should consider the volume and types of traffic (e.g., motorized, bicyclists, and pedestrians) at the intersections of interest. Urban areas with heavy multimodal traffic may benefit more from sensors with enhanced classification capabilities. Weather conditions, such as rain, snow, or fog, can affect sensor performance. Hybrid configurations—like combining radar, which works well in all weather conditions, with video, which provides detailed imagery—can address these challenges. Agencies should also evaluate the existing infrastructure to determine the feasibility of sensor installation and integration without extensive modifications.
- Optimize communication infrastructure: Hybrid sensors generate large volumes of data, requiring robust networks for real-time communication and processing. Fiber optic networks or dedicated wireless systems can be ideal for maintaining low latency. Processing some data locally at the sensor or signal controller (i.e., edge computing) can reduce the burden on central systems and improve response times. In addition, data backup systems can support continuous operation in case of unexpected disruptions.
- Plan for scalability: Agencies should consider hybrid systems that are compatible with existing traffic management systems and future technologies, such as connected vehicle networks and smart city platforms. They should choose systems that allow easy upgrades, such as adding new detection capabilities or integrating additional communication protocols, without needing full replacement.
- Evaluate cost-benefit trade-offs: While hybrid sensors may have higher initial costs, their benefits in accuracy, reliability, and functionality may justify the investment over time. Enhanced accuracy in traffic counts can lead to better data for planning, optimized signal timing, and reduced congestion, resulting in long-term economic benefits. Agencies should conduct small-scale deployments to evaluate performance, accuracy, and maintenance requirements before committing to full-scale implementation. This can help validate the cost-effectiveness of a system under consideration.


