Incorporating Uncertainty into Long-Range Transportation Planning: A Guide (2026)
Chapter: 2 Scoping

CHAPTER 2
Scoping
The components in this chapter will help an agency map out a planning process to better address uncertainty. These sections are most relevant when starting a long-term planning activity. They are designed to help identify where to focus resources and how to set up a planning process to yield desired insights into uncertainty.
Chapter 2 Components
2.1 Sources of Uncertainty
The resources in this section are designed to help organizations consider different sources of uncertainty with their processes, methods, and communications. Sources of uncertainty can either be within an agencyʼs control, such as the agencyʼs workforce and the tools and data they use, or sources of uncertainty will fall outside of an agencyʼs control, such as future funding, changing environmental policies, or the future of telework.
This section gives an overview of the types of uncertainty identified through this research as being relevant to transportation organizationsʼ ability to meet their long-term goals. As shown in Figure 3, this section organizes sources of uncertainty into four overarching categories: technology and behavior, policy and regulation, context and environment, and agency capabilities. Uncertainties associated with technology and behavior, policy and regulation, and context and environment fall outside of a transportation organizationʼs control (in gray), whereas uncertainties associated with agency capabilities typically fall within an organizationʼs control (in red).
The following describes each source of uncertainty, the factors that contribute to its uncertainty, and relevant considerations for transportation organizations. These summary materials were developed through the initial phase of this research project and are based on a more extensive review of the literature available in Appendix A of NCHRP Web-Only Document 440: Developing a Guide for Incorporating Uncertainty into Long-Range Transportation Planning. Because uncertainty is inherently dynamic and ever-changing, these topics are not exhaustive and will inevitably change and evolve over time. Nevertheless, these topics have been shown to have relevance across a wide range of contexts.
2.1.1 Technology and Behavior
Vehicle Automation
Vehicle automation includes technologies such as driver assistance and the emergence of connected and autonomous vehicle technologies.
Factors contributing to uncertainty. The following factors contribute to uncertainty:
- Adoption timelines of the technology.
- Safety benefits and risks, including issues of cybersecurity.
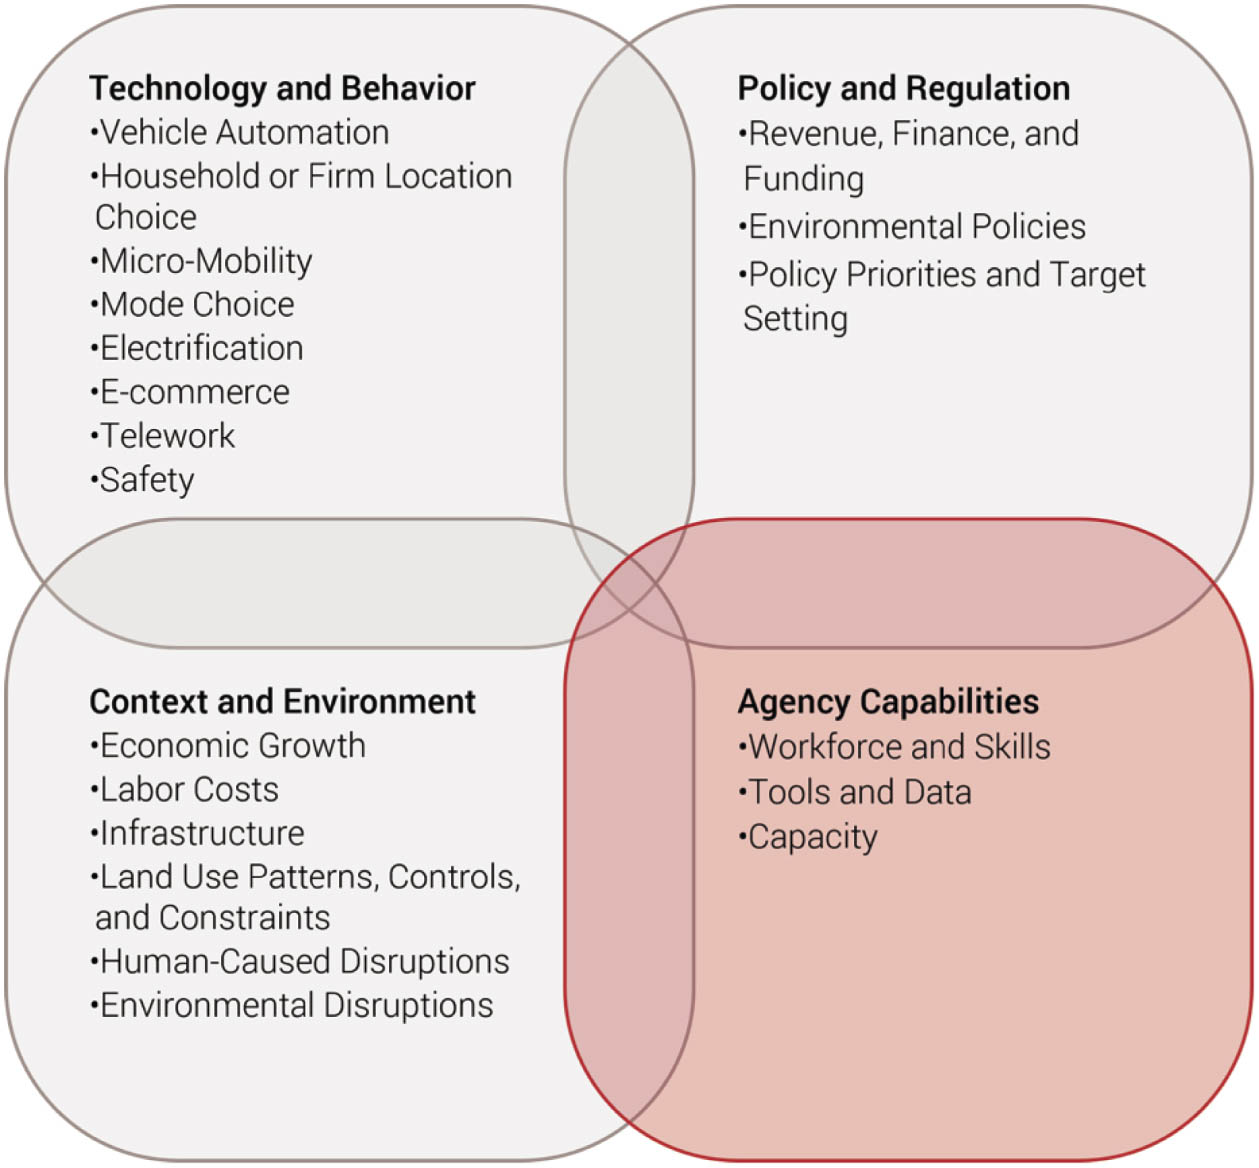
Long Description.
The top-left quadrant, labeled Technology and Behavior, includes items like Vehicle Automation, Household or Firm Location Choice, Micro-Mobility, Mode Choice, Electrification, E-Commerce, Telework, and Safety. The top-right quadrant, titled Policy and Regulation, lists Revenue, Finance, and Funding; Environmental Policies; and Policy Priorities and Target Setting. The bottom-left quadrant, named Context and Environment, features Economic Change, Labor Costs, Infrastructure, Land Use Patterns, Controls, and Constraints, Human-Caused Disruptions, and Environmental Disruptions. The bottom-right quadrant, labeled Agency Capabilities, includes Workforce and Skills, Tools and Data, and Capacity. The bottom-right quadrant is shaded red, while the rest are gray.
- Congestion impacts, including flow efficiency, as well as impacts on induced demand and vehicle occupancy through the evolution of fleet sharing versus private ownership.
- Relationship to land development patterns.
Considerations for transportation organizations. Transportation planners may consider the following within forecasting and planning:
- Potential for automated vehicles to increase the effective capacity of roadways by allowing vehicles to follow each other more closely; additionally, the degree to which this is less true in mixed conventional and autonomous traffic.
- The impact of additional zero occupancy vehicle trips on overall traffic levels.
- Impact of automated vehicles on design requirements for the built environment (e.g., to navigate infrastructure, automated vehicles rely on clear and uniform road signs and markings).
- Potential to change land use patterns (e.g., less parking spaces may be needed and could be repurposed, or automated vehicles may reduce disutility of travel and contribute to greater suburban sprawl).
Household and Firm Location Choice
Location preferences are subject to change, for example, from urban to rural housing preferences or from offshoring to nearshoring strategies for globally connected industries. These uncertainties may reflect generational or other demographic shifts, changing priorities, and alterations of industry technology and operational parameters, among others.
Factors contributing to uncertainty. The following factors contribute to uncertainty:
Changing household location preferences and technologies such as:
- Greater interest in dense and walkable urban environments among younger generations versus a shift toward suburban living during and after COVID-19.
- Vehicle automation and whether this technology may increase suburban sprawl.
Changing business location preferences, operational processes, and technologies, for example:
- Knowledge industries and business co-location, resulting in more urbanized preferences for some sectors.
- Advancing technologies may change land requirements (e.g., automated warehousing decreases land requirements of logistics operations).
Supply chain restructuring, importance of system resilience versus efficiency, and emphasis on rapid fulfillment in e-commerce may contribute to restructuring of business location dynamics.
Considerations for transportation organizations. Transportation planners may consider the following within location preferences:
- Location trend analysis (by demographic or industry cohort).
- Coordination with subject matter experts (e.g., economic development professionals, land use planners, and freight stakeholders).
- Preference surveys such as those conducted in the real estate or site selection industries.
- Reliance on tools and expertise, i.e., economic forecasting and land use models.
- Scenario planning exercises.
Micro and Shared Mobility
Micromobility generally includes smaller human- or electric-powered modes such as bicycles and scooters. Shared mobility includes services shared among users such as public transit, bike sharing, taxis, ridesharing, car sharing, etc.
Use of micro and shared mobility modes is increasing, changing previous assumptions around vehicle ownership and mode share.
Factors contributing to uncertainty. The following factors contribute to uncertainty:
- Limited or incomplete data on adoption rates make it difficult to plan for future infrastructure needs.
- Micro and shared mobility introduce uncertainty around future rates of vehicle ownership and mode choices (e.g., the degree to which they may complement or supplement trips by other modes).
- Uncertain impact on congestion.
- Transportation professionals are interested in integrating micromobility options into Mobility as a Service (MaaS) platforms, generally referring to a means of offering users unified access to a variety of mobility platforms, often through a smartphone-based app. Implementation of MaaS is challenging due to the need for public and private partnerships and funding. Successful, large-scale implementation of MaaS could further disrupt vehicle ownership models and modal preferences.
Considerations for transportation organizations. Transportation planners may consider the following within micro and shared mobility:
- Increasing the capacity of modes other than the personal automobile.
- Tracking the evolution of payment technologies and integration efforts as they relate to micro and shared mobility and MaaS.
- Considering partnerships with public and private entities operating within the micro and shared mobility space that are seeking to provide streamlined access to mobility options.
Mode Choice
Mode choice refers to the ways in which people choose between available modal alternatives, reflecting preferences based on modal characteristics as well as cultural norms, demographics, and generational attitudes, among a variety of others.
Factors contributing to uncertainty. Sometimes, mode choice over longer time horizons shifts in unexpected ways due to preference shifts or cultural shifts that are otherwise not accounted for when evaluating trends in the socioeconomic environment and transportation infrastructure.
Considerations for transportation organizations. Transportation planners may consider the following within mode choice:
- Transportation agencies have managed uncertainty in mode choice by investing in data collection and modeling method updates on an ongoing basis. Typical travel modeling methods are calibrated using survey or other data on observed travel choices to understand the “revealed preferences” of travelers as a function of the attributes of available options (e.g., travel time, cost). Such models are updated on an ongoing basis.
- Technology is also making data collection on travel behavior easier and less burdensome, including GPS supported automated travel diaries and the use of data from transit automated fare card systems.
E-Commerce
The evolving dynamics of how goods and services are sold online are affecting patterns of land use and travel. E-commerce activities include various forms of consumer purchases, curbside pickup, local delivery from retailers like grocery stores, prepared food delivery from restaurants, and Amazon and non-Amazon online retail deliveries.
Factors contributing to uncertainty. The following factors contribute to uncertainty:
- E-commerce is difficult to measure and forecast, as it blurs the lines around personal and commercial freight and its origins and destinations.
- E-commerce growth and last-mile delivery strain urban freight distribution systems and contribute to negative externalities like traffic congestion, lack of parking, pollution, and noise.
- The degree to which e-commerce results in substitutions between trip types is uncertain (e.g., shopping trips, delivery trips).
- Rush delivery services continue to evolve and create more vehicle travel and can increase congestion compared to deliveries with a longer time frame. On-demand delivery, in which individuals use personal cars to make local deliveries, may fill some rush delivery needs while decreasing freight vehicle traffic.
Considerations for transportation organizations. Transportation planners may consider the following within e-commerce:
- Population and household forecasts combined with forecasts of the increasing adoption rate of e-commerce may be a solution for considering the impacts of last-mile delivery trips, which are not considered in traditional commodity flow databases.
- Ongoing monitoring of evolving e-commerce dynamics is important.
- Engagement between the public and private sectors is vital for developing solutions that address negative externalities of increasing e-commerce pickup and delivery activities.
- Alternative modes include cargo bicycles, automated distribution technologies, and public transport-based distribution systems to reduce the impacts of last-mile delivery. To be an efficient alternative, implementation of these new systems will require infrastructure modifications, new regulatory frameworks, pilot programs, and new technology adoption.
- Evolving modal options for e-commerce operations, last-mile delivery, and rush delivery require new modeling tools.
Telework
Rapidly accelerated during the pandemic, full- or part-time telework introduces a range of uncertainties in future travel patterns.
Factors contributing to uncertainty. Increases in telework change commuting behavior and decrease demand on the transportation system, especially during peak periods. However, future trends in telework remain uncertain. The following factors are likely to affect the long-term outlook for telecommuting:
- Limitations on the types of jobs that can be accomplished remotely. This impacts various travel modes in different ways; for example, transit users are more likely to work in occupations that require in-person presence.
- Evolution in worker and employer preferences and part-time commuters.
- The scale of impact of commuting vis-à-vis other trip-making. Telecommuting can increase the total number of trips, even though it decreases commute trips. Destinations and lengths of work versus non-work trips may also be very different, even though there are offsetting effects in terms of number of trips.
Considerations for transportation organizations. Transportation planners may consider the following within telework:
- State DOTs, MPOs, and other transportation professionals can use surveys to monitor and understand trends in telework behaviors and preferences.
- Transportation professionals also can develop and model scenarios to explore the impacts on travel demand and needs.
Vehicle Electrification
The motor vehicle market is undergoing a rapid transition from fossil-fueled internal combustion engine vehicles to zero-emission vehicles (ZEVs). The timing and nature of this transition are uncertain.
Factors contributing to uncertainty. The following factors contribute to uncertainty:
- Future economic trends, changes in battery prices, policies and regulations, fleet turnover, charging infrastructure deployment, consumer preferences, supply chain constraints, gas prices, and changes in electric vehicle (EV) technology and range contribute to uncertainty.
- The likely evolution of technology for short-haul versus long-haul trucking contributes to uncertainty. There is potential for electricity to be the leading fuel for shorter trips, while other energy sources such as hydrogen may be the leading fuel for longer trips.
Considerations for transportation organizations. Transportation planners may consider the following within vehicle electrification:
- The need for charging infrastructure.
- Impacts on fuel tax revenues.
- Impacts of reduced pollutants from EV adoption on transportation-related performance in the areas of health, air quality, and the environment.
- Impacts on safety, pavement management, bridge management, and other performance areas due to the heavy weight of current ZEV battery technologies.
- EV adoption requires new, enhanced coordination between transportation agencies, utilities, and state energy offices.
- There will be operational and cost implications for agency fleets as there are opportunities to transition fleet vehicles to EVs. This will require planning to reflect shifts in fuel and electricity budgets, changes in operations and maintenance expenditures, and changes in workforce needs.
- Adoption rates, benefits, and costs from vehicle electrification may vary across geographies and communities, necessitating context-specific implementation strategies.
Safety
New transportation technologies present unique challenges and solutions to road safety issues. Human behavior is also subject to shifts, such as the sudden uptick in crash rates in 2020. Uncertainty makes it hard to anticipate and manage safety performance.
Factors contributing to uncertainty. The following factors contribute to uncertainty:
- Transportation agencies face challenges in collecting and forecasting safety data, including data quality issues, particularly for nonmotorized incidents, and significant coordination between transportation agencies and law enforcement.
- Agencies may employ statistical methods to understand the influence of underlying factors when forecasting safety outcomes. Relevant variables may include socioeconomic data, travel and behavioral data, weather, and transportation investments. These variables, however, are also subject to uncertainty and may be impacted by emerging technologies and behavioral shifts.
- New transportation technologies bring new uncertainties to road safety issues. For example, automated vehicles rely on automated and driver assistance systems. Additionally, EVs are heavier than other vehicles, thereby changing safety profiles for pedestrians, bicyclists, and others in an accident.
Considerations for transportation organizations. Safety management relies on a cycle of assessment that includes screening to identify hotspots or overrepresented incident types; diagnostics to investigate human, vehicle, roadway, and environmental contributing factors; countermeasure selection; evaluation and prioritization; and post-implementation effectiveness evaluation.
Additionally, transportation planners should consider how new technologies may impact safety profiles for different road users. Factors to consider include:
- The specific functionality of individual technologies.
- The physical and environmental boundaries within which a particular technological function is designed to work.
- Technological and infrastructure dependencies and risks, such as the quality of transportation signage and infrastructure or behavior shifts among road users.
- The assertion and testing of hypotheses, the implementation of feedback loops, and the iteration of solutions or strategy as more information emerges and technology evolves.
2.1.2 Policy and Regulation
Revenue, Finance, and Funding
The availability of funding for transportation is subject to uncertainty due to dynamics of the political process as well as variations in other sources such as the fuel tax and other related fees.
Factors contributing to uncertainty. The following factors contribute to uncertainty:
- Changes in federal, state, and local government and policies.
- Competitive grants.
- Fuel tax revenues, which are influenced by policies, prices, vehicle fuel economy standards, overall levels of travel, and the composition of the vehicle fleet.
- Voter initiatives.
- Demographic and economic shifts may affect general tax revenue and allocation formulas to distribute funding.
Considerations for transportation organizations. Transportation planners may consider the following within revenue, finance, and funding:
- Uncertain funding can lead to a delay in project execution or a change in scope. Unexpected additional funding can lead to inefficiencies in project delivery.
- Changes in levels of investment may also affect demand for labor and materials, thereby altering prices.
- Mitigation strategies implemented by transportation agencies include conservative funding projections, development of revenue scenarios, at-risk project identification, alternative delivery approaches, and project phasing adjustments, among others.
Environmental Policies
Environmental policies include preventive or adaptive measures to mitigate the negative effects of transportation on environmental systems.
Factors contributing to uncertainty. The following factors contribute to uncertainty:
- New or changing environmental policy measures could introduce uncertainty around the type of infrastructure and spending needed in the future and the future cost of projects. Federal environmental, transportation, and economic policies continue to become more interconnected. States and localities are adopting or updating their own environmental policies, including emission reduction targets and resilience plans.
- The landscape of preventive and adaptive environmental policies is dynamic and rapidly evolving, i.e.: energy efficiency standards for transportation, changing permitting and pricing strategies related to pollutants, shifting technology, and changing standards for resilient infrastructure.
- Environmental policy uncertainties are further compounded by the connection between environmental and revenue-generation policies. Federal and state governments are grappling with long-term funding uncertainty and gaps as policymakers explore the implications of declining gas tax revenues, the transition to ZEVs, and funding mechanisms such as road user charges and congestion pricing.
Considerations for transportation organizations. Transportation planners may consider the following within environmental policies:
- Proactive coordination with government officials. Transportation agency leadership or legislative affairs offices within agencies can play a strong role in facilitating dialogue with officials and in tracking policy or regulatory changes.
- Transportation organizations can influence the environmental policy environment through analytical support on the potential impacts of policy changes. Analyses could include what-if or scenario analysis of impacts on key performance outcomes.
Policy Priorities and Target Setting
Changes to federal, state, or local policy priorities and their associated requirements can result in shifting needs and priorities within transportation agencies in a manner that carries some uncertainty.
Factors contributing to uncertainty. The following factors contribute to uncertainty:
- Changing governance structures and processes as well as dynamic and evolving community engagement priorities and responsibilities.
- Transportation organizations make policy decisions such as setting performance targets in the context of an unknown future as it relates to trends around travel activity and behavior, as well as unknown future actions by other public- and private-sector organizations.
Considerations for transportation organizations. Transportation planners may consider the following within policy priorities and target setting:
- Proactive coordination with government officials through transportation agency leadership or legislative affairs offices can increase an agencyʼs awareness or change policy priorities.
- Agencies may consider leveraging external experts from higher education, nonprofits, or industry, to more fully understand trends and evolving needs.
- Community engagement techniques support transportation planners in understanding current and emerging community values, goals, and needs.
- Transportation agencies can consider using a risk management approach to support target setting and use those targets to allocate resources. This approach could be mixed with qualitative and quantitative methods for setting performance targets, such as policy-based methods, historical trends, probabilistic and risk-based approaches, statistical models, and realistic or predictive target setting.
2.1.3 Context and Environment
Economic Change
The pace and nature of economic change is dynamic and subject to many forecasting efforts but remains uncertain.
Factors contributing to uncertainty. The following factors contribute to uncertainty:
- Socioeconomic trends impact travel demand, including overall levels of travel, spatial patterns or origins and destinations, and modal reliance.
- Transportation planning practices often have historically relied on point forecasts, which tend to have a modest positive bias and show significant variability.
- Researchers have found that employment, population, and fuel price forecasts frequently contribute to traffic forecast inaccuracy.
Considerations for transportation organizations. Transportation planners may consider the following within economic change:
- Researchers suggest using a range of forecasts to communicate and explore uncertainty, while also taking steps to evaluate and improve forecasting methods using ex-post evaluations of accuracy.
- Transportation agencies need to consider actively investigating sensitivity testing of future performance measures, assessments of need, or project benefits against varying underlying growth assumptions.
Infrastructure and Labor Costs
The cost of building, maintaining, and operating transportation infrastructure and services is subject to external factors, such as shifts in specific supply and labor markets, and market dynamics like inflation.
Factors contributing to uncertainty. The following factors contribute to uncertainty:
- Traffic levels can affect deterioration rates and necessary maintenance activities.
- Technological progress can impact available construction, maintenance, and operational options, thereby changing the cost structure.
- Changes in costs such as new minimum wage laws.
- Changes in regulations and laws can impact the costs associated with maintaining, upgrading, and building new infrastructure relative to historical levels.
- Fluctuations in energy prices.
- Natural disasters can result in unanticipated infrastructure repair needs.
- Suboptimal or faulty planning processes can contribute to excess costs.
Considerations for transportation organizations. Transportation planners may consider the following within infrastructure and labor costs:
- State DOTs and MPOs can use systematic cost estimation and risk analysis techniques. By implementing organizational control and quality assurance measures involving independent estimates or review, cost estimates can be isolated as much as possible from political influence.
- Incorporating risk analysis techniques, including probabilistic assessments, particularly for complex and important projects.
- Use of contingency factors to account for unknown costs.
- Local analysis and estimates for variables that are highly location-specific (e.g., land costs).
Land Use Patterns, Controls, and Constraints
Land use refers to a variety of dimensions of the spatial patterns of development and the built environment including density (e.g., people or jobs per unit of area), mix of uses (e.g., residential, commercial, industrial), and level of connectivity of infrastructure. Land use patterns evolve over time and carry with them a degree of uncertainty.
Factors contributing to uncertainty. The following factors contribute to uncertainty:
- Land use patterns influence travel patterns by affecting the number and types of trips made (trip generation), trip origins and destinations, and mode choice.
- Transportation planners are very interested in the interaction between land use planning and controls and managing transportation demand and congestion; however, land use planning, zoning, and regulations are largely within local government control.
- The actual trajectory of development is shaped by market forces that reflect patterns of supply, demand, and the preferences of people and businesses.
Considerations for transportation organizations. Transportation planners may consider the following within land use patterns, controls, and constraints:
- DOTs and MPOs plan for the influence of land use on transportation through forecasting of growth patterns as an input to travel demand modeling. Some agencies employ an approach that involves iterative coordination with local planners; translation of planning documents or zoning data into standardized traffic analysis zones (TAZs), data structures, and land use classification schemes; and governing of overall growth levels according to economic forecasts. Other agencies employ land use models like UrbanSim or CommunityViz. Some agencies may use land use models that are integrated with travel demand models to enable a feedback loop.
- Scenario planning can help to explore the impacts of potential different land use patterns on future transportation needs and performance.
- Proactive coordination with local governments on land use planning and regulation may allow a transportation agency to influence land use outcomes.
Human-Caused and Environmental Disruptions
Environmental disruptions and human-caused disruptions such as extreme weather events, coastal inundation, cybersecurity threats, pandemics and disease, and supply chain interruptions threaten transportation systems and introduce uncertainty into the transportation planning process.
Factors contributing to uncertainty. The following factors contribute to uncertainty:
- Human-caused disruptions such as cybersecurity threats and supply chain interruptions contribute to stress on transportation systems.
- The increasing frequency and intensity of extreme weather events, along with sea level rise, pandemics and disease, and other natural disasters, create an evolving landscape of risks and system stressors.
Considerations for transportation organizations. Transportation planners may consider the following within human-caused and environmental disruptions:
- The five-step approach outlined in the U.S. Resilience Toolkit Vulnerability Assessment Scoring Tool (VAST): (1) Understand exposure, (2) assess vulnerabilities and risks, (3) investigate options, (4) prioritize and plan, and (5) take action [National Oceanic and Atmospheric Administration (NOAA) n.d.].
- Transportation organizations can seek opportunities to enhance system resilience by using data and modeling to understand system exposure to potential disruptions, assess the
- vulnerabilities and risks introduced by different disruptions, and consider potential investments or strategies to manage these risks.
- Transportation planners need access to up-to-date information on the evolving and challenging risks, use the available tools to assimilate the data into their modeling, and then make informed, and potentially difficult, decisions about how best to deploy resources. This often requires interdisciplinary or external collaboration as well as specialized knowledge beyond traditional transportation planning and engineering.
2.1.4 Agency Capabilities
Agency Capabilities: Workforce and Skills, Capacity, Tools, and Data
Agencies may face internal questions as to whether they have the people, processes, and resources needed to identify, measure, and manage external uncertainties. Having a workforce and organization with the relevant skills, useful tools and data, and capacity to address external sources of uncertainty is vital for resilience.
Factors contributing to uncertainty. The following factors contribute to uncertainty:
- Many transportation agencies are experiencing a change in workforce, in which staff are retiring, and new employees, planners, and leaders are being hired. New staff may have different skills, challenges, and expectations around work than previous staff.
- Different external uncertainties that a transportation organization faces will have ramifications for the needed capacity, skills, and capabilities of the future workforce, and the tools and data required to address that external uncertainty.
Considerations for transportation organizations. Transportation agencies may consider some key questions regarding the future of their workforce:
- How can the agency attract, retain, and train the future workforce? How would the needs of the future workforce differ from those of todayʼs DOTs and MPOs?
- How can the workforce be trained to identify options for analyzing uncertainty?
- How can data around uncertainty be collected, managed, and used? What does that mean for skills development and capacity building?
Additionally, building a resilient organization requires leadership and organizational alignment that:
- Enable staff to explore uncertainty.
- Are comfortable in leading diverse staff.
- Provide organizational structure to harness staff strengths and interests.
- Embrace internal change as needed to address challenges that arise during strategy or plan implementation.
- Invest in data, tools, and partnerships to manage uncertainty.
2.2 Guided Self-Evaluation and Reflection: Sources of Uncertainty
Users of this guide may have one or more motivating factors for wishing to improve their planning for uncertainty. For example, an agency may be struggling with a particular source of uncertainty (e.g., CAVs, economic change) or may be uncertain as to how they should contend with several sources of uncertainty competing for attention in the planning process. This section is designed to help the reader consider the sources of uncertainty introduced earlier in Section 2.1: Sources of Uncertainty.
2.2.1 Guided Evaluation Instructions
The evaluation score sheet is a tool designed to start the conversation about specific sources of uncertainty and why they may be of concern. It is encouraged to draw from the sources of uncertainty discussed earlier, as well as others that may have been identified. The evaluation score sheet and corresponding visualization should be completed individually; the reflection questions can be considered in a group setting. All instructions and materials necessary to complete the evaluation and reflection are contained in this guide. An interactive Excel tool is also available, which has a copy of the instructions for users that would like to follow the same procedure electronically. The Excel tool can be found by searching the National Academies Press website (nationalacademies.org/publications) for NCHRP Research Report 1168: Incorporating Uncertainty into Long-Range Transportation Planning: A Guide and looking under “Additional materials.”
To conduct the evaluation:
- List topics (sources of uncertainty) to consider in the top left boxes of Table 6.
- Evaluate each of the statements along the rightmost column of the table for each topic being considered.
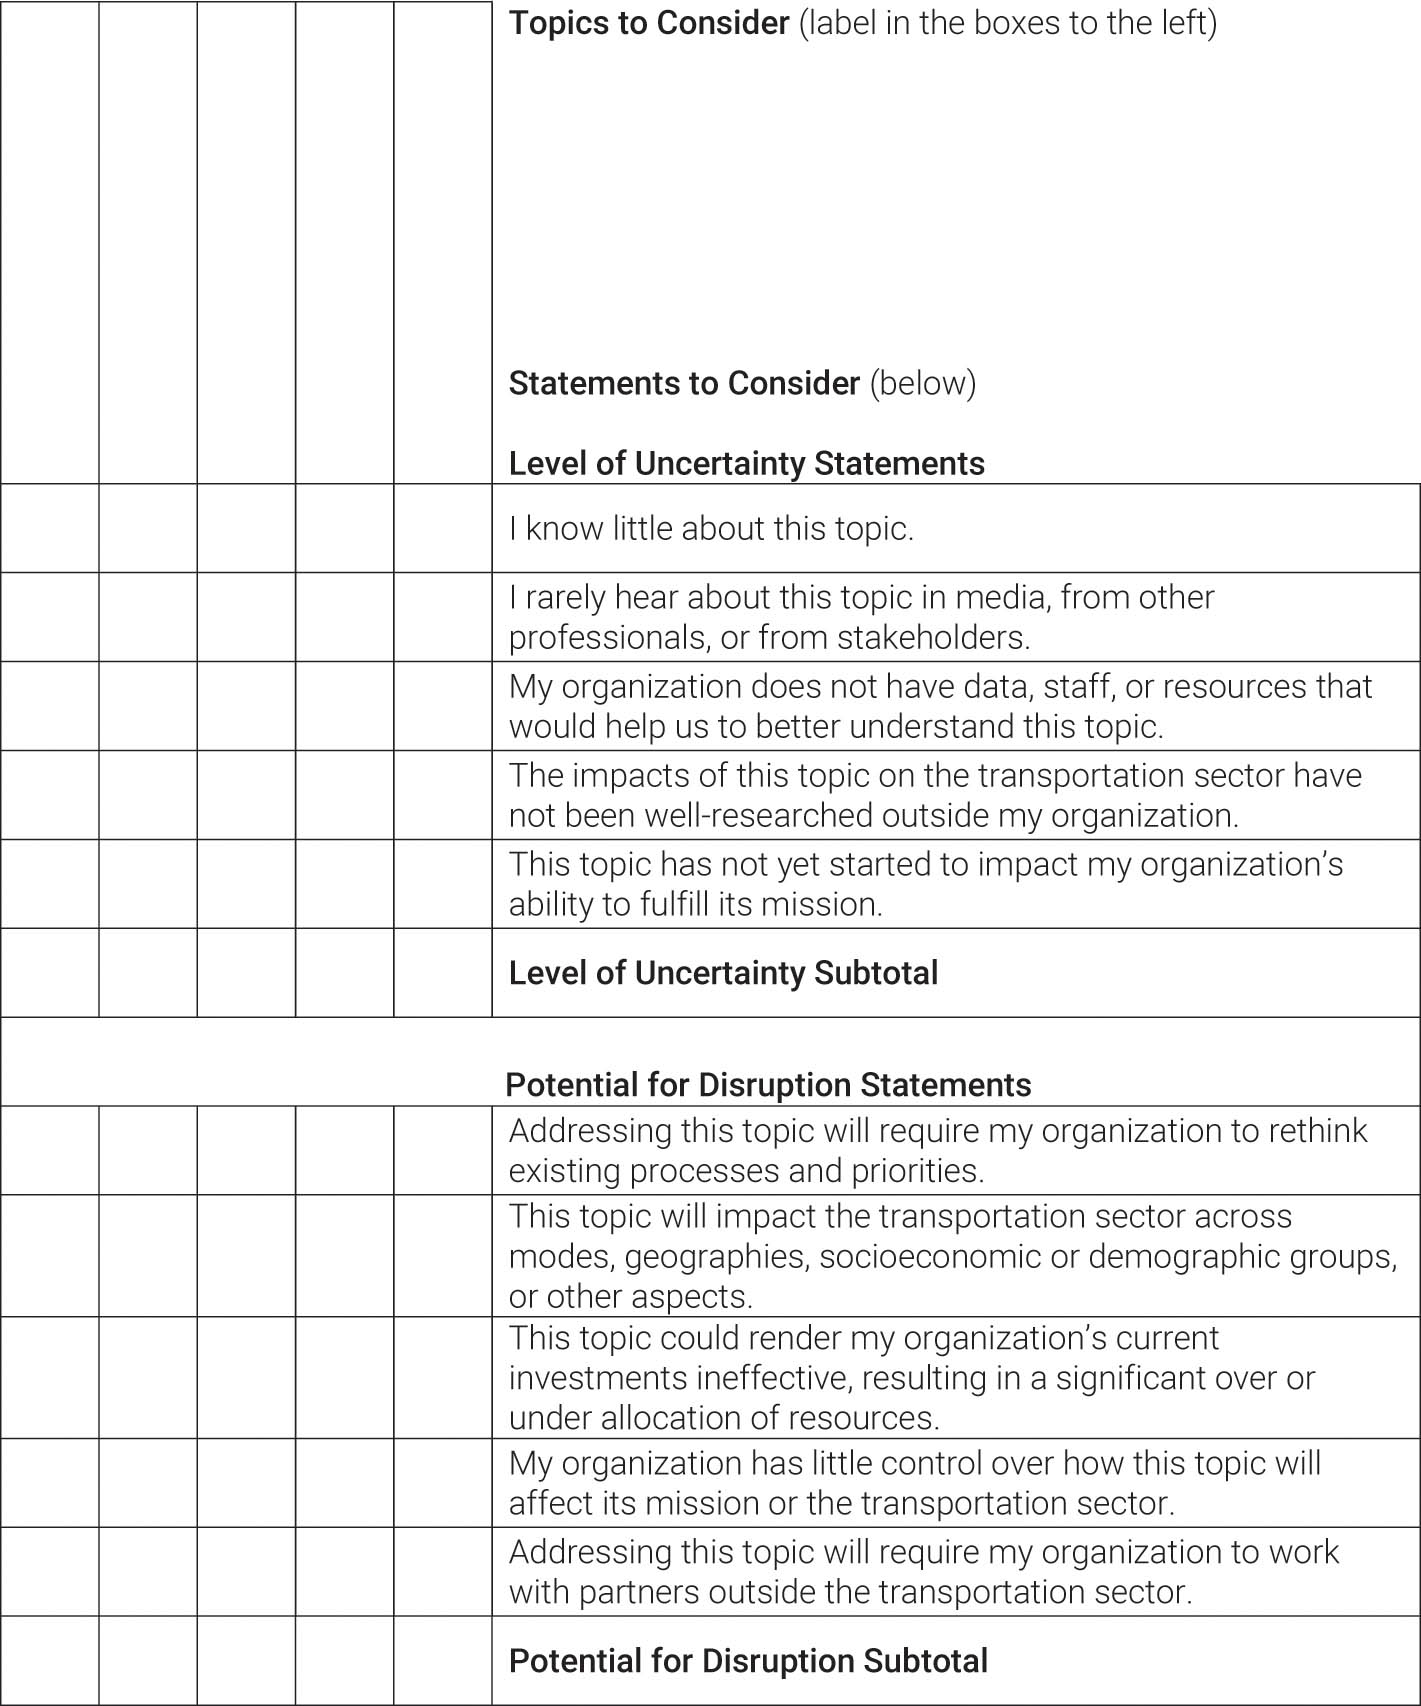
Long Description.
The table is divided into four main vertical sections, each with a distinct purpose.
The first section is Topics to Consider, which contains blank boxes or cells.
The second section is Statements to Consider, which includes the following Level of Uncertainty Statements:
I know little about this topic.
I rarely hear about this topic in the media, from other professionals, or from stakeholders.
My organization does not have data, staff, or resources that would help us to better understand this topic.
The impacts of this topic on the transportation sector have not been well-researched outside my organization.
This topic has not yet started to impact my organization’s ability to fulfill its mission. The section ends with Level of Uncertainty Subtotal. The third section is Potential for Disruption Statements, which include:
Addressing this topic will require my organization to rethink existing processes and priorities.
This topic will impact the transportation sector across modes, geographies, socioeconomic or demographic groups, or other aspects.
This topic could render my organization’s current investments ineffective, resulting in a significant over- or under-allocation of resources.
My organization has little control over how this topic will affect its mission or the transportation sector.
Addressing this topic will require my organization to work with partners outside the transportation sector. The section ends with Potential for Disruption subtotal.
- Place a number from 1 to 5 in the box for each topic and statement combination, with 5 representing statements you strongly agree with, 3 representing statements you feel neutral about, and 1 representing statements you strongly disagree with.
- Sum the preceding rows to get a combined score in the “Level of Uncertainty Subtotal” and “Potential for Disruption Subtotal” rows.
Next, plot the combined scores in Figure 4. Label each point in the plot with the topic name, or an abbreviation that will help relate the points on the plot to the data in Table 6. In the figure, the x-axis corresponds to a topicʼs potential for disruption, and the y-axis corresponds to a topicʼs level of uncertainty. This visualization will illustrate which sources of uncertainty may be most pressing due to their potential to disrupt norms or due to how little is known about them. An example of a completed table and visualization is provided in Table 7 and Figure 5. There are four quadrants in the figure. Additional text after the figure provides guidance on how to interpret topics placed into each of the four quadrants.
Finally, the discussion and reflection questions provided can be used to reflect on the exercise. It can be helpful to reflect on this exercise in a group setting with representatives from multiple parts of your organization to ensure a wide range of perspectives are considered. The exercise may highlight how individuals from across your organization agree or disagree on how much is known about different sources of uncertainty and how much these sources of uncertainty have the potential to disrupt your agencyʼs activities. Reflections on these agreements and disagreements will help you and your agency better understand the level of information you currently have and how your assumptions may be shaping your perspective.
2.2.2 Quadrants in the Visualization
The evaluation visualization in Figure 4 has four quadrants. These quadrants can help categorize the topics examined as part of this exercise and provide guidance on how organizations should handle them. A scaled down version of the visualization with the relevant
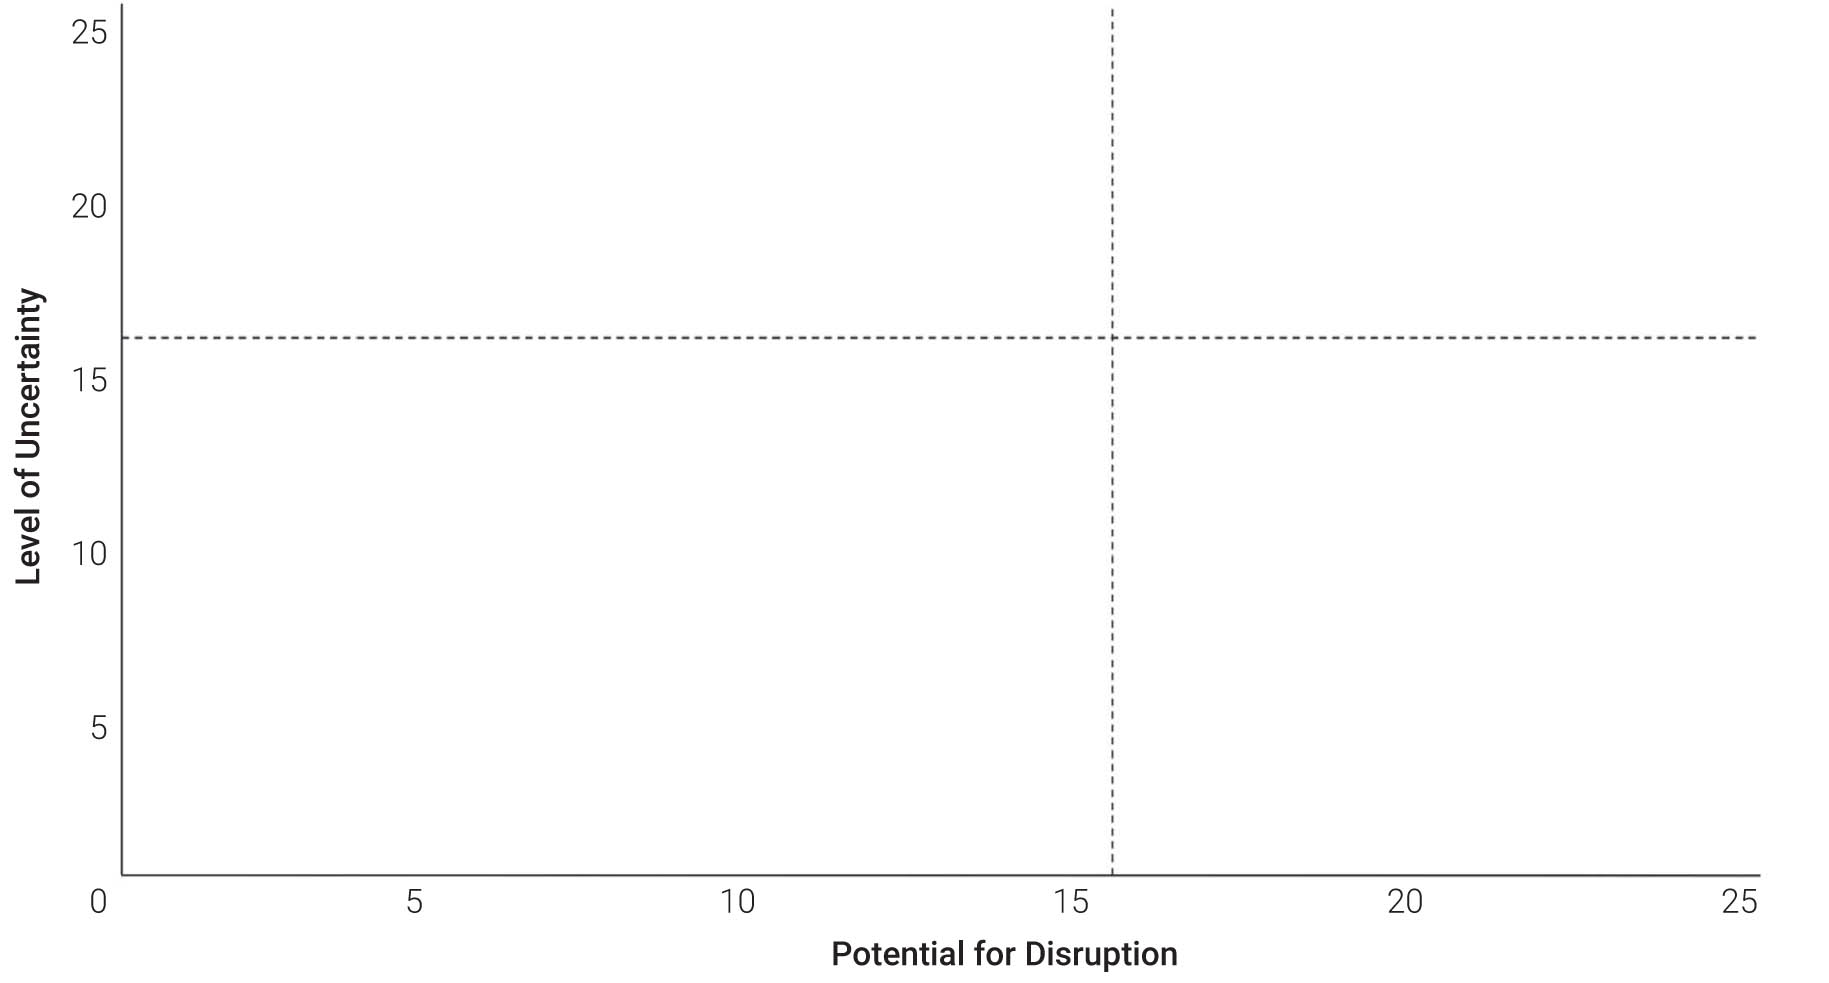
Long Description.
The graph displays a two-dimensional plot with ‘Level of Uncertainty’ on the vertical axis and ‘Potential for Disruption’ on the horizontal axis. Both axes range from 0 to 25 in increments of 5. The graph is divided into four quadrants by dotted lines at the midpoint of each axis, providing a framework for evaluating different scenarios based on their uncertainty and disruption potential.
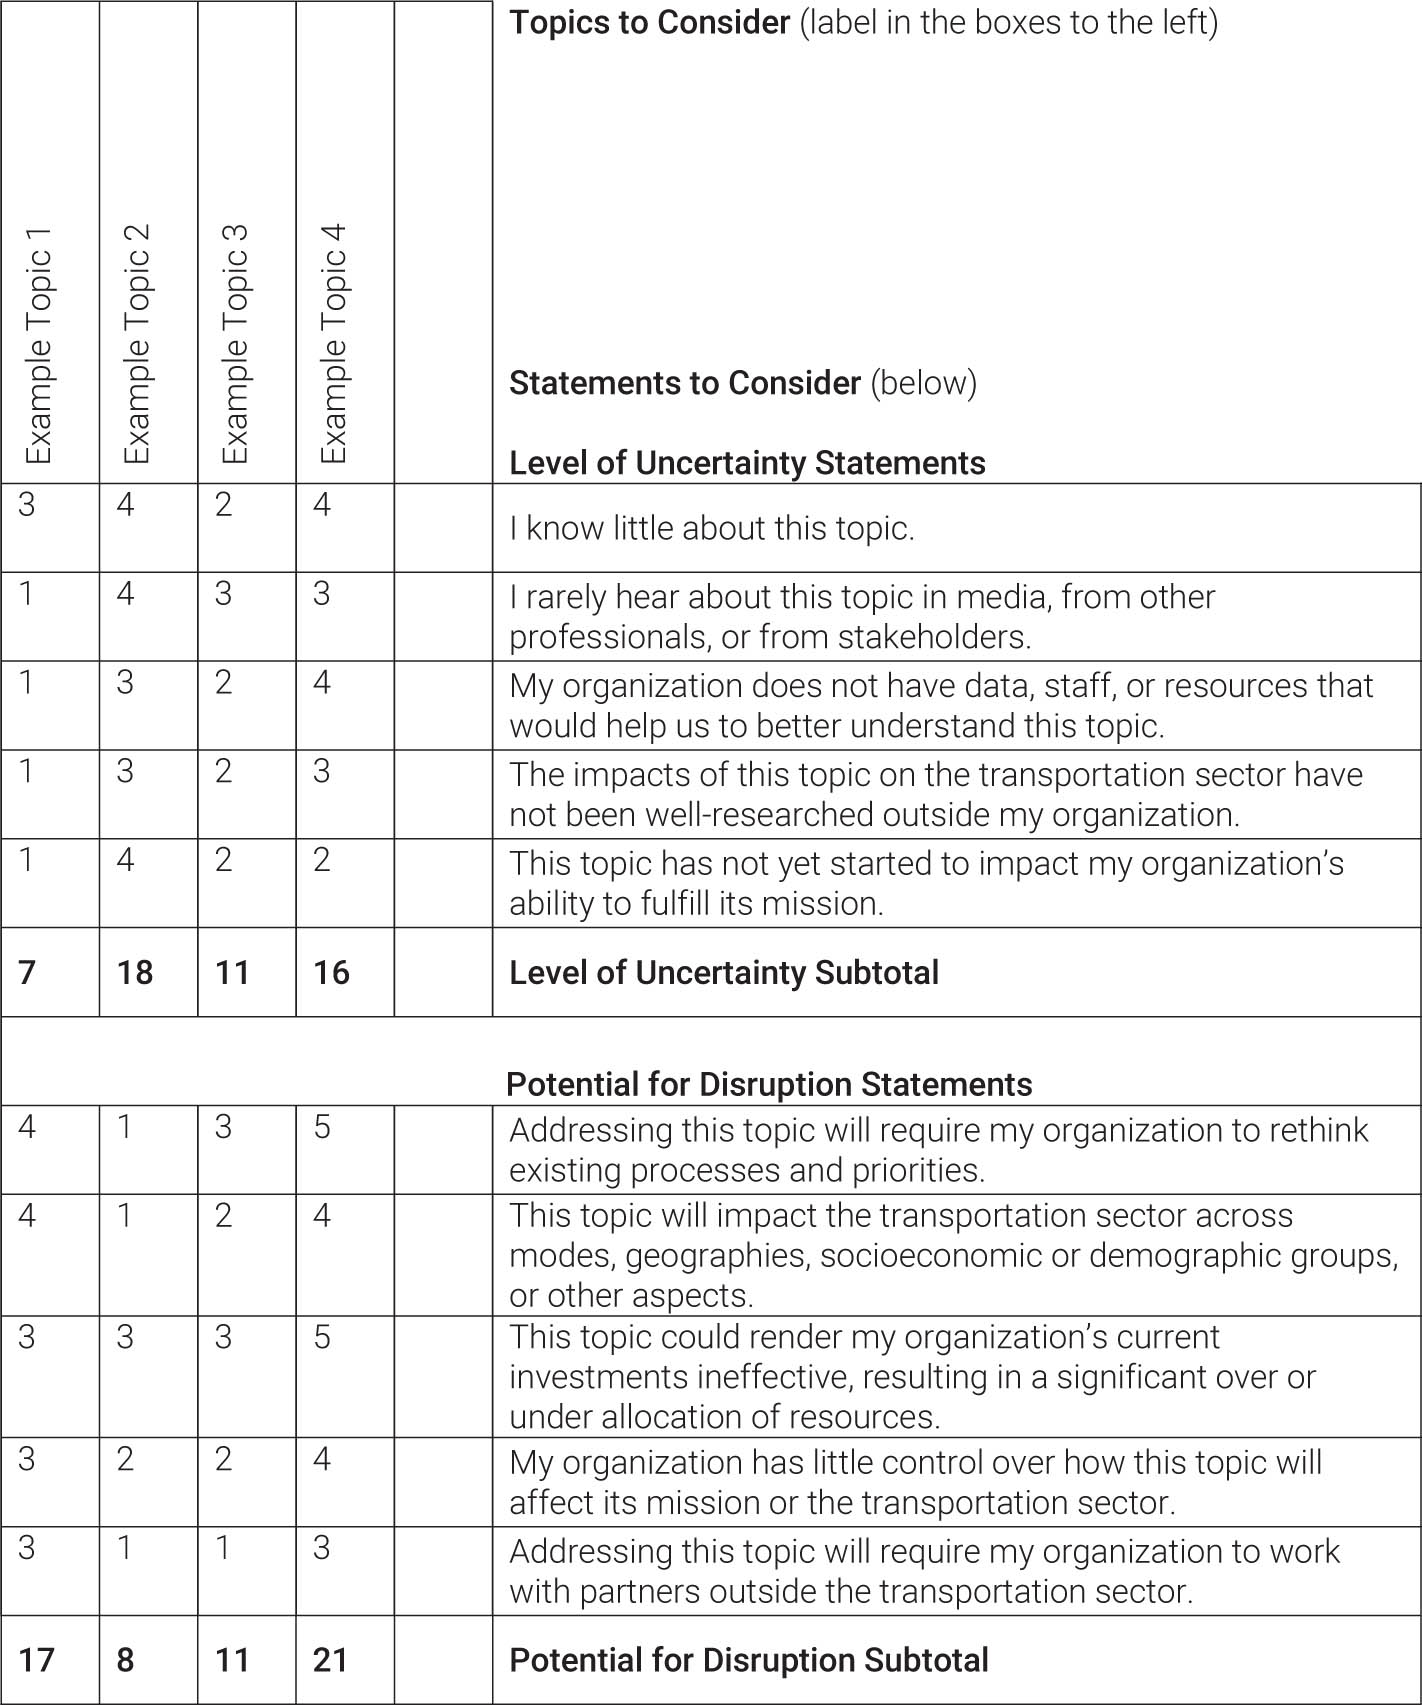
Long Description.
A table titled “Topics to Consider” with four example topics labeled vertically as “Example Topic 1,” “Example Topic 2,” “Example Topic 3,” and “Example Topic 4.” Across the top right, the heading reads “Topics to Consider (label in the boxes to the left)” followed by “Statements to Consider (below)”.The table is divided into two main sections: Level of Uncertainty and Potential for Disruption. Each section includes multiple statements that are rated numerically (on a scale from 1 to 5) for each of the four example topics. The numbers appear in small cells aligned under each topic column.
Section 1: Level of Uncertainty Statements
I know little about this topic.” (Scores: Topic 1 equals 3, Topic 2 equals 4, Topic 3 equals 2, Topic 4 equals 4).
“I rarely hear about this topic in the media, from other professionals, or from stakeholders.” (Scores: 1, 4, 3, 3).
“My organization does not have data, staff, or resources that would help us to better understand this topic.”(Scores: 1, 3, 2, 4)
“The impacts of this topic on the transportation sector have not been well-researched outside my organization.” (Scores: 1, 3, 2, 3)
“This topic has not yet started to impact my organization’s ability to fulfill its mission.” (Scores: 1, 4, 2, 2). The subtotal scores for this section are 7 for Topic 1, 19 for Topic 2, 11 for Topic 3, and 16 for Topic 4.
Section 2: Potential for Disruption Statements
“Addressing this topic will require my organization to rethink existing processes and priorities.” (Scores: 4, 1, 3, 5).
“This topic will impact the transportation sector across modes, geographies, socioeconomic or demographic groups, or other aspects.” (Scores: 4, 1, 2, 4).
“This topic could render my organization’s current investments ineffective, resulting in a significant over- or under-allocation of resources.” (Scores: 3, 3, 3, 5)
“My organization has little control over how this topic will affect its mission or the transportation sector.” (Scores: 3, 2, 2, 4).
“Addressing this topic will require my organization to work with partners outside the transportation sector.” (Scores: 3, 1, 1, 3).” The subtotal scores for this section are 17 for Topic 1, 8 for Topic 2, 11 for Topic 3, and 21 for Topic 4.

Long Description.
The graph displays a completed evaluation visualization with two axes: the horizontal axis represents potential for disruption, ranging from 0 to 25, and the vertical axis represents level of uncertainty, ranging from 0 to 25, in increments of 5. Four topics are plotted: Example Topic 1 at (17, 7), Example Topic 2 at (8, 19), Example Topic 3 at (12, 12), and Example Topic 4 at (22, 17). The graph helps in assessing the topics based on their potential impact and associated uncertainty. The values are approximately determined.
quadrant names is provided in Figure 6, and descriptions of each quadrant are provided in the text that follows.
- Bottom Left: Remain (≤15 on both axes)
- Topics in this quadrant have both a low level of uncertainty and a low potential for disruption. These topics are ones that can be understood or managed using existing processes and resources. Wherever these topics fall in an organizationʼs list of priorities, they can likely remain there since they are understandable and not expected to be disruptive.
- Top Left: Research (≤15 on potential for disruption; >15 on level of uncertainty)
- Topics in this quadrant have a high level of uncertainty but a low potential for disruption. While little is known about these topics, they are not expected to be disruptive. These are topics that require additional research but may not need immediate action.
- Bottom Right: Resource (≤15 on level of uncertainty; >15 on potential for disruption)
- Topics in this quadrant have a low level of uncertainty but a high potential for disruption. These topics are understood and expected to be disruptive. These are topics that should be given the resources necessary to appropriately mitigate any impacts of disruption.
- (>15 on both axes)
- Topics in this quadrant have both a high level of uncertainty and a high potential for disruption. These topics are likely to require both research and resources and should be regularly reevaluated to understand how they have, currently are, and will continue to impact an organization.
2.2.3 Reflection
Having answered a series of questions to assess the level of uncertainty and potential for disruption associated with each of the topics identified, this portion of the exercise is designed to encourage reflection on the results of the assessment and action based on those results. It is encouraged to reflect on these questions individually and as a group with others in your organization.
2.2.3.1 Making Sense of the Results
- Do these results make sense? Did the exercise place each topic in a place you would expect along each axis? Why or why not?

Long Description.
The chart titled ‘Evaluation Visualization with Quadrant Names’ displays four quadrants. The x-axis represents the Potential for Disruption, ranging from 0 to 25, while the y-axis shows the Level of Uncertainty, also ranging from 0 to 25, in increments of 5. The quadrants are labeled as follows: Top Left is Research, Top Right is Regularly Reevaluate, Bottom Left is Remain, and Bottom Right is Resource. Each quadrant suggests a different strategy based on the levels of uncertainty and potential disruption.
- The topics in the top right quadrant are ones you both know little about and expect to be highly disruptive. Do you think these are topics your organization should focus on?
- What additional characteristics about the topics examined are important to consider that were not captured in this exercise?
- How might your knowledge (or lack thereof) of a topic have affected the way you answered questions that evaluated the topicʼs potential for disruption?
- How might your beliefs that a topic will (or will not) be disruptive have affected the way you answered questions that evaluated the topicʼs level of uncertainty?
- If you did this evaluation as part of a group exercise, how was the final placement of each topic on the visualization similar to or different from other members of the group? What might explain these differences?
- Do other members of the group have information that led them to categorize each topic as having a higher or lower level of uncertainty?
- Do other members of the group believe the topics examined will be more or less disruptive than you? Why?
- If you did this evaluation on your own, do you think other members of your organization would have similar results? What might change their responses?
2.2.3.2 Taking Action
- How does your organization typically address challenges it knows little about? Do you think that same process is appropriate for topics that ranked high on the “Level of Uncertainty” axis in this exercise? If not, what is appropriate?
- How does your organization typically prioritize the issues it will address? Will the topics that scored highly on the “Potential for Disruption” axis be appropriately categorized by that process?
- Which of the topics examined can be further analyzed using resources available to your organization in the short term? What resources does your organization need in the long term to make sense of the topics examined?
- Who should your organization partner with to better understand and act on the topics examined in this exercise?
- What does the timescale currently look like for the topics examined? Are some of these issues evolving more rapidly than others?
2.2.3.3 Conclusion to the Evaluation and Reflection Exercise
This guided evaluation and reflection exercise was designed to encourage consideration of the various sources of uncertainty described in earlier parts of this guide or those that may be already known. The reflection questions centered on understanding the results of the exercise may help identify personal or organizational perceptions and circumstances that influence views on the sources of uncertainty considered. Questions centered on taking action are designed to help identify which sources of uncertainty may be most pressing and which require new organizational resources or processes to address, as well as help identify partners in the work that lies ahead. Bear in mind the results of the exercise while moving through other sections of this guide.
2.3 Regulatory Context and Requirements
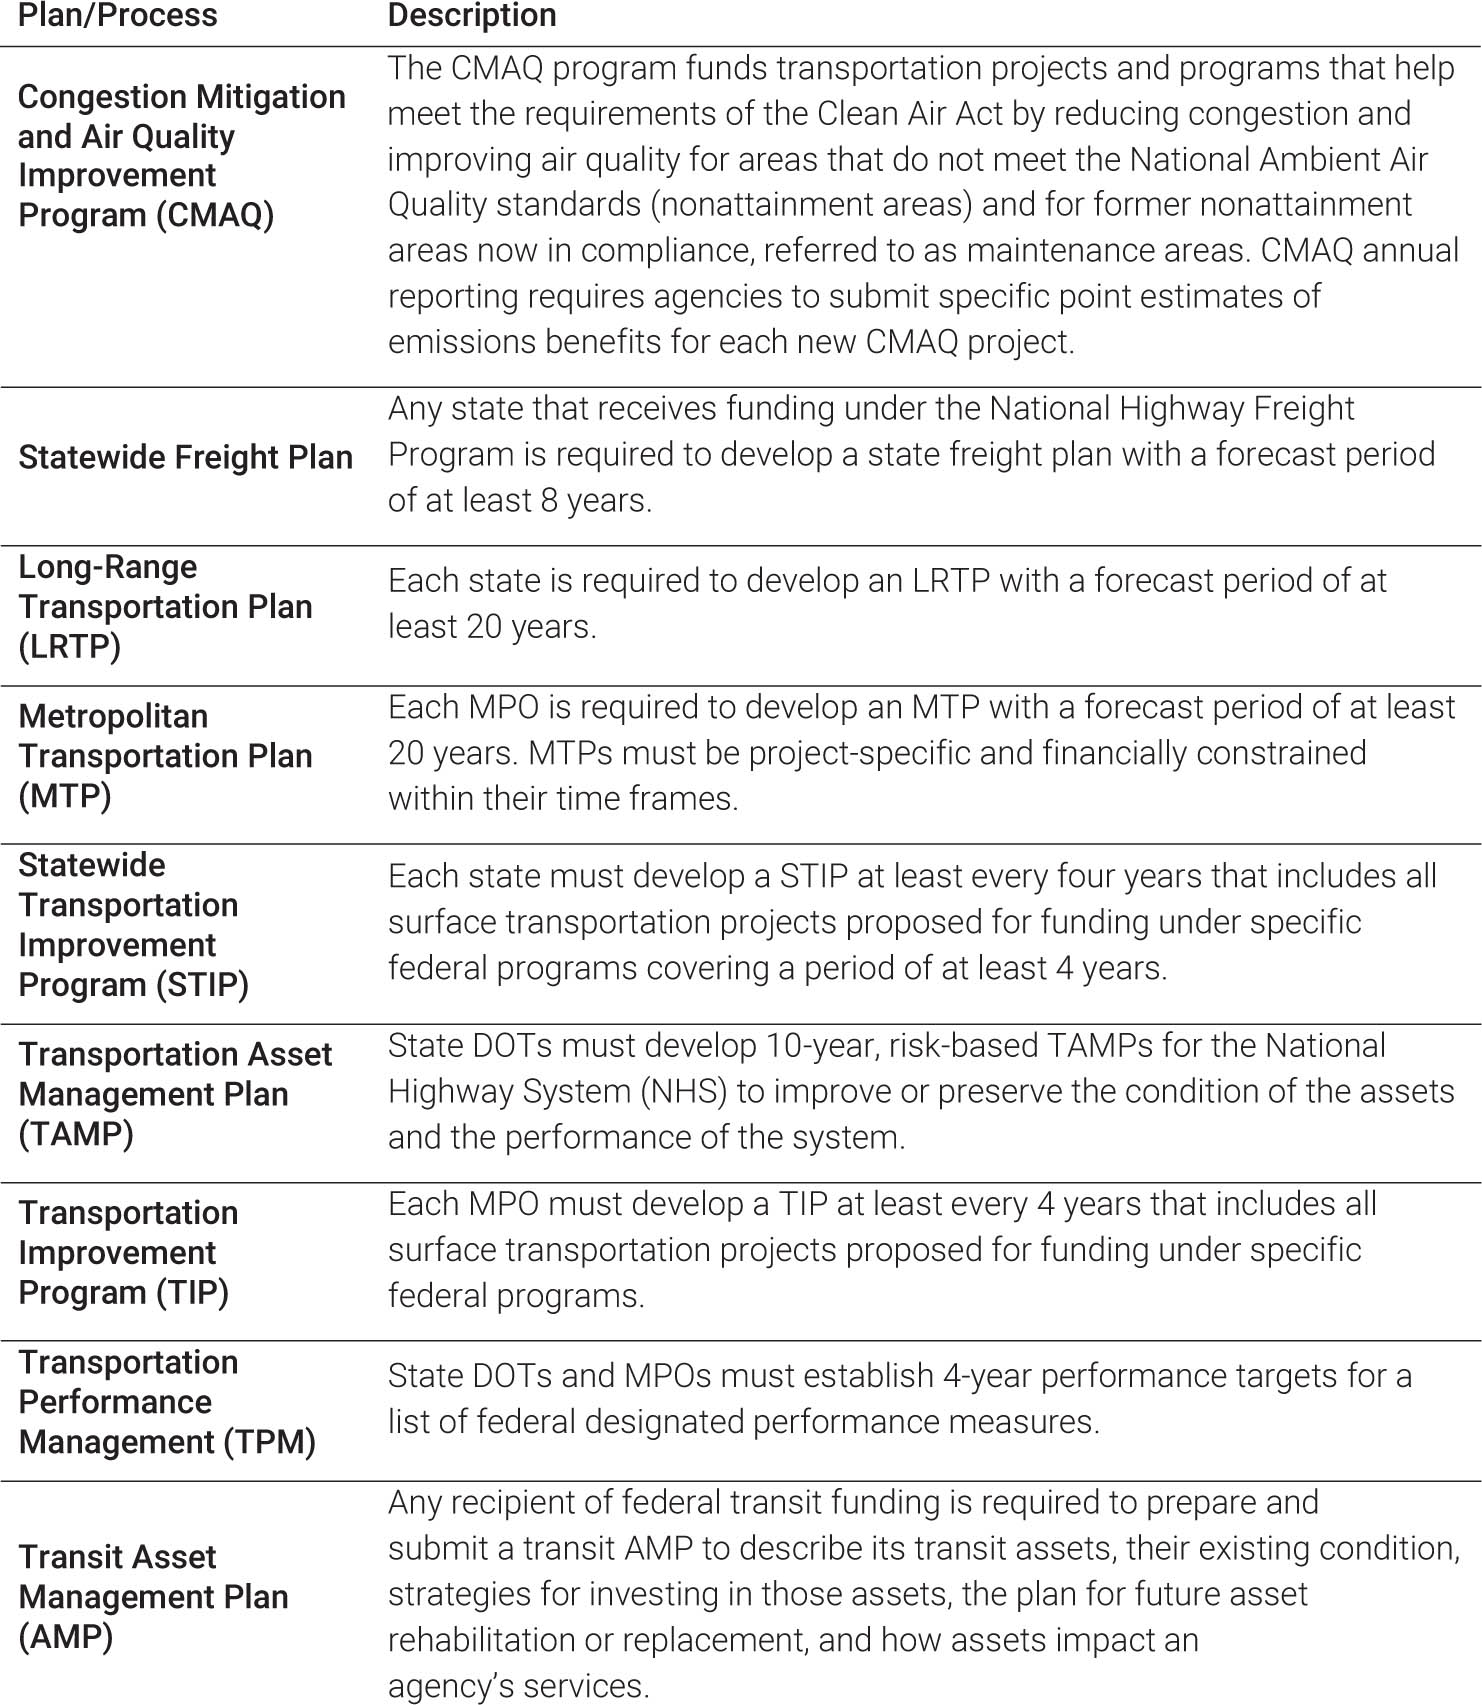
Preparing for an unknown future requires transportation agencies to consider uncertainty throughout the planning process. There are specific areas in each planning document where transportation agencies either must (per regulation) explicitly consider uncertainty or at least have the opportunity to consider uncertainty. This section addresses some common planning documents and processes outlined in Table 8. While this section is not meant to be exhaustive of all planning activities a DOT or MPO will undertake, and reflects opportunities and
Long Description.
The two column headers are Plan or Process and Description. The data given in the table row-wise are as follows:
Row 1: Congestion Mitigation and Air Quality Improvement Program (CMAQ ): The CMAQ Program funds transportation projects and programs that help meet the requirements of the Clean Air Act by reducing congestion and improving air quality for areas that do not meet the National Ambient Air Quality standards (nonattainment areas) and for former nonattainment areas now in compliance, referred to as maintenance areas. CMAQ annual reporting requires agencies to submit specific point estimates of emissions benefits for each new CMAQ project.
Row 2: Statewide Freight Plan: Any state that receives funding under the National Highway Freight Program is required to develop a state freight plan with a forecast period of at least eight years.
Row 3: Long Range Transportation Plan (LRTP): Each state is required to develop an LRTP with a forecast period of at least 20 years.
Row 4: Metropolitan Transportation Plan (MTP): Each MPO is required to develop an MTP with a forecast period of at least 20 years. MTPs must be project-specific and financially constrained within their time frames.
Row 5: Statewide Transportation Improvement Program (STIP): Each state must develop a STIP at least every four years that includes all surface transportation projects proposed for funding under specific federal programs covering a period of at least four years.
Row 6: Transportation Asset Management Plan (TAMP): State DOTs must develop 10-year, risk-based TAMPs for the National Highway System (NHS) to improve or preserve the condition of the assets and the performance of the system.
Row 7: Transportation Improvement Program (TIP): Each MPO must develop a TIP at least every four years that includes all surface transportation projects proposed for funding under specific federal programs.
Row 8: Transportation Performance Management (TPM): State DOTs and MPOs must establish four-year performance targets for a list of federally designated performance measures.
Row 8: Transit Asset Management Plan (AMP): Any recipient of federal transit funding is required to prepare and submit a transit AMP to describe its transit assets, their existing condition, strategies for investing in those assets, the plan for future asset rehabilitation or replacement, and how assets impact agency’s services.
requirements as of its publication, which may evolve over time, it provides a starting point that may be helpful in initial plan scoping activities.
The red cube icons in Table 9 highlight where the law or regulations require agencies to incorporate uncertainty in elements of specific plans. Keep in mind that this is different from whether an element is required within a given plan; the icons only indicate how uncertainty can or must be incorporated in each element. The green arrows indicate where the law or regulation offers agencies the suggestion or opportunity to consider or document uncertainty. The blue cross indicates that the opportunity is not directly referenced in law or regulation but is strongly suggested through official guidance documents, AASHTO recommendations, or otherwise recognized as best or widely accepted practice.
There are opportunities to include uncertainty in nearly every element of planning. Table 9 is not an exhaustive list but instead provides a basic guide to where agencies must or could (according to regulations or widely accepted practices) incorporate strategies to explicitly consider uncertainty in different sections of common planning documents.
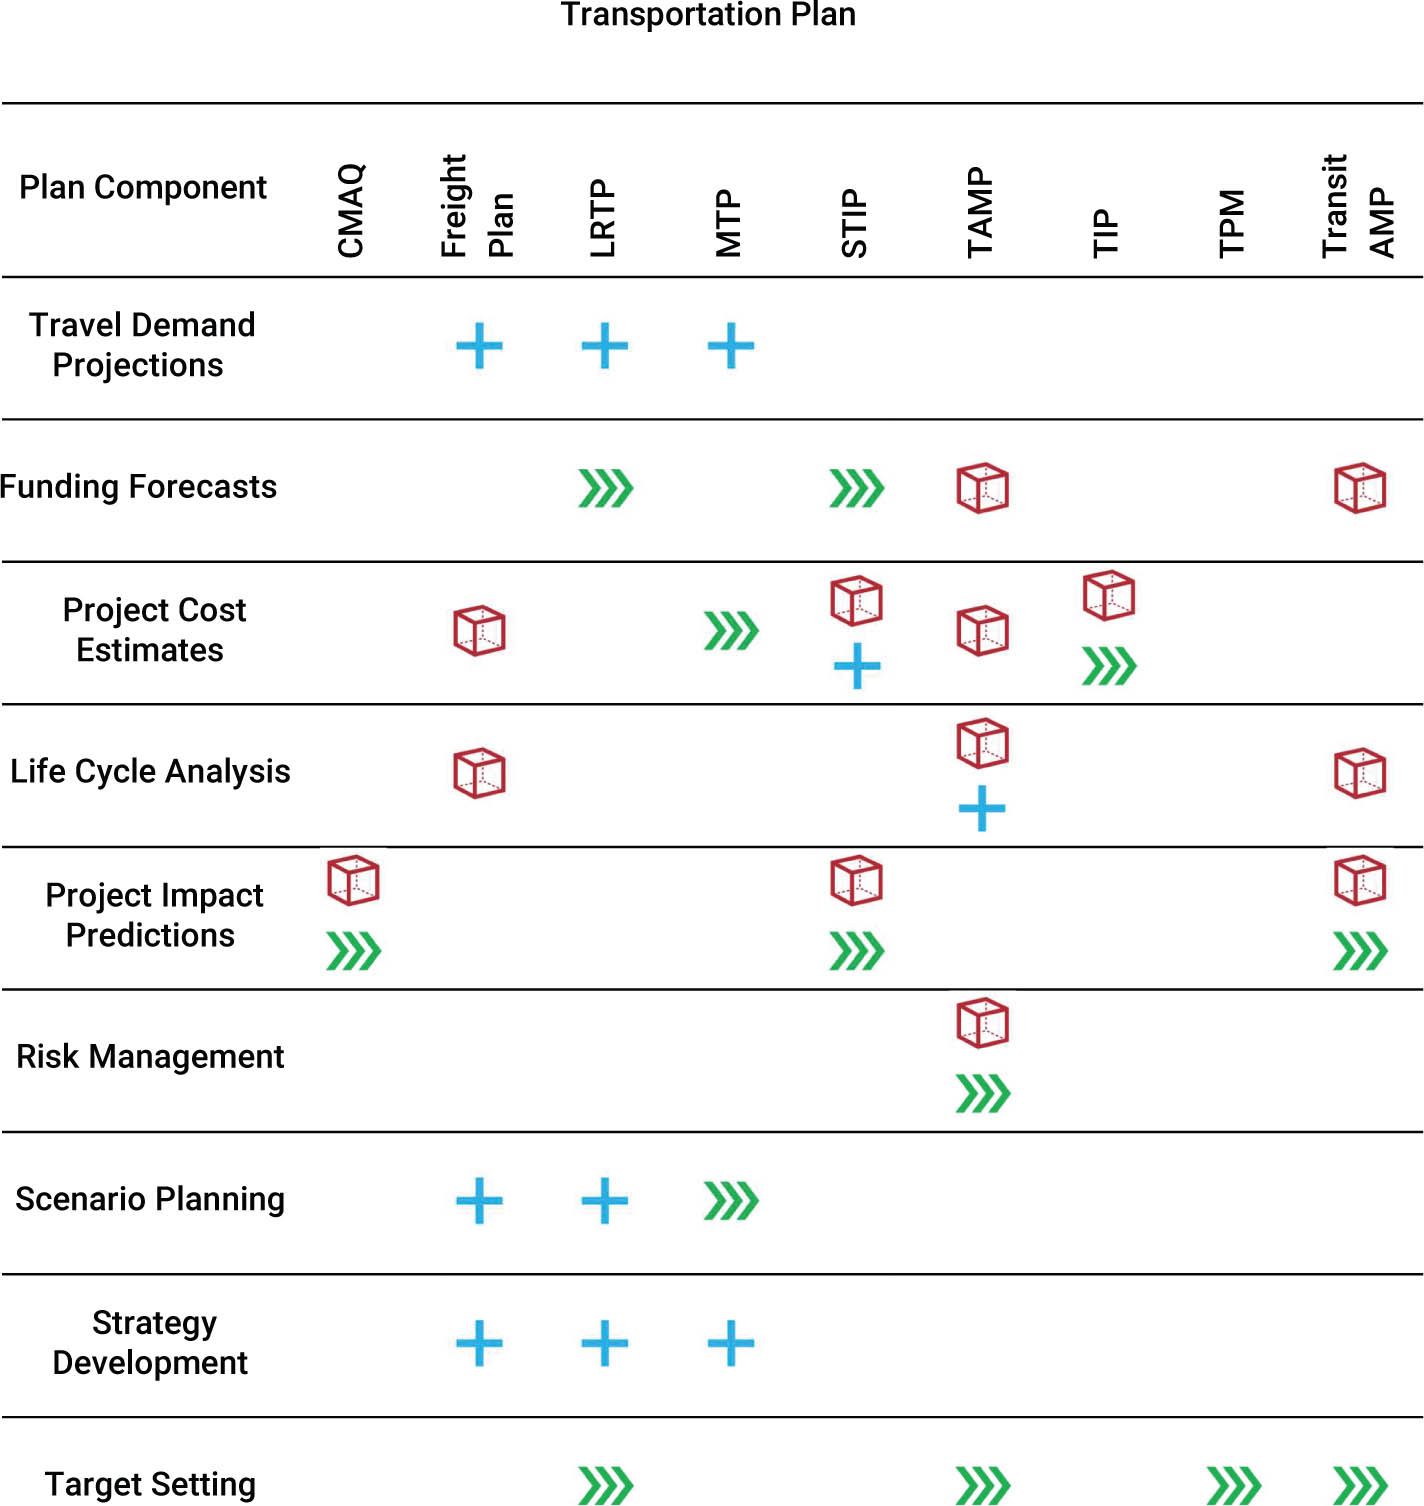
Note:  Symbolizes a requirement to incorporate uncertainty.
 Symbolizes a regulatory suggestion to incorporate uncertainty.
 Symbolizes a widely adopted practice of incorporating uncertainty.
Long Description.
The column headers are Plan Component, CMAQ, Freight plan, LRTP, MTP, STIP, TAMP, Transit AMP. Cube indicates requirement, three green arrows indicate regulatory suggestion, and plus indicates widely adopted practice.
The data in the table rows are as follows:
Row 1: Travel Demand Projections: Blank, plus, plus, plus, Blank, Blank, Blank, Blank, Blank.
Row 2: Funding Forecasts: Blank, Blank, three green arrows, Blank, three green arrows, Cube, Blank, Blank, Cube.
Row 3: Project Cost Estimates: Blank, Cube, Blank, three arrows, Cube and plus, Cube, Cube and three green arrows, Blank, Blank.
Row 4: Life Cycle Analysis: Blank; Cube; Blank, Blank, Blank, Cube and plus, Blank, Blank, Cube.
Row 5: Project Impact Predictions: Cube and three arrows, Blank, Blank, Blank, Cube and three green arrows, Blank, Blank, Blank, Cube and three arrows.
Row 6: Risk Management: Blank, Blank, Blank, Blank, Blank, Cube and three green arrows, Blank, Blank, Blank.
Row 7: Scenario Planning: Blank, Plus, Plus, three green arrows, Blank, Blank, Blank, Blank, Blank.
Row 8: Strategy Development: Blank, Plus, Plus, Plus, Blank, Blank, Blank, Blank, Blank.
Row 9: Target setting: Blank, Blank, three green arrows, Blank, Blank, three green arrows, Blank, three green arrows, three green arrows.
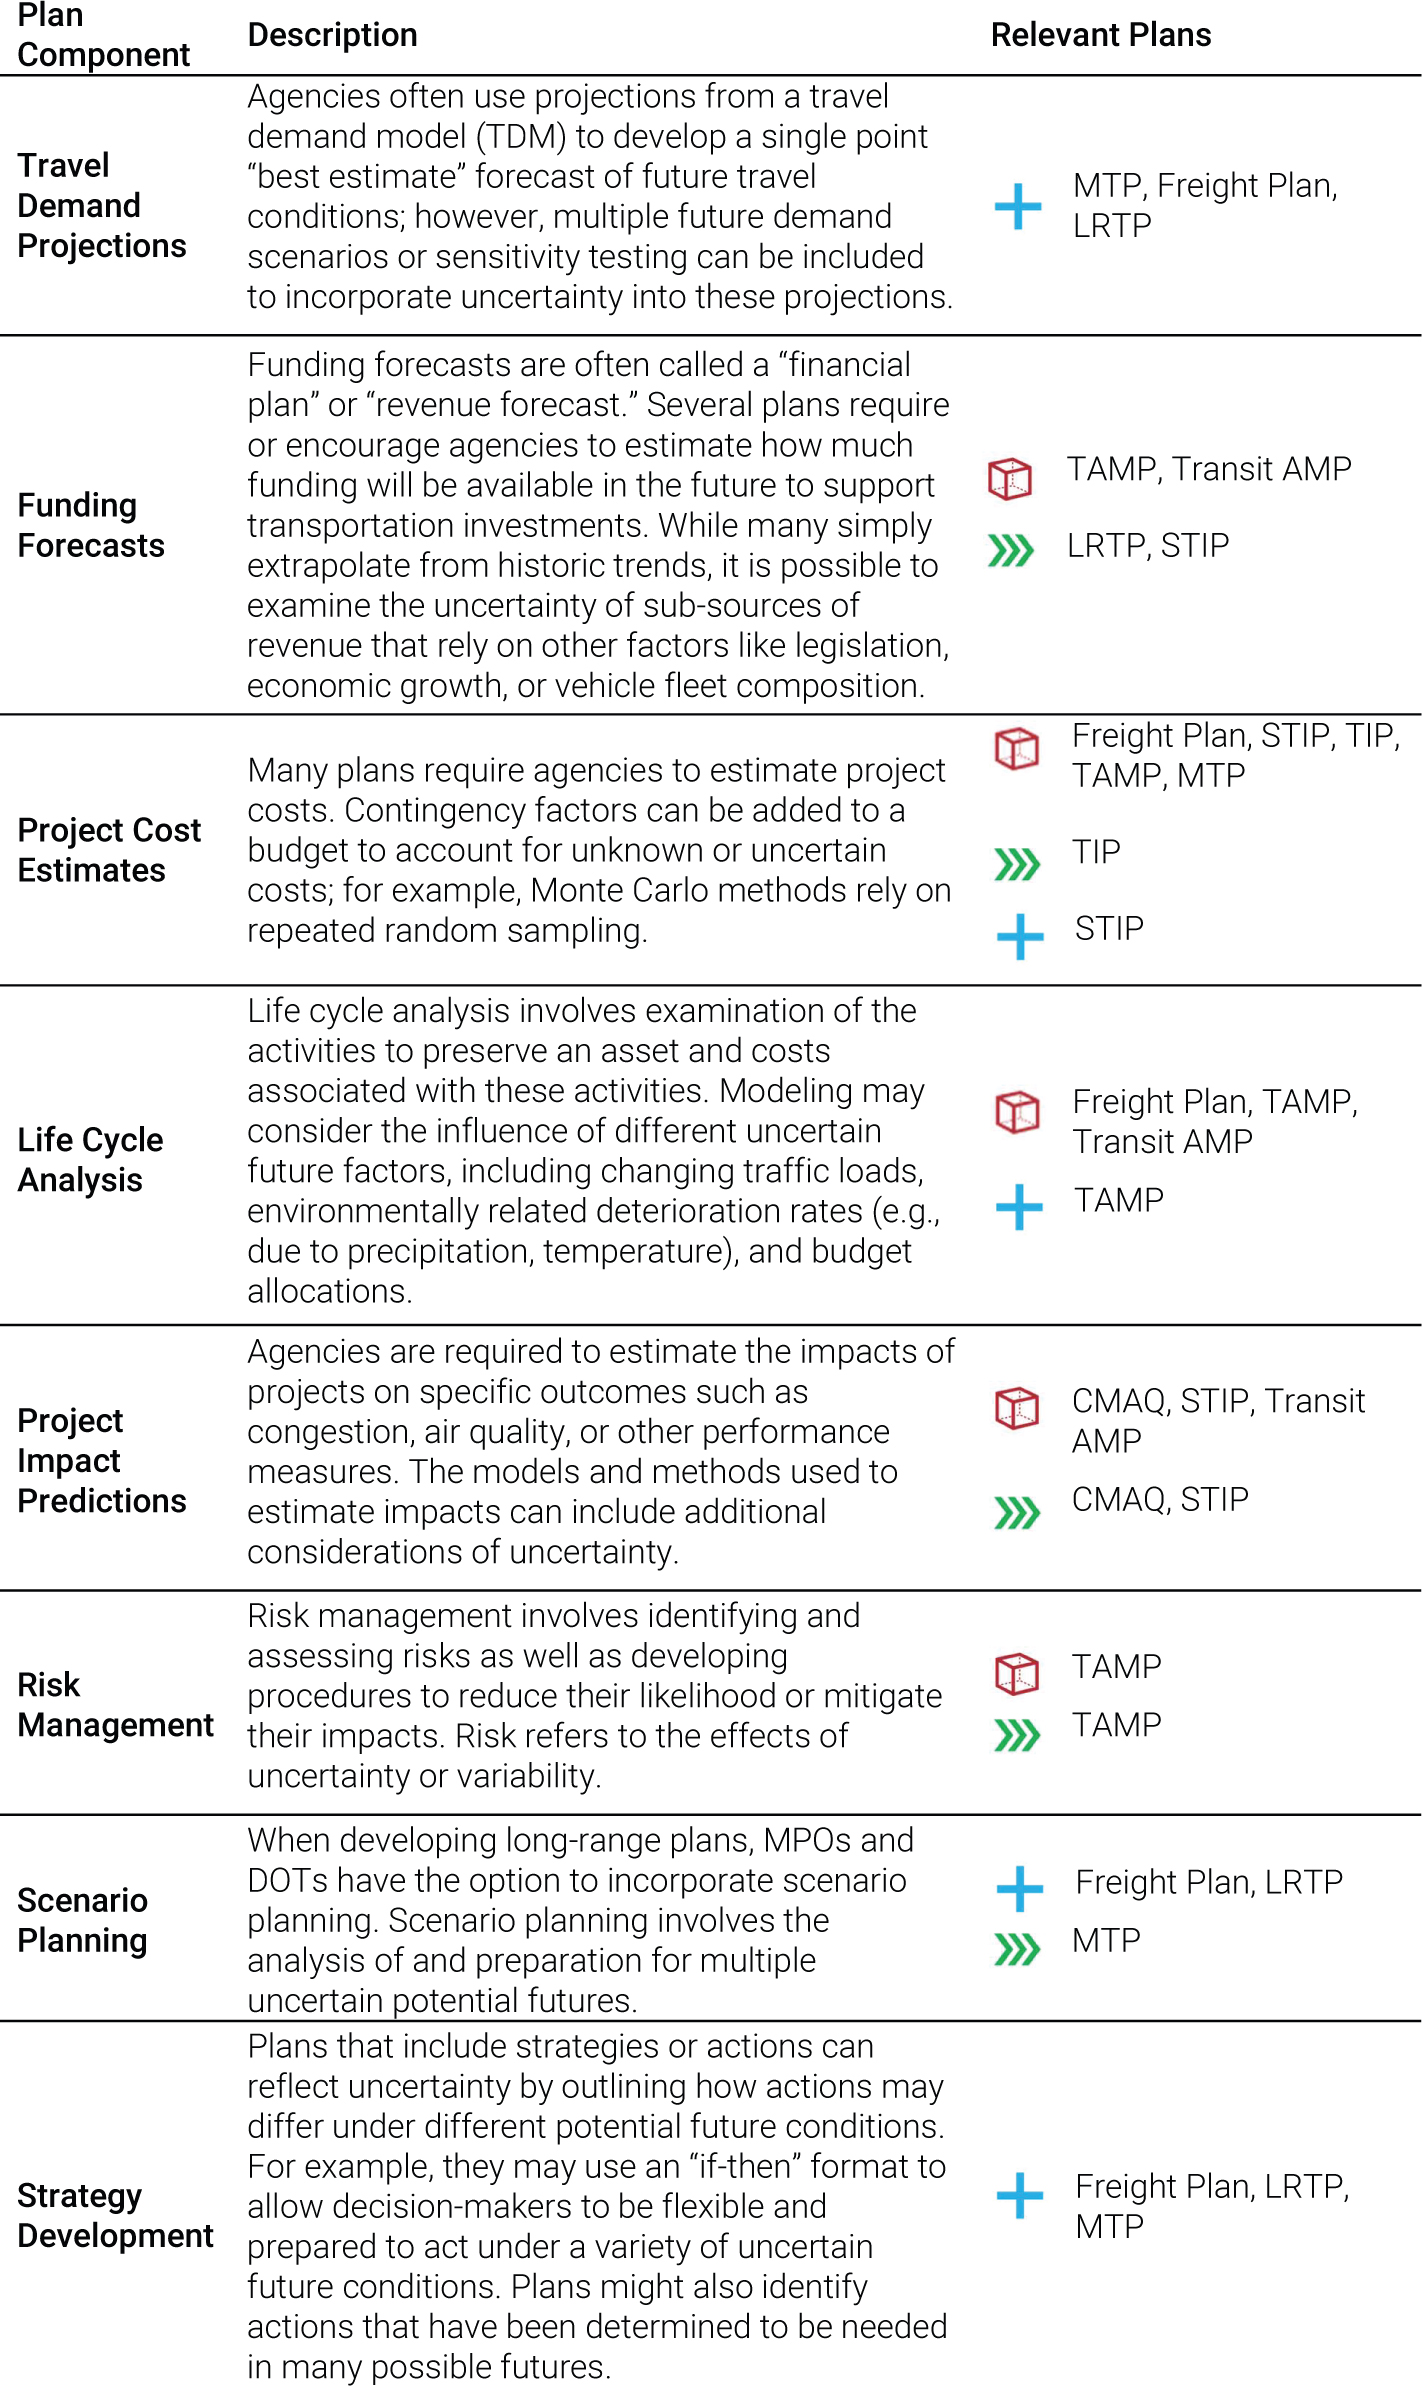
Table 10 describes common opportunities to incorporate uncertainty in different elements across plans. For those seeking additional information, see Appendix A in NCHRP Web-Only Document 440.
2.4 Family of Plans
Long-range planning activities are most influential when they are connected to other agency planning and implementation opportunities within a “family of plans.” To that end, the goal of this section is to identify opportunities for long-range planning to support other agency activities in order to maximize the usefulness of limited planning and analysis resources as well as enhance consistency and coordination across plans.
Three subsections comprise this section. In the initial section, agencies can review and clarify their current plans, including their frequency and timeline. After understanding the current state
(continued on next page)
Long Description.
The column headers are Plan Component, Description, and Relevant plans. Cube indicates requirement, three green arrows indicate regulatory suggestion, and plus indicates widely adopted practice. The data given in the table row-wise are as follows:
Row 1: Travel Demand Projections: Agencies often use projections from a travel demand model (TDM) to develop a single-point “best estimate” forecast of future travel conditions; however, multiple future demand scenarios or sensitivity testing can be included to incorporate uncertainty into these projections. Plus, MTP, Freight Plan, LRTP.
Row 2: Funding Forecasts: Funding forecasts are often called a “financial plan” or “revenue forecast.” Several plans require or encourage agencies to estimate how much funding will be available in the future to support transportation investments. While many simply extrapolate from historic trends, it is possible to examine the uncertainty of sub-sources of revenue that rely on other factors like legislation, economic growth, or vehicle fleet composition; Cube, TAMP, Transit AMP, three green arrows, LRTP, STIP.
Row 3: Project Cost Estimates: Many plans require agencies to estimate project costs. Contingency factors can be added to a budget to account for unknown or uncertain costs; for example, Monte Carlo methods rely on repeated random sampling; Cube, Freight, Plan, STIP, TIP, TAMP, MTP, three green arrows, TIP, Plus, STIP.
Row 4: Life-Cycle Analysis: Life-cycle analysis involves examination of the activities to preserve an asset and the costs associated with these activities. Modeling may consider the influence of different uncertain future factors, including changing traffic loads, environmentally related deterioration rates (for example, due to precipitation, temperature), and budget allocations; Cube, Freight plan, TAMP, Transit AMP, Plus, TAMP.
Row 5: Project Impact Predictions: Agencies are required to estimate the impacts of projects on specific outcomes such as congestion, air quality, or other performance measures. The models and methods used to estimate impacts have the opportunity to include additional considerations of uncertainty; Cube, CMAQ, STIP, Transit AMP, three green arrows, CMAQ, STIP.
Row 6: Risk management: Risk management involves identifying and assessing risks as well as developing procedures to reduce their likelihood or mitigate their impacts. Risk refers to the effects of uncertainty or variability. Cube, TAMP, three green rows, TAMP.
Row 7: Scenario Planning: When developing long-range plans, MPOs and DOTs have the option to incorporate scenario planning. Scenario planning involves the analysis of and preparation for multiple uncertain potential futures; Plus, Freight plan, LRTP, three green arrows, MTP.
Row 8: Strategy Development: Plans that include strategies or actions can reflect uncertainty by outlining how actions may differ under different potential future conditions. For example, they may use an “if-then” format to allow decision-makers to be flexible and prepared to act under a variety of uncertain future conditions. Plans might also identify actions that have been determined to be needed under many futures; Plus, Freight plan, LRTP, MTP.
Note: Symbolizes a requirement to incorporate uncertainty.
Symbolizes a regulatory suggestion to incorporate uncertainty.
Symbolizes a widely adopted practice of incorporating uncertainty.
Long Description.
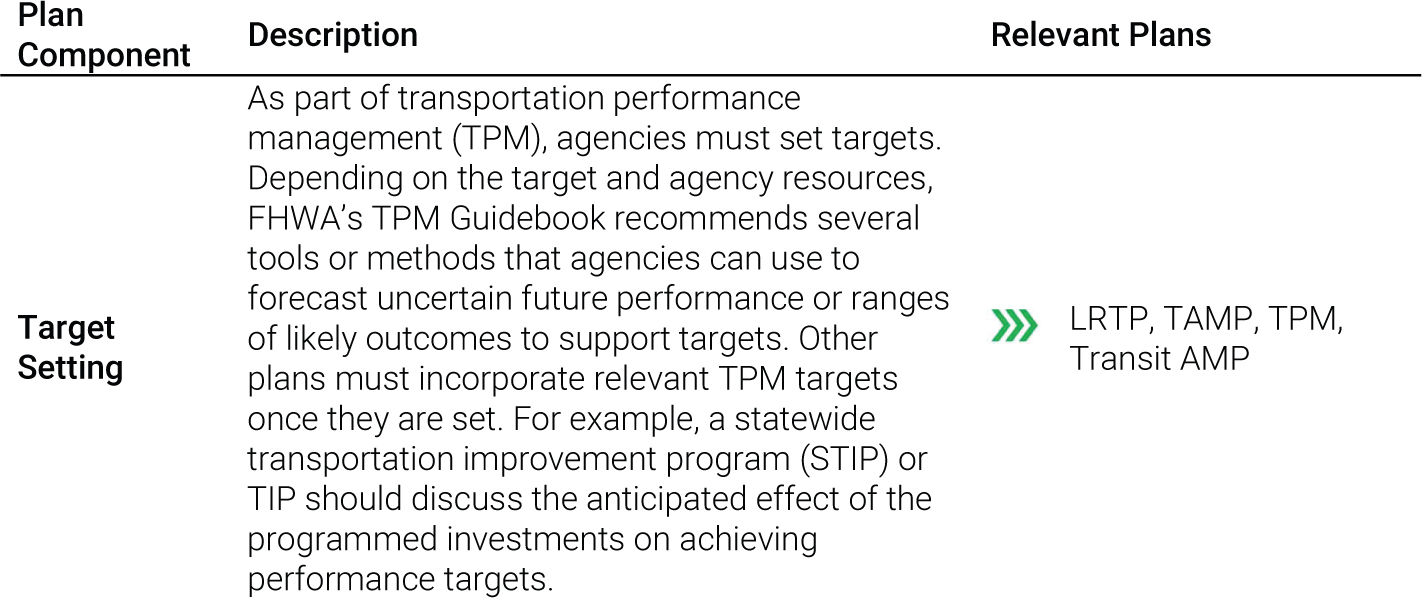
The column headers are Plan Component, Description, and Relevant plans. Cube indicates requirement, three green arrows indicate regulatory suggestion, and plus indicates widely adopted practice. The data given in the table row-wise are as follows:
Row 9: Target Setting: As part of transportation performance management (TPM), agencies must set targets. Depending on the target and agency resources, FHWA’s TPM Guidebook recommends several tools or methods that agencies can use to forecast uncertain future performance or ranges of likely outcomes to support targets. Other plans must incorporate relevant TPM targets once they are set. For example, a STIP or TIP should discuss the anticipated effect of the programmed investments on achieving performance targets; three green arrows, LRTP, TAMP, TPM, Transit AMP.
of the family of plans, agencies are prompted to articulate how each plan addresses uncertainty concerning common components, as previously introduced in Section 2.3, Regulatory Context and Requirements. Once agencies have a clear understanding of their current plans and approaches to uncertainty, they are encouraged to summarize the main outputs aiding uncertainty management and to draw connections with other active or upcoming plans, facilitating the transfer of lessons and knowledge. The connections among plans are the core output of this section because agencies can use that information to address uncertainty across multiple planning documents.
Because the family of plans section is focused on drawing connections between planning activities and documents that are often completed in different parts of transportation agencies, it may be most useful to gather the representatives responsible for or involved in each of the selected planning documents to collaboratively work through the tables and exercises outlined in this portion. A representative group of staff can use their individual expertise to work together to define how uncertainty is addressed in each of the planning areas, draw connections between them, and identify future opportunities.
In completing this section, please keep in mind the multiple sources of uncertainty introduced in Chapter 1 and summarized in Figure 3.
2.4.1 Plan Timelines, Time Horizons, and Coverage
Table 11 can be used to document the update timelines, planning horizons, and geographic or network coverage of an agencyʼs plans. It includes space for plans that many transportation agencies complete, as well as space for additional plans that are optional, newer, or have fewer associated regulations related to uncertainty. These “other” plans may include National Electric Vehicle Infrastructure plans and resilience improvement plans, among others. Please fill in the appropriate information for each plan, indicating the frequency of updates, the date of the last completed update, the date of the next planned update, the time horizon for each plan, and the geographic area or network coverage. These dimensions together provide a picture of actual and potential connectivity between plans.
If Table 11 includes information for more than two or three plans, it may be helpful to visualize each planʼs development period, publication year, and planning horizon on a timeline; an

Long Description.
The column headers are Plans, Update Frequency, Last completed, Next planned, Time Horizon, and Geographic Area or Network Coverage. The data given in the table row-wise are as follows:
Row 1: LRTP: Blank, blank, blank, blank, blank.
Row 2: Freight plan: Blank, blank, blank, blank, blank.
Row 3: MTP: Blank, blank, blank, blank, blank.
Row 4: TAMP: Blank, blank, blank, blank, blank.
Row 5: Transit AMP: Blank, blank, blank, blank, blank.
Row 6: TIP or STIP: Blank, blank, blank, blank, blank.
Row 7: TPM: Blank, blank, blank, blank, blank.
Row 8: CMAQ: Blank, blank, blank, blank, blank.
Row 9: Other: Blank, blank, blank, blank, blank.
example is illustrated in Figure 7. This method can identify where there may be opportunities to coordinate uncertainty considerations across plans that are being developed in tandem or where the outputs of a recently completed plan may inform the development of a subsequent plan.
2.4.2 Common Plan Components Across Uncertainty Types
Table 12 provides a template for filling in specific information about how each plan addresses common plan components in relation to the types of uncertainty described in Table 10. Insert

Long Description.
The timeline chart illustrates the progression of different plans from 2023 to 2033. It includes STIP Update, Long Range Transportation Plan, Rail Plan, Freight Plan, and TAMP. Each plan is represented by colored bars spanning specific years, with some plans overlapping. The STIP Update appears multiple times, indicating periodic updates. The chart provides a visual representation of how these plans are scheduled over the years, highlighting their start and end points. Note: Pink shading represents the plan development period and blue shading represents the plan horizon.

Long Description.
The column headers are Plans, Plan Component, and How Uncertainty is Addressed (Technology and Behavior, Context and Environment, Policy and Regulation, Agency Capabilities). The data given in the table are as follows:
Row 1: LRTP or MTP: Travel Demand Projections; Blank. Funding Forecasts; Blank. Project Cost Estimates; Blank.
Scenario Planning; Blank. Strategy Development; Blank. Target Setting; Blank. Other; Blank. Other; Blank.
Row 2:….: .......: Blank in all columns.
“N/A” or leave blank where not applicable. More rows can be added for additional plan components or plans as needed.
2.4.3 Opportunities for Aligning Plans within the Family of Plans
Table 13 provides a structure for identifying outputs that help to address uncertainty from each plan as well as identifying opportunities to use those outputs as inputs in another plan. Insert “N/A” or leave blank where inapplicable. Use the columns to indicate connections between plans based on their outputs for addressing uncertainty. Note that Project Development is added

Long Description.
The table consists of ten columns and nine rows. Each row represents a specific type of transportation plan, and each column represents a planning document that may produce outputs relevant to uncertainty mitigation.
The column headers from left to right are Plans, What outputs did these plans produce to help with uncertainty, LRTP, Freight Plan, MTP, TAMP, Transit AMP, TIP or STIP, TPM, CMAQ, Other, and Project Development. The row headers from top to bottom are LRTP, Freight Plan, MTP, TAMP, Transit AMP, TIP or STIP, TPM, CMAQ and Other. Each plan is listed in rows, while the outputs are in columns. Not applicable is marked in each space where the same plan meets, for example, the box where LRTP on the x-axis meets LRTP on the y-axis.
as the last column to reflect the fact that plans may directly provide inputs to the project development pipeline.
2.4.4 Example Application of Family of Plans Templates
This section provides an example of how an agency may use the family of plans templates presented earlier, in this case focusing specifically on connections between a long-range transportation plan (LRTP) and transportation asset management plan (TAMP).
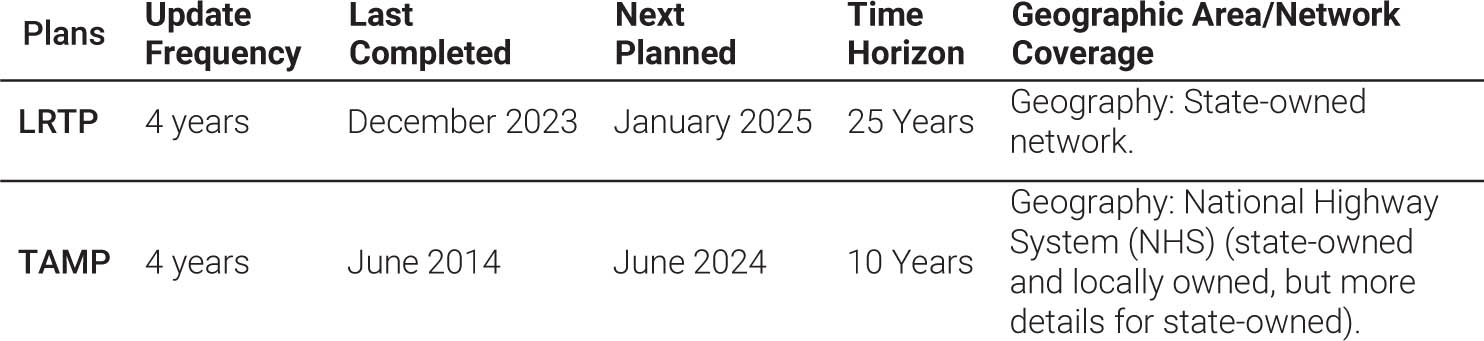
Table 14 shows example entries for the template in Table 11 covering plan timelines, horizons, and coverage.
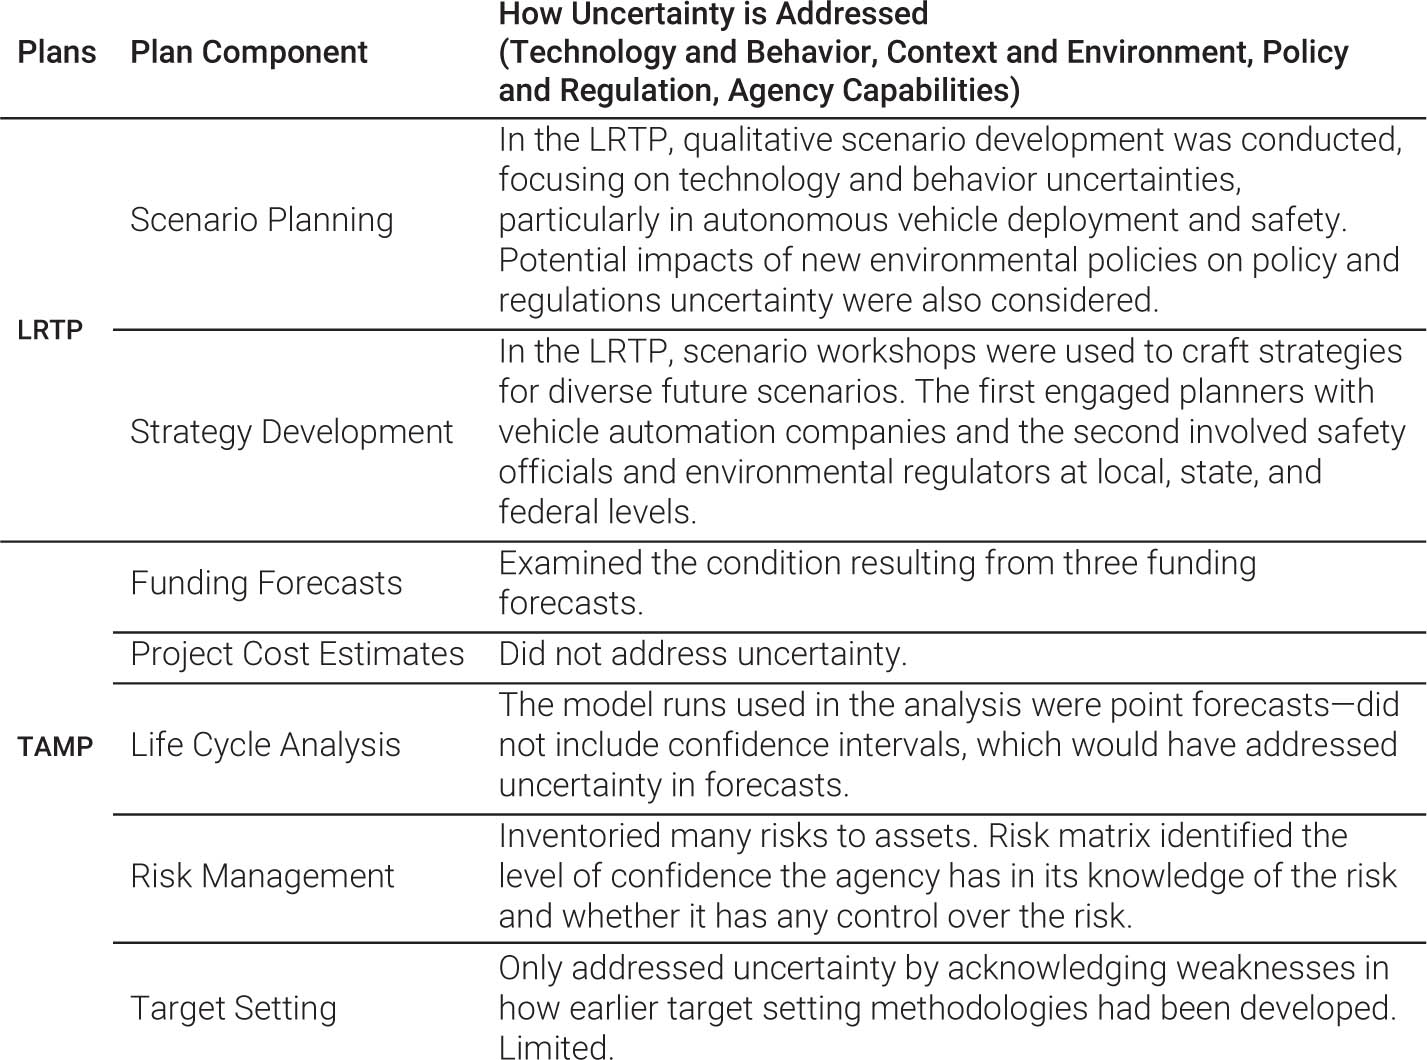
Subsequently, the example agency fills out Table 15 (based on Table 12) to describe how each plan addresses uncertainty. Only applicable lines are shown here.
Finally, Table 16 illustrates how an agency may complete Table 13 on aligning plan outputs. In this example, the agencyʼs LRTP may have produced reports highlighting opportunities and
Long Description.
The column headers are Plans, Update Frequency, Last completed, Next planned, Time Horizon, and Geographic Area or Network Coverage. The data given in the table row-wise are as follows:
Row 1: LRTP: 4 years, December 2023, January 2025, 25 Years, Geography: State-owned network.
Row 2: TAMP: 4 years, June 2014, June 2024, 10 Years, Geography: National Highway System (NHS) (state-owned and locally owned, but more details for state-owned).
Long Description.
The column headers are Plans, Plan Component, and How Uncertainty is Addressed (Technology and Behavior, Context and Environment, Policy and Regulation, Agency Capabilities). The data given in the table rows are as follows:
Row 1: LRTP: Scenario Planning; In the LRTP, qualitative scenario development was conducted, focusing on technology and behavior uncertainties, particularly in autonomous vehicle deployment and safety. Potential impacts of new environmental policies on policy and regulations uncertainty were also considered. Strategy Development; In the LRTP, scenario workshops were used to craft strategies for diverse future scenarios. The first engaged planners with vehicle automation companies and the second involved safety officials and environmental regulators at local, state, and federal levels.
Row 2: TAMP: Funding Forecasts; Examined the condition resulting from three funding forecasts. Project Cost Estimates; Did not address uncertainty. Life Cycle Analysis; The model runs used in the analysis were point forecasts - Did not include confidence intervals, which would have addressed uncertainty in forecasts. Risk Management; Inventoried many risks to assets. Risk matrix identified the level of confidence the agency has in its knowledge of the risk and whether it has any control over the risk. Target Setting; Only addressed uncertainty by acknowledging weaknesses in how earlier target-setting methodologies had been developed. Limited.

Long Description.
The column headers are Plans, What outputs did these plans produce to help with uncertainty?, LRTP, Freight plan, TAMP, Transit AMP, TIP or STIP, TPM, CMAQ, Other, Project development. The data given in the table rows are as follows:
Row 1: LRTP: Workshop report highlights agency opportunities and vulnerabilities in future transportation scenarios.- Released diverse strategy reports for various scenarios in collaboration with partners (MPO, state, federal); blank; Use scenarios in freight plan; Blank, Blank, Blank, Blank, Blank, Implement strategies affecting project development.
Row 2: TAMP: Performance forecasts for three funding levels.- Risk assessment; Blank; Consider risks; blank; Blank; Are program fiscal constraints robust?, Blank, Blank, Blank, Blank.
vulnerabilities in future transportation scenarios. Strategy reports, developed with partners, described responses to manage and respond to uncertainty. Table 16 shows how the agency may then choose to use the same scenarios in the next iteration of their freight plan, this time taking the opportunity to examine the scenarios more closely for their impact on freight. Similarly in this illustration, the agencyʼs TAMP used performance forecasts for three funding levels and risk assessments to help ensure that TIP/STIP fiscal constraints are robust. The identified risks could be carried forward for consideration in the freight plan. The funding level forecasts could also be used to inform the TIP/STIP process.


