Incorporating Uncertainty into Long-Range Transportation Planning: A Guide (2026)
Chapter: 3 Long-Range Plan Development

CHAPTER 3
Long-Range Plan Development
Chapter 3 includes topics that will be of most relevance for actively working on a long-range plan or similar long-term planning activity.
Chapter 3 Components
3.1 Resource Allocation
All transportation agencies have some type of resource allocation process in place to decide how to use their limited resources. While allocation of funding to programs and projects has traditionally relied on single forecasts of need or extrapolation based on current trends, the future is dynamic and uncertain. This chapter, therefore, seeks to aid transportation agencies in identifying points of influence and flexibility in the resource allocation process for making investments that account for uncertainty.
Specifically, this chapter presents a framework through which agencies can integrate an uncertainty “lens” into their existing processes for allocating agency resources. Content in this chapter follows the basic steps of the resource allocation process established in the AASHTO Transportation Asset Management (TAM) Guide and builds upon this work (AASHTO n.d.).
This section guides agencies through the following components, each including an exercise for agencies to consider how uncertainty fits into their resource allocation process(es):
- Review and clarify current approach toward resource allocation.
- Consider uncertainty within each step of the resource allocation process.
3.1.1 Review and Clarify Current Approach to Resource Allocation
Each transportation agency has its own unique approach to resource allocation developed over time to meet the agencyʼs specific needs and context. To incorporate considerations of uncertainty into the resource allocation process, agency staff must first establish an understanding of the existing resource allocation process. While approaches to resource allocation will differ by agency, and perhaps also by specific type of plan, a resource allocation process will likely include the following components:
- Establish goals and objectives for the agency or plan.
- Inventory existing resources, including considerations of each resourceʼs constraints (e.g., a funding resource may have federal, state, or local regulations regarding what purpose it may be used for).
- Identify quantifiable targets through which an agency can measure performance related to the established goals and objectives.
- Develop categories in which to allocate resources (e.g., programs or types of work).
- Prioritize investments within and across categories.
- Analyze expected performance of these investments and compare results to the established performance targets.
- Finalize plans for resource allocation and communicate plans to stakeholders.
Figure 8 depicts the flow of this example approach to resource allocation. Note that the resource allocation process is not strictly linear, but rather each step in the process informs the others and may require revisiting and reevaluating previous steps. For instance, steps 4, 5, and 6 in this example are a cyclical process that involve deciding where to put resources, testing potential projects to estimate their performance, and comparing the results of these projects with target
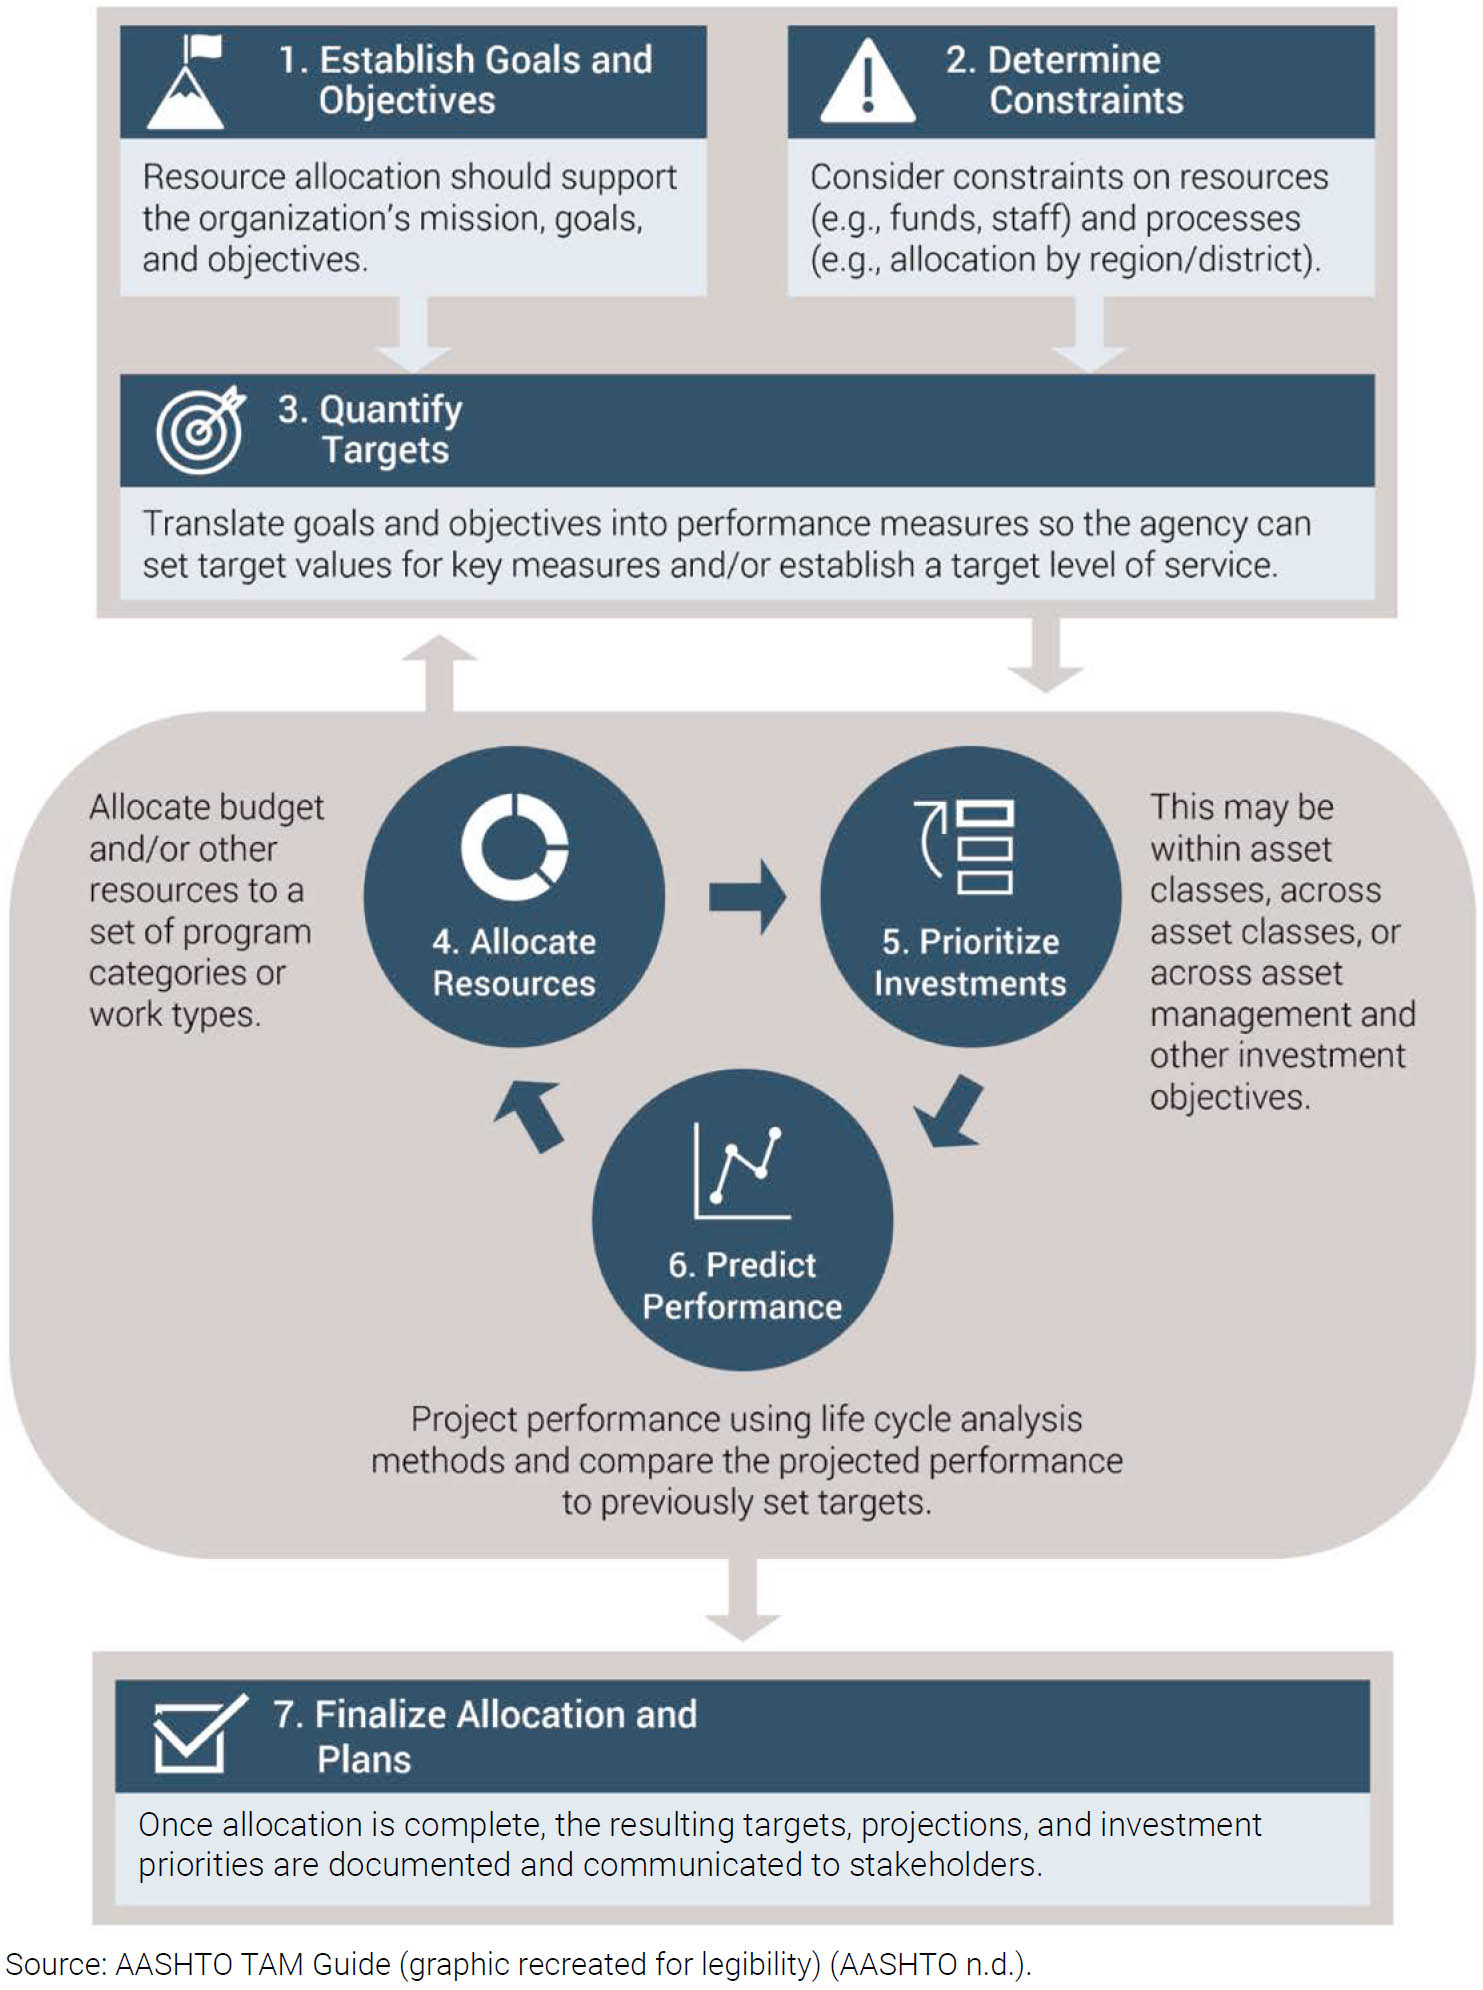
Long Description.
The first step is to Establish Goals and Objectives: Resource allocation should support the organization’s mission, goals, and objectives. The icon depicts a target or flag, symbolizing strategic direction.
The second step is to Determine Constraints: Consider constraints on resources (for example, funds, staff) and processes (allocation by region or district). The icon represents a caution symbol.
The third step is to Quantify Targets: Translate goals and objectives into performance measures so the agency can set target values for key measures and or establish a target level of service. The icon resembles a dart hitting a target.
The fourth step is Allocate Resources: Allocate budget and or other resources to a set of program categories or work types. The icon is a pie chart, representing financial distribution.
The fifth step is Prioritize Investments: This may be within asset classes, across asset classes, or across asset management and other investment objectives. The icon is tiered bars with an arrow pointing to the top tier.
The sixth step is Predict Performance: Project performance using life cycle analysis methods and compare the projected performance to previously set targets. The icon is a line graph with points trending upward.
The seventh step is Finalize Allocation and Plans: Finalize plans for resource allocation and communicate plans to stakeholders. The icon is a checkmark, symbolizing completion. Source: AASHTO TAM Guide (graphic recreated for legibility) (AASHTO n.d.).
performance measures established in step 3. In effect, agencies should monitor performance and readjust targets and priorities on an ongoing basis.
 Resources. For more on developing an approach to resource allocation, please see the AASHTO TAM Guide (AASHTO n.d.) and NCHRP Synthesis 510: Resource Allocation of Available Funding to Programs of Work (Duncan and Schroeckenthaler 2017).
Exercise 1: Write out and Visualize Current Resource Allocation Process(es)
In Exercise 1 of this section, agencies are encouraged to list out or develop a similar visual aid depicting their own approach(es) for resource allocation. As a part of this exercise, the agency should also list out current and future resources that are available to them. The goal of this exercise is to help agencies organize and visualize their current process(es) so that they can begin to identify what parts of their resource allocation process(es) or resources themselves may be sensitive to uncertainty.
To start, an agency should consider the different planning processes it conducts and take an inventory of those that have their own “buckets” of funding, prioritization processes, or criteria. Figure 9 illustrates a general resource allocation framework that may be helpful in considering these different planning processes, while Table 17 provides examples of how an agency may go about inventorying resource allocation processes.
After considering the different planning processes, an agency may begin to organize the components of their process(es) into a visual aid or table, drawing inspiration from Figures 8 and 9. The questions below may help to organize thoughts and ideas during this exercise:
- What plans/programs/processes guide resource allocation for the agency?
- What goals does each process/program address?
- Who is responsible for the process? Who else is involved in analysis or submitting/collecting data?
- What funding is used? Are there constraints on eligibility? Which resources are flexible and can be allocated or reallocated to various programs and projects as needed?

Long Description.
At the top, resources are allocated to multiple programs of work. Each program of work is linked to several projects. Arrows indicate the flow of resources from the programs to the projects. Question marks between programs and projects indicate decision points where project selection or prioritization criteria may be applied. Below the projects, there are comparisons for prioritization and cross-program prioritization, indicating a process for evaluating and prioritizing projects within and across programs. The framework is structured to show the hierarchical distribution and decision-making process in resource management. Source: Adapted from Duncan and Schroeckenthaler 2017.
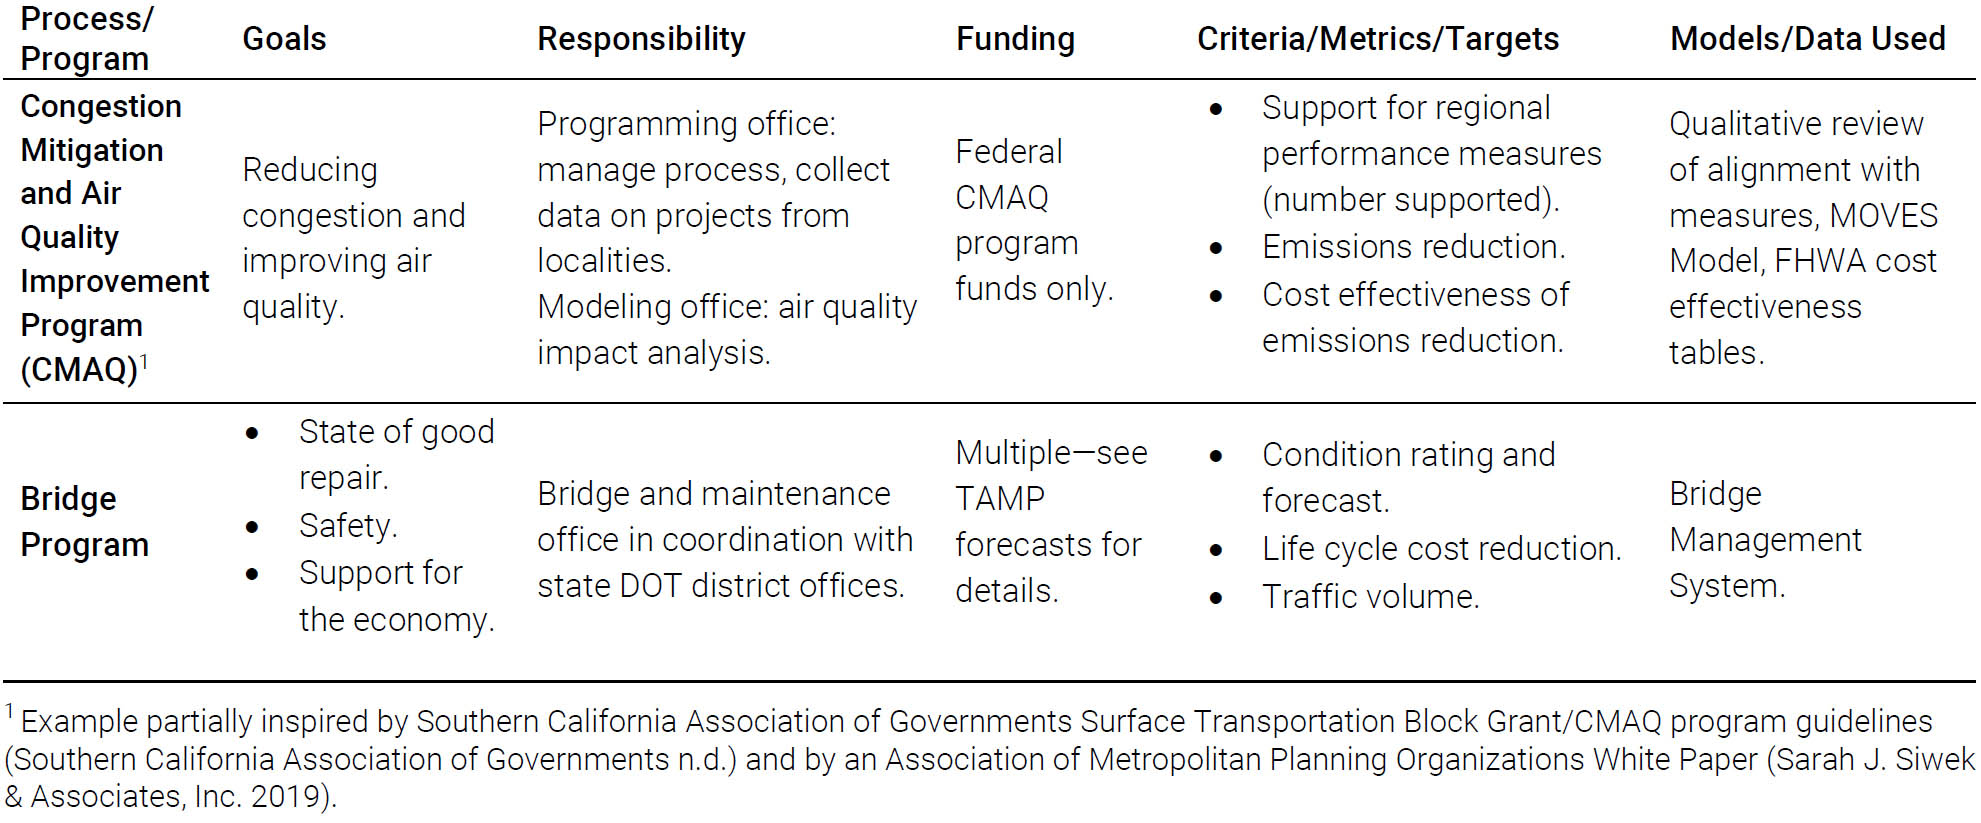
Long Description.
The column headers are Process or Program; Goals; Responsibility; Funding; Criteria, Metrics, or Targets; and Models or Data used. The data given in the table rows are as follows:
Row 1: Congestion Mitigation and Air Quality Improvement Program (CMAQ) note 1: Reducing congestion and improving air quality; Programming office – manage process, collect data on projects from localities. Modeling office – air quality impact analysis; Federal CMAQ program funds only; Support for regional performance measures (number supported), Emissions reduction, Cost effectiveness of emissions reduction; Qualitative review of alignment with measures, MOVES Model, FHWA cost effectiveness tables.
Row 2: Bridge Program: State of good repair, Safety, Support for the economy; Bridge and maintenance office in coordination with State DOT District Offices. Multiple – see TAMP forecasts for details; Condition rating and forecast, Life cycle cost reduction, Traffic volume; Bridge Management System. Note 1: Example partially inspired by Southern California Association of Governments STBG/CMAQ program Guidelines (Southern California Association of Governments no date) and by an Association of Metropolitan Planning Organizations White Paper (Sarah J. Siwek and Associates, Inc. 2019).
- How does the agency quantify alignment with goals and objectives? What criteria, metrics, or targets are used to select projects or set programmatic funding levels?
- What models and data are in use?
3.1.2 Identify How Uncertainty is Considered in the Resource Allocation Process
With an understanding of the agencyʼs current approach to resource allocation, agency staff should now reflect on how uncertainty is considered during, or how it may impact, different steps of the process and the agencyʼs resources themselves.
Exercise 2: Consider Uncertainty in the Resource Allocation Process
Using the agencyʼs resource allocation process(es) defined in Section 3.1.1, integrate questions that consider uncertainty at each step, using the questions presented in Table 18 as a guide. This list of sample questions can be applied to each unique resource allocation process as identified in the previous exercise. When exploring these questions, an agency should consider the types of uncertainty that may impact them (see 2.2 Guided Self-Evaluation and Reflection: Sources of Uncertainty earlier in this guidebook) as well as the plans or programs for which they are seeking to allocate resources. Note that an agency may wish to focus on particular elements of the process (e.g., identifying funding resources or prioritization across projects or programs) or may wish to review a process from start to finish relative to a specific type of uncertainty.
In addition to uncertainty questions that are specific to each step of the resource allocation process (Table 18), the agency should also ask general questions at each step of the resource allocation process, as outlined in Figure 10.
3.2 Forecasting and Needs Estimation
Forecasting and needs estimation models are fundamental building blocks for effective transportation planning. They inform decision-making through predicting future demands on and performance of the transportation system. These metrics are used to identify shortfalls, prioritize resource allocation, and evaluate policy and strategy alternatives. Without

Long Description.
The column headers are Step and Uncertainty Questions. The data given in the table rows are as follows:
Row 1: Goals and Objectives: How may the agency’s goals and objectives change in response to different types of uncertainty?
Row 2: Resources: What current or future funding sources are sensitive to different types of uncertainty? If a given type of uncertainty impacts the availability of funding, are there other resources that remain flexible? What resources may be reallocated in response to different types of uncertainty? How, where, and when should these resources be reallocated? Does the impact of uncertainty on resources require involvement of stakeholders within or outside of the agency?
Row 3: Quantify Targets, note 1: To what types of uncertainty are performance measures and targets sensitive? How does the agency forecast performance? Do or could these methods or tools account for uncertainty?
Row 4: Resource Allocation Categories: How does each existing resource allocation category serve to address and or mitigate the different identified types of uncertainty?
How does each type of uncertainty impact the resource needs for each existing resource allocation category? Would resources need to be allocated differently across categories depending on how the future develops? Will the existing categories used in resource allocation allow for flexibility and responsiveness in the future? Or do categories need to change or be added in response to a given type of uncertainty?
Row 5: Prioritize Investments, note que 2: How could each identified type of uncertainty impact proposed investments? How does each proposed investment address and or mitigate the different identified types of uncertainty? Which proposed investments are most resilient in response to different types of uncertainty?
Row 6: Predict Performance, note que 3: How does a change in expected project performance because of uncertainty affect earlier steps of the project allocation process, such as developing resource allocation categories and prioritizing investments?
Row 7: Finalize Allocation and Plans, note que 4: How resilient are finalized allocation decisions and plans in response to different types of uncertainty? How can agencies communicate this to decision-makers, stakeholders, and the public? Note que 1: See Section 4.2 on tracking trends. Note 2: See Section 4.1 on Prioritization to account for uncertainty. Note 3: See Section 3.2 on forecasting and needs estimation. Note cue 4: See Section 3.4 on the communications playbook.

Long Description.
The first section says, What type of uncertainty is most relevant here? How might it affect the resources available or outcomes of this program? This is visually represented with a magnifying glass and question mark. The second section says, “What level of information is available for considering uncertainty at this step? Is there any process or analysis already in place? This is visually represented with a person analyzing data. The third section says, Who is currently involved in this part of resource allocation? To address uncertainty, should others be engaged? This is visually represented with a hand placing a puzzle piece.
additional considerations for uncertainty, agencies regularly rely on these models for business processes such as:
- Predicting future demand. Transportation systems are designed to accommodate future travel patterns. Forecasting anticipates the volume and characteristics of traffic (people and goods) on the network. This process may include factors like population growth, economic development, and changes in travel behavior.
- Identifying infrastructure shortfalls. By estimating future conditions and needs, transportation engineers and planners can identify areas where existing infrastructure will be insufficient. This allows for proactive measures, such as rehabilitation programs, connectivity improvements, or investments in alternative modes of transportation to mitigate issues such as bottlenecks and air pollution before they arise.
- Evaluating strategy and policy options. Transportation planning often involves evaluating proposed policies or interventions that address needs without infrastructure changes (e.g., congestion pricing, public transit expansion). Forecasting models play a key role in assessing the potential impact of these policies on travel demand, infrastructure requirements, and infrastructure performance.
- Prioritizing investments. Limited resources necessitate strategic allocation of funds. Needs estimation helps direct investments to areas they can have the greatest effect.
Forecasting tools and needs analyses are updated periodically, either within or separately from the long-range planning process. They may be used across a variety of business processes within an agency, including long-range planning, corridor planning, project development, and project evaluation and selection. Because updating these tools and analyses is relatively resource-intensive, there is an efficiency advantage if tools and analyses can be leveraged both within a long-range planning activity and by higher frequency decision processes as well. Addressing uncertainty within forecasting and needs estimation typically adds additional effort, meaning the case for leveraging that effort beyond the long-range plan is even stronger.
For instance, weather risk analysis conducted during a long-range plan or resilience plan could identify routes at risk of flooding. This might motivate further study to assess the resilience of the network to loss of these routes. The most critical links could then be integrated into the project development pipeline for initial environmental and engineering design to identify which at-risk segments are best addressed by improvements to that route or a parallel facility, which segments can best be addressed by recovery strategies, and which have no cost-effective solution today. Without the original risk analysis, these projects would likely not enter the project development pipeline. However, the long-range plan analysis is just the first step and would not provide analysis at a sufficient level of detail to support problem-solving at the corridor- and project-level. The development and application of appropriate forecasting tools can effectively link these two scales of analysis to more effectively help an agency prepare for and manage uncertainty. In this way, long-range planning forecast processes can help influence allocation of other planning resources as well as generate design guidance and other strategies for managing uncertainty.
This section discusses how the forecasting and needs estimation processes interact with uncertainty, including issues that may arise, examples of models (and their key data), and ideas for better integrating considerations for uncertainty into this aspect of long-range planning.
3.2.1 Uncertainty Within Forecasting Models and Their Outputs
Traditional transportation planning often relies on forecasts that assume a relatively predictable future. However, uncertainty is inherent in every aspect of the transportation system and
the communities it serves. The effects of uncertainty on the models can be grouped into three categories: data limitations, assumption errors, and unexpected events.
- Data limitations. All models rely on data, and any uncertainties in that data (e.g., accuracy, completeness) translate into uncertainty in the modelʼs outputs.
- Assumption errors. Models are simplifications of reality. Assumptions made about factors like travel behavior or economic trends introduce errors into forecasts.
- Unexpected events. Unforeseen events (e.g., economic downturns, natural disasters) can disrupt or permanently alter the trends used for forecasting.
If organizations do not account for these effects in some way, they risk making decisions based on inaccurate forecasts, leading to stranded assets or system bottlenecks as well as the erosion of public and organizational trust in planning when forecasts are consistently inaccurate.
In contrast, incorporating uncertainty into long-range planning and its forecasts can result in more realistic planning processes in which decisions become more robust and adaptable to unforeseen changes; risk management improves, enabling proactive mitigation measures to adapt to fluctuating demand; and communication becomes more transparent about the inherent uncertainties in forecasting, which can build public trust and facilitate informed decision-making.
While circumstances dictate modelsʼ capacities to make meaningful predictions, understanding their strengths and weaknesses can contextualize those outputs and allow practitioners to identify more robust solutions. Table 19 describes three types of forecasting models, with deterministic models being the most frequently used in standard planning and engineering work. The table introduces the concept of hurdles when using the models for managing uncertainty as well as strategies to address uncertainty in the models for better decision-making. Hurdles and strategies are addressed in more detail in the sections that follow.
3.2.2 Key Forecasting and Needs Estimation Models, Issues, and Opportunities
This section discusses common forecasting tools, offering a brief description of their function, inputs and outputs, their temporal and spatial granularity (i.e., what level of detail is available), where the tool itself may misrepresent the uncertainty in the modeled phenomena, and strategies for addressing output uncertainty in the context of long-range planning. Travel demand models (TDMs), asset management tools, and budget and revenue forecasts typically are held within transportation agencies; the remaining tools can likely be found through external sources such as other state and federal agencies.
3.2.2.1 TDMs
TDMs forecast future transportation needs by analyzing how people and goods move within a transportation system and consider factors like population growth, infrastructure and service changes, economic development, land use patterns, and technological advancements. Different organizations maintain TDMs with different structures and levels of detail. All MPOs maintain a TDM, but it is not a requirement for state DOTs. For many organizations, this is the primary tool for identifying future capacity needs. TDMs can also support accessibility analysis and in some cases have significant multimodal capabilities in addition to the ability to forecast road network performance. Typical outputs of TDMs include volumes, levels of congestion, and speed on individual network links, as well as forecast travel flows (potentially by mode) described in terms of origins and destinations. These outputs can also be combined with other evaluation

Long Description.
The column headers are: Model Elements, Qualitative Model, Deterministic Model, Probabilistic Model. The data given in the table rows are as follows:
Row 1: Description: This model uses a group of people’s subjective assessments to identify ranges of values across time, space, or different topics; This model generates a single point or line estimate of future outcomes (i.e., what is expected to be the most likely future); This model estimates the probability distribution of an outcome (i.e., a range of predictions that account for uncertainty).
Row 2: Hurdles: Qualitative forecasts acknowledge uncertainty by presenting a range of possible outcomes. However, they may struggle to quantify the likelihood of each scenario, and the subjective nature of qualitative data can introduce bias. Additionally, translating qualitative findings into concrete needs estimates can be challenging; If not used cautiously, deterministic forecasts imply perfect knowledge of the future, neglecting inherent uncertainties. Thus, the biggest hurdle is the tendency to misinterpret deterministic forecasts as certainties; Explicitly quantified levels of uncertainty associated with a forecast provide a more nuanced picture of potential future conditions, but development and interpretation can be statistically complex. Subsequent communication to non-technical audiences can then be challenging without time-consuming educational efforts.
Row 3: Strategies: Using multiple engagement methods and securing input from a range of people with multiple perspectives can mitigate bias. Close collaboration between qualitative researchers and quantitative modelers can facilitate the translation of qualitative insights into quantitative needs estimations; Clear communication of model limitations and the potential for deviations from the predicted outcome can discourage overreliance on point-based forecasts. With significant uncertainty, scenario planning or sensitivity testing using multiple forecasts with varying assumptions can mitigate these issues; Using user-friendly visualization tools can enhance communication of probabilistic forecasts. Collaboration with statisticians and subject matter experts can ensure the proper development and interpretation of these models.
Row 4: Example: A survey of representatives from different divisions within an agency to rate the likelihood and consequences of uncertainty, e.g., “How confident are you that the value is between x and y?”; A travel demand model (TDM) forecast predicting a specific traffic volume on a particular road in 20 years; A forecast that gives a 70 percent chance of traffic exceeding a certain volume on a particular road.
factors to produce additional metrics for planning such as user costs or measures of environmental externalities.
In addition to supporting needs identification, these models help planners understand the potential impacts of different transportation policies and investments by simulating future travel patterns. This information is crucial for making informed decisions about infrastructure development, transportation system operations, and land use planning. In a long-range planning context, TDMs are one tool for evaluating system performance under different investment strategies and may help address the effectiveness of other policy measures. In a Decision-Making under Deep Uncertainty framing, TDMs may also be a mechanism for testing the performance of different specific investment strategies under uncertain exogenous influences (such as land use changes or population changes, which are mostly beyond a transportation agencyʼs control). Relevant attributes, issues, and opportunities of TDMs are as follows:
- Purpose. Simulate future travel patterns and performance based on demographics, travel behavior, land use plans, and transportation network characteristics.
- Variations. Strategic (simplified models for a greater variety of applications), traditional (“four-step” trip-based models), activity- or agent-based (more varied representation of travelers and their choices), and hybrid (balance computational efficiency of traditional models with behavioral detail of agent-based models).
- Inputs. Demographic and land use data, transportation network data, and travel behavior data.
- Outputs. Traffic volumes, travel times, ridership estimates, and other attributes representing transportation performance and cost (e.g., congestion, tolls).
- Granularity. Spatial (relatively small TAZs), temporal (daily, hourly), unit of observation (network links, location pairs, specific or generalized travelers). Note that some strategic models are not spatial.
- Uncertainty vulnerabilities. Models may not be designed “out of the box” to account for the following: unexpected events (e.g., natural disasters, economic downturns, fuel price shocks), new technologies (e.g., electrification, e-commerce, ride-hailing, autonomous vehicles, micromobility), and social/behavioral changes (e.g., remote work, driving levels by cohort). Some models may be adaptable to certain vulnerabilities through changes to input assumptions or through model enhancements. TDMs are also vulnerable because they typically rely on point forecasts for many inputs and parameters.
- Mitigation techniques.
- Decision-making under deep uncertainty (DMDU). DMDU can shift the objective of model applications from predicting the future to testing which futures put at risk a strategyʼs ability to achieve objectives. The DMDU approach emphasizes selecting a planning process that can capture the key variables and their relationships by critically examining goals, available strategies, external forces, and how their relationships are modeled rather than a process focused on precisely identifying the single best solution.
- Strategic modeling. Strategic modeling can complement the functionality of more traditional travel modeling tools by examining variables and relationships that are not easily integrated in those tools. If strategic models capture sources of uncertainty important to the current decision context missing from a traditional model, an agency can decide to invest in adjustments to their TDM or address this uncertainty in a complementary part of the evaluation process.
- Scenario planning. Scenario planning highlights whether needs change significantly in different futures. Scenario planning may be more cost-effective than trying to improve confidence in a single baseline scenario among stakeholders. Organizations can engage stakeholders to qualitatively select a smaller number of scenarios to analyze so that the effort only covers the issues most of concern. Scenarios can also be used to conduct sensitivity testing on specific investments or strategies under different assumptions. If these tests are conducted on multiple alternatives, an organization may be conducting DMDU-based planning without realizing it. In general, scenarios should be tailored to the needs of the policy questions they aim to answer, but they can help TDMs better inform planning under conditions of uncertainty.
- Selecting the right model. Agencies may maintain multiple models for different applications, and they may have varying levels of linkage to one another. The full details of a network-based TDM may not always be required to address relevant policy questions. If a simpler model can answer the question, its lower complexity and run time can allow analysts to explore more permutations of uncertainty, highlighting trends with greater variability versus those that are stable across many scenarios. Conversely, if an analysis requires detailed spatial network performance results or granular user responses and interactions, a TDM with a long run time may be combined with a small number of scenarios selected through stakeholder engagement. These two approaches can even be combined, starting first with a broader exploration of uncertainty and strategy to help narrow focus followed by more detailed analysis. For more about these trade-offs, see Section 3.3: Methods for Analyzing Uncertainty.
- Acquiring additional resources. Today, there are various solutions for scaling computing resources that are much more cost-effective than in the past. Policy questions that require complex models can adjust by leveraging more powerful computers and even running on cloud computing platforms that enable parallel processing.
-
- Leveraging detailed models to construct specialized models. This preserves the behavioral (or other type of) insight needed for nuanced decision-making while removing some of the other complexity that is not beneficial to the question being examined. See Section 3.3.2.4: Exploratory Systems Methods for more information on this approach.
- Regular or reactive updates. These integrate emerging trends and frequently updated data sources and can help agencies determine whether new circumstances are likely to lead to a substantially different future than the one calculated during the initial planning process.
- Inform planning.
- Identify robust needs that are persistent across scenarios and input ranges.
- Identify robust solutions that address needs under many sets of assumptions.
- Evaluate the impact of decisions using ex-post analysis techniques to assess outcomes like the effect of congestion pricing and parking restrictions on travel patterns in locations with high future demand (see Section 4.3.2: Ex-Post Analysis for more information). Ex-post analysis can be used to validate model forecasts or to support future model refinements.
- Integrate findings with land use planning to ensure that infrastructure supports planned development and that areas with existing capacity are prioritized for new development.
3.2.2.2 Asset Management Tools
Asset management tools are software applications designed to help organizations efficiently manage their physical assets, such as roads, bridges, and public transit systems. These tools track the condition, performance, and maintenance needs of assets over their entire life cycle. By leveraging data analytics and predictive modeling, asset management tools enable transportation agencies to make informed decisions about maintenance, rehabilitation, and replacement strategies. These tools help agencies optimize resource allocation, improve asset performance, and extend the lifespan of infrastructure assets. Relevant attributes, issues, and opportunities of asset management tools are as follows:
- Purpose. Track assets and their characteristics; predict deterioration of infrastructure assets and estimate future maintenance needs.
- Inputs. Asset inventory data, historical maintenance/investment records, environmental data, and deterioration behavior.
- Outputs. Maintenance schedules, budget requirements, and asset life cycle estimates.
- Granularity. Spatial (individual assets, network segments) and temporal (yearly, multi-year).
- Uncertainty vulnerabilities. The future environmentʼs impact on deterioration (e.g., weather patterns, new materials, or heavier vehicles) and unforeseen maintenance needs due to natural or human-caused disasters.
- Mitigation techniques.
- Post-processing can be applied to estimate network-level impacts of changes in conditions such as storm frequency or number of daily truck trips.
- Regular inspections and condition assessments can be used to verify model accuracy and any variation associated with uncertainty. If after-action assessments reveal different performance than expected, consider how models can be adjusted.
- Inform planning.
- Prioritize near-term maintenance needs to reach targeted state of good repair.
- Analyze life cycle costs of infrastructure by type and usage to estimate costs for new facility construction and existing facility maintenance under a range of scenarios.
- Summarize network-level needs and project them onto longer time horizons.
3.2.2.3 Budget and Revenue Forecasts
Budget and revenue forecasts estimate future revenue availability to meet transportation needs over a specific timeframe, such as a fiscal year or a multi-year planning horizon. By analyzing
historical data, economic trends, and policy changes, planners can estimate future revenue sources, such as taxes, fees, and grants. Revenue forecasting may be paired with estimates of future project costs, such as capital investments, operating expenses, and debt service. These forecasts help inform decision-making around financial sustainability. Relevant attributes, issues, and opportunities of budget and revenue forecasts are as follows:
- Purpose. Predict future financial resources available for transportation projects.
- Inputs. Historical financial data, economic forecasts, vehicle fleet and behavioral forecasts (less traditionally), and planned projects and costs.
- Outputs. Projected revenue from taxes, fees, fares, and expenditures.
- Granularity. Temporal (monthly, annual, multi-year).
- Uncertainty vulnerabilities. Changes in economic conditions that significantly alter revenue streams and shifts in government policies such as tax increases or infrastructure spending bills.
- Mitigation techniques.
- Stress testing identifies potential shortfalls under various economic or policy scenarios.
- Contingency planning establishes plans to address both shortfalls and unexpected revenue increases.
- Revenue diversification explores alternative funding sources (e.g., public-private-philanthropic partnerships or user fees rather than fuel taxes) to reduce reliance on more volatile or uncertain revenue streams.
- Inform planning.
- Fiscally constrain long-range plans with limits that are resilient across a broad range of futures.
- Include contingencies in long-range plans to account for lesser and greater fund availability from key sources.
3.2.2.4 Environmental Models
Environmental models simulate future environmental conditions by analyzing historical data, physical processes, and the influence of policies and other activities such as development (e.g., vehicle standards or increases in impermeable surface area). By simulating future environmental conditions including temperature, precipitation patterns, and extreme weather events, environmental models can inform transportation plannersʼ evaluations of risk likelihood, facility vulnerabilities, and adaptation strategies. This knowledge is essential for designing resilient transportation systems that can effectively withstand environmental pressure on themselves and their users. Relevant attributes, issues, and opportunities of environmental models are as follows:
- Purpose. Project future environmental conditions (temperature, precipitation, extreme weather events).
- Inputs. Global environmental conditions data, historical weather patterns, and policy or strategy scenarios.
- Outputs. Projected temperature and precipitation, inundation areas, and the probability of extreme weather events.
- Granularity. Spatial (global, regional, local) and temporal (long-term, i.e., decades).
- Uncertainty vulnerabilities. Unexplained phenomena not represented in the model and nonlinear relationships between environmental variables (including policies or interventions) and future environmental conditions.
- Mitigation techniques.
- Scenario planning can identify areas with high variability in future risk or impact versus those that are stable across many scenarios.
- Risk tolerances can be established through surveys of experts or community groups to determine what effect various impacts might have on community behaviors.
- Inform planning.
- Adjust costs in high-risk areas to account for greater maintenance, operational, or recovery expenses over the long term.
- Modify investment and design guidelines in areas that will experience significant impacts from extreme weather.
3.2.2.5 Population Demographic Models
Population demographic models are statistical tools used to project future population trends, including changes in age, gender, race, and ethnicity. These models analyze historical data on births, deaths, and migration to forecast future population growth and distribution. By understanding future population patterns, transportation planners can anticipate changes in travel demand, identify emerging transportation needs, and plan for future infrastructure investments. These models are particularly important for long-range planning, as they can help identify locations of future growth as well as changes in demographics that may alter the nature of transportation needs. Relevant attributes, issues, and opportunities of population demographic models are as follows:
- Purpose. Project future population growth and demographic characteristics (age, income, household size).
- Inputs. Historical population data, birth and death rates, and migration patterns.
- Outputs. Projected population size, age distribution, and spatial distribution of population.
- Granularity. Spatial (national, regional, local) and temporal (long-term, i.e., decades).
- Uncertainty vulnerabilities. Changes in social norms or migration patterns and global events impacting birth or death rates (e.g., wars, pandemics).
- Mitigation techniques.
- Monitor social trends and track relevant metrics to adjust assumptions for other models, allowing for more accurate and regular updates to models.
- Incorporate global factors as moderating forces in trend analysis, highlighting places where forecasts may be unrealistic.
- Create scenarios based on core forecasts for input to additional models when forecasting tools are not easily accessible; this supports consistency with external collaborators who may not include uncertainty in their products.
- Inform planning. Identify locations or groups that could be impacted by population growth or decline, especially those that have been historically disadvantaged, require more public transportation options, or would benefit from improved accessibility.
3.2.2.6 Economic Trend Forecasts
Economic trend forecasts provide insights into future economic conditions, such as industry activity, employment, gross domestic product (GDP), and inflation. These forecasts help planners understand the overall health of the economy and its potential impact on transportation demand. By analyzing indicators such as household income patterns and business investment, planners can identify emerging trends and adjust their transportation plans accordingly. For example, a strong economic forecast may indicate increased travel demand, necessitating greater levels of investment or strategic intervention, whereas expected increases in crude oil costs could reduce short-term demand by spurring more trip chaining. Shifts in regional income profiles may change commuting patterns between different neighborhoods and employment centers, while major new distribution centers could mean more future truck traffic and pavement and bridge deterioration. Relevant attributes, issues, and opportunities of economic trend forecasts are as follows:
- Purpose. Predict future economic growth, industry activity, unemployment rates, and other economic indicators to refine inputs to other models [e.g., macroeconomic vehicle miles traveled (VMT) forecasts, spatially detailed travel models].
- Inputs. Historical economic data, government policies, global economic trends, and trends at larger and smaller scales than the study region.
- Outputs. Projected GDP growth, unemployment rates, income profiles, and employment by sector, which can then inform other models.
- Granularity. Temporal (annual, multi-year) and spatial (national, state, regional, county, municipality, neighborhood, etc.).
- Uncertainty vulnerabilities. “Black swan events” that have major impacts on the economy (e.g., financial crises, technological disruptions) and bring changes to global trade relations and economic interdependence.
- Mitigation techniques.
- Use or develop leading indicators to detect potential changes in economic metrics before they occur.
- Scenario planning can allow for exploration of how global factors may redirect the trajectory or composition of economic growth for a given location.
- Inform planning.
- Consider differences in transportation requirements by industry to understand how shifts in the economy might affect transportation demand, particularly by mode or time of day.
- Use or develop lagging indicators to retroactively evaluate whether resource allocations impacted other trends and phenomena (e.g., revenue, travel demand) and to identify areas that will need greater investment in the near future to meet rising demand or better support socioeconomic systems. This complements the use of leading economic metrics used for needs analysis to validate the expected relationships.
- Prioritize investments that support economic growth or resilience such as those that reduce commute lengths or better connect key economic centers.
3.2.2.7 Housing Supply and Real Estate Development Projections
Housing supply and real estate development projections leverage factors such as current building characteristics, allowable building characteristics, and trends in development, economic growth, and demographic changes to forecast construction and occupancy. These projections help planners understand the potential impact of new developments on transportation infrastructure and service needs. This information is crucial for making informed decisions about the provision of roads, public transit, and other transportation facilities. Projections of building supply and land use may offer more refined inputs for the planning process than direct population and employment forecasts because they provide better information about how households and jobs may be distributed under legal, physical, and economic constraints. Relevant attributes, issues, and opportunities of housing supply and real estate development projections are as follows:
- Purpose. Forecast future availability of housing units in different categories (single-family, multi-family) and industrial or commercial space using market and regulatory factors at greater spatial detail than traditional population forecasting, thereby allowing for more effective allocation of transportation capacity.
- Inputs. Economic forecasts, demographic data, land use regulations, and construction costs.
- Outputs. Projected number of housing units by type, spatial distribution of new housing, projected commercial and industrial space, and occupancy.
- Granularity. Spatial (regional, local: community, local: parcel) and temporal (medium-term: 10–20 years).
- Uncertainty vulnerabilities. Regulatory changes spread across a wide range of entities, changes in resource availability impacting construction costs, and changes in industry requirements or household preferences for space.
- Mitigation techniques.
- Coordinate with local governments to maintain accurate information on zoning and track proposed changes to land use policies to achieve growth and development objectives.
- Monitor real estate development trends to identify changes in costs or preferences.
- Inform planning.
- Coordinate with land use and housing agencies to appropriately co-locate increases in housing and transportation capacity. Coordinate on changes to existing policies that might be required to achieve mutually supportive land use and transportation.
- Promote sustainable transportation investments such as public transit and walking and biking facilities near areas with high growth projections.
- Connect employment and housing locations with multiple modes to provide opportunities for businesses and workers.
3.2.3 Hurdles and Strategies Related to Granularity
Transportation planning efforts often have a long-range time horizon (20–30 years). Some forecasting tools are specifically designed to answer traditional long-range planning questions at this timescale. To manage uncertainty, many of those models are being leveraged to answer new questions. Additionally, there are other forecast models designed to operate at finer temporal or spatial scales (e.g., daily traffic volumes, annual pavement maintenance cost, or quarterly expenditures) that could also be leveraged to address uncertainty. Finally, there is a growing desire to use long-range models and planning outputs to help manage uncertainty in shorter-term business processes.
Many of the tools introduced in the previous section are excellent at supporting their core functions. They were designed with specific levels of granularity (detail) to support the effective use of planning resources in answering policy questions for which they were designed. However, when combining data from various models, or when seeking to use existing models in new ways, differences in granularity can create challenges that need to be managed to improve planning outcomes.
The hurdles and strategies that follow are in relation to specific technical activities within planning and implementation. They could arise or be applied in a broad range of planning documents and processes but may be most helpful to consider when scoping plan activities or investing in modeling capabilities that will support multiple plan and implementation business processes.
3.2.3.1 Hurdles
The following technical hurdles may affect planning for uncertainty:
- Long-term trends are not considered in many tools. Models designed for short-term forecasting or detailed analysis rely on calibration to current conditions and may not include the long-term effects of social, economic, behavioral, or technological changes that can significantly impact transportation demand over decades.
- Limited ability to capture significant changes from current conditions. Models may be carefully calibrated to match current conditions but may provide unstable forecasts when future conditions or alternative scenarios deviate substantially from those conditions.
- Data availability at coarser scales. Detailed data (e.g., traffic volume for lower-tier facilities) may not be modeled in the tools usually used for long-range planning horizons. Modeling or aggregating data to coarser scales can mask important trends, patterns, and variations (for instance, not capturing local streetsʼ ability to take some of the volume off highly congested facilities or otherwise provide resilience in the network).
- Computational complexity. Highly granular models can be computationally expensive to run. This can limit the number of iterations and scenario explorations possible within a planning effortʼs time frame.
3.2.3.2 Strategies
Strategies that can be used to manage or mitigate technical hurdles include:
- Broad scenario development. Focus scenario planning on developing a set of scenarios that cover a broad spectrum of possible futures based on input from a range of subject matter
- experts for long-term trends (e.g., economic forecasts, demographic shifts) that can provide a foundation for modeling uncertainty with a variety of tools. Clear, coherent scenarios will allow analysts to identify the risks that should be tested in other processes (e.g., project selection and programming), allowing them to make methodological decisions appropriate for their application.
- Example application: Project impact evaluations assessed under three futures from an LRTP or Resilience Improvement Plan regardless of whether they use microsimulation, TDMs, or engineering calculations.
- Bridging scales through hierarchical modeling. Utilize a multiple-stage modeling approach. First, develop a long-range, coarse-grained model to capture broad trends. Then, use the outputs from this model to inform a finer-grained model with spatial, temporal, or other complexity simplifications for specific areas or infrastructure projects.
- Example application: Applying floodplain modeling techniques to assess project alternativesʼ environmental impacts; corridor planning using detailed simulations with traffic levels from different macroscopic scenarios.
- Estimating meta-models or other imputation techniques. Conduct exploratory scenario modeling for a sample of uncertain conditions using a more complex model and impute the system behavior for additional potential sets of conditions to construct a purpose-specific model for testing specific strategies without needing to complete core model runs.
- Example application: Identify key variables influencing the success of different strategies in a long-range planning context or test alternatives for robustness during project development or corridor planning.
- Statistical upscaling or downscaling techniques. Explore statistical methods to upscale fine-grained data to coarser scales or downscale coarse-grained data to provide more detail when needed. These techniques should be applied with caution and a clear understanding of their limitations.
- Example application: Estimating hourly traffic volumes on a facility with very few or no count stations based on nearby facilities with more data.
- Focus on indicators over precise values. In long-range planning, focusing on directional changes (e.g., increase or decrease) in key indicators (e.g., travel time, ridership) may be more informative than attempting to achieve pinpoint accuracy in absolute values.
- Example application: Conducting larger transit rider surveys with fewer questions rather than highly detailed questionnaires that people may be less likely to answer.
- Continuous monitoring and update. Recognize that forecasts, regardless of granularity, are not static. Regularly monitor actual data and trends and update forecasts as needed to ensure long-range plans remain relevant.
- Example application: Regularly gather information on bike ridership to see how weather and seasonal variation impact volumes.
3.2.4 Hurdles and Strategies Related to Organizational Structure
Because expertise and resources are often spread across multiple facets of an organization and its partners, collating forecasts for long-range planning requires substantial coordination.
3.2.4.1 Hurdles
While forecast models offer valuable insights for long-range transportation planning, integrating them effectively can be hindered by several organizational hurdles:
- Siloed data and expertise. Data relevant to forecasting (e.g., demographics, traffic data) may reside in different departments within an organization, hindering access to, collaboration on, or even knowledge of the most comprehensive or relevant datasets.
- Limited long-range planning culture. Some organizations may have a culture focused on short-term system management rather than addressing the uncertainties inherent in long-range planning.
- Organizational inertia. Existing planning processes and decision-making structures may be resistant to the incorporation of new tools like forecast models, especially if they require significant changes in workflow.
- Resource constraints. Implementing and maintaining sophisticated forecasting models can require significant resources (such as staff expertise or software licenses) that may be limited within an organization. If staff or leadership do not see the value in incorporating uncertainty, they may be reticent to devoting resources.
State DOTs and Organizational Complexity
Due to their multi-faceted mission and responsibilities, state DOTs often have numerous divisions and bureaus, each with their own data systems and expertise.
While systems and processes were initially built up to effectively meet organizational challenges, attempts to address shifts in mission and technology over the last 50 years can result in duplicated effort, data inconsistencies, and neglected activities.
The strategies described have been observed among agencies that have identified these challenges and taken steps such as establishing a committee on data governance or scheduling joint meetings between disparate working groups to share insights that help tackle these challenges from the ground up.
3.2.4.2 Strategies
A range of strategies can be used to address organizational hurdles and better manage uncertainty:
- Data governance and sharing. Establish clear data governance policies that promote data sharing across departments. Develop data repositories and platforms that facilitate easy access to relevant datasets for forecasting purposes while protecting sensitive information and data ownership.
- Example application: States have established C-suite data officers and centralized data management, which helps with both security and compliance as well as trying to streamline development of related datasets.
- Phased implementation. Introduce forecast models gradually, starting with pilot projects or specific planning areas. This helps build comfort and demonstrates the value of these tools before wider adoption.
- Example application: A state first developed a new pavement forecasting application for 5-year project identification. This applicationʼs forecasts were then extended to 10 years for TAMP development. For their most recent long-range plan, an existing long-range forecasting tool was used, but for subsequent scenario analysis and legislative communications needs their new model has been extended to 20 years.
- Collaboration and capacity building. Develop partnerships with universities, research institutions, or private firms with expertise in forecasting. Invest in training and capacity-building programs to equip staff with the skills needed to use forecasting tools effectively.
- Example application: States have established formal organizations or competitive calls for project processes with local academic institutions that allow both sides to generate ideas for research to solve current issues.
- Cost-effective solutions. Explore open-source software or cloud-based platforms that offer forecasting capabilities without requiring significant upfront investments. Additionally, consider collaborating with other organizations to share resources and costs.
- Example application: States may participate in government-wide revenue forecasting processes rather than running their own dedicated process.
- Transparently communicate uncertainty. Communicate the limitations and uncertainties associated with forecasts to manage expectations and build trust in the planning process. Develop clear communication strategies to effectively present forecasts to stakeholders at different technical levels.
- Example application: Revenue forecasts may include cones of uncertainty, or VMT forecasts may be presented as ranges rather than point estimates in publications.
3.2.5 Other Hurdles in Quantifying the Impact of Uncertainty
Quantifying the impact of uncertainty on transportation planning is crucial for making robust decisions. Additional general hurdles to be aware of in forecasting are outlined in the following (each hurdle is accompanied by a strategy for managing the challenge):
- Overlooking correlated variables. Simulating uncertainties independently neglects their potential covariance structure (how they influence each other).
- Strategy: Conduct analysis for sets of variables, even if they are not individually correlated to the dependent variable.
- Difficulty integrating complex relationships. Complex relationships may exist between uncertainties and model outputs, making it challenging to accurately quantify their impact.
- Strategy: Communicate a range of possibilities and levels of certainty with results.
- Managing model complexity. Detailed risk analysis or forecasting techniques (e.g., Monte Carlo) can be computationally expensive, especially for complex models.
- Strategy: Keep models simple at the beginning of analyses to answer high-level questions first, guiding later efforts toward areas of greatest interest or need.
- Balancing precision and practicality. It is essential to strike a balance between achieving high precision in uncertainty quantification and the practical limitations of time and resources. More precise estimates may not be more accurate.
- Strategy: Include decision-makers early on to gather qualitative feedback on their desired insights and the appropriate balance of given available resources.
- Uncertainty propagation. Understanding how uncertainties in model inputs translate to uncertainties in outputs requires careful analysis.
- Strategy: Use elasticity calculations across the range of inputs to see their impacts on the range of outputs.
- Transferring calibrated values to inappropriate contexts. Transferring pre-calibrated relationships (e.g., elasticity values) from other studies may not be directly applicable to new contexts.
- Strategy: Reach out to subject matter experts to discuss relationships between models or contexts.
- Defining the desired level of output precision. The level of precision needed for decision-making varies. Focusing on directionality (increase/decrease) or relative importance may be sufficient in some cases.
- Strategy: Coordinate early with leadership and decision-makers on what they need to do their job effectively.
- Defining risk tolerance to support risk management. Establishing risk tolerance levels based on a risk matrix or decision tree helps determine appropriate mitigation strategies.
- Strategy: Bring together analysts and decision-makers to provide qualitative input on tolerance levels.
- Balancing benefits and regrets. Risk strategies should consider the expected benefits of different approaches and potential regrets associated with choosing the wrong approach.
- Strategy: Set contingencies based on unlikely but high-impact events and gather feedback on the resulting impacts.
3.2.5.1 General Strategies
In addition to the hurdle-specific strategies presented above, the following more general approaches can be used to better address uncertainty in modeling:
- Combining tools. Start with sensitivity analysis to identify key uncertainties, then use more sophisticated techniques for in-depth exploration.
- Simulating correlated variables. Employ statistical copulas or other methods to account for dependencies between uncertainties during simulations.
- Targeted simulations. If full simulations are computationally expensive, consider running simulations for a subset of scenarios and using interpolation/extrapolation to estimate results for others.
- Focus on practical applications. Tailor the level of precision in uncertainty quantification to the specific needs of the project.
See the next section for more methods for analyzing uncertainty, including analytical strategies and classes of methods in which these forecasting and needs estimation tools can be leveraged.
3.3 Methods for Analyzing Uncertainty
This section presents two overlapping concepts regarding ways to analyze uncertainty:
- Analytical strategies: general frameworks for probing uncertainty. These strategies can help frame analytical questions and provide structure within which to deploy specific methods.
- Classes of methods (along with example methods): specific approaches for leveraging tools or processes to understand uncertainty.
Multiple methods can be associated with a strategy, and multiple strategies may be involved in carrying out a method.
Different methods and strategies can help to address different issues related to uncertainty. For example, sensitivity analysis might focus on identifying how sensitive a system is to a specific variable. However, if there are relationships between variables, then analysts might want to pair sensitivity analysis with root-cause analysis to understand what the driving factor behind system outcomes is. Discrete scenario methods may allow more depth of exploration by constraining the number of scenarios considered, but they may lose the breadth of insight offered by exploratory systems methods that look at a broader range of possibilities.
It is important for planners and decision-makers to understand both their goals and their resource constraints to guide the selection of appropriate methods and tools. Technical and resource requirements to consider include the following:
- Technical knowledge for using the method or tool.
- Required participants and stakeholder engagement.
- Required data inputs.
- Staff capacity (e.g., time/person-hours).
Making this determination will likely require input from multiple staff and potentially representatives of multiple divisions within a transportation agency. It is suggested to first articulate what type of question needs to be answered about uncertainty. This may point to an analytical
strategy. From there, review available methods and investigate the complexity of analysis that is achievable given resource constraints while yielding desired end results.
There is a worksheet provided at the end of the section that can help structure pre-work and discussion.
3.3.1 Analytical Strategies
Planners and decision-makers may assess uncertainty and its potential effects through a variety of common analytical strategies. Each of these strategies can be used to explore possible futures and their implications for performance measures, conditions, or forecasts that are meaningful to transportation planners:
Hypothesis testing. Hypothesis testing involves evaluating premises regarding how a system functions or how the future will unfold. The results of hypothesis testing may reveal which systems and variables contribute the most to uncertainty and should be investigated in greater detail. Because transportation strategies typically involve investing considerable resources over a long period of time (i.e., building infrastructure), hypothesis testing is often undertaken through the use of a range of forecasting tools, like those outlined in Section 3.2: Forecasting and Needs Estimation, rather than through real-world experimentation.
Sensitivity analysis. Sensitivity analysis involves examining the range of impacts that a variation in a variable can have on a predicted outcome. This is especially useful for identifying risks where changes in modeling assumptions (e.g., faster than expected deterioration of assets related to usage, precipitation, or temperature; lower than expected funding) can have major implications on resulting performance or when inputs into a model are difficult to precisely estimate, increasing the uncertainty in model outputs. Sensitivity analysis gives insight into the scale and directionality of impact that a given input assumption has on outcomes so that planners and modelers can better diagnose its relative importance.
Root-cause analysis. Root-cause analysis is the process of identifying the source of failure or undesirable outcomes. It may play a role in managing uncertainty by helping to identify which uncertain factors have the most significant impact on outcomes so that agencies can focus on addressing them. Root-cause analysis can also include techniques such as factor correlation analysis to understand how variables relate to each other and to help identify which are truly the most influential.
Trade-off analysis. Trade-off analysis examines the relative utility of different outcomes. This analysis has a wide range of applications within planning and evaluation practice. One might compare the trade-offs among different performance areas under different adaptation strategies, investment plans, or forecast future conditions. For example, an agency might use trade-off analysis to examine how shifting money from bridge to pavement preservation within a fixed budget will reduce achievement of bridge performance goals, and if the improved condition allowed by this reallocation justifies the bridge performance loss. Similarly, in development of specific project alternatives, designers might offer one option that is significantly safer but that has lower throughput or higher costs.
Life cycle analysis. Life cycle analysis considers the full scope of production, use, and disengagement of products and materials when making decisions about the costs, environmental impacts, and related risks of a proposed action. Compared to many traditional analysis techniques, life cycle analysis extends the temporal window for costs and benefits of decisions and may identify uncertainties to manage that would typically be overlooked in decision-making processes. Within transportation planning, life cycle analysis is most commonly used for asset management to guide the timing and type of investments in asset preservation.
System dynamics. System dynamics helps planners recognize and document the complex, dynamic, and uncertain situations they manage as well as the forces that drive their futures. This analysis often uses descriptive causal diagramming (a method detailed in the following section) and applies quantitative methods to links identified during causal diagramming exercises to simulate the system. System dynamics can help explore potential outcomes, quantify a range of scenarios, or run sensitivity analyses on particular parameters. System dynamics aids analysts in expanding the range of relationships covered in planning to avoid being surprised by unintended consequences of decision-making. For example, one might use system dynamics to trace and improve understanding of land use and transportation interactions.
DMDU. DMDU is a collection of methods and tools that planners can use to migrate away from a “predict-then-act” framework. Instead of first identifying a single future and designing solutions to that futureʼs problem, DMDU suggests first identifying potential courses of action and exploring how they meet an organizationʼs goals under uncertain conditions. This strategy may use the same tools of traditional planning but may employ them in a different order or in a different manner. By reframing the decision-making process to engage with a broader range of potential strategies and center the work on “stress testing” them under uncertain futures, this approach can help identify robust strategies. This approach can also reveal trends to monitor and potential tipping points at which a new course of action would better support goal achievement.
DMDU often refers to an XLRM framework where:
- X = External Conditions largely beyond an organizationʼs control; this category captures uncertainties about the future.
- L = Policy Levers that an organization can employ; these potential actions include policies, plans, and projects.
- R = Relationships that can capture how combinations of external conditions and policy levers lead to outcomes; these relationships also can be uncertain.
- M = Performance Measures that describe system outcomes; these measures usually are stated in terms of target levels that describe an organizationʼs objectives.
While all four of these components also exist in traditional “predict-then-act” planning, DMDU examines them and their relationships more critically. Another acronym used in this realm to refer to the same components is X-PRO: External Factors, Policy Options, Response Functions, and Objectives.
Resource. FHWA published Transportation Planning for Uncertain Times: A Practical Guide to Decision Making Under Deep Uncertainty for MPOs in 2022 (Lempert et al. 2022). This publication documents examples of applying DMDU to organizations including:
• Sacramento Council of Governments (MPO),
• TransLink (Vancouver transit operator),
- City of Los Angeles (water quality example), and
- Culver City (neighborhood planning for mobility and development).
Building on these examples, the report provides insights on how and why to reframe the planning process using DMDU. While the explicit target audience is MPOs, the guide is also relevant to state DOTs.
3.3.2 Classes of Methods
Methods and tools that are used for uncertainty analysis range in complexity, required technical resources, and required data inputs. To organize these methods, Table 20 categorizes them in a range of classes that increase by minimum required technical resources.
The following sections provide examples of applicable methods and tools under each class.
3.3.2.1 Descriptive Methods
With descriptive methods, planners and decision-makers qualitatively describe systems, variables, and linkages. They map out their premises or theories about how the future will unfold. These exercises can be useful as a stand-alone approach for uncovering linkages and influential drivers on unknown future outcomes, or they can be used as bases for pursuing more detailed analyses under the more resource-intensive classes of methods discussed below. Useful approaches within this class of methods include:
- Workshops. Workshops may involve internal and external stakeholders to ensure that planners and decision-makers consider all relevant viewpoints and benefit from specific areas of expertise or experience. Interactions between participants may reveal additional information about the system that none of the stakeholders initially considered.
- Delphi method. The Delphi method involves a panel of experts that submits anonymous opinions to a facilitator who compiles the information and presents it to the panel. The panel members then revise their opinions based on this information and resubmit them to the facilitator. This creates an iterative process that intends to achieve consensus among experts in the field.
- Descriptive causal diagramming. Descriptive causal diagramming involves mapping directional connections and positive or negative feedback relationships among different variables in a system. This helps to identify process flows, drivers of uncertainty, critical decision points, and variables, including those that may be outside the traditional scope of analysis.

Long Description.
The column headers are Class, Description. The data given in the table rows are as follows:
Row 1: Descriptive Methods: Identify risk perceptions and establish relationships that may create, propagate, or mitigate risk. This class employs qualitative approaches, such as workshops, the Delphi method, and causal diagramming.
Row 2: Single Metric Focused Methods: Document the relative uncertainty associated with specific variables of interest. These methods may be used to evaluate and prioritize sources of uncertainty for subsequent actions. Generally, these approaches do not seek to link sources together within complex systems to assess interactions. Methods used within this class may range from qualitative descriptions of linkages to quantitative regression modeling.
Row 3: Discrete Scenario Methods: Identify any number of plausible scenarios (i.e., having internally consistent and physically possible parameter values) to identify and compare outcomes. Discrete scenario analysis places greater emphasis on the effort required to develop coherent scenarios, while bounding technical modeling efforts if employed.
Row 4: Exploratory Systems Methods: Produce a wide range of scenario results without restricting variable values to identify the range of possible outcomes or variables with the greatest impacts on the system. Doing so removes bias in selecting a limited number of parameters and allows for exploration of individual sources of uncertainty in relationship to the whole. This typically requires quantitative tools for producing a large range of results and then a comparison and analysis of these results. Using Monte Carlo Simulation would be one example of this.
- Specific mapped connections may subsequently be analyzed with greater complexity using any relevant tool (discussed under the classes of more complex methods). Figure 11 shows an example of a basic causal diagram examining adoption of autonomous vehicles.
3.3.2.2 Single-Metric Focused Methods
In this class of methods, documenting uncertainty or risk around a specific variable or source is emphasized over more complex system interactions. This does not mean that analysis is not rigorous; rather, the focus is on measurement or presentation of a metric using data identified specifically for the analysis over more generalized models. As with any class of method, this can be conducted with qualitative analysis, such as writing descriptions of these linkages to identify unknown impacts. Under this class, however, planners and decision-makers may also use quantitative methods, such as regression modeling of any number of variables, to evaluate linkages and sources of uncertainty.
This method differs from discrete scenario or exploratory systems methods in that it is primarily a matter of recording values rather than constructing models and systems for testing strategies. Single-metric methods are used to state system conditions and can make uncertainty visible but are less likely to consider solutions. These methods may suggest emphasis areas for strategy identification, monitoring, or additional data collection. However, this process may use similar tools to develop metrics as are used in discrete scenario and exploratory systems methods; this may include many of the forecasting tools discussed in the previous section (3.2: Forecasting and Needs Estimation), such as TDMs.
To reduce the complexity of this analysis and provide insight on the most impactful variables, it is important to identify the variables that are likely most critical to the functioning of the system and have the greatest uncertainty. Vulnerability and criticality screenings and risk registers and inventories can help with this task:
- Vulnerability and criticality screenings. Vulnerability and criticality screenings involve scoring variables based on relative criticality to the system, with the goal of identifying the
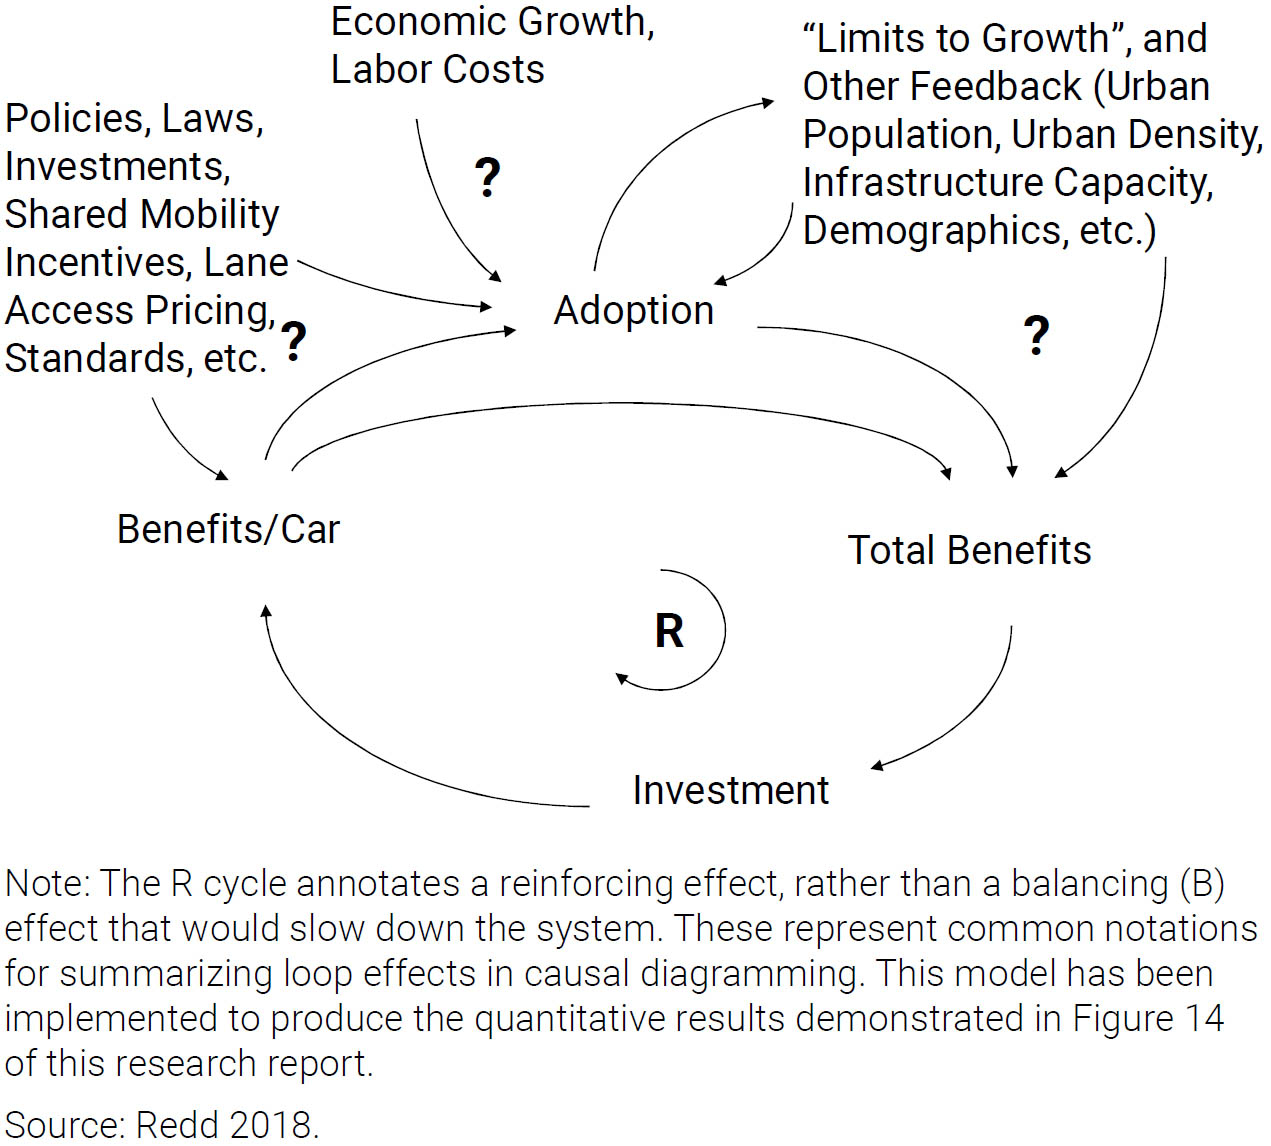
Long Description.
The diagram depicts various factors influencing the adoption of autonomous vehicles. Arrows indicate interactions between elements such as policies, laws, investments, shared mobility incentives, Lane Access pricing, standards, etc. Economic growth and labor costs are shown as influencing factors. The diagram also includes feedback loops labeled ‘Limits to Growth’ and other feedback (Urban population, Urban density, Infrastructure Capacity, Demographics, etc.). Benefits by car and total benefits are connected to adoption, with investment playing a role in the cycle. The diagram highlights complex interdependencies in the adoption process, with the letter r surrounded by an arrow in the middle of the diagram. Underneath the figure, there is a note: The R cycle annotates a reinforcing effect, rather than a balancing (B) effect that would slow down the system. These represent common notations for summarizing loop effects in causal diagramming. This model has been implemented to produce the quantitative results demonstrated in Figure 14 of this research report.
Source: Redd 2018.
- variables that are most critical to the system. The self-assessment presented in Chapter 2 of the guidebook is a high-level version of this (see Section 2.2: Guided Self-Evaluation and Reflection: Sources of Uncertainty).
- Risk registers and inventories. Risk registers involve characterizing the relative likelihood and impacts of risks associated with variables, identifying the variables that involve the greatest uncertainty or present the greatest consequence.
Table 21 presents an example of a risk register documenting three environmental risks. The register allows the user to document the amount of at-risk infrastructure and level of risk to inform prioritization of infrastructure improvements. The register can also be used to monitor change over time and might be updated at intervals. For example, as mitigation projects are completed, certain facilities can be removed from the inventory of affected miles and estimations of mitigation costs. Costs of recovery might be updated based on observed experience. Forecasts of storm frequency or flooding can also be adjusted over time.
- Descriptive statistics. Descriptive statistics may involve charts, graphs, tables, and other figures to present clear characteristics on any number of variables and their relationships. This could be as simple as presenting frequencies, averages, and standard deviations.
- Regression modeling. Regression modeling estimates relationships between a dependent variable and any number of independent variables. It varies in complexity depending on the number of variables included in the model and the mathematical models used. With high-quality datasets and a limited number of variables, linear regression modeling can be a relatively simple process.
- Info-gap theory. The info-gap theory uses models to consider how options perform as a function of uncertainty of a specific variable. Notably, info-gap theory does not require probabilistic risk quantification of the variable as there is no statement of what the degree of risk is or how likely it is. The core decision criterion in info-gap theory is what outcomes are acceptable, rather than what outcomes are predicted in different conditions. The output of info-gap theory is usually in the form of a graph similar to Figure 12. This graph allows the decision-makers to see what level of performance (the x-axis) can be achieved by different options (Design 1 and Design 2) as a function of uncertainty (on the y-axis), highlighting trade-offs, risks, and vulnerabilities of each option. At different levels of required outputs, different options may be the most robust and therefore preferred. The x-intercept represents the performance of each design as estimated by traditional forecasting tools. Design 1 is estimated to perform better; however, it is much less robust. The level of performance forecast for Design 1 may exceed the actual needs of the project. Therefore, Design 2 may “satisfice” while providing additional robustness.
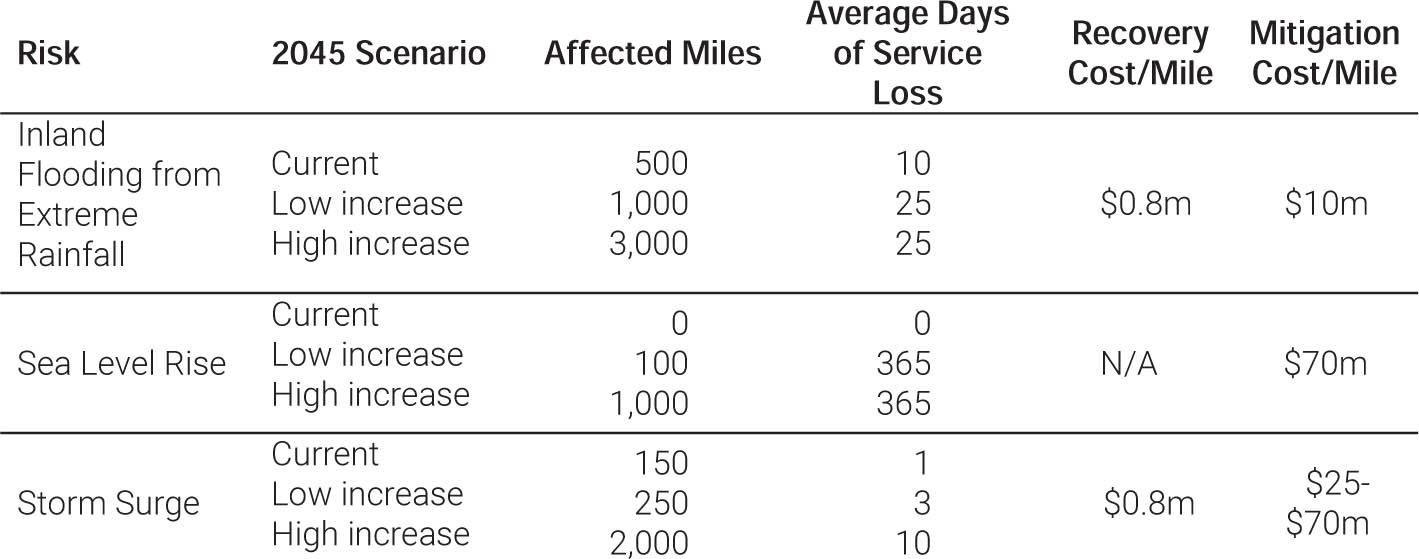
Long Description.
The column headers are Risk, 2045 Scenario, Affected Miles, Average Days of Service Loss, Recovery Cost per Mile, and Mitigation Cost per Mile. The data given in the table rows are as follows:
Row 1: Inland Flooding from Extreme Rainfall; current, low increase, high increase; 500,1,000,3,000; 10,25,25; 0.8 million dollars; 10 million dollars.
Row 2: Sea Level Rise; Current, Low Increase, High Increase; 0,100,1,000; 0, 365, 365; Not applicable; 70 million dollars.
Row 3: Storm Surge: Current, Low Increase, High Increase; 150, 250, 2,000; 1, 3, 10; 0.8 million dollars; 25 to 70 million dollars.
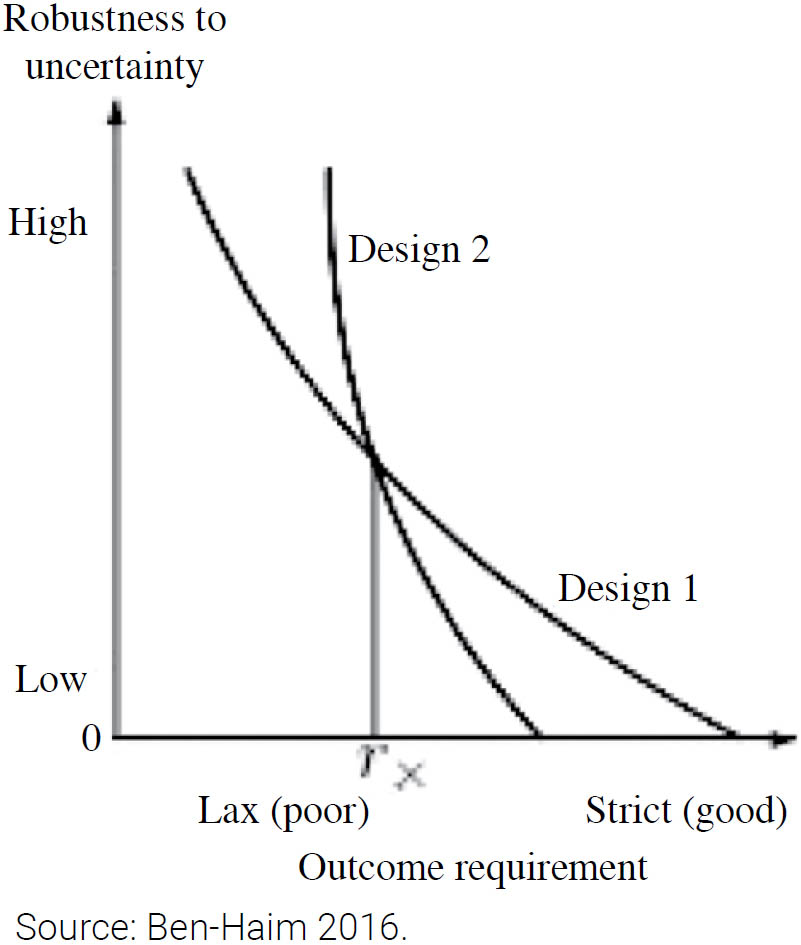
Long Description.
The graph depicts the relationship between robustness to uncertainty and outcome requirement in Info-Gap Theory. The vertical axis represents robustness to uncertainty, ranging from low to high. The horizontal axis shows outcome requirement, from lax (poor) to strict (good). Two curves, labeled Design 1 and Design 2, illustrate different approaches. Design 1 starts higher on the robustness axis but declines more steeply as requirements become stricter. Design 2 maintains a higher robustness level across varying requirements. The intersection of the curves indicates a critical point of decision-making between the designs. Source: Ben-Haim 2016.
 Example: Virginia DOT Regression Models to Improve Safety Target Setting and Work Prioritization (Batista et al. 2022).
After an uptick in fatalities and serious injuries from 2014 through 2017, the Commonwealth Transportation Board of Virginia directed Virginia DOT to develop a data-driven approach to improve the agencyʼs ability to meet its safety targets. Virginia DOT built a regression model that incorporated variables related to socioeconomics, travel and behavior, transportation spending, and weather, based on the results of NCHRP Project 17-67, “Identification of Factors Contributing to the Decline of Traffic Fatalities in the United States,” and revised its target setting and forecasting approach. The model required gathering much more data than Virginia DOT historically did, accounting for 80 percent of the projectʼs total effort. This new approach led to focusing not just on locations with histories of severe crashes but also on systemic improvements that addressed serious crash types along the entire road system.
While this framework could be used for additional multi-dimensional modeling, a more straightforward application would be to explore how specific sources of uncertainty present unknown risks and how that knowledge can support more robust decisions. Info-gap theory challenges decision-makers to represent uncertainty in outcomes and discuss what true outcome requirements are. These trade-offs can be represented mathematically but may be useful to the decision-making process even without taking that step.
The single-metric focused methods begin to quantify the risks and uncertainties that could be initially identified through quantitative approaches. Relative to purely qualitative processes, these methods require additional data collection, sometimes over a period of time.
These methods may also involve working with stakeholders within and outside an organization to identify opportunities for measurement. Stakeholders can also help make decisions about how to measure and compare relative risks and uncertainties across metrics and how to interpret or draw conclusions from a given analysis. Qualitative input can be particularly important given that outcome metrics may be in different units that are not directly comparable; different metrics also may be subject to different sources of uncertainty.
When quantitative measurements are fed back into a qualitative stakeholder process, an organization may engage in a form of deliberation with analysis:
- Deliberation with analysis. In this process, stakeholders are engaged multiple times throughout the analytic process to help identify potential biases in the measurements, ensure a range of uncertainties is analyzed (as people from other domains and backgrounds may be less likely to assume baseline values are close to correct), and help identify additional response options to manage uncertainty and achieve the objectives of the process. Deliberation among a diverse group can help to identify and interrogate assumptions and broaden perspectives. Deliberation with analysis creates opportunities to refine technical modeling assumptions and approaches with outsiders or specialists.
3.3.2.3 Discrete Scenario Methods
Under the class of discrete scenario methods, planners and decision-makers may use the widest range of tools. Any tool—qualitative or quantitative—that can describe outcomes of a scenario is useful under this class. The core characteristics of discrete scenario analysis are to construct a limited number of coherent (i.e., plausible and physically possible) alternative futures that both deviate from the predicted baseline and are sufficiently differentiated from each other to provide unique insight.
Typically, discrete scenarios are constructed to test versions of the future that combine differences across a limited number of critical sources of uncertainty. Additionally, these scenarios should provide a sufficient range of values for variables with key uncertainties. For example, a scenario might be constructed to explore plausible boundaries of specific sources of uncertainty like growth, environmental disruptions, or technology adoption.
Designing these discrete scenarios effectively ensures that the scenario analyses themselves do not require an unreasonable level of resources, although the design and testing process still requires significant time and effort. The focus is on generating internally consistent and useful scenarios rather than capturing all potential variations. This can be thought of as constructing a “story” or “narrative” about what could happen and using qualitative engagement methods or
Example: Evaluating Travel Demand under Economic Growth Scenarios
NCHRP Project 20-83(06) explored the uncertain and interacting impacts of national sociodemographic trends on future travel demand. These included the slowing of growth over time, an aging population, increased racial and ethnic diversity, and changing generational attitudes toward transit, walking, and biking. The project produced a system-dynamics-based scenario model for exploring impacts on travel by mode, with the goal of supporting learning and shifting away from deterministic thinking (Zmud et al. 2014).
models to explore implications. When constructing scenarios, planners should consider potential relationships between different sources of uncertainty and modeling variables.
Tools that are useful under discrete scenario methods depend on the technical field and the proposed scenarios. For example, a DOT may use a TDM with different input assumptions and parameters to evaluate the effects of discrete scenarios on network demand, long-term needs, or project performance. Discrete scenario methods will tend to investigate input assumptions and parameters that are quite different from one another, like changes in region-wide land use patterns or transformational technologies. The variations tend to be large shifts (possibly implemented through numerous variables) rather than small tests of sensitivity. This contrasts with exploratory scenario analysis, discussed in Section 3.3.2.4: Exploratory Systems Methods, which may investigate a more continuous space of parameter values with relatively less difference between one analysis and the next.
Alternatively, scenario planning may be conducted with strategic models that capture relationships to policy variables that are not a component of core modeling tools. In this case, outcomes from large, complex models might be used to calibrate a lighter, but broader model such as VisionEval (see https://visioneval.github.io/).
Discrete scenario planning is not only the providence of travel forecasting. For instance, a pavement unit within a state DOT might forecast how performance target achievement differs under various scenarios related to available revenue and weather. Or an agency might develop multiple revenue scenarios reflecting different policy mechanisms, growth assumptions, and rates of EV deployment. The range of potential tools is discussed in Section 3.2: Forecasting and Needs Estimation.
Discrete scenario planning may still leverage DMDU principles when using techniques such as Dynamic Adaptive Pathways Planning (DAPP). While DMDU analysis is often thought of as computationally complex, it is primarily focused on testing how strategies perform under different conditions. DAPP is an example of how several strategies can be identified and then assessed in relation to each other and external trends and thresholds:
- DAPP. DAPP draws on concepts from system dynamics to conceptualize a series of different actions over time, which provides different pathways based on the evolution of uncertainty over time. It can be used to provide more visibility on specific pathways that may involve switching between strategies based on other system changes. Often, to keep the relationships between strategies manageable, this will require identifying a few options and why they might be advantageous as different conditions arise. Figure 13 provides a graphic of how a pathway may branch based on new information. These changes in conditions might be political changes, environmental thresholds being crossed, or other forecasts being confirmed as accurate or wrong.
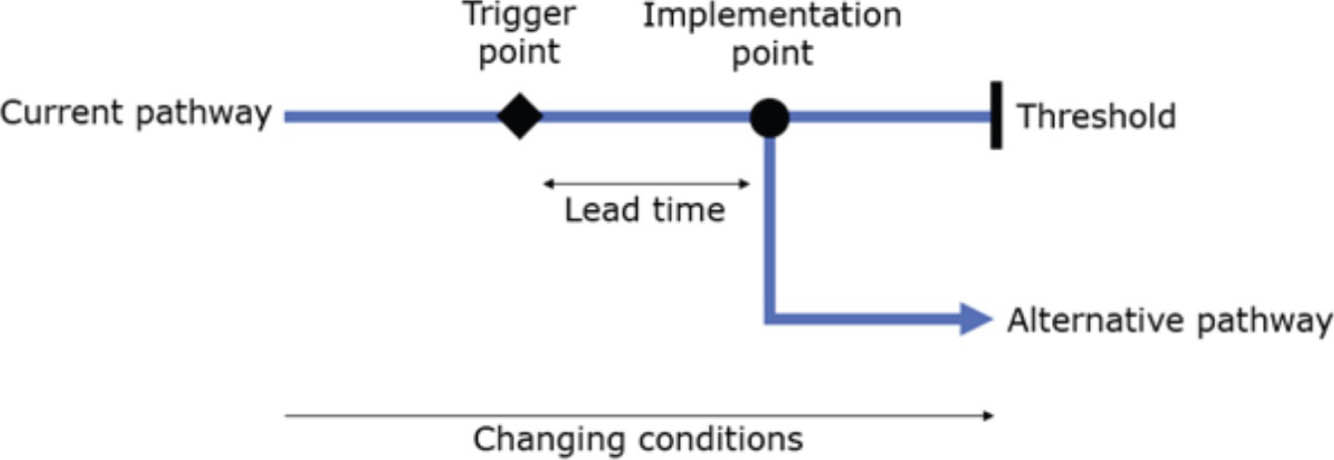
Source: Maynard et al. n.d.
Long Description.
The map illustrates an adaptive pathways map. It features a horizontal line labeled ‘Current pathway’ with a diamond-shaped ‘Trigger point’ and a circular ‘Implementation point.’ A vertical line marks the ‘Threshold,’ beyond which an arrow indicates an ‘Alternative pathway.’ Below, a horizontal arrow labeled ‘Changing conditions’ runs parallel to the pathways, and ‘Lead time’ is noted between the trigger and implementation points.
- Some policies may be more robust to changing conditions in this analysis because they facilitate the possibility of making future changes. This method tends to focus more on relationships across time than some traditional long-range planning frameworks that are focused on a particular horizon year of analysis.
3.3.2.4 Exploratory Systems Methods
Exploratory systems methods involve scenario analysis, modeling, and simulation across a wide range of values for sources of uncertainty. Conducting exploratory systems modeling frequently requires significant technical capacity and available datasets. Any tool that is used under discrete scenario methods could likely be used under exploratory systems methods and deployed repeatedly for a much larger number of scenarios. In some cases, modelers might choose simpler tools that require less time and effort per run to enable more refinement and simulation.
Exploratory systems methods can be used to serve one of two main purposes:
Purpose 1—Estimate a wide range of outcomes across many uncertain parameter values.
This approach can be used to identify the range of possible outcomes or variables with the greatest impacts on the system. By allowing for more factors to vary, this method can reveal critical weaknesses, risks, and the assumptions with the greatest influence on systems. The method also removes bias in selecting a limited number of parameters and allows for exploration of individual sources of uncertainty in relationship to the whole. Tools, including the FHWAʼs Travel Model Improvement Program (TMIP) Exploratory Modeling and Analysis Tool (EMAT) and system dynamics tools, may be used for modeling and simulation, and Monte Carlo simulation and probabilistic risk analysis may be used to evaluate these results:
- FHWAʼs TMIP-EMAT. TMIP-EMAT was developed to help transportation agencies manage uncertainty through analysis of interactions between transportation supply and demand via exploratory modeling and simulation (https://tmip-emat.github.io/tmip-emat/dev/source/emat.intro.html). Because there is a wide range of unknowns of potential interest, TMIP-EMAT runs other transportation models and adjusts their parameters to simulate hundreds or even thousands of possible scenarios.
In addition to being able to run many permutations of different variable combinations, TMIP-EMAT also includes capabilities to run only samples of the different mixes of uncertain variables and impute the outcomes of unmodeled scenarios. This capability is key to leveraging
Example: Exploratory Transportation Modeling Examples from FHWA
Using tools supported by the FHWAʼs Travel Model Improvement Program (TMIP) Exploratory Modeling and Analysis Tool (EMAT) program, transportation planning organizations have run transportation models with adjusted parameters to produce hundreds or even thousands of possible scenarios. For example, Oregon DOT is using its activity-based model in Visum, San Diego Association of Governments uses its EMME-based sub-regional analysis model, and the Greater Buffalo Niagara Regional Transportation Council is using its TransCAD trip-based model. These organizations used TDM runs to build meta-models for rapidly testing strategies and determining the external conditions under which current strategies may fail to meet their objectives (Milkovits et al. 2019).
- complex models with long run-times such as modern activity-based simulation models in an exploratory framework. By constructing a “model of models,” organizations may be able to extract insights from a core model about potential responses to uncertainty that would not be possible with a single model without giving up many of the nuances captured by more complex tools.
- System Dynamics Tools. Tools such as Powersim and iThink may be used to quantify the theories and hypotheses embedded in a causal diagram by integrating the calculations associated with each step in the cause-and-effect chains and then summing the results over a given time horizon (see Figure 14, which shows results of the model diagrammed in Figure 11).
- Monte Carlo simulation and probabilistic risk analysis. These analyses employ quantitative statistical methods on the large datasets produced by simulating many scenarios to evaluate the probabilities and ranges of particular outcomes. A Monte Carlo analysis could be constructed from the same data created (perhaps by TMIP-EMAT) to support the meta-model construction and stress tests conducted for robust decision-making (RDM) (detailed under Purpose 2). However, a Monte Carlo analysis focuses on identifying the most likely outcome and its certainty, rather than on exploring boundary conditions under which strategies could fail to achieve objectives, which is a goal of RDM.
Purpose 2—Identify required values for variables and parameters to achieve a specified outcome.
Unlike discrete scenario methods, which require setting plausible and physically possible scenarios, exploratory systems methods can be used to identify unpredicted scenarios that achieve or prevent specified objectives. For example, an agency might ask, “Under what combination
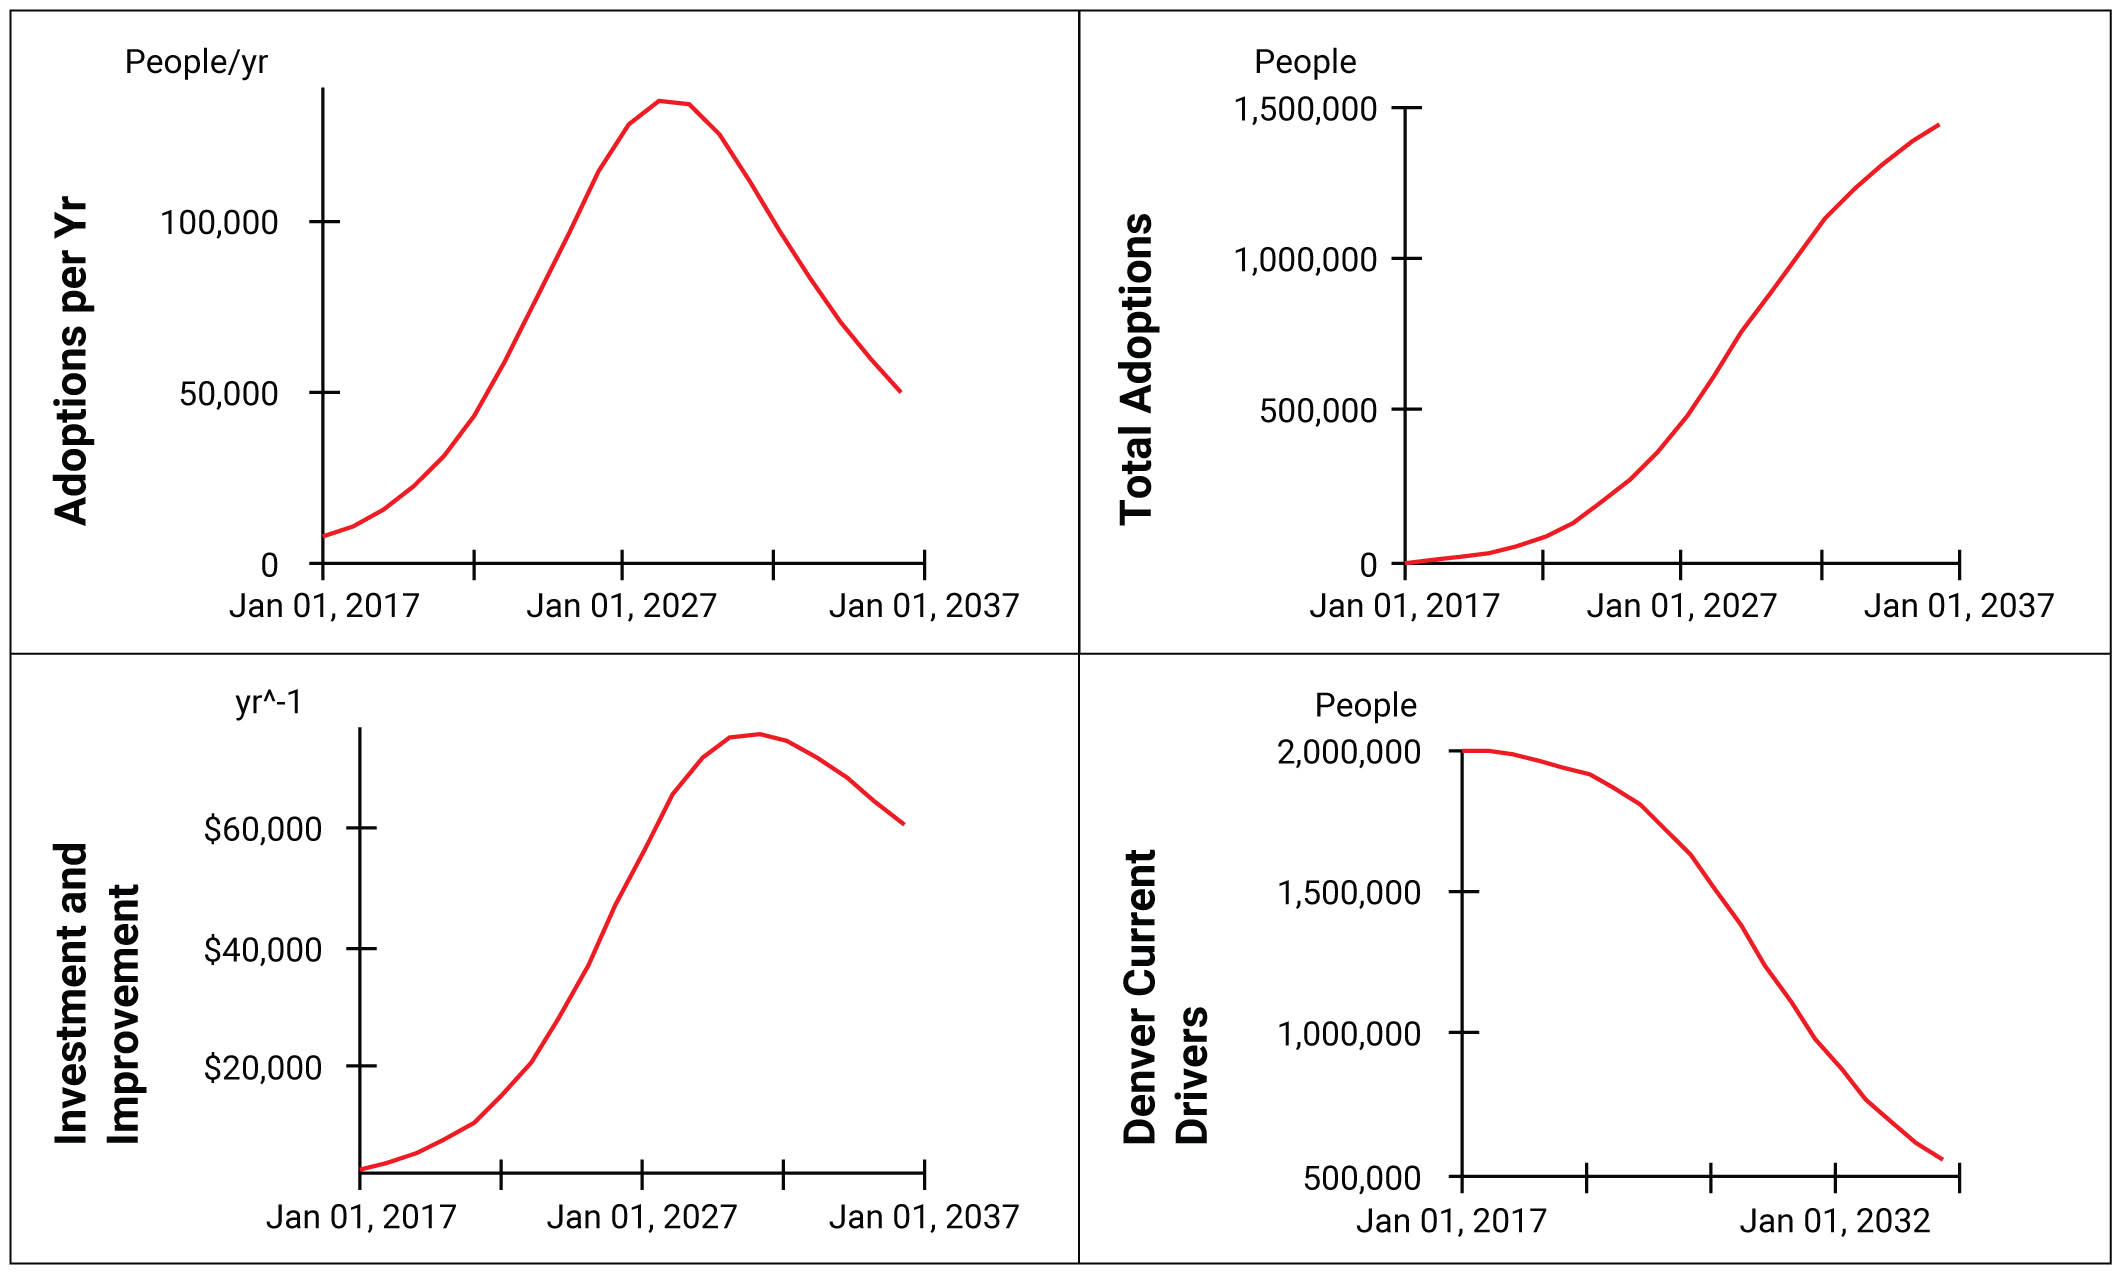
Long Description.
The four graphs illustrate the simulation of autonomous vehicle adoption in the Denver metropolitan area from January 1, 2017, to January 1, 2037. The top left graph shows ‘Adoptions per Year’ with a peak around 2027, measured in people per year. The top right graph displays ‘Total Adoptions’ steadily increasing, measured in people. The bottom left graph represents ‘Investment and Improvement’ with a peak similar to adoptions per year, measured in dollars per year to the power of negative one. The bottom right graph shows ‘Denver Current Drivers’ decreasing over time, measured in people. Each graph has a time axis ranging from 2017 to 2037.
of future conditions does my region achieve its environmental performance targets?” Using resources like EMAT, RDM is a framework that is designed for this purpose:
- RDM. RDM, unlike Monte Carlo simulation, helps policymakers identify robust strategies by using simulations to stress-test them under many conditions (Zmud et al. 2018). RDM is adaptive and can evolve over time as it receives new information—for instance, by pruning scenarios that are no longer feasible once more information is available or an action has been made. Once strategies are evaluated, analysts can identify under which types of scenarios a given strategy performs poorly in and adjust their actions to enhance resilience to that class of scenario (Lempert et al. 2022). RDM may leverage tools in the TMIP-EMAT portfolio or other toolkits like Rhodium (Hadjimichael et al. 2020).
3.3.3 Worksheet for Method Selection
The following worksheet (Table 22) is designed to facilitate discussion among staff within an agency seeking to select an analytical strategy or modeling approach with which to explore uncertainty. After reading the earlier content, the research team suggests that individual team members take notes within this table (or one like it) on the approaches that resonate with them, the goals that different approaches may address, the existing agency resources that could be applied, and the potential barriers. Then, by sharing notes among staff members with different perspectives and areas of expertise, the group can consider pros and cons of potential options as well as identify approaches that merit further investigation.
3.4 Communications Playbook
Case studies and outreach conducted in this research have indicated the need for improving communication related to uncertainty. Moreover, the team discovered that planning for uncertainty can act as a catalyst for increasing participation in the planning process.
The following playbook can help develop more agile outreach around uncertainty within planning activities through identifying and organizing outreach efforts, and messaging by target audience and the ultimate goal(s) of the outreach. Timing, messaging, and approach for

Long Description.
The column headers are Options my agency could pursue for analyzing uncertainty; How would this help us?; What existing resources (tools, work groups, stakeholders, etc.) would this use?; What challenges would we have in doing this? The data given in the table are as follows: Row 1: 1, blank, blank, blank. Row 2: 2, blank, blank, blank. Row 3: 3, blank, blank, blank.
outreach will vary by purpose and audience, but general best practices include communicating early, clearly, and often throughout the planning process.
This playbook is organized into the following steps:
- Identify the audience for outreach.
- Determine the goals of your outreach effort.
- Identify tools and general messaging for outreach based on goals and audience.
- Incorporate feedback into the planning process and/or future outreach.
When considering avenues for outreach, one should seek to build on existing best practices and processes within an organization. For example, communications efforts related to uncertainty for a long-range transportation plan (LRTP) should be organized alongside the rest of the planʼs engagement to best align with the overall process and reduce the burden of repeated requests or meetings with key stakeholders. Additionally, it can help to consult with internal agency staff who have prior experience engaging with target audiences or with representatives of specific groups to determine the best way to communicate.
3.4.1 Step 1: Identify Audience for Outreach
Is your audience one or more of the following?
- Internal stakeholders, e.g., other departments, program managers, practitioners, or executive leadership within your agency or organization.
- Traditional stakeholders, e.g., state agencies, local governments, MPOs, regional planning organizations, transit and other modal agencies, tribal governments, federal agencies, or advocacy groups.
- Nontraditional stakeholders, e.g., technology companies, universities/academia, freight providers, research organizations, or other innovators.
- Public, e.g., members of the community.
- Decision-makers, e.g., board members, policy makers, or elected officials.
3.4.2 Step 2: Determine the Goals of the Communication Effort
Do your outreach goals include any of the following?
Gathering Knowledge
- Identifying tools, data, and processes for bridging knowledge gaps related to uncertainty.
- Gathering information on types of uncertainty for consideration in the planning process and related attitudes, values, or priorities.
Providing Education
- Helping program managers and practitioners understand and address uncertainty.
- Articulating concerns, sharing knowledge, and bridging knowledge gaps across departments/programs.
- Communicating uncertainty and how it is incorporated into the planning process to the public.
- Communicating uncertainty and how it is incorporated into the planning process to decision-makers or elected officials.
- Providing internal training on new tools or processes that will support decision-making.
Seeking Action, Approval, or Policy Change
- Communicating actions needed to adapt to or manage uncertainty to decision-makers or elected officials with the goal of achieving action, approval, or policy change (for example, a new funding mechanism).
Other
- Please identify any additional goals that are unique to your effort.
3.4.3 Step 3: Identify Tools and General Messaging for Outreach Based on Goals and Audience
The following tables (Tables 23–29) illustrate how an agency may connect a target audience with appropriate messaging or engagement subgoals, and from there identify potential communication tools or avenues. While the specifics will vary with each plan, subject, and agency context, these can be used as a jumping-off point for planning.
Note that messaging may vary in level of detail by audience. For example, whereas an internal stakeholder or expert at an outside partnerʼs organization may merit detailed technical engagement, members of the public or busy decision-makers like elected officials may require brief, pointed communication focused specifically on the direct implications of an issue to them and their roles. Similarly, the appropriate tool will vary by goal and audience. For example, a survey may be useful for collecting organized high-level information from many respondents, but it is

Long Description.
The column headers are Target Audience, Sample Messaging or Subgoals, and Communication Tools. The data given in the table rows are as follows:
Row 1: Internal Stakeholders, Traditional Stakeholders: Identify key departments and personnel with relevant knowledge, Communicate the desire to understand the processes and systems that are in place (or lacking) to better address gaps in knowledge; Webinars, Surveys, In-Person Meetings, Focus Groups, Internal Website, Printed Materials, and Contact Information.
Row 2: Nontraditional Stakeholders, Public: Identify key stakeholders or contacts, Communicate the desire to learn from people and processes outside of your organization or traditional stakeholder group; Webinars, Surveys, Social Media, In-Person Meetings, Workshops, and Case Studies.
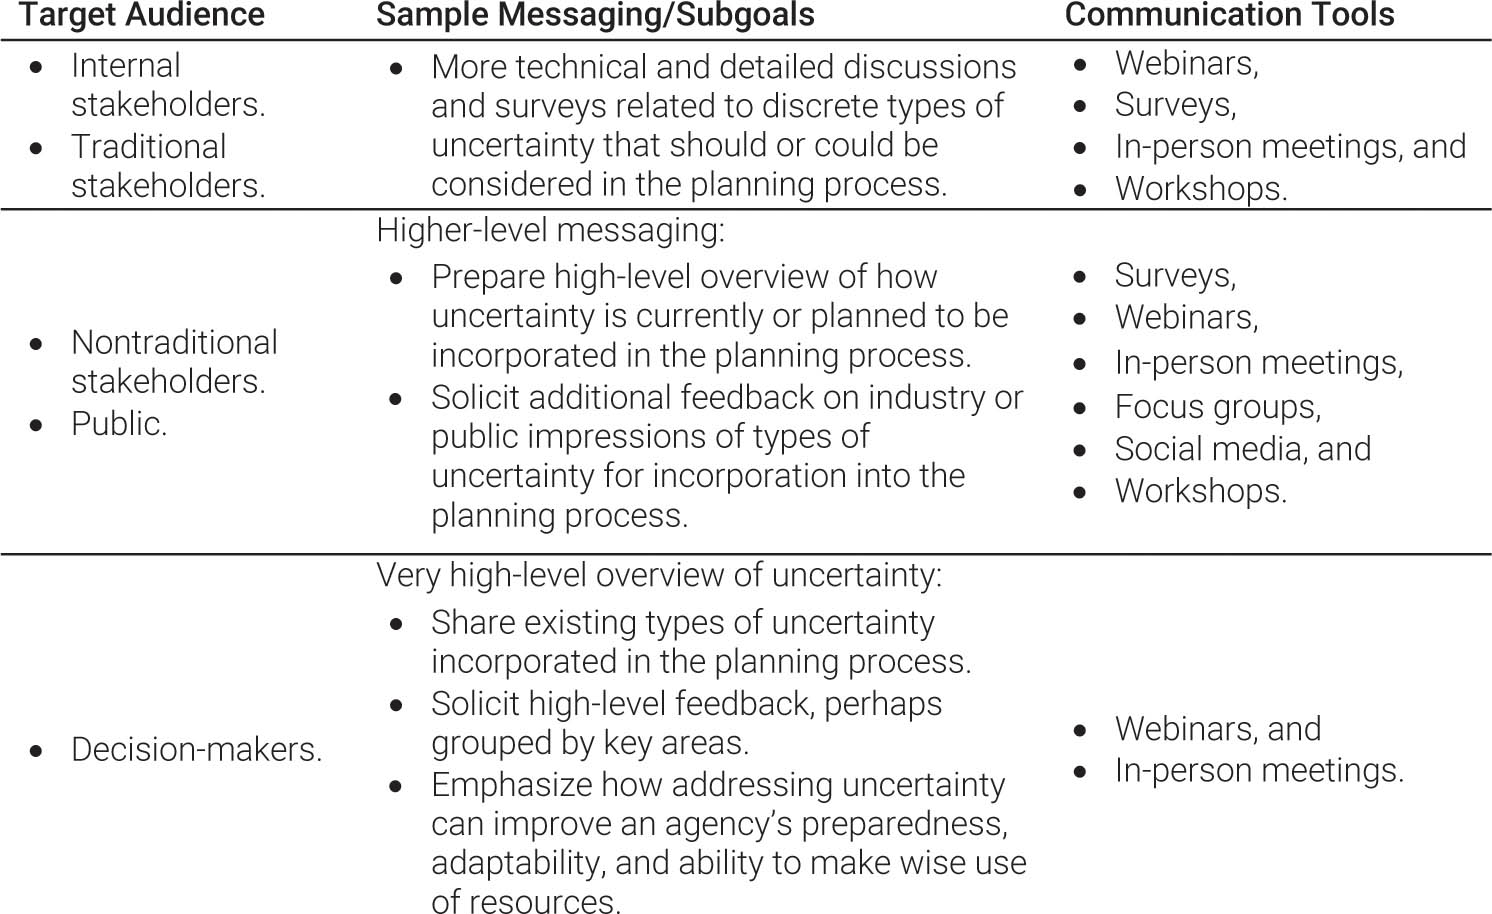
Long Description.
The column headers are Target Audience, Sample Messaging or Subgoals, and Communication Tools. The data given in the table rows are as follows:
Row 1: Internal Stakeholders, Traditional Stakeholders: More technical and detailed discussions and surveys related to discrete types of uncertainty that should or could be considered in the planning process; Webinars, Surveys, In-Person Meetings, and Workshops.
Row 2: Nontraditional Stakeholders, Public: Higher-level messaging: Prepare a high-level overview of how uncertainty is currently or planned to be incorporated in the planning process. Solicit additional feedback on industry or public impressions of types of uncertainty for incorporation into the planning process; Surveys, Webinars, In-Person Meetings, Focus Groups, Social Media, and Workshops.
Row 3: Decision Makers: Very high-level overview of uncertainty: Share existing types of uncertainty incorporated in the planning process. Solicit high-level feedback, perhaps grouped by key areas. Emphasize how addressing uncertainty can improve an agency’s preparedness, adaptability, and ability to make wise use of resources; Webinars, and In-person meetings.

Long Description.
The column headers are Target Audience, Sample Messaging or Subgoals, and Communication Tools. The data given in the table rows are as follows:
Column 1: Internal Stakeholders, Traditional Stakeholders. Column 2: Identify key departments and personnel. Define uncertainty and the importance of addressing it; provide examples. Give specific guidance on what should or can be done and when. Provide opportunities for questions. Identify the best tools for sharing and regularly updating information. Column 3: Webinars, In-Person Meetings, Internal or External Website or File Sharing Platform that includes Sharing Key Contact Information, Workshops, Printed Materials, and Contact Information.
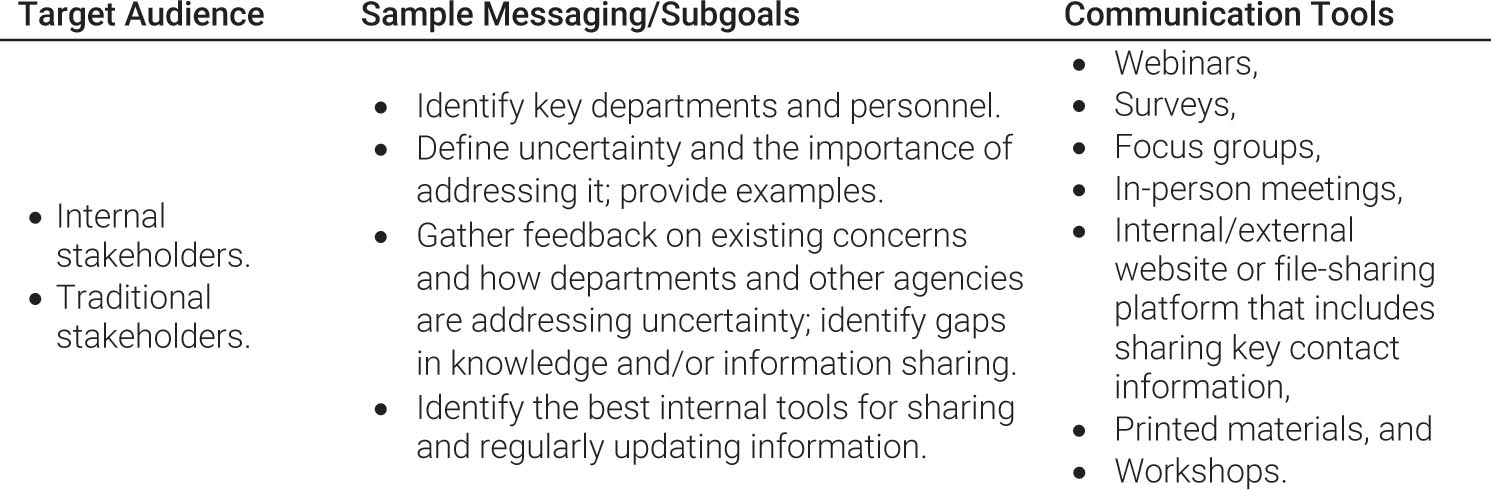
Long Description.
The column headers are Target Audience, Sample Messaging or Subgoals, and Communication Tools. The data given in the table rows are as follows:
Row 1: Internal Stakeholders, Traditional Stakeholders; Identify key departments and personnel; Define uncertainty and the importance of addressing it; provide examples. Gather feedback on existing concerns and how departments and other agencies are addressing uncertainty; identify gaps in knowledge and or information sharing. Identify the best internal tools for sharing and regularly updating information; Webinars, Surveys, Focus Groups, In-Person Meetings, Internal or External Website or File Sharing Platform that includes Sharing Key Contact Information, Printed Materials, and Workshops.

Long Description.
The column headers are Target Audience, Sample Messaging or Subgoals, and Communication Tools. The data given in the table rows are as follows:
Row 1: Internal Stakeholders, Traditional Stakeholders: More detailed and technical messaging: Identify key departments and personnel. Define uncertainty and the importance of addressing it; provide examples of the tools and methodologies for incorporating uncertainty into the planning process; Webinars, In-Person Meetings, Internal Website that includes Sharing Key Contact Information, and Printed Materials. Row 2: Nontraditional Stakeholders, Public: Higher-level messaging: Focus on region-wide and industry impacts of action or inaction; Webinars or Presentations, In-person meetings, and Social media.
Row 3: Decision Makers: Very high-level messaging: Communicate agency-wide or region-wide implications of addressing uncertainty and how action or inaction may impact current and future funding, operations, or policy; Webinars or Presentations, In-Person Meetings, Policy Memos, and Printed Materials or Leave Behinds.

Long Description.
The column headers are Target Audience, Sample Messaging or Subgoals, and Communication Tools. The data given in the table row is as follows:
Column 1: Internal Stakeholders. Column 2: Identify key departments and personnel.
Articulate the importance of uncertainty and the benefits of the new tools and processes. Give specific guidance on what should or can be done and when. Gather feedback to improve tools, processes, and training. Column 3: Webinars or In-Person Meetings, Workshops, Internal Website or File Sharing Platform, Including Sharing Key Contact Information, and Printed Materials.

Long Description.
The column headers are Target Audience, Sample Messaging or Subgoals, and Communication Tools. The data given in the table row is as follows:
Column 1: Decision Makers. Column 2: Identify personnel whose action or approval is needed.
Articulate the importance of uncertainty and how it directly relates to goal achievement. Communicate specific implications of uncertainty for outcomes or policies that are the responsibility of the decision-maker. Present recommendations for action. Describe the benefits of action and the consequences of inaction. Column 3: Webinars or Presentations, In-Person Meetings, Policy Memos, Printed Materials, or Leave Behinds.
less likely to yield the type of detailed insight or learning across multiple participants as can be gained via a workshop or in-person meeting.
The following figures (Figures 15 and 16) provide use case examples of information gathering and sharing tools. The figures are arranged in pyramids to illustrate relative reach but are not indicative of relative impact. For example, a survey or poll may reach a broad audience but may have less influence or impact than a one-on-one meeting with a decision-maker who can affect policy.
When selecting communication tools, consider preexisting channels that already have buy-in within an organization or at partner organizations. This might, for example, include taking advantage of media platforms such as social media accounts, newsletters, podcasts, blogs, or video blogs or channels.
3.4.4 Step 4: Incorporate Feedback into Planning Efforts and/or Future Communications Strategy
The final step in this playbook is to ensure that any feedback received during the outreach process is meaningfully addressed and/or incorporated into the planning process. Documenting this process can also help future planners understand what was done; for example, if someone getting ready for the next LRTP sought to understand how stakeholder input guided scenario definition. Additionally, it can be used to report back to those who gave input. This can help build buy-in for plan products and outcomes.
Incorporation of feedback might also include integration of methodologies and comments related to improving communication, education, and outreach efforts in the future.

Long Description.
This diagram presents a horizontal comparison of five tools used for gathering information, arranged from left to right based on audience size, from wide to narrow. Each tool is represented by a vertical red line topped with a red dot, with a brief description beneath.
On the far left, surveys and polls can gather general information broadly from large groups; can also gather information from more targeted audiences during meetings. Second from left is Webinars or Virtual Meetings, which can span large geographic areas; tend to be less interactive than other meeting types; best for educating and gathering broad information internally and externally. In the center, Large In-Person Meetings can be used for internal or external purposes; best for information gathering, education, brainstorming, and developing lasting partnerships across audiences. Moving right, Focus Groups can target specific objectives or groups of individuals; can be held in-person or virtually; best for gathering detailed information and feedback and establishing close coordination. Finally, One-on-One Meetings, positioned at the far right, can be held in-person or virtually; are best for gathering specific information, providing targeted education, or seeking action or approval from decision-makers.
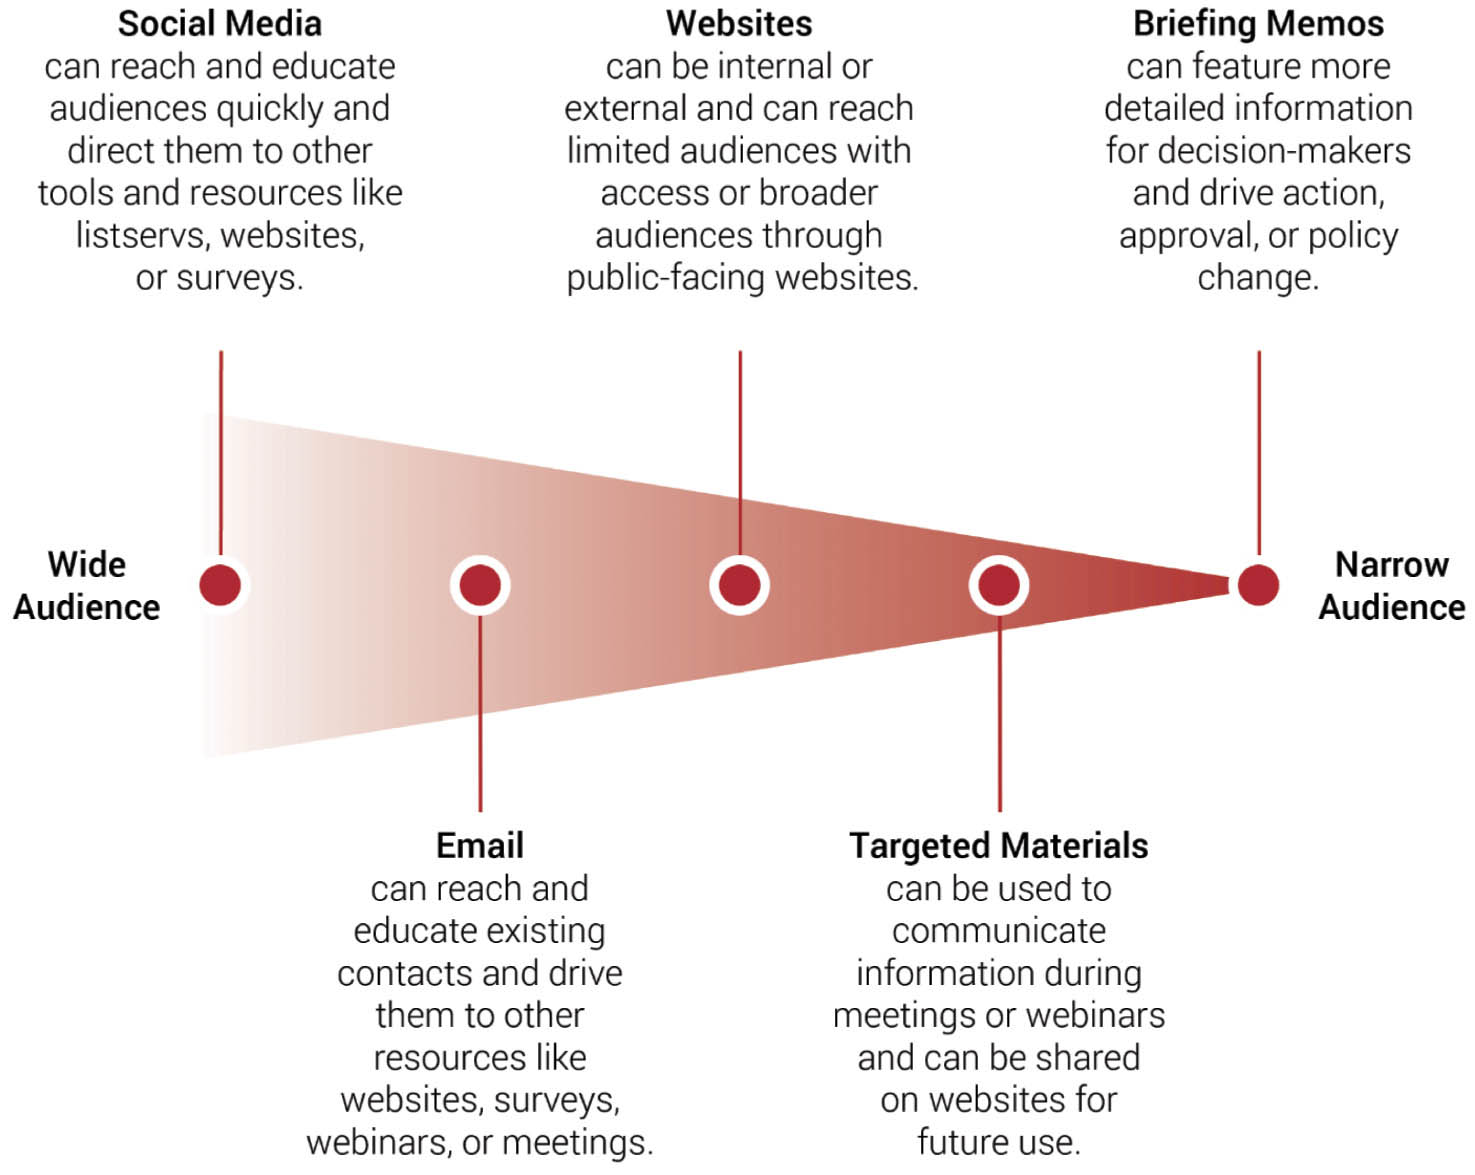
Long Description.
The diagram illustrates five distinct tools for sharing information, organized by audience reach. The triangle’s wide base on the left is labeled “Wide Audience,” and its narrow tip on the right is labeled “Narrow Audience,” visually representing a spectrum from broad to targeted communication. Above and below the triangle, five tools are positioned along this continuum. On the wide end, Social Media can reach and educate audiences quickly and direct them to other tools and resources like listservs, websites, or surveys. Email is next, and can reach and educate existing contacts and drive them to other resources like websites, surveys, webinars, or meetings. Websites is in the center, can be internal or external and can reach limited audiences with access or broader audiences through public-facing websites. Targeted Materials are placed closer to the narrow end, can be used to communicate information during meetings or webinars and can be shared on websites for future use. At the narrowest point, Briefing Memos are highlighted and can feature more detailed information for decision-makers and drive action, approval, or policy change. This structured layout helps users select appropriate tools based on the size and specificity of their intended audience.


