Incorporating Uncertainty into Long-Range Transportation Planning: A Guide (2026)
Chapter: 4 Implementation

CHAPTER 4
Implementation
Chapter 4 focuses on activities that leverage the outcomes of long-range planning. This chapter will be most useful for those looking to determine how uncertainty insights can be carried forward into action before their next plan update. Chapter sections are designed to help extend the impact of planning and maintain an agencyʼs abilities to achieve its goals. They can also support reflection, learning, and refinement for subsequent plan cycles.
Chapter 4 Components
4.1 Prioritization to Account for Uncertainty
One of the most concrete ways to factor uncertainty into implementation is by using information about the impacts of uncertainty to influence prioritization of funding resources for projects and programs of work. This can be achieved through multiple avenues, including:
- Analyzing projects under multiple future scenarios and elevating those that perform the best across multiple scenarios.
- Assessing differences in the effectiveness of funding or in the mix of needs across different programs of work (such as pavement, bridge, or transit) under different scenarios.
- Screening for risk or vulnerability and then prioritizing projects that respond accordingly (e.g., through adaptation, mitigation, or reduction of exposure).
- Addressing uncertainty related to funding and the environmental or planning process through “readiness”-related criteria.
The following explores each of these avenues for incorporating uncertainty into funding resource prioritization in further detail. Depending on an individual agencyʼs context, prioritization may be completed inside a long-range planning activity or as its own stand-alone process.
4.1.1 Scenarios in Project Prioritization
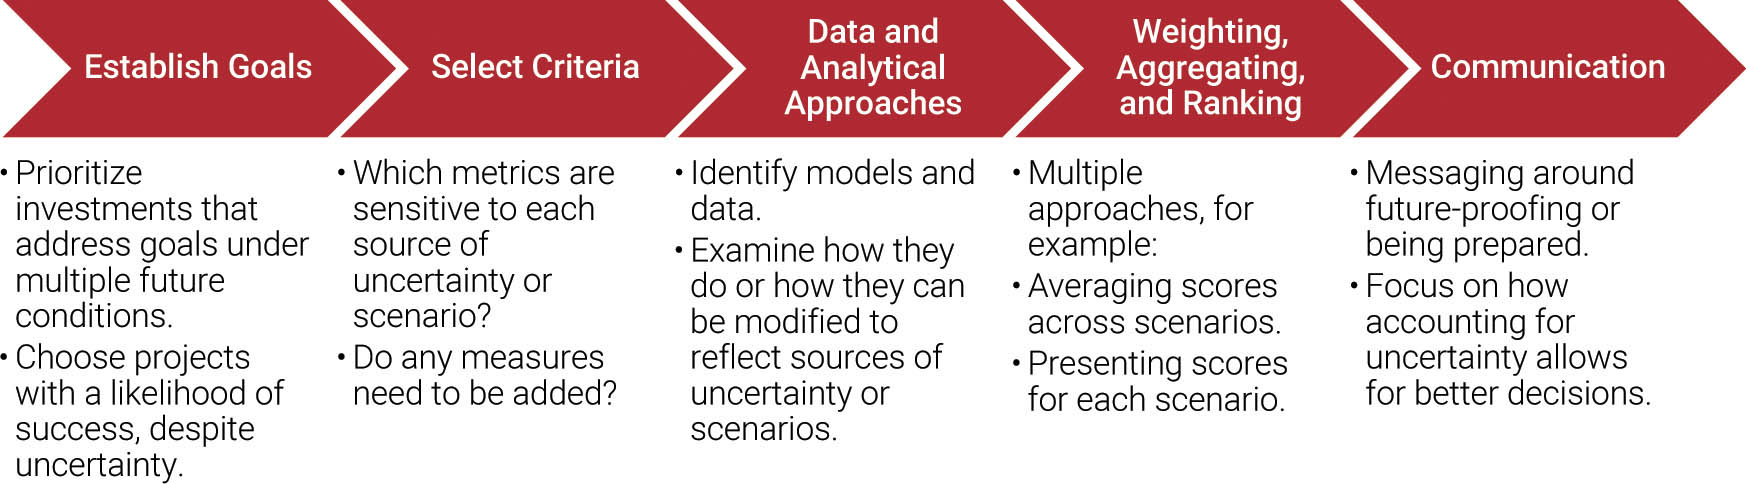
Quantitative prioritization processes to compare and rank projects typically have common components, including the establishment of goals, selection of evaluation criteria, selection of data and analytical approaches, weighting across metrics and objectives, analysis and ranking, and communication (Spy Pond Partners, LLC et al. 2019).
 Resources. To learn more about multi-criteria prioritization approaches, see NCHRP Report 806: Guide to Cross-Asset Resource Allocation and the Impact on Transportation System Performance and NCHRP Research Report 921: Case Studies in Implementing Cross-Asset, Multi-Objective Resource Allocation.
Figure 17 illustrates how an agency might go about incorporating insights from scenario planning into project prioritization.
Long Description.
The flowchart includes five main steps: Establish goals, select criteria, Data and analytical approaches; Weighting, Aggregating, and Ranking; and Communication. Each step contains specific actions:
Establish goals: Prioritize investments that address goals under multiple future conditions. Choose projects with a likelihood of success, despite uncertainty.
Select Criteria: Which metrics are sensitive to each source of uncertainty or scenario? Do any measures need to be added?
Data and Analytical Approaches: Identify models and data. Examine how they do or how they can be modified to reflect sources of uncertainty or scenarios.
Weighting, Aggregating, and Ranking: Multiple approaches, for example, Averaging scores across scenarios. Presenting scores for each scenario.
Communication: Messaging around future-proofing or being prepared. Focus on how accounting for uncertainty allows for better decisions.
 Example: San Francisco Bay Area MTC
In developing its LRTP, Plan Bay Area 2050, the San Francisco Bay Areaʼs Metropolitan Transportation Commission and Association of Bay Area Governments (MTC-ABAG) launched the Horizon initiative to assess major transportation investments. Horizonʼs Project Performance Assessment included a scenario planning approach that evaluated more than 90 transportation projects in the region to determine which were the most cost-effective across three future scenarios.
To create the future scenarios used in the project prioritization process, MTC-ABAG first collaborated with local residents and stakeholders and held a peer exchange workshop to develop a set of over two dozen different economic, environmental, political, and technological uncertainties that may impact the future of transportation in the Bay Area. These “external forces” were designed to be logical, cohesive, and fit within a unified regional narrative. The working group initially developed a universe of 11 futures with differing sets of assumptions about each of the external forces. The group narrowed the futures down to three unique scenarios to use in the analysis, which they felt best represented a wide range of future possibilities, as summarized in Figure 18.
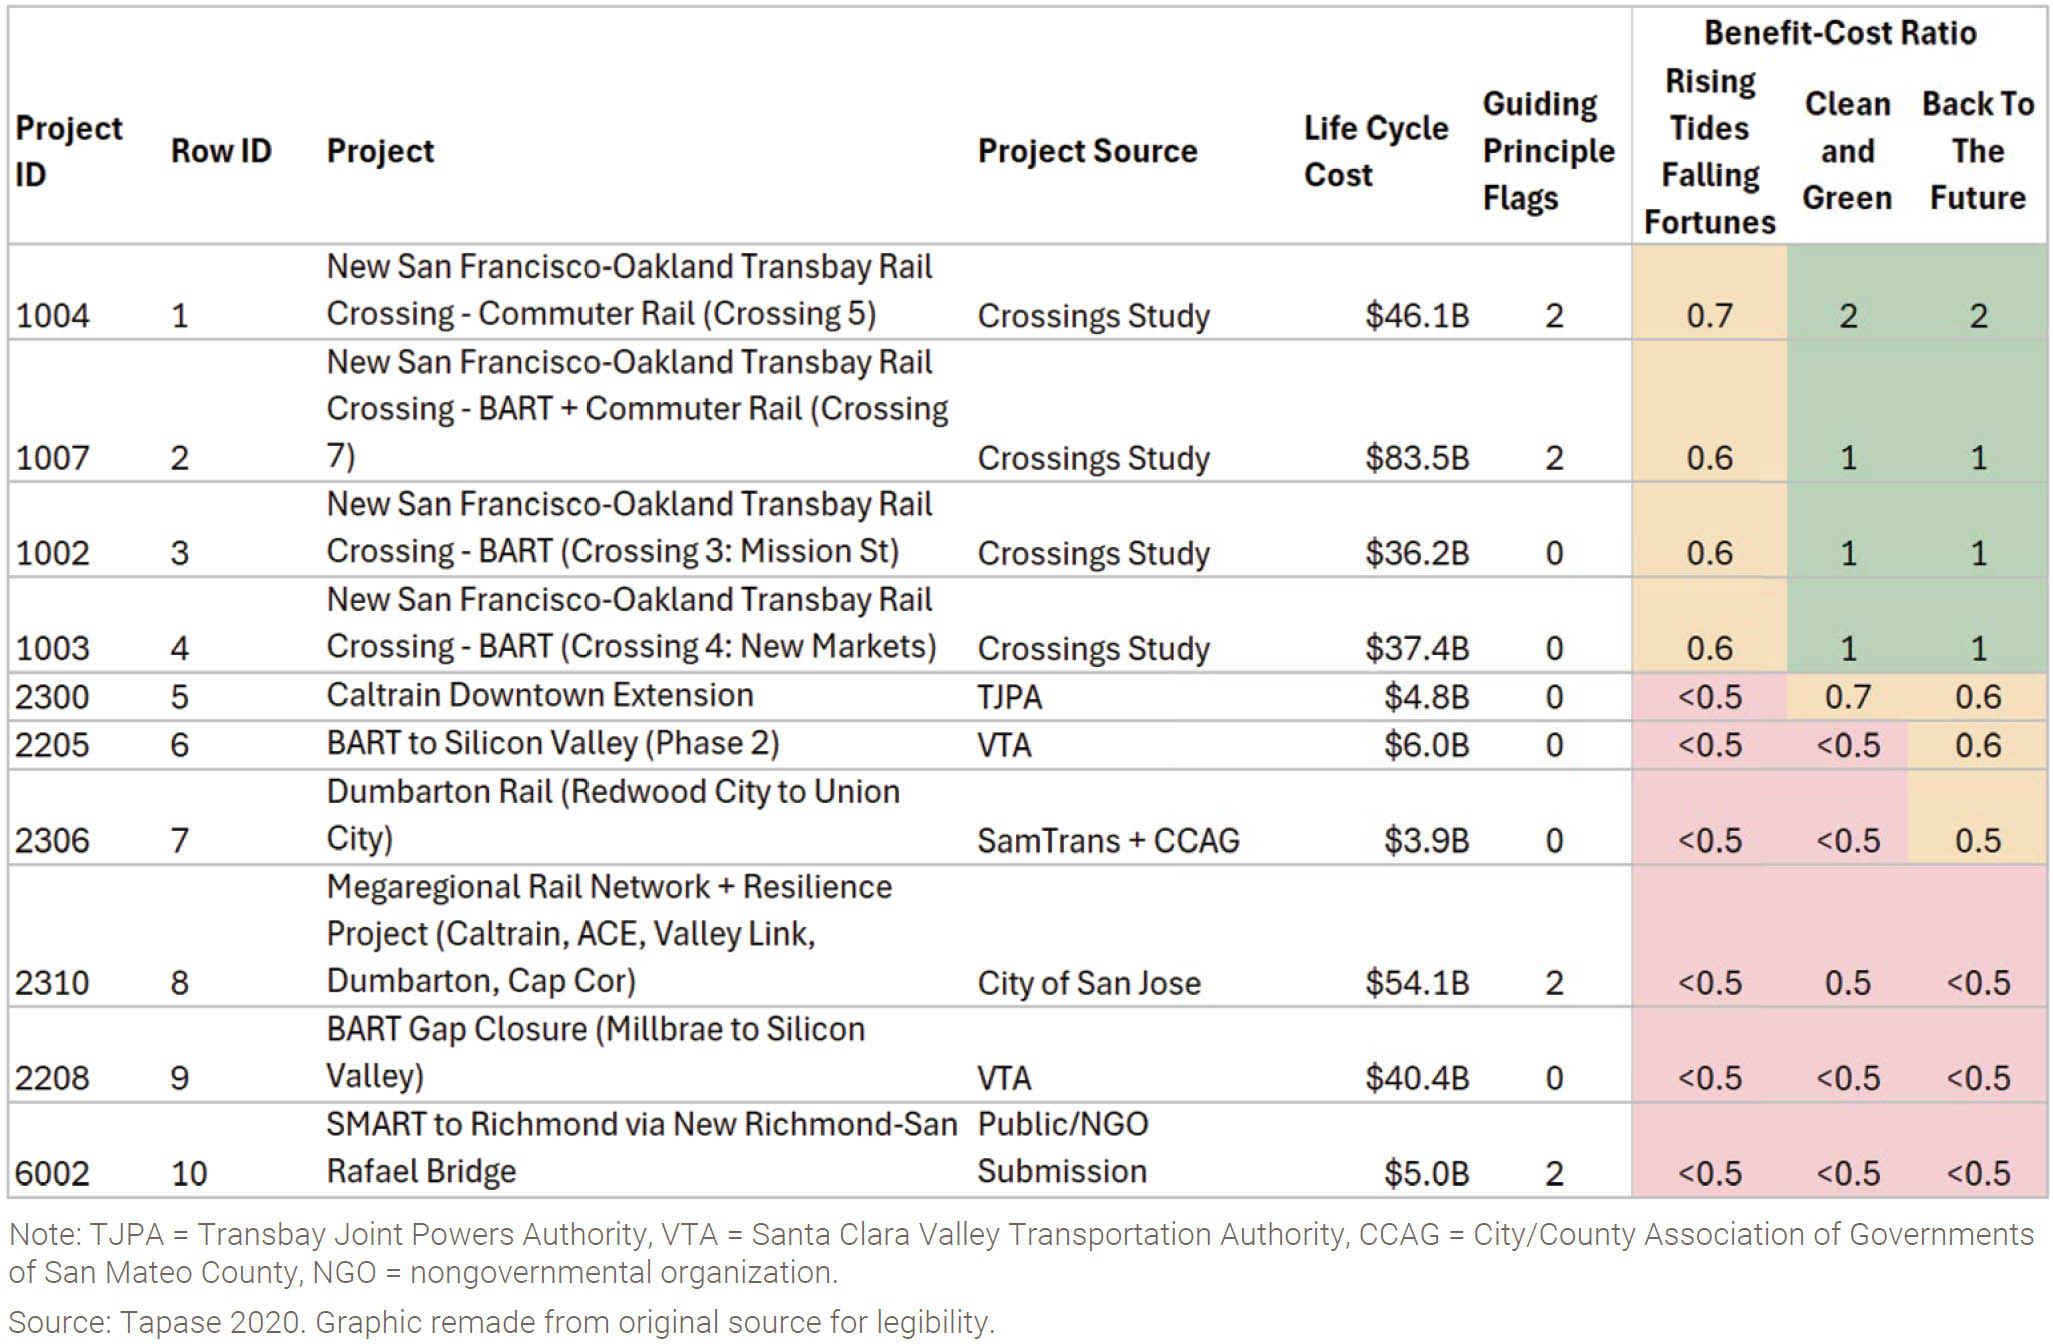
With the three future scenarios defined, MTC-ABAG leveraged metrics from their activity-based TDM, the regional economic model, a land use model, and Californiaʼs emissions model to develop project assessments. An example set of project scores can be found in Figure 19. Projects that perform well across multiple future scenarios are considered to be the most promising and resilient for the future of the region.
It is important to note that MTC-ABAGʼs activity-based TDM takes approximately a full day to run, thus, evaluation for the more than 90 projects considered in this study across three futures was no small feat. To meet the projectʼs timeline, MTC-ABAG turned to cloud computing to execute multiple model runs at the same time (Tapase 2019, Tapase 2020, MTC-ABAG n.d., MTC-ABAG 2020).

Long Description.
The chart titled ‘MTC-ABAG External Forces Summary’ presents three scenarios: A, B, and C. Each scenario outlines the factors immigration and trade, national taxes and funding, national growth, land use preferences, national environmental policy, new technologies, and natural disasters. Scenario A, ‘Clean and Green,’ indicates similar to today immigration levels, higher funding via carbon tax, similar to today national growth, more urban housing, more dispersed jobs, stricter regulations with one foot sea level rise, widespread new technologies, and a magnitude 7.0 Hayward Fault earthquake. Scenario B, ‘Rising Tides, Falling Fortunes,’ shows reduced immigration, lower funding due to tax cuts, limited growth, more urban housing, similar to today job dispersion, relaxed regulations with 3-foot sea level rise, more limited new technologies, and a magnitude 7.0 Hayward fault earthquake. Scenario C, ‘Back to the Future,’ features increased immigration, similar funding to today, rapid growth, more dispersed housing, more urban jobs, similar regulations with 2-foot sea level rise, widespread new technologies, and a magnitude 7.0 Hayward fault earthquake. Note: SLR equals sea level rise. Source: https://mtc.ca.gov/sites/default/files/Horizon_Summary_FINAL_Futures.pdf.
Long Description.
The column headers are: Project ID, Row ID, Project, Project Source, Lifestyle Cost, Guiding Principle Flags, Benefit Cost Ratio: Rising Tides Falling Fortunes, Clean and Green, Back to the Future. The data in the table rows are given as follows:
Row 1: 1004; 1; New San Francisco–Oakland Transbay Rail Crossing – Commuter Rail (Crossing 5); Crossings Study; 46.1 billion dollars; 2; 0.7; 2; 2.
Row 2: 1007; 2; New San Francisco–Oakland Transbay Rail Crossing – BART plus Commuter Rail (Crossing 7); Crossings Study; 83.5 billion dollars; 2; 0.6; 1; 1.
Row 3: 1002; 3; New San Francisco–Oakland Transbay Rail Crossing – BART (Crossing 3: Mission Street); Crossings Study; 36.2 billion dollars; 0; 0.6; 1; 1.
Row 4: 1003; 4; New San Francisco–Oakland Transbay Rail Crossing – BART (Crossing 4: New Markets); Crossings Study; 37.4 billion dollars; 0; 0.6; 1; 1.
Row 5: 2300; 5; Caltrain Downtown Extension; TJPA; 4.8 billion dollars; 0; less than 0.5; 0.7; 0.6.
Row 6: 2205; 6; BART to Silicon Valley (Phase 2); VTA; 6.0 billion dollars; 0; less than 0.5; less than 0.5; 0.6.
Row 7: 2306; 7; Dumbarton Rail (Redwood City to Union City); SamTrans plus CCAG; 3.9 billion dollars; 0; less than 0.5; less than 0.5; 0.5.
Row 8: 2310; 8; Megaregional Rail Network plus Resilience Project (Caltrain, ACE, Valley Link, Dumbarton, Cap Cor); City of San Jose; 54.1 billion dollars; 2; less than 0.5; 0.5; less than 0.5.
Row 9: 2208; 9; BART Gap Closure (Millbrae to Silicon Valley); VTA; 40.4 billion dollars; 0; less than 0.5; less than 0.5; less than 0.5.
Row 10: 6002; 10; SMART to Richmond via New Richmond–San Rafael Bridge; Public or NGO Submission; 5.0 billion dollars; 2; less than 0.5; less than 0.5; less than 0.5. Note: TJPA equals transbay joint powers authority, VTA equals santa clara valley transportation authority, CCAG equals city or county association of governments of san mateo county, NGO equals nongovernmental organization. Source: Tapase 2020. Graphic remade from original source for legibility.
Example: Hampton Roads Transportation Planning Organization (HRTPO)
HRTPO developed and applied scenarios within their 2045 LRTP. Within their existing project prioritization tool, HRTPO evaluated projects by modeling them in the TDM Funder for each of the four scenarios. From the TDM and spatial analyses in geographic information systems (GIS), HRTPO derived a subset of prioritization metrics (also referred to as evaluation criteria or weighting factors) that were sensitive for the different scenarios. These evaluation criteria were separated into three encompassing categories: project utility, economic vitality, and project viability. Individual evaluation criteria included metrics related to congestion, safety, travel time reliability, labor market access, environmental factors, and more. These evaluation criteria, and the importance or weight of each metric, varied for different types of projects, such as those focused on highways, interchanges, bridges and tunnels, intermodal and freight transport, transit, and active transportation.
Based on the average of each projectʼs performance under each scenario according to the evaluation criteria, HRTPO developed scores and rankings to identify the best performing projects across all four of the scenarios. The scores for each criteria category (project utility, economic vitality, and project viability) added up to the total score [Stith and Lambert 2021; HRTPO n.d.(a), n.d.(b), n.d.(c)].
4.1.2 Prioritizing Across Program Areas
Rather than ranking projects, scenarios can be used to assess differences in the effectiveness of funding or in the mix of needs across work program areas. Such an analysis would be used to inform the overall allocation of funding to programs, reflecting consideration for the uncertainty of future conditions.
Example: Access Ohio 2045
To engage with uncertainty, Ohio Department of Transportation (ODOT) incorporated scenario planning within Access Ohio 2045, their LRTP. One of the biggest concerns that ODOT faced was regarding funding. ODOT and the Ohio legislature were grappling with the insufficiency of the existing gas tax to cover future costs, and they were considering different funding sources and innovative financing options. The scenario planning exercise aimed to support this conversation by engaging with a range of futures in order to identify how future funding needs could vary (see Figure 20). Rather than focusing on a single point forecast, the scenario planning effort helped to bound expectations on funding requirements, including demonstrating significant levels of need in widely varying futures.
4.1.3 Risk and Vulnerability
Another approach to addressing uncertainty in project prioritization is to analyze or screen for risks and then incorporate scores reflecting these risks into project scoring. Rather than focusing on the uncertainty of outcomes across different performance measures, this approach directly addresses building resilience against uncertain but potentially damaging future outcomes.

Long Description.
The bar chart illustrates Access Ohio 2045 statewide needs divided into four categories: Current Trends, Innovation, Global Markets, and Ohio Renaissance. Each category displays two bars representing ODOT and Partners. The vertical axis shows statewide needs in billions of dollars, ranging from zero to two hundred billion dollars in 50 billion dollar increments. Current Trends total 179.7 billion dollars, with ODOT at 71.7 billion dollars and Partners at 107.9 billion dollars. Innovation totals 174.4 billion dollars, with ODOT at 71.4 billion dollars and Partners at 103 billion dollars. Global Markets totals 194.1 billion dollars, with ODOT at 78.3 billion dollars and Partners at 115.9 billion dollars. Ohio Renaissance totals 191.6 billion dollars, with ODOT at 76.2 billion dollars and Partners at 115.3 billion dollars. Source: https://www.dot.state.oh.us/Documents/AO45/AO45_OhiosTransportationPlan_Final_UPDATED_110624.pdf.
Example: Vermont Project Selection and Project Prioritization (VPSP2)
VPSP2 is used by the Vermont Agency of Transportation to identify, prioritize, and select projects [State of Vermont Agency of Transportation n.d.(a)]. One of the criteria against which projects are scored is resiliency, e.g., minimizing the impacts of events such as floods and extreme weather. As part of VPSP2, each project is given a resilience score using the agencyʼs Transportation Resilience Planning Tool (TRPT) (State of Vermont Agency of Transportation 2021). This web-based tool is designed to identify flood and erosion risk for Vermontʼs roads and bridges along with potential mitigation measures [State of Vermont Agency of Transportation n.d.(b)]. The resilience score combines a vulnerability assessment that reflects a projectʼs vulnerability to damages from inundation, erosion, or depositional processes and a criticality score that reflects the consequences of failure (e.g., failed trips and delay or lost access) (SLR International Corporation 2022).
4.1.4 Readiness Criteria
Since many transportation projects can take a long time to realize, project success is subject to uncertainty around future funding availability as well as the outcomes of environmental and permitting processes. To account for this, some organizations explicitly incorporate readiness criteria into project evaluation and selection. For example, in developing its TIP, the Atlanta Regional Commission collects a range of information in order to assess “project deliverability.” This includes information on the status of environmental screening and impact analysis, design, budget, and schedule (Atlanta Regional Commission 2024). Similarly, U.S. DOT evaluates discretionary funding applications for readiness (U.S. DOT n.d.).
4.2 Tracking Trends
Identifying and tracking trends upon which plan success depends can help control for uncertainties in how these trends will develop. This section describes steps for tracking trends and setting thresholds at critical points so that the agency can take action to mitigate negative effects, course correct, or realize opportunities. This section uses the term “thresholds” instead of “targets” to avoid confusion with target setting around system performance. The research team envisions tracking trends as a form of implementation that follows a long-range planning activity sought to analyze sources of uncertainty. The steps described in this section could be used in the planning process, during program and project implementation, and at regular intervals for performance reviews and updates.
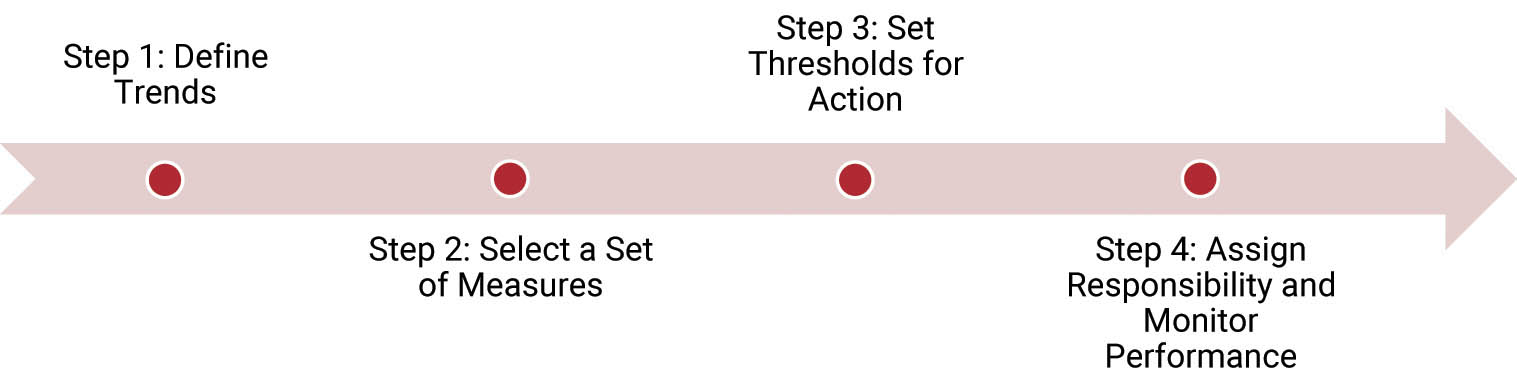
This section is organized around a series of sequential steps shown in Figure 21.
4.2.1 Step 1: Define Trends
In this step, the plan team identifies the key trends upon which plan success depends and the level of uncertainty associated with each. If scenario planning, risk assessment, or similar analyses have been conducted, these may provide a starting list of notable trends and their relevance or potential effects on transportation outcomes.
Long Description.
The flowchart depicts a sequence of steps for tracking trends. It starts with Step 1: define trends, followed by Step 2: select a set of measures. The next step is Step 3: set thresholds for action, and finally, Step 4: assign responsibility and monitor performance. Each step is represented by a point on a horizontal arrow, indicating the progression from one step to the next.
Given the inherent uncertainty in forecasting, the purpose of defining trends is to understand, track, and manage changes over time. Trends of interest may affect the physical transportation system either tangibly or operationally (e.g., extreme weather events, changes in travel demand on the system as a whole or key portions of the system, or new vehicle technology and adoption), or they may affect the ability of agencies and their partners to respond effectively (e.g., priorities of elected and appointed leaders, changes in agency revenue, partnersʼ actions or inactions, or legislative changes). Tracking is a way of acknowledging that these factors can be hard to predict and may diverge from historical patterns. Moreover, if significant changes do happen, they can influence observed transportation performance and the data collected for performance management. For example, a sudden economic decline can drastically decrease ridership, which can lead to misinterpretation of performance data if not properly contextualized.
Some sources of uncertainty may be within an agencyʼs realm of influence, while others are largely beyond it. Assessing this can help determine the appropriate goals and actions related to tracking over time. In some cases, a transportation agency may seek to change the course of the trend if the agency has adequate influence (within the agencyʼs physical, financial, and legal abilities). In other cases, the goal may be to develop mitigating actions if the agency has limited influence; the goal may also be to course correct the plan or take advantage of opportunities presented by the evolution of the trend. The goal of any action should be to reinforce the agencyʼs ability to achieve its transportation goals.
Mechanisms of Influence
Transportation agencies have a wide range of mechanisms available to them that can influence outcomes and support adaptation in the face of changing trends. Some examples include:
- Capital investment,
- Operations and maintenance funding,
- Development of design and operations standards,
- Regulation of service providers,
- Land-use planning coordination,
- Project prioritization and programming,
- Project management and oversight,
- Public and stakeholder engagement,
- Partnership building,
- Research and development, and
- Pilot programs.
To identify relevant trends to track, proceed through the following:
- Develop a list of uncertainties. These may come from existing plans and documents. They should include items directly related to the transportation system as well as the broader sociodemographic and economic context. See Section 2.2: Guided Self-Evaluation and Reflection: Sources of Uncertainty for additional support on deciding where to focus.
- Outline the degree to which agency goals and plan success may be influenced by the trend and associated uncertainty. This may be informed by qualitative or quantitative analysis and forecasting efforts conducted within a prior planning effort, as described in Section 3.3: Methods for Analyzing Uncertainty.
- Assess the level of influence that the agency has on each uncertainty, noting which mechanisms of influence are most relevant. See the “Mechanisms of Influence” sidebar for examples.
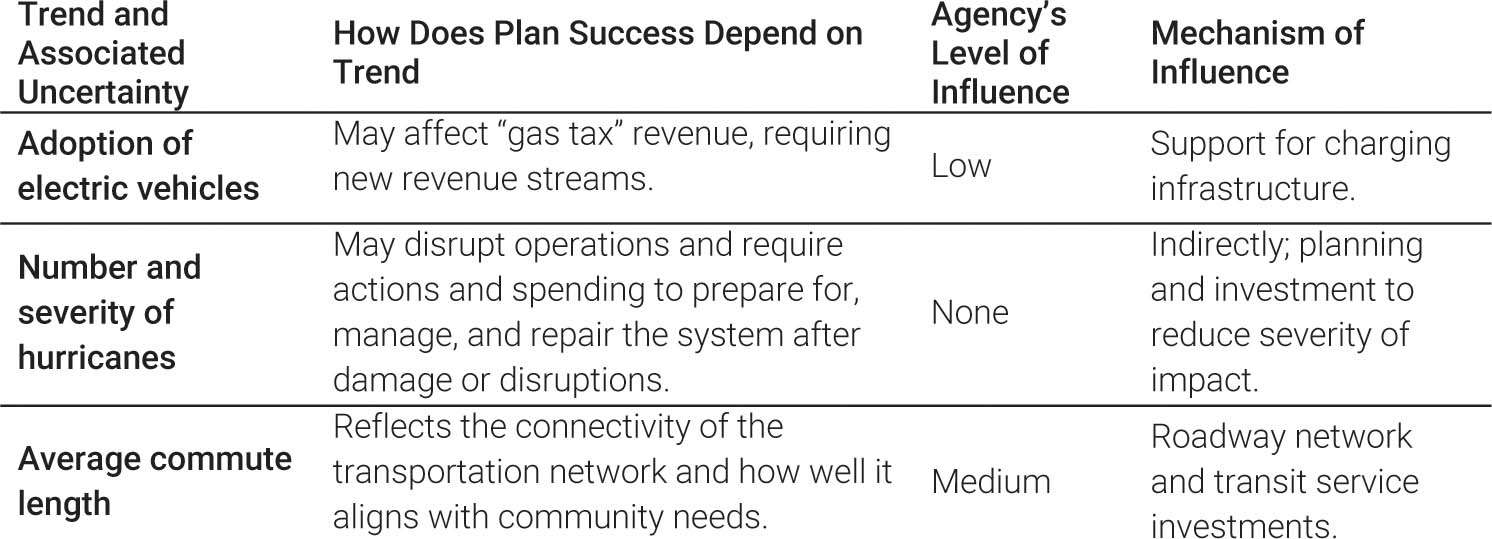
Table 30 provides a structure through which trends may be identified and provides several examples. This exercise will be most successful if it involves people with multiple areas of expertise within an agency.
Long Description.
The column headers are Trend and Associated Uncertainty, How Does Plan Success Depend on Trend, Agency’s Level of Influence, Mechanism of Influence. The data given in the table rows are as follows:
Row 1: Adoption of electric vehicles: May affect ‘gas tax’ revenue, requiring new revenue streams; Low; Support for charging infrastructure.
Row 2: Number and severity of hurricanes: May disrupt operations and require actions and spending to prepare for, manage, and repair the system after damage or disruptions; None; Indirectly, planning and investment to reduce the severity of impact.
Row 3: Average commute length; Reflects the connectivity of the transportation network and how well it aligns with community needs; Medium; Roadway network and transit service investments.
Resource. The U.S. DOTʼs Bureau of Transportation Statisticsʼ Transportation Economic Trends includes information and data about macroeconomic trends and how they relate to the transportation system and its associated industries (U.S. DOT Bureau of Transportation Statistics n.d.).
4.2.2 Step 2: Select a Set of Measures
Measures track the evolution of the trends that have been identified and can be used to evaluate the impacts of investment decisions, macro trends, and uncertainty effects after the conclusion of a given planning effort. If possible, agencies should seek to select at least one measure for each important trend. Sometimes more than one measure may be needed to describe different aspects of the trend.
The following steps support selecting measures:
- Inventory existing measures.
- When selecting measures, it is useful to start with the measures that the agency already uses to avoid creating redundant measures and make the best use of those that are already in practice.
- Review previous planning efforts, agency-level reporting, internal tracking and decision-making documents, and investment decisions and extract the metrics and measures used.
- Determine if the data sources used are still available and whether any changes or additions to quality or coverage have been made.
- Assess gaps in existing measuresʼ coverage of trends.
- Once existing measures are inventoried, assess their alignment with the identified trends and identify gaps where no existing measure corresponds with a trend.
- Compare phenomena described by existing measures to the agencyʼs mission, goals, and objectives, as well as priority areas of uncertainty.
- Where there are significant overlaps between measures, determine if they can be combined or made more distinct.
- Where there are mission elements, goal areas, or objectives or priority areas of uncertainty that are not described in the existing set of measures, determine if there are new measures that could describe those elements.
- Select a set of measures.
- Carry forward measures that continue to meet agency needs. Maintaining some level of core continuity in measures can help with longer-term monitoring and learning and support future after-action analysis.
- Develop new measures to fill the gaps. New measures also may replace an existing measure if it is likely to be discontinued or is not adequate as a measure.
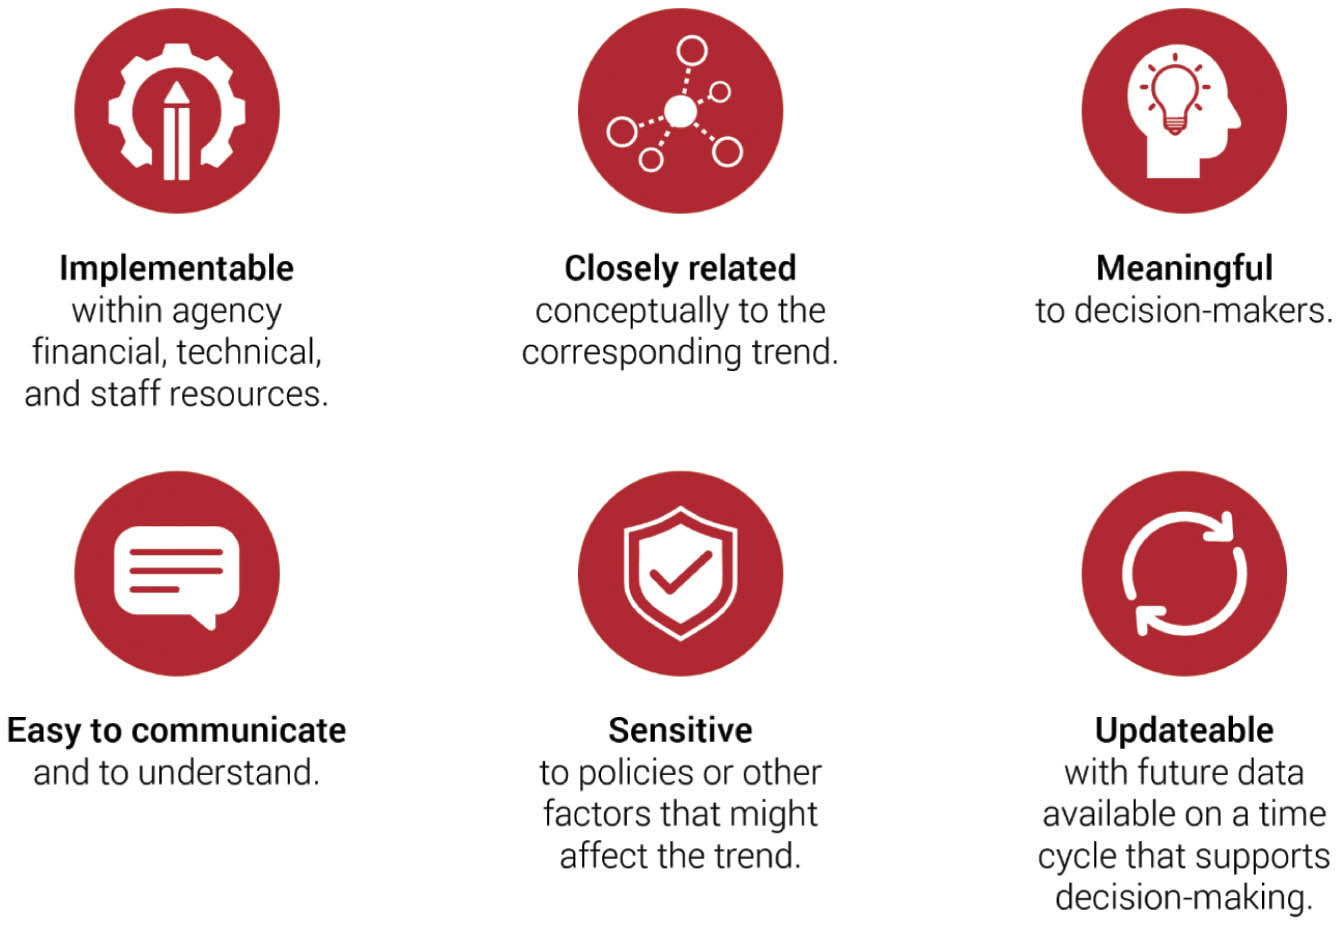
- In selecting measures, consider the factors of successful tracking measures shown in Figure 22.
 Challenges from uncertainty. Uncertainty introduces additional challenges into the existing context of performance management. Major changes in factors such as technology, the economy, natural or manufactured disasters, or public behavior can render existing transportation performance measures unreliable in predicting future performance. However, agencies may be better prepared to identify and learn from these shifts if they are collecting data on both major sources of uncertainty and transportation outcomes as well as if they are able to view and interpret these data together.
Data sources themselves can also change and evolve over time, meaning that agencies may need to adjust measurement or interpretation over time. This is especially true for emerging trends. For example, reliable data may not be readily available to assess the impact of bike-sharing programs on ridership or congestion, so indicators may be limited to sources that are currently available but are imperfect, imprecise, or unreliable. In response, it may be appropriate for agencies to coordinate internally or externally to invest in creating or collecting new data.
Long Description.
The infographic presents six characteristics of successful tracking measures. Each characteristic is represented by an icon and a brief description. ‘Implementable’ is shown with a gear and pencil icon, and says implementable within agency financial, technical, and staff resources. ‘Closely related’ features a network icon, and says closely related conceptually to the corresponding trend. ‘Meaningful’ is depicted with a head and lightbulb, and says meaningful to decision makers. ‘Easy to communicate’ uses a speech bubble, and says easy to communicate and to understand. ‘Sensitive’ is represented by a shield with a check mark, and says sensitive to policies or other factors that might affect the trend. ‘Updateable’ is shown with a circular arrow, and says updateable with future data available on a time cycle that supports decision making.
4.2.3 Step 3: Set Thresholds for Action
This section discusses how to set thresholds that cause an agency to take action. These thresholds often represent an amount of change in the trend that could threaten the agencyʼs ability to fulfill its mission or achieve the future envisioned by the plan. Conversely, they could represent new opportunities becoming available. These thresholds may align with targets that agencies set under state or federal regulations, but they will often be different since the thresholds do not necessarily represent a desired outcome.
Thresholds for Action
Setting thresholds ahead of time can allow an agency to prepare for potential future action if conditions and trends substantively change.
The following steps support setting thresholds:
- Conduct analysis that provides decision-makers with the context for the possible futures the agency may face. Methods may include the following (see Section 3.3: Methods for Analyzing Uncertainty for more detail):
- Scenario planning. Conduct analysis on a set of discrete alternative future scenarios representing different configurations of the environment within which the agency will be working (e.g., demographic or economic changes, new technology adoption, federal policy or funding changes, or environmental changes).
- Exploratory modeling and analysis. Use a systematic approach to sensitivity analysis on broad ranges for each input. Identify patterns across many potential futures to guide decision-making toward choices that will perform the best in the greatest number of possible future circumstances.
- Stakeholder or expert feedback. When quantitative data is not available, or its frequency or detail is low, qualitative information can be gathered from stakeholders, experts, or even groups made up of the general public. Their assessment of conditions and their progression over time can help fill in gaps in more quantitative datasets.
- Assign thresholds for each measure. These thresholds delineate when data measurements would catalyze agency action and what that action may include. For example, when fatalities rise by a certain percentage year over year, the agency may reevaluate its safety investment strategies. The threshold should include:
- A quantitatively determined value (could be a number, percent, or rate of change) and whether it is an upper or lower bound.
- A description of how the value was chosen and what it is intended to signify.
- Notes on data sources and review frequency.
- Decide what actions to take if the threshold is crossed.
- The actions should allow the agency to respond to or mitigate a situation to keep the plan on track or to take advantage of new opportunities.
- Appropriate actions might include changing levels of funding targeted at a particular issue, fast-tracking a specific analysis or strategy, reprioritizing a list of projects, updating relevant agency policies, or convening a “response team” of experts or partners.
Resources. The following resources provide additional information:
NCHRP Report 551: Performance Measures and Targets for Transportation Asset Management offers a guide to metric and measure selection (Cambridge Systematics, Inc. et al. 2006).
NCHRP Research Report 1035: Guide to Effective Methods for Setting Transportation Performance Targets reviews best practices for measure selection, target setting, system monitoring, and related collaboration (Grant et al. 2023).
NCHRP Research Report 993: Managing Performance to Enhance Decision-Making: Making Targets Matter is a guide to effectively connecting data through organizational pathways to communicate performance to decision-makers and the public (Batista et al. 2022).
The FHWA TPM Policy and Guidance page has resources related to federally required performance management that can be applied to other aspects of performance monitoring and target setting (FHWA n.d.).
4.2.4 Step 4: Assign Responsibility and Monitor Performance
Now that thresholds have been set, the agency should follow through with tracking the trends to make sure that the associated measures do not cross the thresholds or, if they do, initiate the previously decided changes or actions.
The following steps support the assignment of responsibilities and monitoring of performance:
- Assign responsibilities to monitor measures, ensuring that relevant management is aware of the distribution of those responsibilities. The office or offices within the agency that are assigned responsibility should be able to:
- Collect data from many parts of the agency and from outside sources.
- Have the technical ability to use the data to calculate measures and track their changes over time.
- Communicate with agency leaders and decision-makers so that they are notified if thresholds are crossed.
- Share the actions that the plan has specified should thresholds be crossed.
- Begin tracking metrics for the new performance measures set.
- When responsibility is assigned, determine a frequency for updating the measures and reporting results and identify a venue in which the information will be shared.
- Trends that change more slowly can generally be reported less frequently than trends that change more quickly.
- If the trend moves beyond the threshold, it should initiate the actions previously selected by the agency.
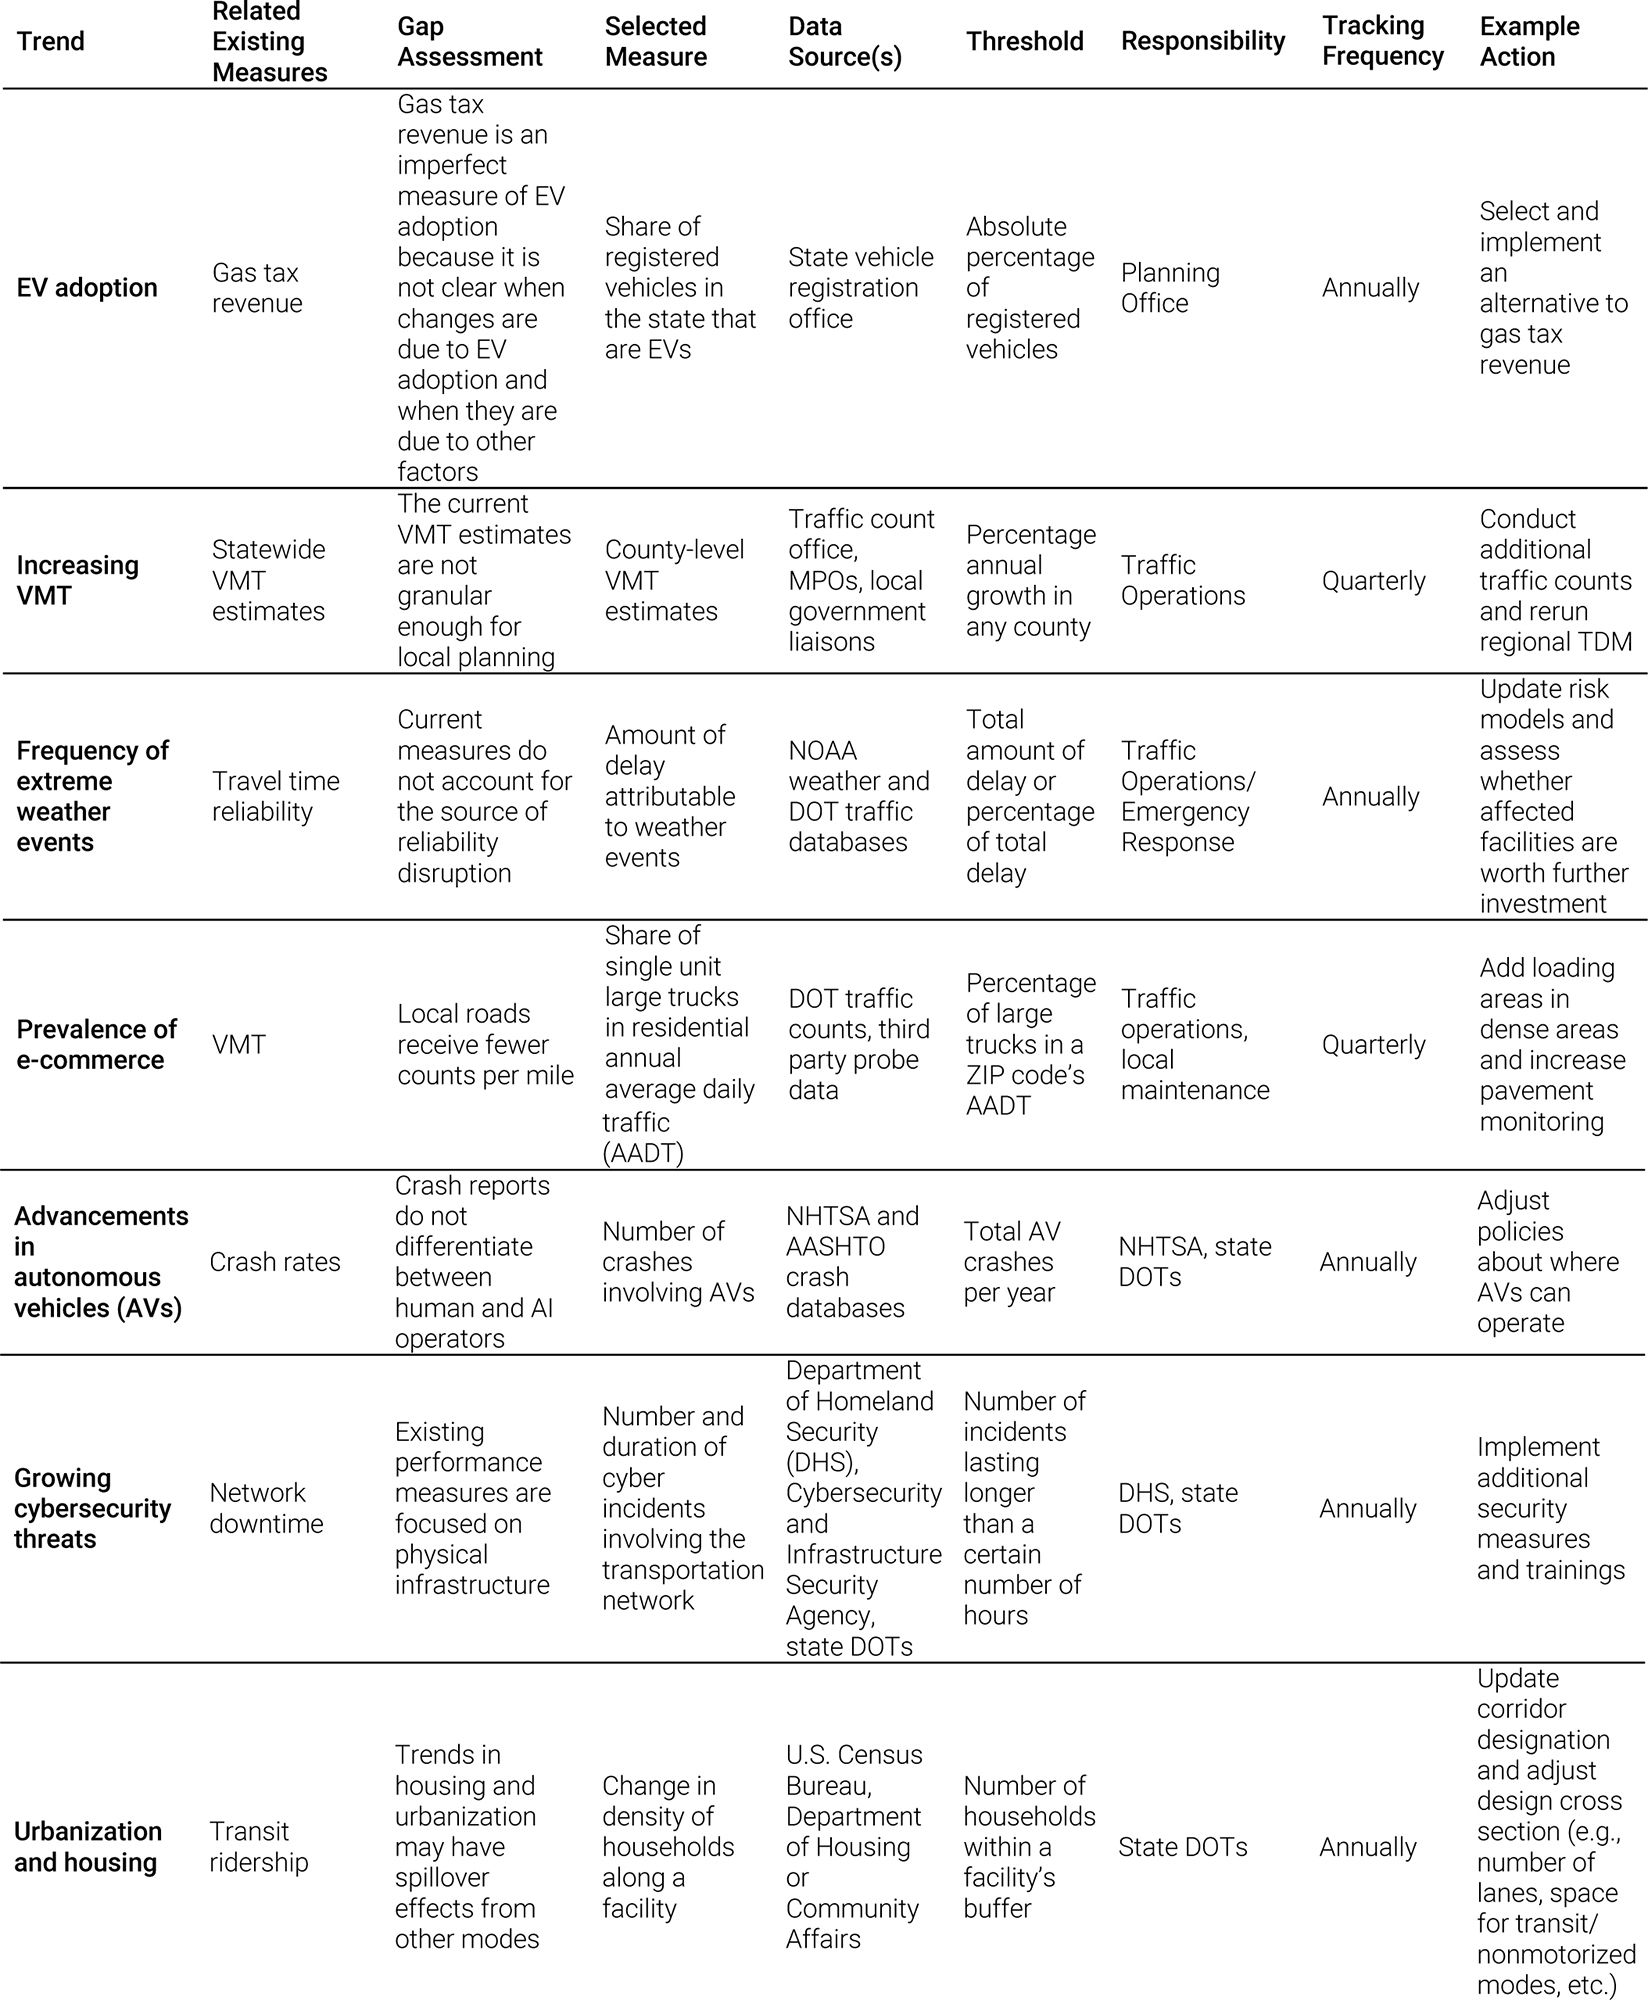
Table 31 shows a table filled in with example measures that can guide an organization through gathering the information needed to designate these trends and thresholds.
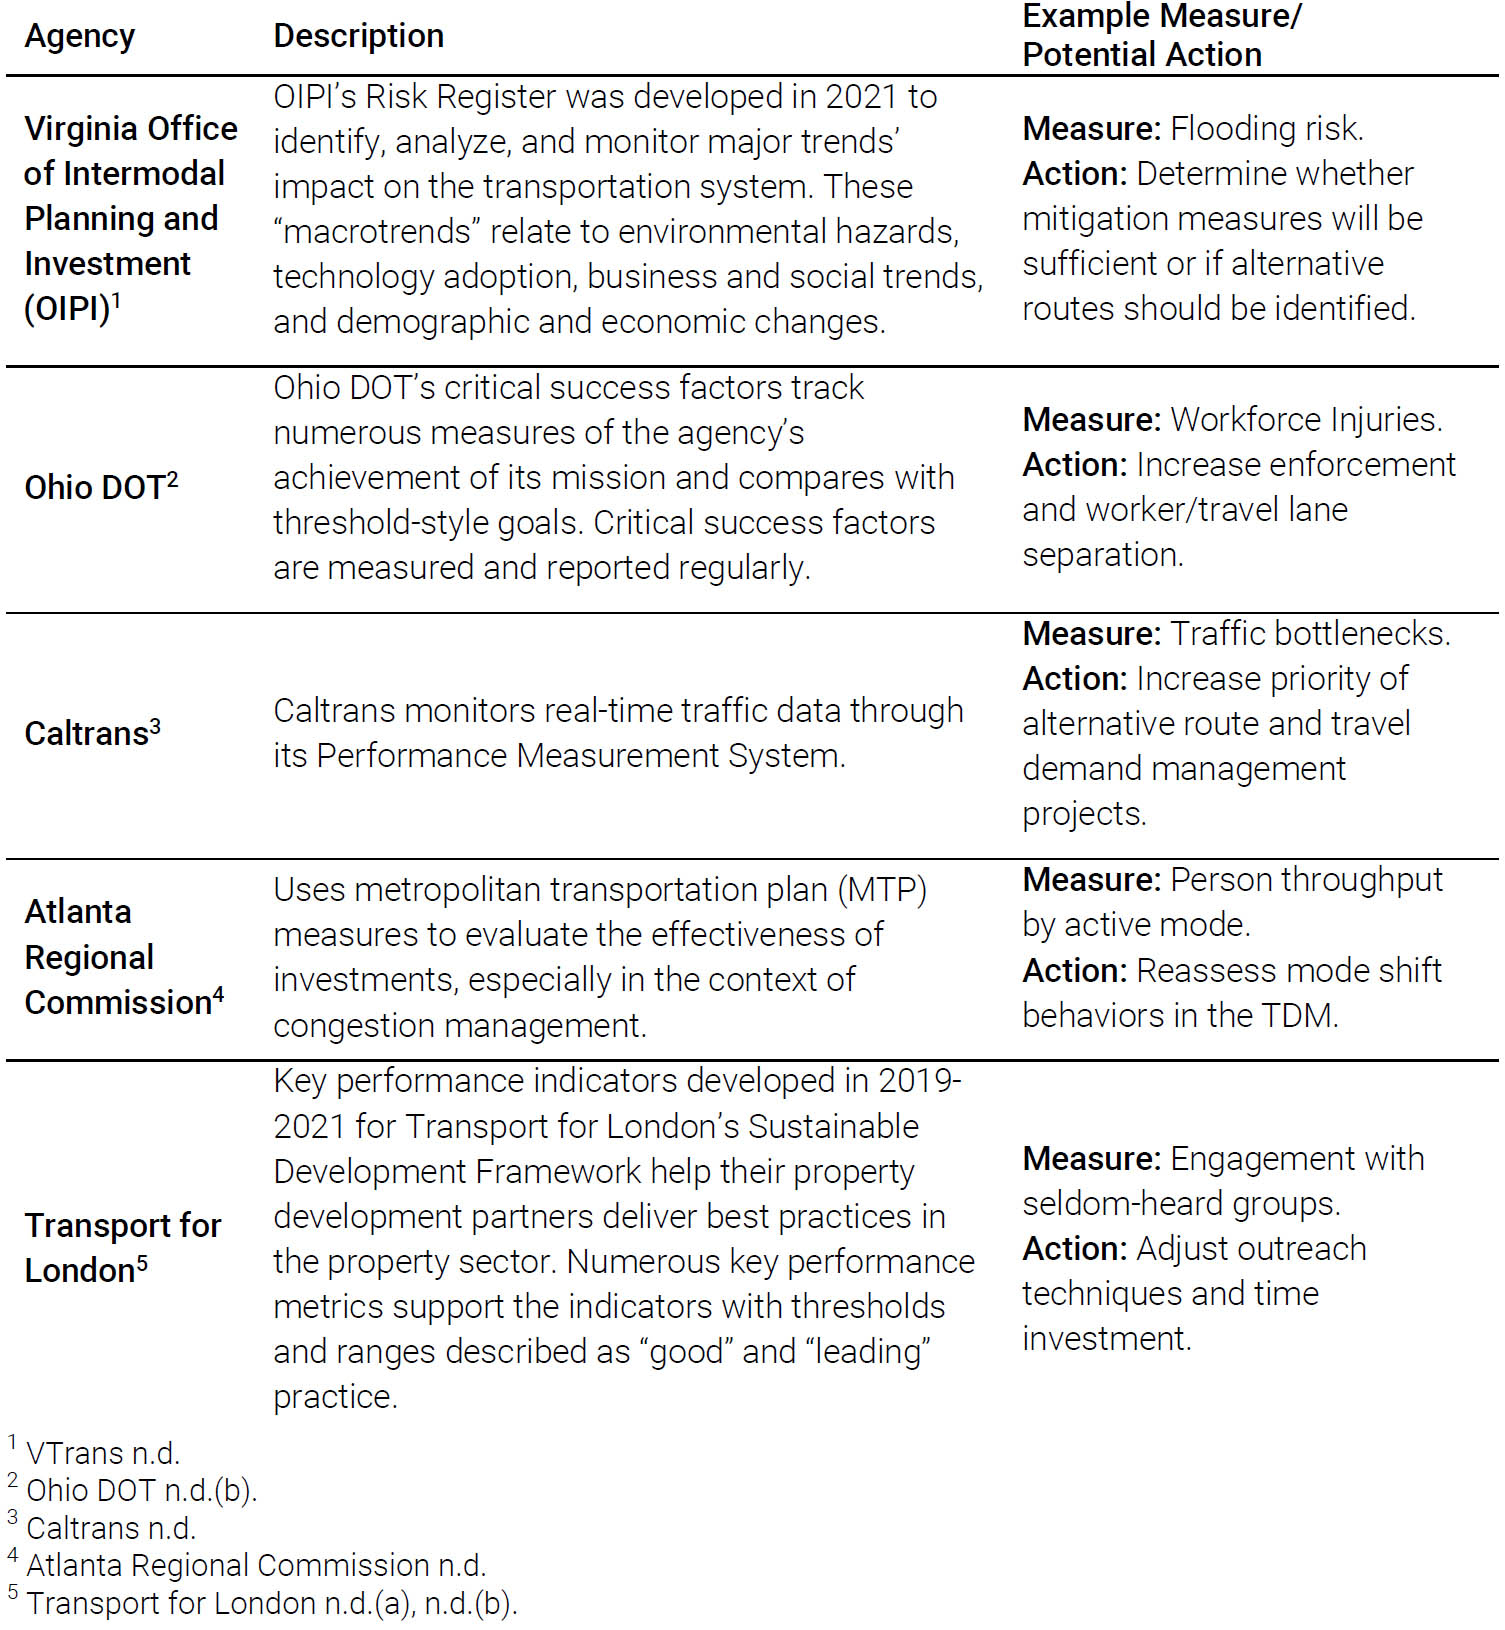
Table 32 provides examples of other agenciesʼ tracking metrics, including a brief description, the measure being tracked, what action(s) the agency associated with trends in that measure, and links to source material for further reading. Note that this research did not identify any agencies that had set specific thresholds for transportation measures that would trigger specific actions by the agency or its partners, but that setting thresholds for action would be an extension of current approaches to measures tracking.
Long Description.
The column headers are Trend, Related Existing Measures, Gap Assessment, Selected Measure, Data Source(s), Threshold, Responsibility, Tracking Frequency, Example Action. The data given in the table rows are as follows:
Row 1: EV adoption: Gas tax revenue; Gas tax revenue is an imperfect measure of EV adoption because it is not clear when changes are due to EV adoption and when they are due to other factors; Share of registered vehicles in the state that are EVs; State vehicle registration office; Absolute percentage of registered vehicles; Planning Office; Annually; Select and implement an alternative to gas tax revenue.
Row 2: Increasing VMT: Statewide VMT estimates; The current VMT estimates are not granular enough for local planning; County-level VMT estimates; Traffic count office, MPOs, local government liaisons; Percentage annual growth in any county; Traffic Operations; Quarterly; Conduct additional traffic counts and rerun the regional TDM.
Row 3: Frequency of Extreme Weather Events: Travel time reliability; Current measures do not account for the source of reliability disruption; Amount of delay attributable to weather events; NOAA Weather and DOT Traffic databases; Total amount of delay or percentage of total delay; Traffic Operations or Emergency Response; Annually; Update risk models and assess whether affected facilities are worth further investment.
Row 4: Prevalence of E-Commerce; Vehicle Miles Traveled; Local roads receive fewer counts per mile; Share of single unit large trucks in residential annual average daily traffic (AADT); DOT traffic counts, 3rd party probe data; Percentage of large trucks in a zip code’s AADT; Traffic operations, local maintenance; Quarterly; Add loading areas in dense areas and increase pavement monitoring.
Row 5: Advancements in Autonomous Vehicles (AVs); Crash Rates; Crash reports do not differentiate between human and AI operators; Number of Crashes involving AVs; NHTSA and AASHTO crash databases; Total AV crashes per year; NHTSA, State DOTs; Annually; Adjust policies about where AVs can operate.
Row 6: Growing Cyber Security Threats: Network Downtime; Existing performance measures are focused on physical infrastructure; Number and duration of cyber incidents involving the transportation network; Department of Homeland Security (DHS), Cybersecurity and Infrastructure Security Agency, State DOTs; Number of incidents lasting longer than a certain number of hours; DHS, State DOTs; Annually; Implement additional security measures and trainings.
Row 7: Urbanization and Housing; Transit Ridership; Trends in housing and urbanization may have spillover effects from other modes; Change in density of household along a facility; US Census Bureau, Department of Housing or Community Affairs; Number of households within a facility’s buffer; State DOTs; Annually; Update corridor designation and adjust design cross section (for example, number of lanes, space for transit or non-motorized modes, etc.);

Long Description.
The column headers are Trend, Related Existing Measures, Gap Assessment, Selected Measure, Data Source(s), Threshold, Responsibility, Tracking Frequency, Example Action. The data given in the table rows are as follows:
Row 8: Rise of Micromobility; Non-motorized safety metrics; Existing data focuses on traditional vehicles; Number of accidents involving micromobility modes; Public Health Agencies, NHTSA or AASHTO crash databases; Rate of change in accidents per year; Public Health Agencies, State DOTs; Annually; Adjust type and location of safety interventions.
Row 9: Fuel Price Fluctuation: Vehicles Miles Traveled; Geopolitical and other macroeconomic factors can impact prices without warning; Degree and time lag or lead between fluctuations and mileage or traffic volume; US Census Bureau, Bureau of Economic Analysis, US Department of Commerce; Quarterly level of fluctuation in fuel prices; US and State DOTs; Quarterly or Monthly; Lower fares or fees during periods of especially high economic stress.
Long Description.
The column headers are Agency, Description, Example Measure, or
Potential Action. The data given in the table rows are as follows:
Row 1: Virginia Office of Intermodal Planning and Investment (OIPI), note cue 1: OIPI’s Risk Register was developed in 2021 to identify, analyze, and monitor major trends’ impact on the transportation system. These “macrotrends” relate to environmental hazards, technology adoption, business and social trends, and demographic and economic changes; Measure: Flooding Risk, Action: Determine whether mitigation measures will be sufficient or if alternative routes should be identified.
Row 2: Ohio DOT, note cue 2: Ohio DOT’s critical success factors track numerous measures of the agency’s achievement of its mission and compare with threshold-style goals. Critical success factors are measured and reported regularly; Measure: Workforce Injuries, Action: Increase enforcement and worker or travel lane separation.
Row 3 : Caltrans, note cue 3: Monitors real-time traffic data through its Performance Measurement System; Measure: Traffic Bottlenecks, Action: Increase priority of alternative route and travel demand management projects.
Row 4: Atlanta Regional Commission, note cue 4: Uses metropolitan transportation plan (MTP) measures to evaluate the effectiveness of investments, especially in the context of congestion management; Measure: Person throughput by active mode, Action: Reassess mode shift behaviors in the TDM.
Row 5: Transport for London, note cue 5: Key Performance Indicators developed in 2019 to 2021 for Transport for London’ Sustainable Development Framework help their property development partners deliver best practices in the property sector. Numerous key performance metrics support the indicators with thresholds and ranges described as “good” and “leading” practice; Measure: Engagement with Seldom Heard Groups, Action: Adjust outreach techniques and time investment. Below the table: note cue
note cue 1: Vtrans no date.
note cue 2: Ohio DOT no date.
note cue 3: Caltrans no date.
note cue 4: Atlanta regional commission no date.
note cue 5: Transport for London no date A, no date B.
Example: Freight Traffic Trends in Kentucky
The Kentucky Transportation Cabinetʼs (KYTCʼs) Long-Range Statewide Transportation Plan (LRSTP), completed in 2022, is a policy-based plan developed through KYTCʼs first scenario-planning process. The LRSTP includes a decision matrix with if-then statements (Kentucky Transportation Cabinet n.d.). KYTC identified significant increases in truck traffic as a possible trend of interest that could introduce risks in the form of congestion and unreliable freight movement. KYTC also identified a need for new investments such as truck parking. To manage this source of uncertainty, the agency monitors trends in truck volumes and incorporates them into the Strategic Highway Investment Formula for Tomorrow (SHIFT) prioritization process. SHIFT priorities are updated every 2 years, allowing investment priorities to be responsive to shifts in freight traffic. In a workshop conducted during this project, KYTC staff also discussed integrating new Freight Analysis Framework forecast data and monitoring industry trends for sectors that rely on waterways or rail.
Resources. For more on data collection and management, see:
NCHRP Project 08-119, “Data Integration, Sharing, and Management for Transportation Planning and Traffic Operations,” is developing a guide to improve data practices in transportation agencies to increase data uniformity and foster collaboration with partners and the public. The National Operations Center of Excellence was developed as a result, and it operates a repository of data applications and related research efforts.
NCHRP Research Report 920: Management and Use of Data for Transportation Performance Management: Guide for Practitioners is organized around data life cycle stages. It discusses each step, critical choices, and provides a synthesis of key points that can be used to assess capabilities and identify opportunities for improvement (Harrison et al. 2019).
NCHRP Research Report 936: Guide to Ensuring Access to the Publications and Data of Federally Funded Transportation Research can be applied to support best practices in making appropriate data publicly available to partners and the community at large (Flannagan et al. 2020).
4.3 After-Action Analysis
After-action analysis can help an agency better manage uncertainty over time by building in mechanisms of feedback and learning into agency planning. After-action analysis can reveal opportunities to enhance the effectiveness of agency planning by examining follow-through and providing insight into whether strategies and actions had their intended effects.
This section addresses two main components of after-action analysis: (1) plan implementation, in which actions are taken and then monitored based on existing strategies or policies and (2) ex-post analysis, in which the planʼs effects and effectiveness are analyzed.
4.3.1 Plan Implementation
Implementation plans provide a mechanism for coordinating steps that should take place following plan completion. By providing additional specificity, accountability, and a plan for tracking, implementation plans can reduce the gap between “what we said we would do” and “what actually gets done.” This is important for managing uncertainty both because implementation is key to any strategyʼs success, including those related to addressing uncertainty, and because agency capacity and follow-through over time is itself a source of uncertainty around the effectiveness of plans.
Implementation plans flow out of the rest of the planning process and are informed by a planʼs vision, goals, and objectives; strategies produced through plan analysis; other existing plans; and public and stakeholder involvement. These efforts produce a series of proposed actions, policies, and strategies.
The following steps support plan implementation:
- Inventory the proposed actions, strategies, and policies that the plan has developed. Sometimes it is useful to group actions by the agency policy or strategy that they support.
- Assign responsibility for each action to a person, team, or office within the agency.
- Describe other key characteristics to help guide implementation, such as a priority level, key implementation partners, a rough implementation timeline (e.g., 1–4 months), and approximate cost (either monetized or qualitatively assessed as “high,” “medium,” or “low”).
- Regularly track and enforce implementation, ideally at a high level within the agency and using the timeline prescribed in the implementation plan.
Table 33 shows a structure that can serve for organizing implementation actions.
Engaging with uncertainty may also influence the structure within which actions are developed. An example of this is outlined in the text box that follows.
Example: Frameworks for Defining Actions to Address Uncertainty
Ohio DOT used scenario planning in developing Access Ohio 2045. Following plan completion, the DOT also developed an implementation plan with actions categorized into four areas:1
- Monitor. These are areas in which the department is already doing work and the level of effort is appropriate.
- Accelerate. The department is working in these areas, but there is more to be done.
- Launch. The department is not working on these items currently but needs to start soon.
- Defer. The department should continue to track these items, but there is no need to devote resources yet.
These categories reflect the temporal nature of uncertainty and differentiate between issues that require action now and those that have not yet reached maturity.
1 Additional information can be found in NCHRP Web-Only Document 440.

Long Description.
The column headers are: Action ID, Description of Action, Responsible Party, Key Partners, Timeline, Priority. The data given in the table-wise rows are as follows:
Row 1: T-1: Develop procedures for collecting and processing data on trends to be reported; Planning Division; Strategic Initiatives Team, IT Division; Within 4 months of plan completion; Medium.
4.3.2 Ex-Post Analysis
Ex-post analysis is a quantitative analysis of desired outcomes, looking backward in time to identify the impacts or portions of impacts that resulted from an agencyʼs plans, projects, or actions. Agencies collect data about outcomes of multiple intentionally selected plans, projects, or actions to determine whether they produced the desired benefits or had unintended effects. Examining this set of plans, projects, and actions can reveal areas of uncertainty that caused outcomes to deviate from what was expected, allowing the agency to determine how to better account for these uncertainties in the future.
Plan, Do, Check, Act (PDCA; “The Deming Loop”)
PDCA is a well-known strategic management framework developed by W. Edwards Deming that builds on prior work by Walter A. Shewhart.
PDCA has been used for decades to determine if strategies are useful in effecting desired outcomes and allows planners to adapt and update plans accordingly using the frameworkʼs “closed loop” feedback process.
Ex-post analysis falls within this tradition of monitoring outcomes from implementing a plan so that adaptation and continuous improvement are enabled.
The following steps support ex-post analysis:
- Define the objective of performing ex-post analysis. Determine if there is a specific aspect of planning that the agency is seeking to improve, such as forecasting accuracy or project selection.
- Select projects or policies to evaluate. Select a sample of past plans, projects, or agency actions that will be evaluated within the ex-post analysis. These should be related to the objective from Step 1 and ideally cover a range of geographies, project sizes, and types.
- Assess data maturity levels. Ensure that the data about these projects, plans, or actions is complete, available, and detailed enough to perform the analysis. This includes inventorying the data that is available. The types of data shown in Figure 23 may be needed often. If the data are not adequate for ex-post analysis, establish processes to collect better data in the future.
- Perform ex-post analysis. Use the gathered data to conduct a thorough retrospective analysis of each project or policy. Evaluate the accuracy of initial forecasts and assumptions, assess the factors that contributed to project success or failure, and identify any sources of uncertainty that were not adequately accounted for during the planning phase. Changes in performance should be related to actions taken because of a plan or project rather than general variations caused by external factors. Thus, it is important to recognize and account for external factors.
Statistical analysis may help to evaluate the change in performance and outcomes and identify causative and correlative links. However, oftentimes an impact cannot be isolated to a

Long Description.
The chart outlines four categories of information essential for ex-post evaluation: work completed, anticipated benefits, project context, and measuring outcomes. ‘Work Completed’ asks: Are there adequate scopes to categorize projects? Is there good historically archived information about what was actually done? ‘Anticipated Benefits’ asks: What were the expected outcomes? Are there plans or analyses of anticipated benefits? ‘Project Context’ asks: What external factors could have affected outcomes? Are there data on these so that the effect of the action can be isolated? ‘Measuring Outcomes’ includes subjective assessment, cross-sectional data (one-time observations) comparing treated to untreated locations, and longitudinal data showing before and after changes.
single cause. Therefore, effects should be evaluated at the network or community scale rather than the facility or individual scale.
If the analysis is occurring at the programmatic level, this is an opportunity to examine relationships between funding allocation, project performance, and outcomes. These analyses evaluate questions such as whether funding was distributed in accordance with agency goals or if budget constraints or cost overruns affected outcomes. Analysis at the program level may also compare the impacts of modal splits on community outcomes (e.g., did a roadway or transit project have a greater positive influence on quality of life?) or the degree to which investment aligned with other entitiesʼ resource allocations (e.g., were the DOT and MPO able to take advantage of investment collocation temporally or spatially?).
- Identify lessons learned. Identify the trends and patterns in plans, projects, or actions realizing their expected benefit while others did not. What could have been done differently to better predict the actual effects of the plan, project, or action? This process will often require expertise and input from different divisions or individuals within an agency.
- Make suggestions for accounting for uncertainty in the future. What changes could the agency make to better account for uncertainty? For example, are there changes in modeling methodologies, decision-making processes, forecasting, project prioritization, or implementation strategies?
Challenges and learning over time. Ex-post analysis requires data that may not have been collected at all or, if collected, may be inconsistent, incomplete, or subjective. Additionally, transportation agencies plan, implement projects, and take actions in a context with many other factors that can affect outcomes. There are methods to account for external factors. These can require significant time and expertise as well as sufficiently large datasets and data on other influencing factors. Because of these challenges, transportation agencies likely need to build up their capacity for ex-post analysis over time, including data collection/management and analysis skills. To prioritize resources, an agency may also choose to engage and prioritize an identified “problem area” where they seek specific learning and insights. In this context, it may be helpful first to gather experts to create a mental map or a set of hypotheses connecting planned actions to outcomes. This can then be used to guide further investigation and data collection.
Resources. The following are additional resources for ex-post analysis:
NCHRP Synthesis 528: Analyzing Data for Measuring Transportation Performance by State DOTs and MPOs summarizes practices of performance measurement, which can be useful for collecting data for ex-post analysis (Vandervalk 2019).
Ex-Post Assessment of Transport Investments and Policy Interventions by the International Transport Forum provides additional details on ex-post evaluation and summarizes approaches and tools that can assist (Worsley 2015).
NCHRP Project 08-170, “Closing the Loop: Post-Implementation Evaluation of Transportation Projects,” will develop a guide and toolkit for evaluating project and program impacts across a wide range of settings and investment types.


