Mechanisms to Address Off-Airport Obstructions (2026)
Chapter: 3 Survey Results

CHAPTER 3
Survey Results
This chapter presents the results of the survey on off-airport obstructions, the practices airports use, and the mechanisms various airports employ to address them. Survey responses are consolidated into topics, and sections in this chapter include:
- Survey Overview
- Local, State, and Federal Support
- Notification of Construction Activity
- Outreach and Communication
- Cost of Addressing Obstructions
- Amount/Number of Obstructions
- Funding
- Impacts
- Challenges to Implementation
The surveyʼs quantitative results are presented in tables and figures as appropriate. The survey is provided in Appendix A, and the responses are provided in Appendix B. While the survey was intended to cover issues related to obstructions, some questions allowed respondents to provide additional information. Many of those responses are summarized in this section, as well as the full responses in Appendix B. Additionally, some terminology in the survey may have different interpretations among respondents; for example, “Task Force” was listed as a formal outreach method but left to respondents to interpret as they understood it.
Survey Overview
A total of 305 airports were contacted to participate in the survey, with 68 responses ultimately recorded. Table 1 presents the breakdown of surveys sent and completed by airport classification. Respondents did not have to answer every question, so the total number of responses varied by question. The “Other” category includes surveys completed that did not list their airport in one of the provided categories; further investigation found they were general aviation airports and that some managers oversee multiple types of airports. Most respondents were from Non-Hub Primary airports, which accounted for 36 of the total responses. This distribution provides useful context for interpreting the survey findings: Small, Non-Hub airports had more surveys, but the percentage of completed surveys is consistent across classifications.
Most respondents were airport directors and executive directors, and 15 were managers responsible for multiple airports who completed the survey for more than one airport.
Airports reported dealing with a variety of obstructions (Figure 3) from vegetation, trees, buildings, towers, and other structures. They were given options in the survey to detail other

Long Description.
The column headers of the table are hub type, number of airports in the NPIAS asterisk, number of surveys sent, number of completed surveys, and completed surveys; percentage. The data given in the table row-wise are as follows: Row 1: Large hub: 31; 30; 5; 17 percent. Row 2: Medium hub: 33; 30; 6; 20 percent. Row 3: Small hub: 73; 69; 14; 20 percent. Row 4: Non-hub: 252; 191; 36; 19 percent. Row 5: Other: Blank; 0; 7; blank. Asterisk is national plan of integrated airport systems.

Long Description.
The pie chart illustrates the distribution of five categories: Vegetation (trees) [23 percent, 21]; other please describe [15 percent, 14]; other structures [23 percent, 21]; towers [17 percent, 16]; buildings [22 percent, 20].
common obstructions at the airport. The Small and Non-Hub airports responded more consistently across the obstruction types, while the Large and Medium Hub airports were more likely to have building/tower/structure issues. From the “Other” category, airports indicated some other objects of concern, such as:
- Cranes/construction cranes—8 airports
- Utility poles—2 airports
- Wind turbines—2 airports
- Wildlife attractants—1 airport
- Plumes—1 airport
- New construction—1 airport
Local, State, and Federal Support
Table 2 summarizes the distribution of responses to survey questions 3 through 7, focusing on local authority for airspace protection and the use of FAA resources for obstruction management. Overall, 43 responses, or 69% of responding airports, indicated that their state provides local governments with the authority to adopt and enforce airspace protection measures. However, awareness of this authority varied across airport types. Among Non-Hub airports, 5 of 30 Non-Hub respondents (17%) reported not knowing whether their state provided such authority.

Long Description.
The column headers of the table are questions, yes, no, and do not know. The data given in the table row-wise are as follows: Row 1: Does your state authorize local governments to adopt airspace protection? 69 percent (43); 5 percent (3); 25 percent (16). Row 2: Does your state require local governments to adopt airspace protection (height and or land use protection)? 42 percent (26); 29 percent (18); 30 percent (18). Row 3: Does your state aviation agency offer services or support to help your airport address obstruction issues (for example, site visits, GIS tools, web portals, or similar resources)? 56 percent (34); 44 percent (27); 0 percent (0). Row 4: Does your airport leverage FAA resources for support of obstruction removal or mitigation management (for example, O E slash AAA database, RAM tool, A slash Cs, FAA contacts)? 86 percent (51); 14 percent (8); 0 percent (0). Row 5: Does the airport engage in formal outreach efforts to inform stakeholders and landowners around the airport about items such as zoning, obstructions, construction, vegetation growth, alterations, and so on? 75 percent (43); 25 percent (14); 0 percent (0).
Levels of uncertainty were even higher among Medium Hubs (40%, 2 of 5 respondents) and Small Hubs (29%, 4 of 14 respondents), while 20% (1 of 5 respondents) of Large Hub respondents reported being unaware.
In addition to regulatory authority, question 6 explored the use of external resources to assist in obstruction mitigation. Eighty-six percent of airports (59 respondents) reported actively leveraging FAA resources to support the identification, removal, or management of obstructions. One hundred percent (5 of 5 respondents) of Large Hub and 100% (13 of 13 respondents) of Small Hub (Figure 4) stated they use FAA resources such as the OE/AAA database, RAM tool,

Long Description.
The x-axis represents values ranging from 0 to 25 in increments of 5. The y-axis includes hub types such as large hub, medium hub, small hub, and non-hub primary. The graph consists of ‘Yesʼ and ‘Noʼ responses. The data given in the graph are as follows: Large hub: yes: 5; no: 0. Medium hub: yes: 3; no: 1. Small hub: yes: 13; no: 0. Non-hub primary: yes: 27; no: 6. The survey has 59 responses. The values given in the graph are accurate.
Advisory Circulars, or FAA contacts. Among Medium Hubs and Non-Hubs, the reported use of FAA resources was slightly lower: 75% (3 of 4 respondents) and 82% (27 of 33 respondents), respectively. These findings highlight that while most airports recognize and utilize FAA support services, there may still be gaps in resource engagement at certain airport sizes.
Of the 34 responses (56%) from airports that reported receiving state support to address obstruction issues, 22 indicated support through site visits, while 11 reported support via GIS. Only two airports stated that they receive support through a state-managed software system. Additional forms of support reported by other airports included:
- Use of Pavement Condition Index (PCI) data
- Funding assistance
- Enforcement of regulatory measures such as the “Tall Structures Act”
- Reviews and comments on land use compatibility with surrounding airports
- Review of FAA determinations for general aviation airports
- Drone mapping services
- Obstruction surveys of runway approaches.
Question 7 showed that 43 of 57 respondents (75%) indicated that their airports conduct formal outreach to communicate with landowners and stakeholders on key issues such as obstructions, zoning regulations, new construction, vegetation growth, and other alterations that could affect airspace safety. Among airport categories, all Large Hubs (5 out of 5 respondents) reported implementing formal outreach programs. Among the other hub types, 75% of Medium Hubs (3 of 4 respondents), 77% of Small Hubs (10 of 13 respondents), and 69% of Non-Hub airports (22 of 32 respondents) reported using formal outreach to engage external stakeholders.
Figure 5 shows that among the 51 airports that reported using FAA resources for support, 41 responses (80%) indicated they use the OE/AAA database, and 41 responses (80%) indicated they use Advisory Circulars, which was followed by 37 responses (73%) using OE/AAA website tools, and 33 responses (65%) reporting the use of FAA regional personnel, division personnel, or other FAA contacts. The FAAʼs RAM tool and other regulatory documents were each cited by 21 of the respondents (41%).
When assessing usage by hub type, the percentages were consistent with the aggregate group, with OE/AAA and Advisory Circulars as the most common, followed by FAA regional staff as a
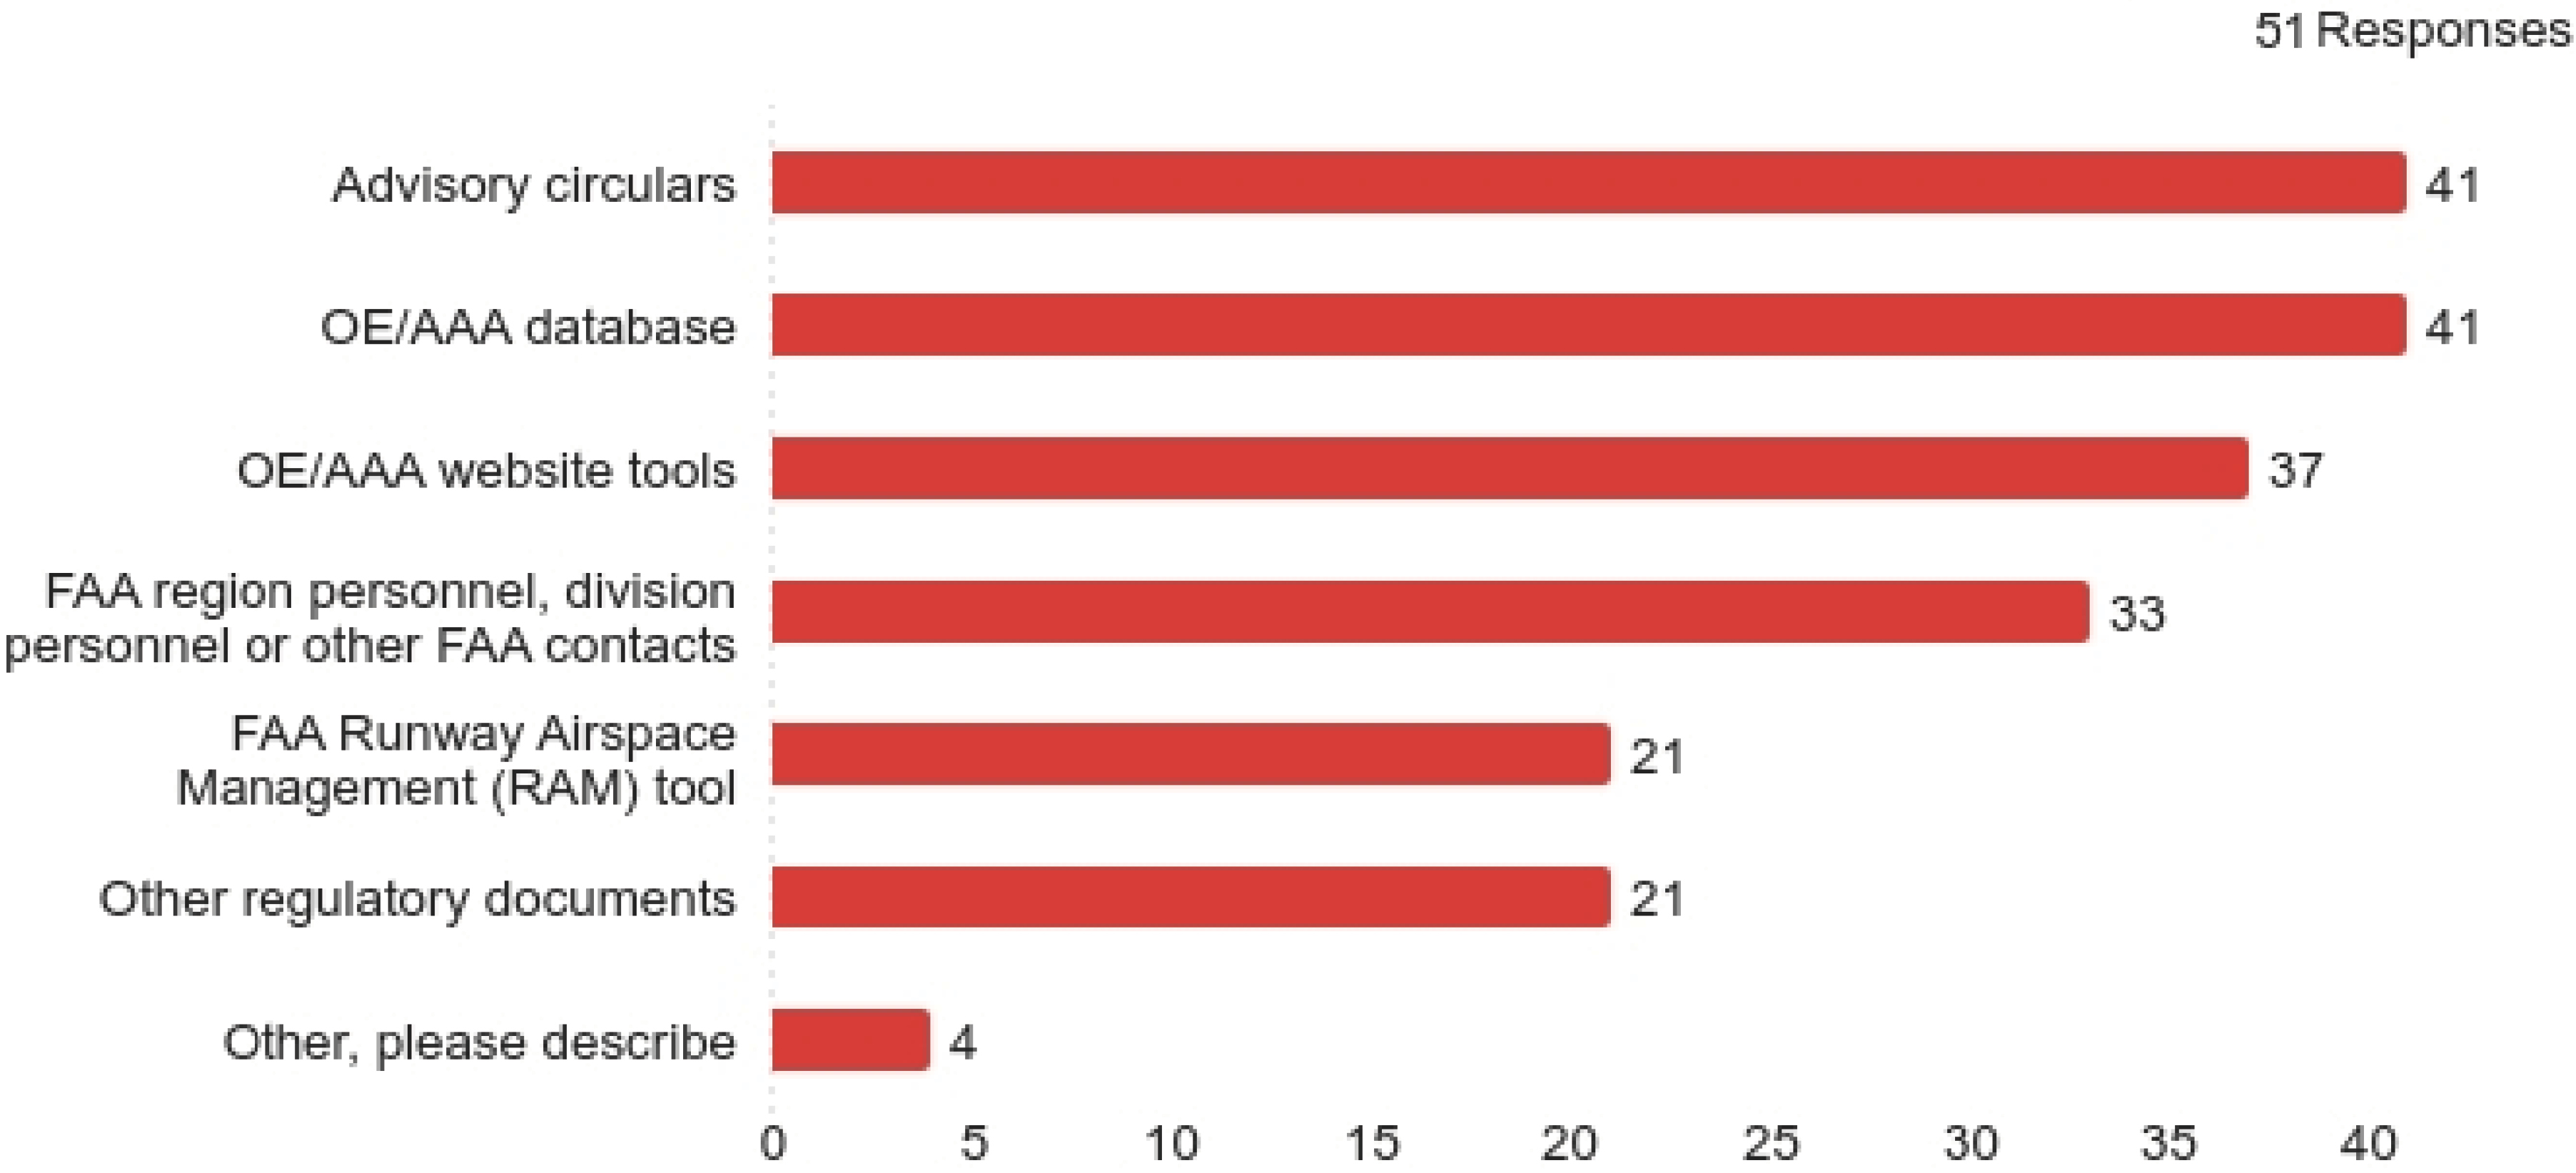
Long Description.
The x-axis represents values ranging from 0 to 40 in increments of 5. The y-axis includes advisory circulars; O E slash AAA database; O E slash AAA website tools; FAA region personnel, division personnel, or other FAA contacts; FAA runway airspace management (RAM) tool; other regulatory documents; other, please describe. The data given in the graph are as follows: Advisory circulars: 41. O E slash AAA database: 41. O E slash AAA website tools: 37. FAA region personnel, division personnel, or other FAA contacts: 33. FAA runway airspace management (RAM) tool: 21. other regulatory document: 21 other, please describe: 4. The survey has 51 responses. The values given in the graph are accurate.
resource. Additionally, one airport reported using an Airport Improvement Program (AIP) Grant to fund an obstacle survey. Other responses include contact with industry professionals, airport consultants, and crane companies.
Figure 6 summarizes the distribution of responses regarding the resources airports use to support interactions with landowners, which was relatively consistent across hub types, although there were notable differences in the least-utilized methods. For example, maintenance guides were among the least preferred resources across all hub categories, with only 1 airport in most categories using them. Additionally, no Medium-Hub airports reported using a database of landowner locations to facilitate communication. In contrast, this resource was the most frequently used method among Non-Hub airports, cited by 28% of Non-Hub respondents (8 of 29 responses). In contrast, no Non-Hub airports reported using design guides, while design guides were tied as the most used resource among Large Hubs (3 of 5 responses, 60%), Medium Hubs (2 of 6 responses, 33%), and Small Hubs (6 of 14 responses, 43%). Respondents indicating “Other” listed:
- City ordinance
- Share updated Master Plans with the community
- Direct communication as needed
- Obstruction Mitigation Study, Part 77 map
Notification of Construction Activity
In the event of construction activity near the airport, 47 of 54 responding airports (87%) reported that local agencies contact them to inform them of potential new obstructions (Figure 7). Additionally, 37 respondents (69%) indicated that they are notified through automated OE/AAA notifications, while 35 respondents (65%) reported being informed directly by contractors. Half of the respondents stated that they also monitor new obstructions via OE/AAA website searches.
Other methods noted by the respondents include:
- Automated Land Use Referrals to our Landside Planning Team
- Development and building permit review process, but only if the development is within City limits

Long Description.
The x-axis represents values ranging from 0 to 20 in increments of 2. The y-axis includes website information; policies for construction or alterations; public outreach materials; database of locations; design guides; maintenance guides; and other, please describe. The data given in the graph are as follows: Website information: 21. Policies for construction or alterations: 21. Public outreach materials: 18. Database of locations: 17. Design guides: 12. Maintenance guides: 5. Other, please describe: 4. The survey has 44 responses. The values given in the graph are accurate.

Long Description.
The x-axis represents values ranging from 0 to 45 in increments of 5. The y-axis includes local agencies, contact airport; automated OE slash AAA notification; contractor; OE slash AAA website search; land owner; FAA runway airspace management (RAM) tool; other, please explain. The data given in the graph are as follows: Local agencies contact airport: 47. Automated OE slash AAA notification: 37. Contractor: 35. OE slash AAA website search: 27. Land owner: 19. FAA runway airspace management (RAM) tool: 4. Other, please explain: 9. The survey has 54 responses. The values given in the graph are accurate.
- During Airfield Inspections or Tower notification
- Email/letter from airport
- Many of the local developers are aware of the impacts/requirements of the Airport and make direct contact
- Media, news reporting, and personal observation
- Visual inspections, developed contacts
- We are made aware of construction activities through our development review and building permit processes
- Would contact the construction site superintendent if none of the above apply.
Regarding specific hub types, 80% of Large Hubs (4 of 5 respondents), 67% of Medium Hubs (4 of 6 respondents), and 69% of Non-Hub airports (25 of 36 respondents) identified local agencies as their primary source of information on potential construction-related obstructions. In contrast, among Small Hubs, 14 respondents (93%) reported that automated OE/AAA notifications were the most used method, closely followed by 11 of 14 respondents (79%) citing notifications from local agencies. Contractors also played a significant role across all airport categories, with 5 of 5 respondents (100%) of Large Hubs, 3 of 6 respondents (50%) of Medium Hubs, 9 of 14 respondents (64%) of Small Hubs, and 16 of 36 respondents (44%) of Non-Hubs reporting contractors as a key source of obstruction information.
Outreach and Communication
The survey asked respondents about the types of communication that the airport has with surrounding property owners, specifically asking about the following types of communication:
- Websites
- Regular meetings
- Emails
- Task forces
- Workshops or meetings with local planning authorities
- Or other, where the respondent had the opportunity to fill in the types of outreach.
Forty-three of the 57 respondents to the question (75%) indicated that their airports conduct formal outreach efforts to communicate with landowners and stakeholders regarding key issues such as obstructions, zoning regulations, new construction, vegetation growth, and other alterations that could affect airspace safety. All Large Hubs (5 respondents) reported implementing formal outreach programs. Among the other hub types, 3 Medium Hubs, 10 Small Hubs, and 22 Non-Hub airports stated that they also use formal outreach to engage with external stakeholders (Figure 8).
Of those respondents who indicated positive engagement with landowners, 25 (61%) used email for formal communication outreach (Figure 9). Email communication was closely followed by workshops and meetings with local planning and zoning officials (24; 59%), regular meetings (18; 44%), websites (15; 37%), and the use of task forces (7; 17%). Note that the survey allowed respondents to provide multiple responses regarding ways to reach landowners.

Long Description.
The x-axis represents values ranging from 0 to 20 in increments of 5. The y-axis includes hub types such as large hub, medium hub, small hub, and non-hub primary. The graph consists of ‘Yesʼ and ‘Noʼ responses. The data given in the graph are as follows: Large hub: yes: 5; no: 0. Medium hub: yes: 3; no: 1. Small hub: yes: 10; no: 3. Non-hub primary: yes: 22; no: 10. The survey has 57 responses. The values given in the graph are accurate.

Long Description.
The x-axis represents values ranging from 0 to 25 in increments of 5. The y-axis includes emails, workshops, or meetings with local planning and zoning officials; regular meetings; website; task forces; other, please describe. The data given in the graph are as follows: Emails: 25. Workshops or meetings with local planning and zoning officials: 24. Regular meetings: 18. Website: 15. Task forces: 7. Other, please describe: 9. The survey has 41 responses. The values given in the graph are accurate.
When reviewed by hub type, 5 (100%) of the Large Hubs that did formal outreach reported using regular meetings, emails, and workshops/meetings with planning and zoning officials as their core outreach methods. Also, 2 (100%) of Medium Hubs that did outreach reported using both emails and workshops/meetings with planning and zoning officials as their primary methods. For Small Hubs doing formal outreach, 8 (90%) of respondents stated that email is their primary outreach tool, followed by 7 (70%) for workshops, while among Non-Hub airports doing formal outreach, 9 (43%) reported email as their primary method of communication with stakeholders, followed by 7 (33%) using regular meetings and workshops.
In addition to these more common methods, some airports reported using other forms of outreach outside the options in the survey. By hub type, the responses to the other methods are listed here.
Medium Hub, other outreach techniques:
- US Postal Service mailings
Small Hub, other outreach techniques:
- Workplan in place with city permitting office to route building permit applications through airport
Non-Hub Primary, other outreach techniques:
- Weekly area plan commission meetings
- Phone calls
- Joint Powers Zoning Board
- Height limitations and zoning ordinances were enacted that included a robust public involvement campaign
- Works with Planning & Development in the city to flag potential conflicts
Most airports (38 of 52 respondents to the question, or 73%) reported having agreements in place with external entities to address off-airport obstructions. Specifically, 3 of 5 (60%) of Large Hubs, 4 of 4 (100%) of Medium Hubs, 11 of 13 (85%) of Small Hubs, and 18 of 29 (62%) of Non-Hub airports reported having agreements in place (Figure 10). These agreements generally pertain to zoning ordinances, easements, and mitigation plans between the airports and landowners.

Long Description.
The x-axis represents values ranging from 0 to 15 in increments of 5. The y-axis includes hub types such as large hub, medium hub, small hub, and non-hub primary. The graph consists of ‘Yesʼ and ‘Noʼ responses. The data given in the graph are as follows: Large Hub: yes: 3, no: 1. Medium hub: yes: 4, no: 0. Small hub: yes: 11, no: 2. Non-hub primary: yes: 18, no: 11. The survey has 52 responses. The values given in the graph are accurate.
Regarding the frequency of communication between airports and landowners (Figure 11), Large Hubs demonstrated the highest levels of engagement, with respondents indicating either regular (2 of 4, 50%) or occasional (2 of 4, 50%) communication. A general decline in communication frequency is observed as hub size decreases. Among Medium Hubs, 3 of 4 respondents (75%) reported occasional communication, with no respondents selecting “never” or “not sure.” For Small Hubs, 10 of 13 (77%) reported occasional communication, while 1 (8%) reported never communicating and 2 (15%) were unsure. Among Non-Hub airports, 24 of 29 respondents (83%) reported occasional communication, 3 (10%) reported regular communication, and 2 (7%) reported no communication with landowners.
Cost of Addressing Obstructions
In dealing with off-airport obstructions, the survey focused on the costs that the airport incurred and areas where costs were identified in the past year, specifically the following areas:
- National Environment Policy Act (NEPA) compliance
- Engineering and/or design
- Construction
- Removal
- Mitigation
- Other, with the option to provide a description
Overall, 18 or 43% of survey respondents that had obstruction issues in the past year reported no costs related to obstruction issues in the past year (Figure 12). Eleven or 26% incurred expenses for obstruction removal, 10 or 24% for mitigation efforts, and 9 or 21% for engineering and design activities. Medium Hubs only reported costs associated with obstruction mitigation and did not report any engineering or design expenses. Small Hubs reported incurring costs to remove obstructions. Large Hubs were the only airports to report costs associated with construction

Long Description.
The x-axis represents values ranging from 0 to 20 in increments of 5. The y-axis includes hub types such as large hub, medium hub, small hub, and non-hub primary. The graph consists of yes, regularly; occasionally; no, never; not sure. The data given in the graph are as follows: Large hub: yes, regularly: 2; occasionally: 2; no, never: 0; not sure: 0. Medium hub: yes, regularly: 1; occasionally: 3; no, never: 0; not sure: 0. Small hub: yes, regularly: 0; occasionally: 10; no, never: 1; not sure: 2. Non-hub primary: yes, regularly: 3; occasionally: 24; no, never: 2; not sure: 0. The survey has 53 responses. The values given in the graph are accurate.

Long Description.
The x-axis represents values ranging from 0 to 18 in increments of 2. The y-axis includes none, removal, mitigation, engineering and design; NEPA compliance; construction; other, please describe. The data given in the graph are as follows: None: 18. Removal: 11. Mitigation: 10. Engineering and design: 9. NEPA compliance: 2. Construction: 1. Other, please describe: 12. The survey has 42 responses. The values given in the graph are accurate.
activities in the past year. In contrast, the Medium Hubs were the only airport group to report no engineering or design costs. One respondent provided details,
This evaluation process requires the involvement of internal employees as well as numerous outside consultants to determine and implement necessary mitigation procedures. Additionally, when vegetation grows and penetrates Part 77 airspace, we are required to take corrective action, incurring further costs to ensure compliance and maintain safe operations.
Respondents provided additional information on costs incurred in two general areas:
- Staff and Administrative Time
- Significant staff time spent reviewing cases, coordinating with developers, and mitigating obstructions
- Evaluations that are required for each new project to assess impacts on airport procedures
- Time spent informing the public of obstructions
- Planning and Technical Services
- Airport planning and geospatial involvement
- Planning services and avigation easement acquisitions
- External costs, expenses for legal fees, travel, and airspace consultants
- Compliance and corrective actions
Amount/Number of Obstructions
The survey results show that in the past year (Table 3), 28 or 49% of 57 responding airports reported addressing 1 to 5 off-airport obstruction issues, while 13 or 23% reported addressing none. Fewer airports dealt with higher volumes of obstruction issues: 7 or 12% addressed 5 to 10 issues, and 9 or 16% addressed more than 10. Over five years, a similar pattern emerges: of 56 responding airports, 31 or 55% reported addressing 1 to 5 obstructions annually, and 8 or 14% reported none. Meanwhile, 6 or 11% reported handling 5 to 10 obstructions per year, and 11 or 20% reported handling more than 10. Overall, the data suggest that most airports consistently manage a small number of 1 to 5 off-airport obstruction issues each year. However, over a longer time frame, airports handle a much higher volume of obstruction-related activities, while relatively few report no activity at all.

Long Description.
The column headers of the table are questions, 0, 1 to 5, 5 to 10, and 10 plus. The data given in the table row-wise are as follows: Row 1: In the past year, approximately how many off-airport obstruction issues has the airport actively addressed? 23 percent (13); 49 percent (28); 12 percent (7); 16 percent (9). Row 2: Over the past 5 years, approximately how many off-airport obstructions issues PER YEAR has the airport actively addressed? 14 percent (8); 55 percent (31); 11 percent (6); 20 percent (11).
All Large Hub respondents reported addressing 10 or more off-airport obstructions annually over the past 5 years (Figure 13). However, this percentage decreases with airport size: only 1 (25%) of Medium Hubs, 1 (8%) of Small Hubs, and 2 (6%) of Non-Hubs reported addressing 10+ obstructions each year. Additionally, 21 (68%) of Non-Hubs and 8 (62%) of Small Hubs reported addressing 1–5 obstructions per year over the same 5-year period. When comparing these trends to just the past year (Question 8), a slight decline is observed: 4 (80%) of Large Hub respondents reported addressing 10+ obstructions, down from 100% over the 5 years. Among Medium Hubs, 3 (75%) reported addressing 1–5 obstructions, and 1 (25%) reported addressing none. Small Hubs showed greater variation: 3 (23%) reported no obstructions addressed, 6 (46%) addressed 1–5, 3 (23%) addressed 5–10, and 1 (8%) addressed 10+. Among Non-Hubs, the majority (16, 52%) reported handling 1–5 obstructions, while 3 (10%) reported addressing 5–10, and another 3 (10%) reported addressing 10+.

Long Description.
The x-axis represents values ranging from 0 to 20 in increments of 5. The y-axis includes hub types such as large hub, medium hub, small hub, and non-hub primary. The graph consists of 0; 1 to 5; 5 to 10; and 10 plus. The data given in the graph are as follows: Large hub: 0: 0; 1 to 5: 0; 5 to 10: 0; and 10 plus: 4. Medium hub: 0: 1; 1 to 5: 1; 5 to 10: 1; and 10 plus: 1. Small hub: 0: 2; 1 to 5: 8; 5 to 10: 2; and 10 plus: 1. Non-hub primary: 0: 5; 1 to 5: 21; 5 to 10: 3; and 10 plus: 2. The survey has 56 responses. The values given in the graph are accurate.
The average time to resolve obstruction issues for all airports surveyed is shown in Figure 14, with breakouts for less than 1 month, 1–3 months, 3–6 months, 6–12 months, and greater than 1 year. In looking at hub type, variations in length of time from identification to conclusion in dealing with an individual off-airport obstruction were found. For resolutions with less than a month, Large and Medium Hubs resolved a greater percentage of obstructions than Small and Non-Hub airports. All types of hubs experienced obstruction issues that took longer than a year to resolve (Table 4).
Funding
Airports that had obstructions over the past 5 years are using local funds to address obstructions, followed by Airport Improvement Program (AIP) funding, state funds, and Bipartisan Infrastructure Law (BIL) funding (Figure 15). Large Hubs reported a mix of funding sources: local funds, passenger facility charges (PFC), AIP, and BIL funds. Medium Hubs exclusively reported using federal BIL funds, with no other funding sources indicated. Small Hubs primarily relied on local funds, with a small portion using federal AIP and PFC funds. Non-Hub Primary airports used local funds, followed by AIP funds and state funds.
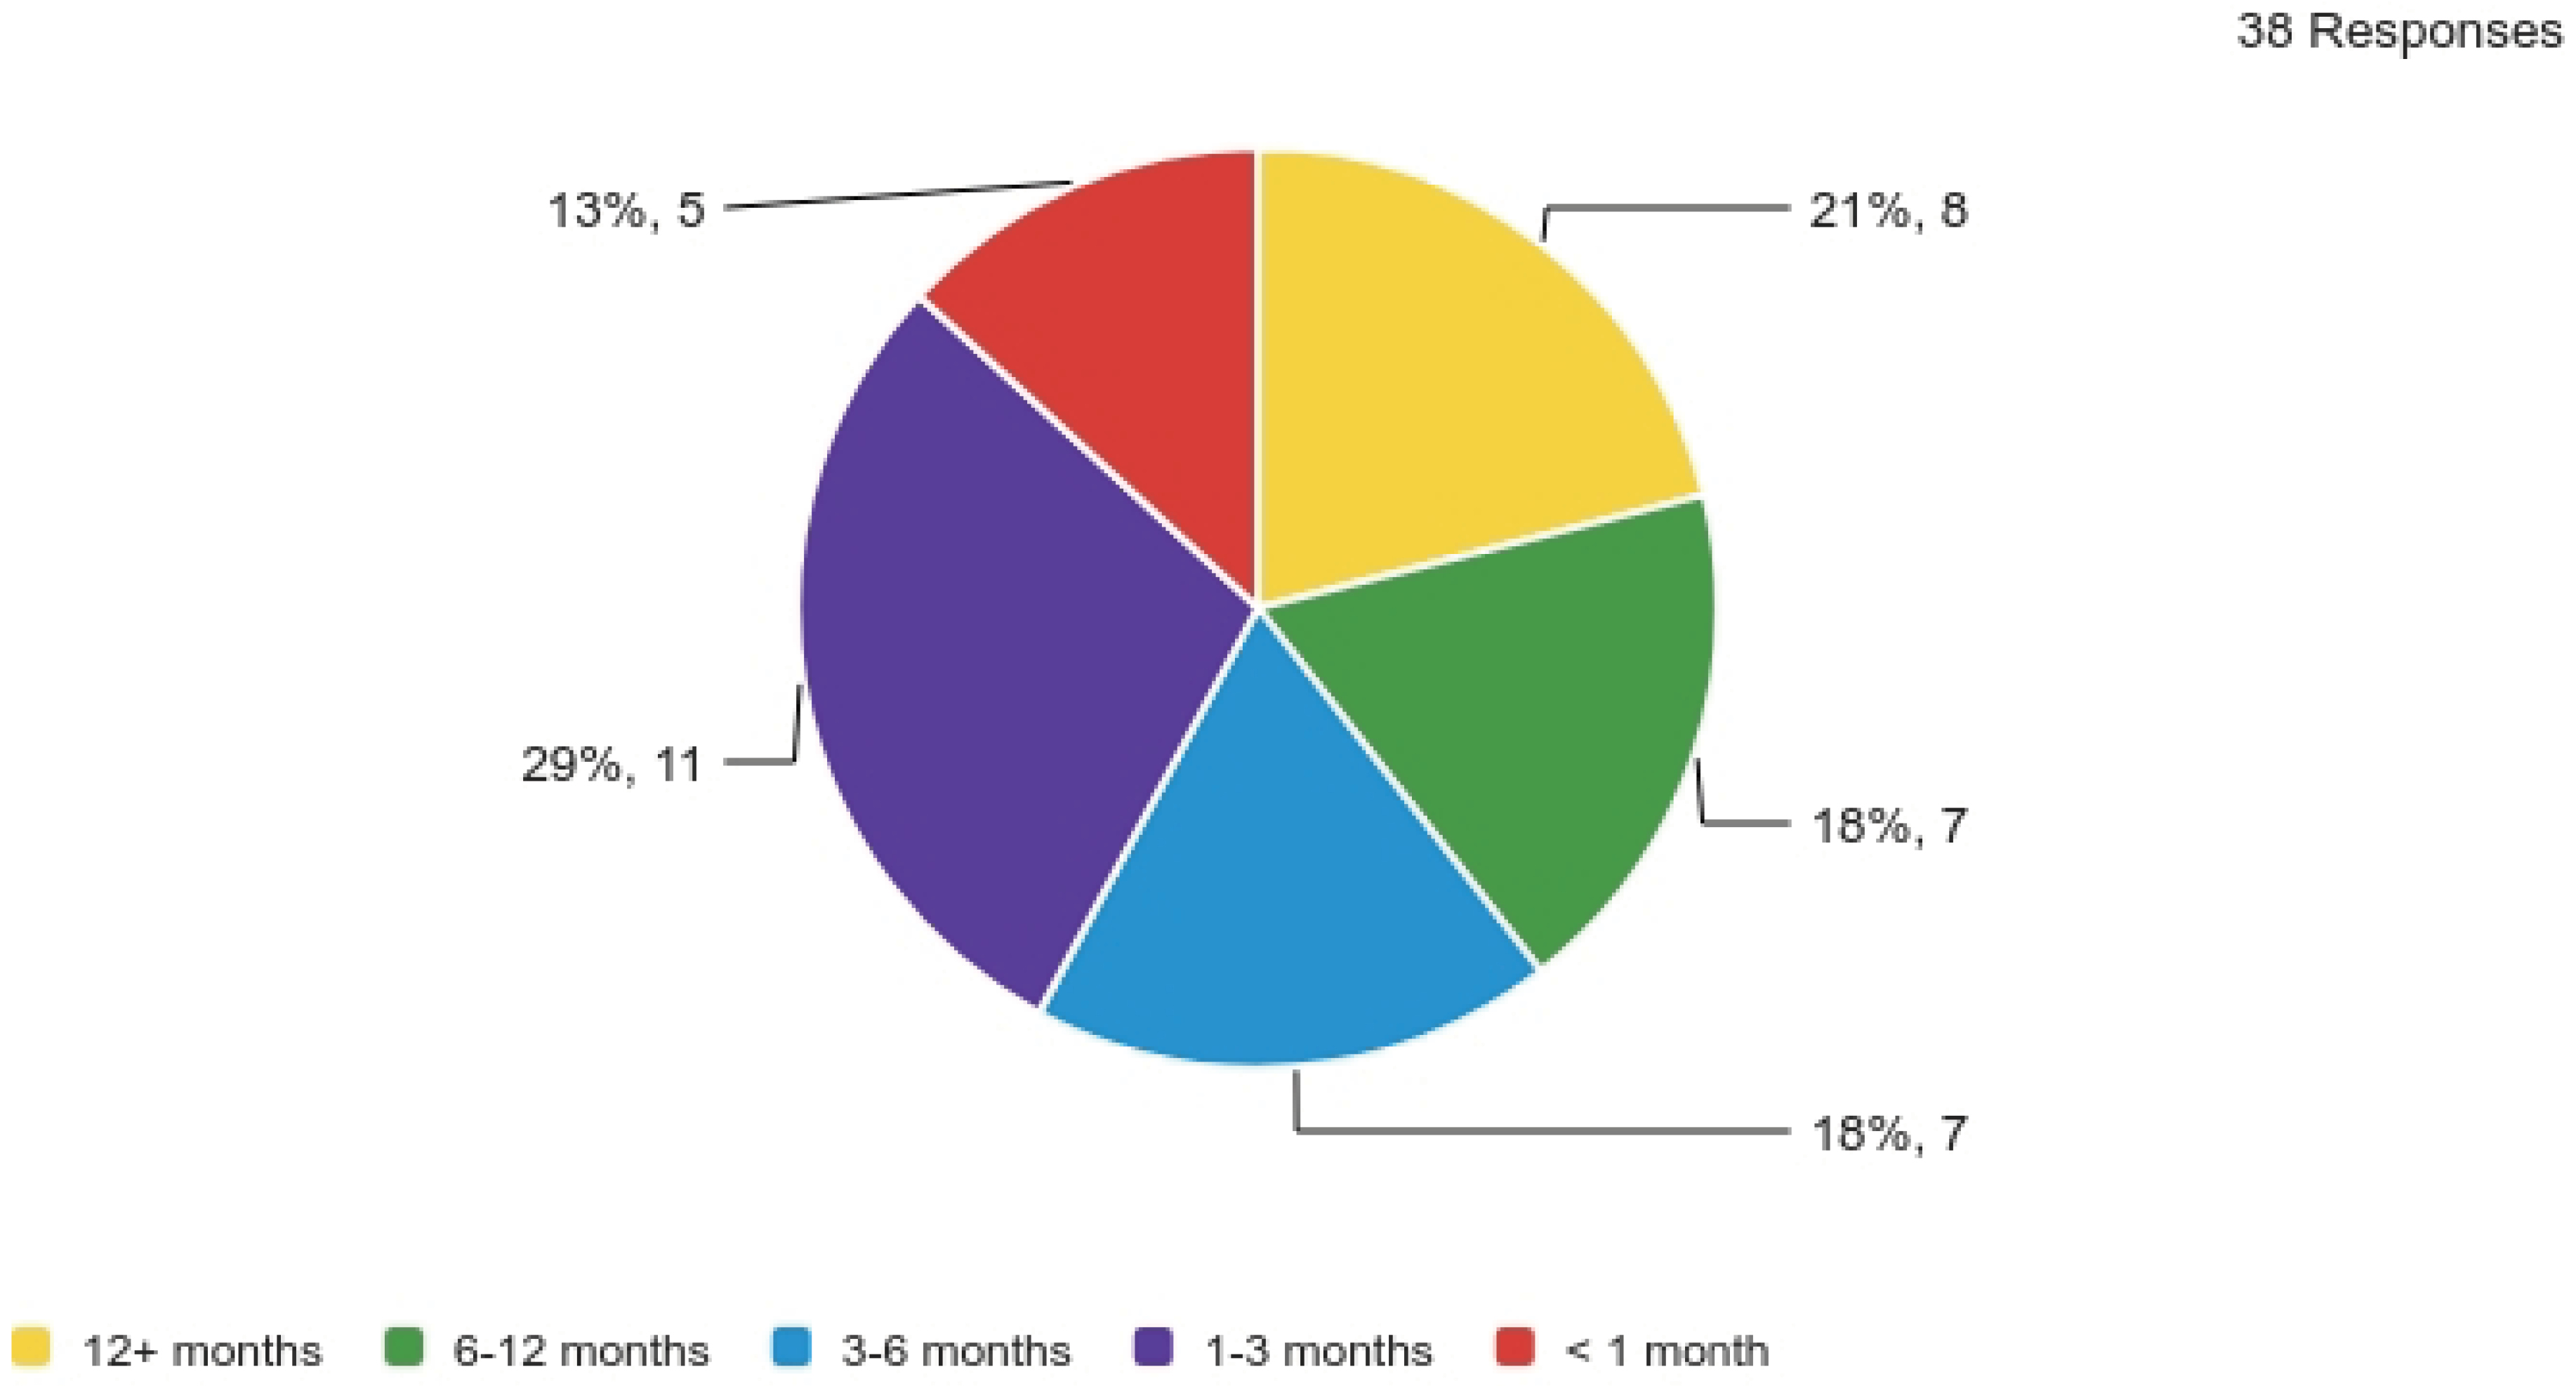
Long Description.
The pie chart illustrates the distribution of five categories: 12 plus months at 21 percent, 8; 6 to 12 months at 18 percent, 7; 3 to 6 months at 18 percent, 7; 1 to 3 months at 29 percent, 11; and less than 1 month at 13 percent, 5.

Long Description.
The column headers of the table are months, large hub, medium hub, small hub, and non-hub. The data given in the table row-wise are as follows: Row 1: Less than 1; 25 percent (1); 33 percent (1); 11 percent (1); 10 percent (2). Row 2: 1 to 3; 0 percent (0); 33 percent (1); 22 percent (2); 40 percent (8). Row 3: 3 to 6; 25 percent (1); 0 percent (0); 11 percent (1); 25 percent (5). Row 4: 6 to 12; 25 percent (1); 0 percent (0); 33 percent (3); 10 percent (2). Row 5: Greater than 12; 25 percent (1); 33 percent (1); 22 percent (2); 15 percent (3).
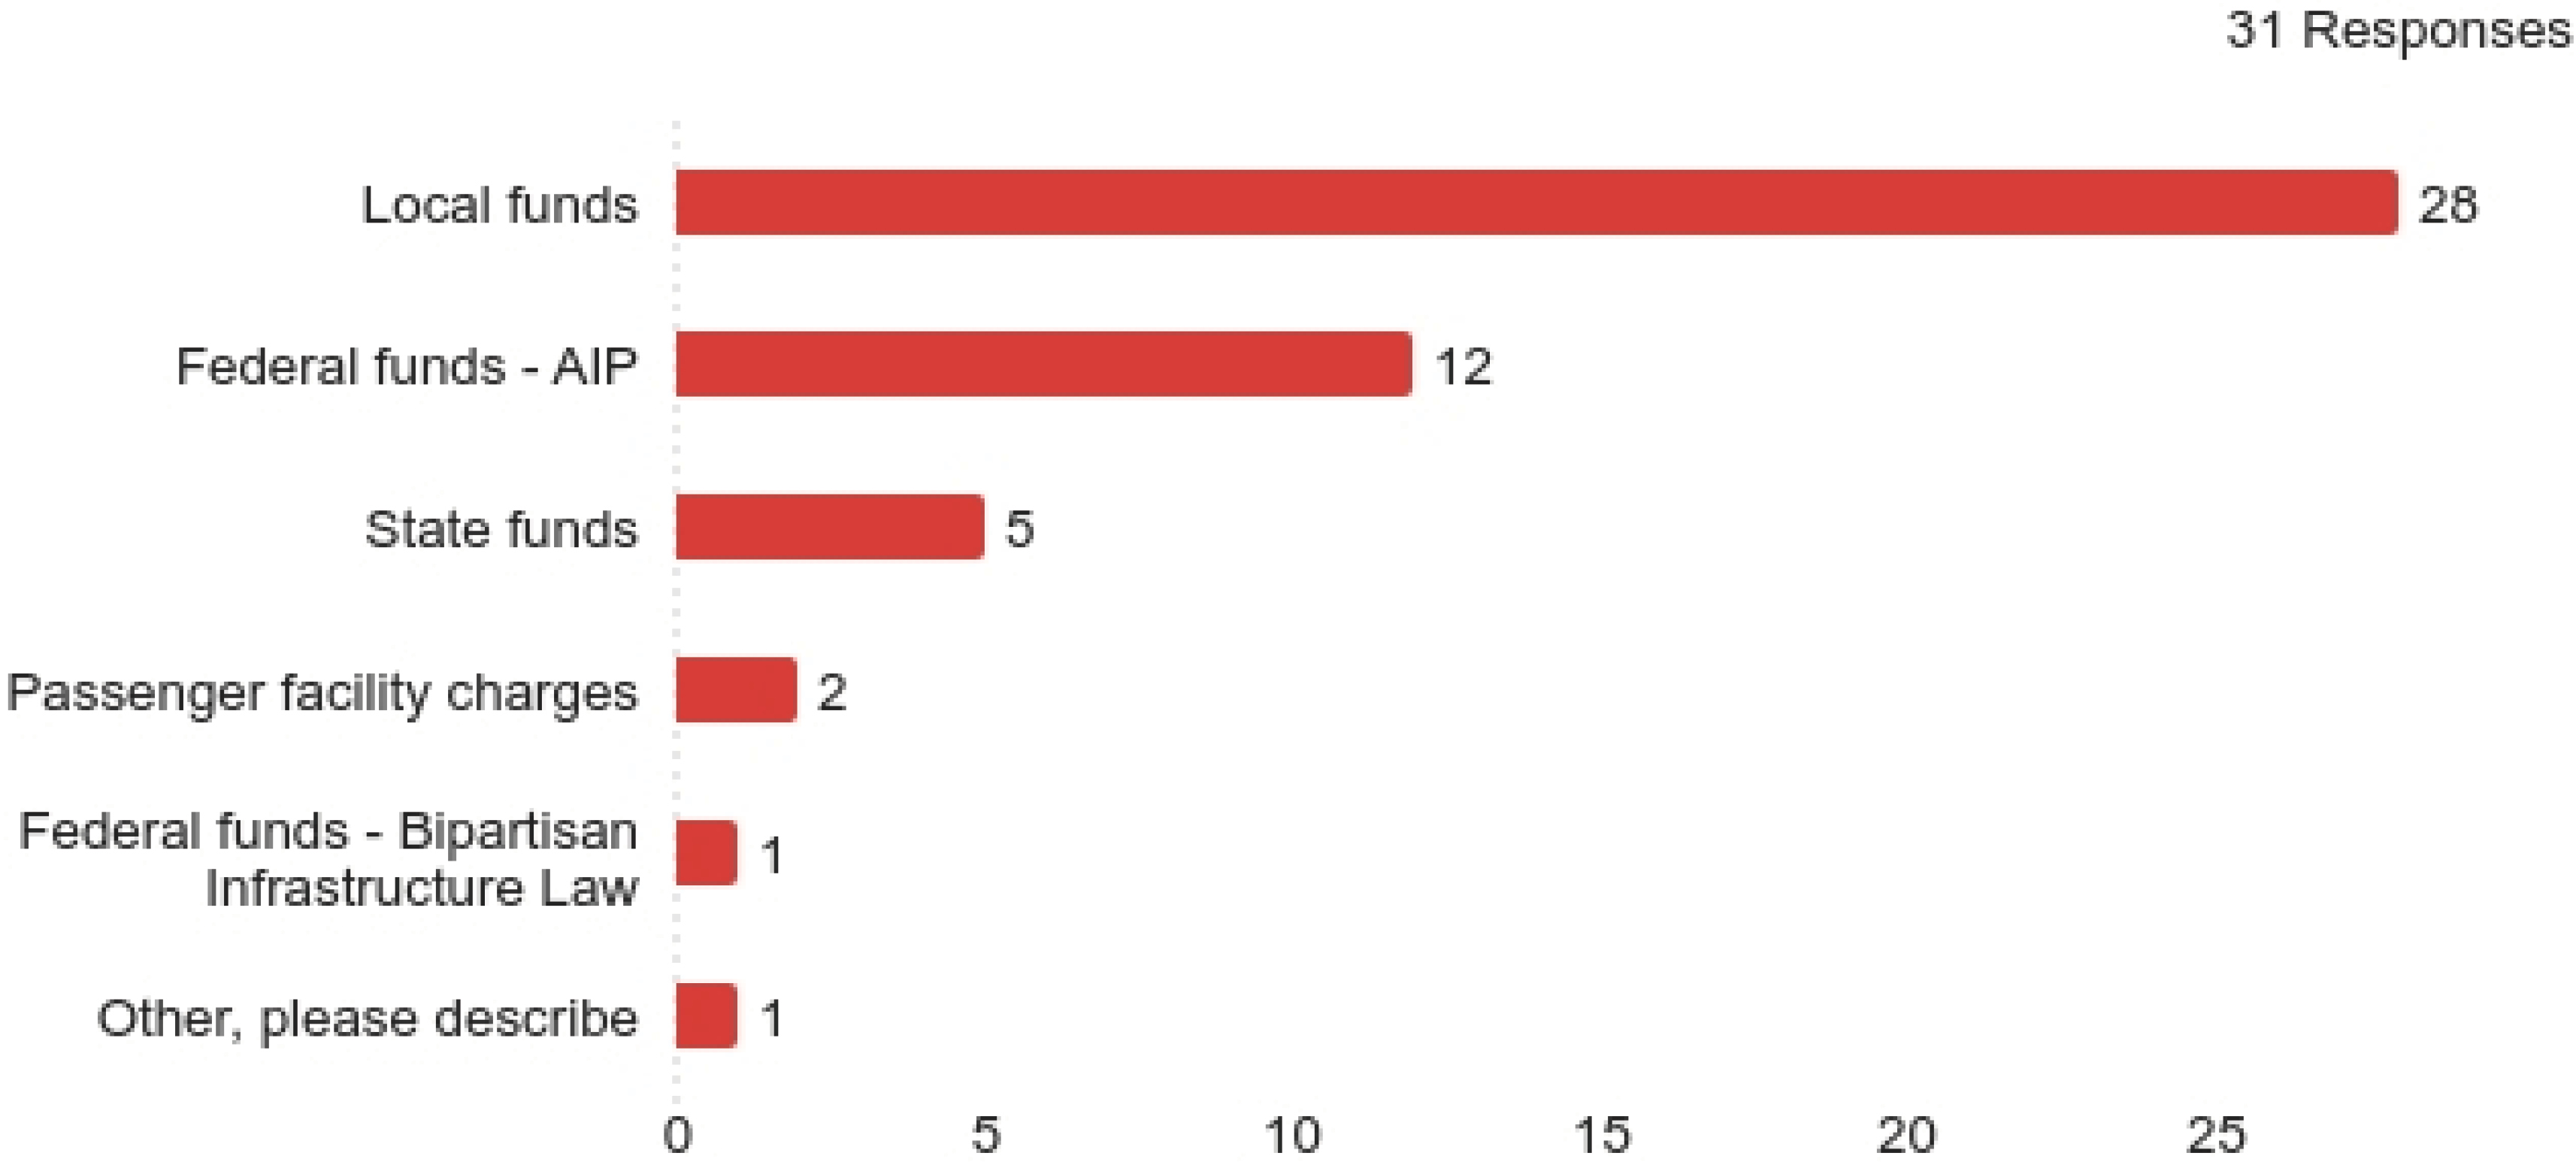
Long Description.
The x-axis represents values ranging from 0 to 25 in increments of 5. The y-axis includes local funds; federal funds – AIP; state funds; passenger facility charges; federal funds, bipartisan infrastructure law; other, please describe. The data given in the graph are as follows: local funds: 28. Federal funds – AIP: 12. State funds: 5. Passenger facility charges: 2. Federal funds bipartisan infrastructure law: 1. Other, please describe: 1. The survey has 31 responses. The values given in the graph are accurate.
Impacts
The survey results indicate that off-airport obstructions have had limited impacts on airport operations over the past 5 years (Table 5). Of 54 respondents, 4 (7%) reported that obstructions caused project delays, while 50 (93%) reported no such delays. Of the airports reporting delays, some comments were provided on the impact on airport projects:
Yes, on many occasions, local contractors erect cranes without making any attempt to submit the proper information to the FAA/Airport. Weʼve had a hard time getting them to lower the cranes on numerous occasions, even along the approach path within 5 miles. The Tower has had to instruct go arounds and opposite approaches. Somehow educating all heavy equipment operating companies on Part 77 and their responsibilities would be fantastic.
And:
Runway reconstruction project that required use of secondary runway for all commercial operations had issues caused by temporary crane use off airport.
Respondents from 16 (30%) airports stated that obstructions resulted in additional costs. Legal staff involvement in obstruction issues was reported by 14 respondents (26%). Additionally, 10 (19%) indicated that off-airport obstructions led to alterations at the airport, including

Long Description.
The column headers of the table are questions, yes; please describe, no. The data given in the table row-wise are as follows: Row 1: In the past 5 years, have off-airport obstructions or potential obstructions caused delays for airport projects? 7 percent (4); 93 percent (50). Row 2: In the past 5 years, have off-airport obstructions or potential obstructions caused additional costs to the airport? 30 percent (16); 70 percent (38). Row 3: In the past 5 years, has the airportʼs legal staff (or equivalent) been involved in off-airport obstruction issues? 26 percent (14); 74 percent (40). Row 4: In the past 5 years, have off-airport obstructions caused alterations to the airport (approaches, physical changes, operations, and so on)? 19 percent (10); 81 percent (43).
changes to approaches, physical modifications, and operational adjustments. Respondents indicated additional types of expenses due to obstructions:
- Many airports cited the need for selective tree removal and trimming to maintain safe approach paths, with costs ranging from $15,000 for tree removal on an adjacent golf course to over $100,000 for broader trimming efforts.
- Airports also reported incurring mitigation and evaluation costs, requiring internal staff involvement and hiring external consultants to assess potential impacts on airport approaches such as Standard Instrument Departure Procedures and One Engine Inoperative (OEI) procedures.
- Snow removal operations also became more costly at some airports, where maintaining dual-runway operations was necessary because obstructions prevented the preferred runway from being used during prevailing wind conditions.
- Temporary crane use associated with nearby off-airport construction projects resulted in additional expenses during runway reconstruction.
- One airport reported legal expenses related to filing a lawsuit against the local government over a proposed development that could have created airspace obstructions.
Challenges to Implementation
The primary reasons for the inability to mitigate off-airport obstructions vary by hub size. For Large Hubs, the challenges (Figure 16) were evenly distributed among a lack of local regulatory authority, a lack of state regulatory authority, and political considerations. Medium Hubs reported political considerations as the only barrier, the only reason obstructions could not be mitigated. At Small Hubs, the responses were evenly distributed among lack of local regulatory authority, political considerations, and funding considerations. Among Non-Hub Primary airports, the most common challenge was political considerations, followed by lack of local regulatory authority, funding constraints, and then lack of state regulatory authority. The other constraints reported include terrain reports from three airports and another reporting the lack of federal regulation at the time of the project.
Communication frequency of airports with the landowners was also detailed in the survey (Figure 17). Most airports do not have set meeting times with surrounding landowners, but 19 (40%) of the 48 responding airports meet yearly, quarterly, or monthly.
Among the responses, Large Hub airports were the only group to report communicating with landowners monthly or more frequently. In contrast, 7 Non-Hub airports reported engaging with landowners annually. Across all categories, 20 airports reported that communication with landowners occurs on an as-needed basis rather than on a set schedule, as noted in the “Other” category.
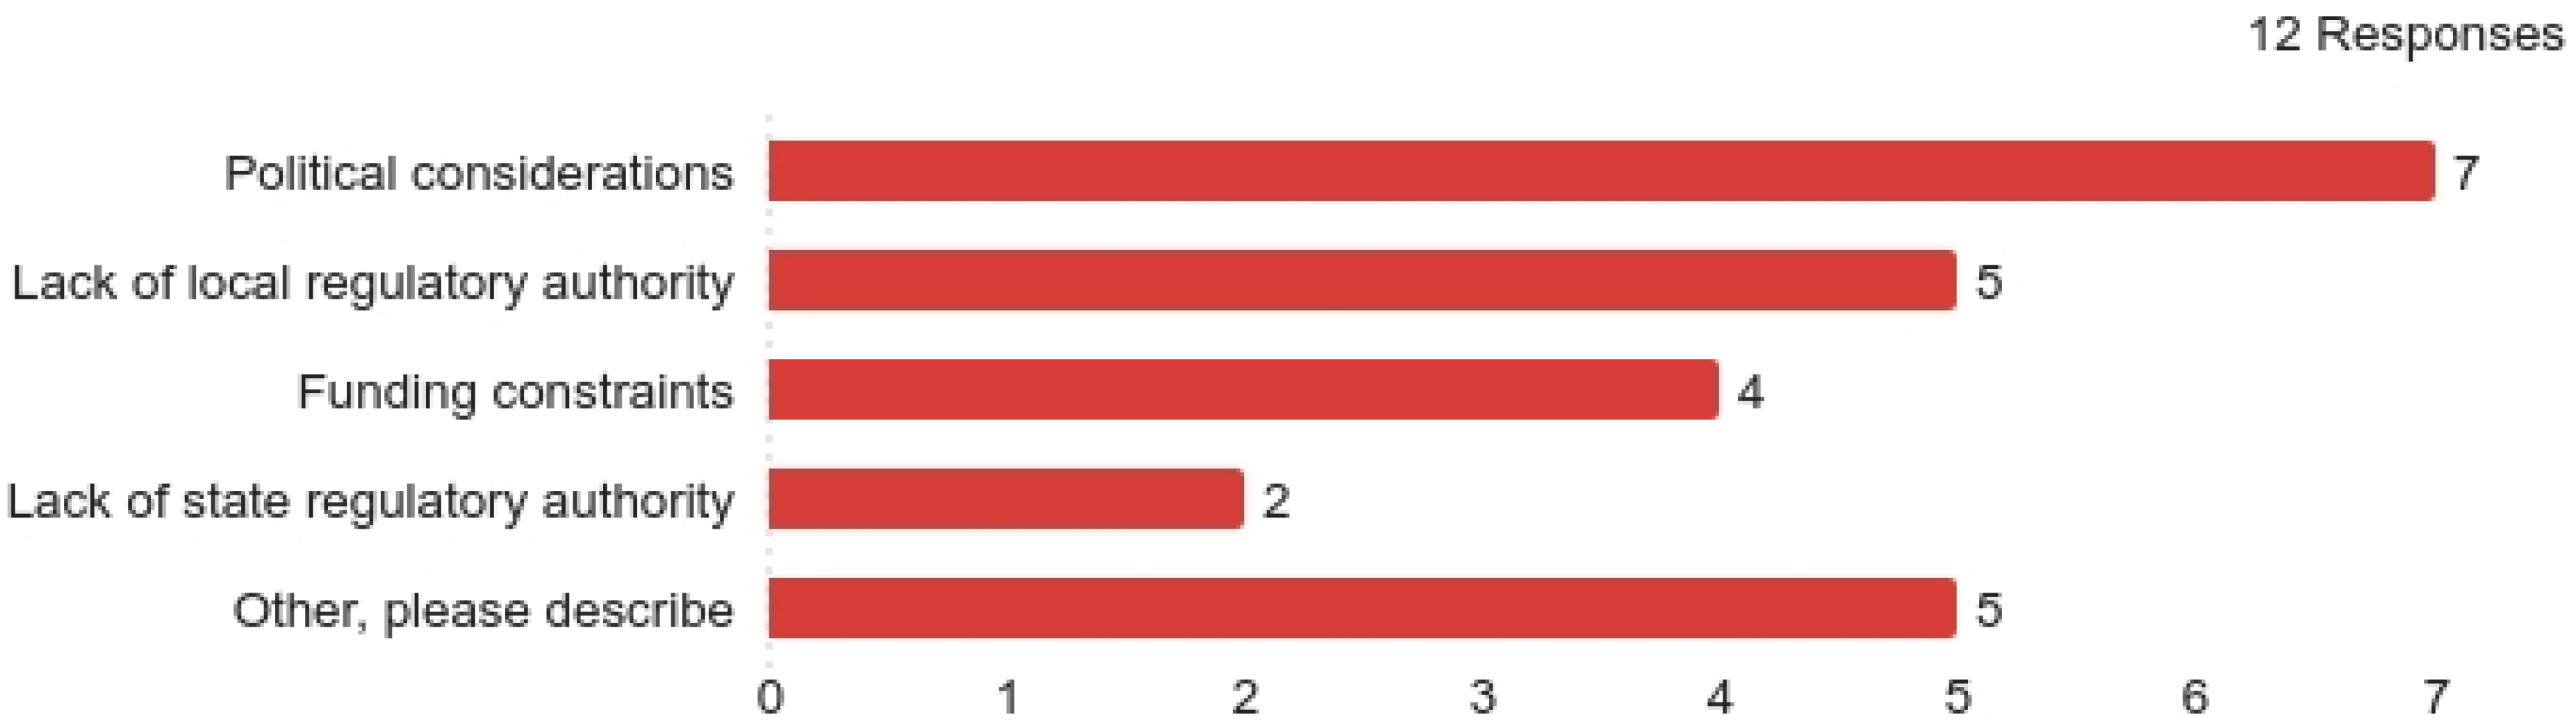
Long Description.
The x-axis represents values ranging from 0 to 7 in increments of 1. The y-axis includes political considerations, lack of local regulatory authority, funding constraints, lack of state regulatory authority; other, please describe. The data given in the graph are as follows: political considerations: 7. Lack of local regulatory authority: 5. Funding constraints: 4. Lack of state regulatory authority: 2. Other please describe: 5. The survey has 12 responses. The values given in the graph are accurate.

Long Description.
The x-axis represents values ranging from 0 to 20 in increments of 10. The y-axis includes monthly or more frequently, quarterly, yearly, or other; please describe. The data given in the graph are as follows: Monthly or more frequently: 2. Quarterly: 9. Yearly: 8. Other, please describe: 29. The survey has 48 responses. The values given in the graph are accurate.


