Developing a Guide to Depicting Utility Facilities in Design Plans (2026)
Chapter: Appendix B: Practitioner Survey Feedback
Appendix B – Practitioner Survey Feedback
The surveys were provided to practitioners within the Qualtrics platform and which allows for moving forward and backward within the survey and shows survey progress. Additionally, a PDF file of the entire survey was provided for a review prior to completing the survey. Additional instructions for completion of the survey were provided. As mentioned, two surveys were developed and distributed. The first survey was distributed to state DOTs and consultants, with the other distributed to utility owner organizations and contractors. To date, responses to the utility owner survey have been negligible, however there are anticipated results forthcoming from members of the Common Ground Alliance. Regardless, it is likely that the state DOT and consultant survey offers a higher likelihood of offering effective practices, and this survey collected 53 total responses of varying levels of completeness. This survey saw 29 substantially completed survey responses, which included 16 state DOT responses. The following summarizes this feedback.
Summary of the State DOT and Consultant Survey
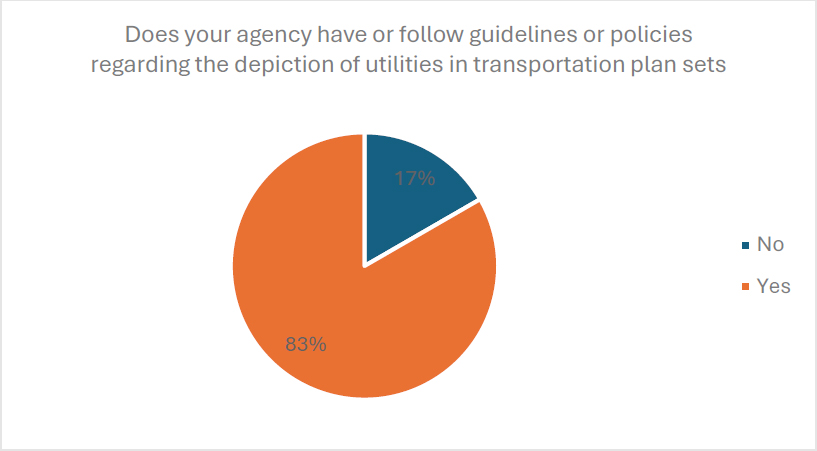
The following summary corresponds to the flow of the state DOT and consultant survey questionnaire. Each question includes the number of responses and the results of those responses. First, respondents were asked, “Does your agency have or follow guidelines or policies regarding the depiction of utilities in transportation plan sets?” As seen in Figure 17, a total of 30 responses were received, of which 83% responded “Yes,” while 17% responded “No.”
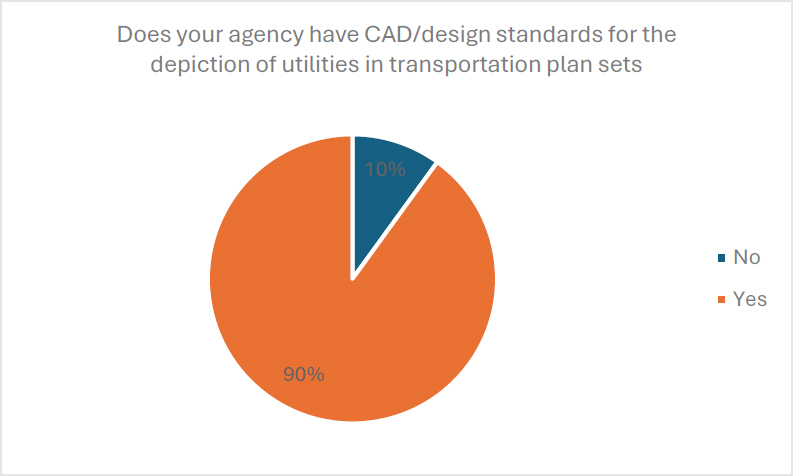
Next, respondents were asked, “Does your agency have CAD/design standards for the depiction of utilities in transportation plan sets?” As seen in Figure 18, a total of 30 responses were received, of which 90% responded “Yes” while 10% responded with “No.”
The respondents who responded “No” within Figure 18 were then asked, “Is your agency in the process of developing or planning to develop CAD/design standards for the depiction of utilities in transportation plan sets?” A total of 3 responses were received, with 2 indicated they were not developing standards and the remaining respondent noting that they were in process of this development.
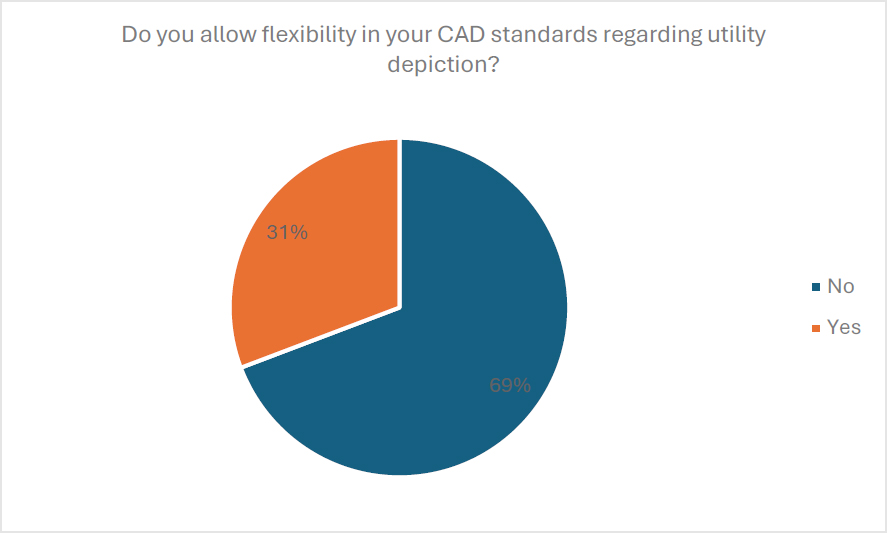
For respondents of Figure 18 who noted they did have standard, they were asked, “Do you allow flexibility in your CAD standards regarding utility depiction?” As seen in Figure 19 a total of 26 responses were received, of which 31% indicated “Yes,” while 69% indicated “No.”
The respondents of Figure 19 who noted flexibility in the standard was allowed, were asked “When and why do you allow this flexibility?” These responses are listed in Table 1.
Table 1: When and why do you allow this flexibility?
| S/N | Responses |
|---|---|
| 1 | On local program due to project sponsor. |
| 2 | I am actually unsure about this question, but I presume there is some flexibility. |
| 3 | Actual locations depicted on the plans are approximate per the Standard Specifications and the contractor is required to call for locates upon construction. |
| 4 | If utilities are not being touched, then they do not all need to be shown. When utilities will be relocated, they will all be shown as accurately as possible. |
| 5 | Based on the project requirements, client expectations, and whether or not the utility line is expected to be impacted. |
| 6 | We are consultant, so we rely on requirements set forth by client/agency. Some clients are very strict in their requirements, others are not so we have flexibility. |
| 7 | Some plans are using ASCE 38-02, and more recent contracts utilizing ASCE 38-22. |
| 8 | We don’t always require CAD standard plans from utilities. |
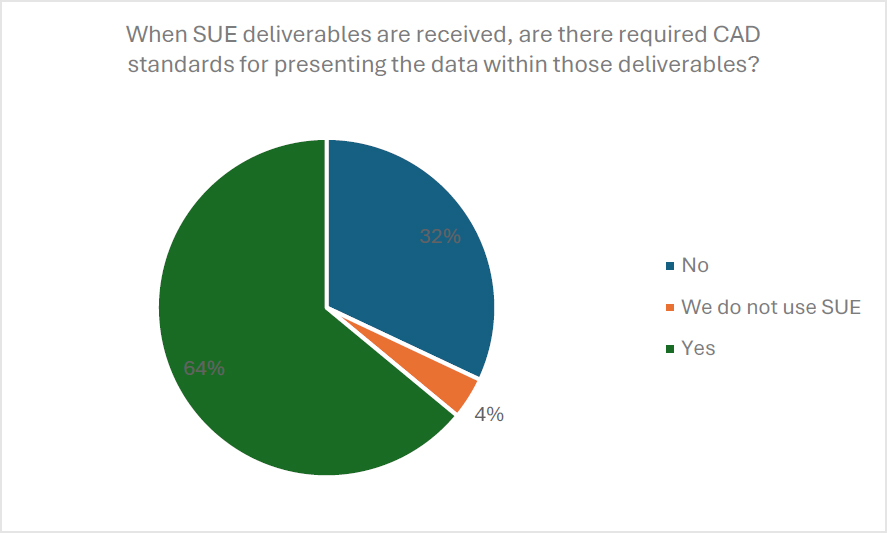
Next, respondents were asked, “When SUE deliverables are received, are there required CAD standards for presenting the data within those deliverables?” As seen in Figure 20, a total of 25 responses were received, of which 32% indicated “No,” 64% indicated “Yes,” and 4% indicated “We don’t use SUE.”
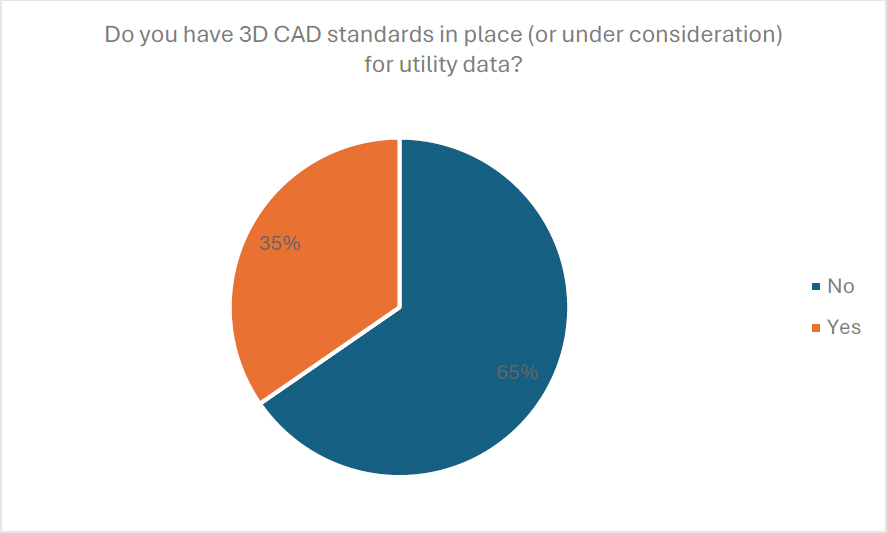
Respondents were also asked, “Do you have 3D CAD standards in place (or under consideration) for utility data?” Figure 21 shows the results from a total of 26 responses, with 35% indicating “Yes” while 65% indicated “No.”
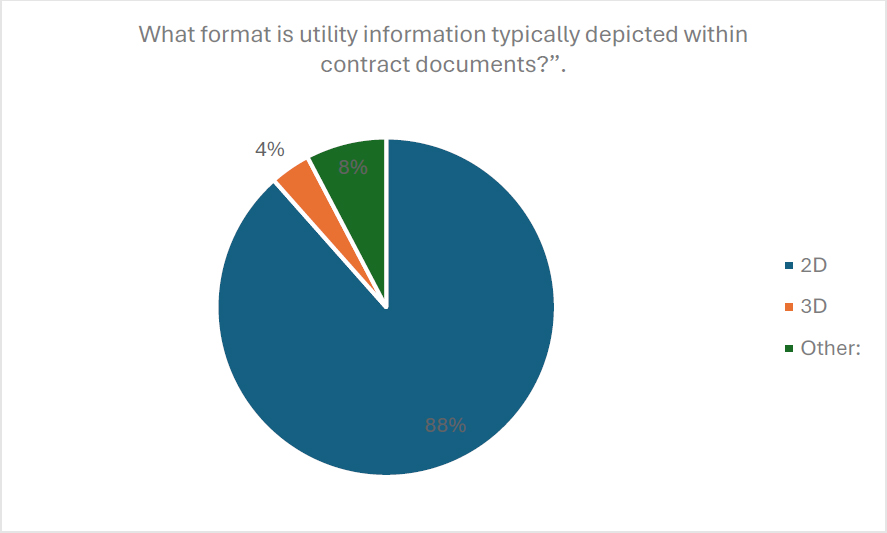
Next, respondents were asked, “What format is utility information typically depicted within contract documents?” Of 26 responses received, 88% indicated “2D,” 4% indicated “3D,” and 8% indicated “Other.” One response indicated as “other” stated that they used “2D with depths as needed.” The results are seen in Figure 22.
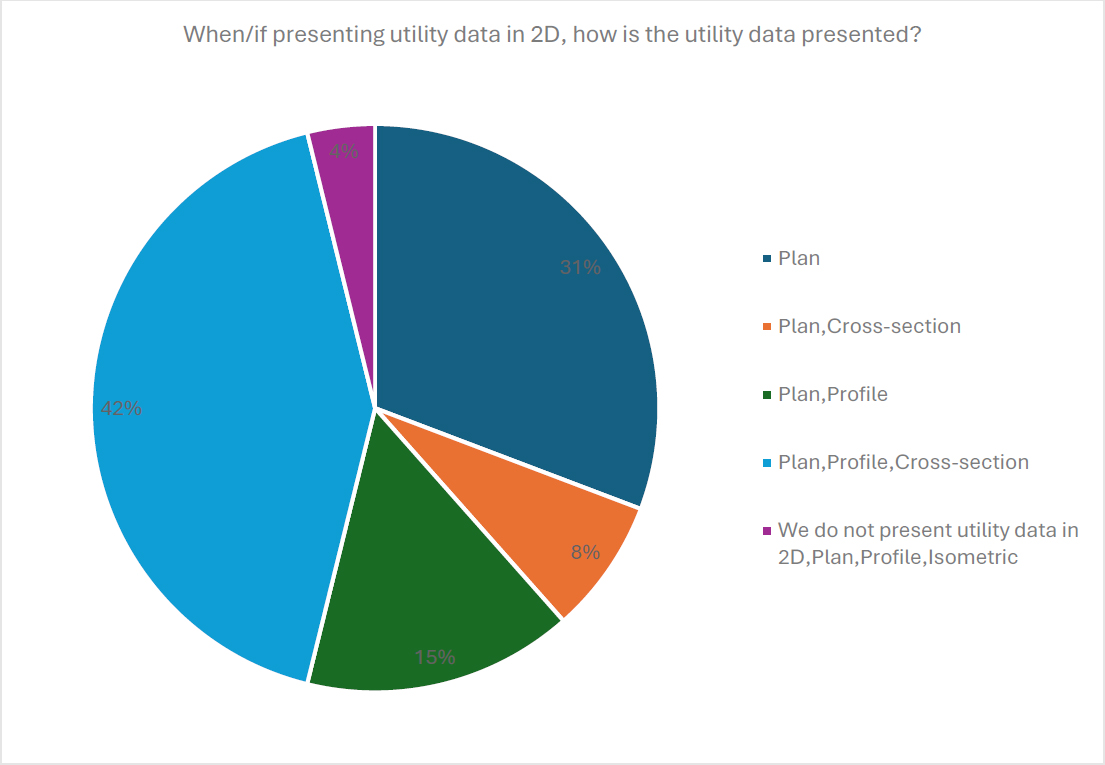
Respondents were then asked, “When/if presenting utility data in 2D, how is the utility data presented?” A total of 26 responses were received, of which 31% indicated “Plan,” 8% indicated
“Plan and Cross-section,” 15% indicated “Plan and Profile,” 42% indicated “Plan, Profile and Cross-section,” and 4% indicated “We do not present utility data in 2D, Plan, Profile, Isometric.” These results are presented in Figure 23.
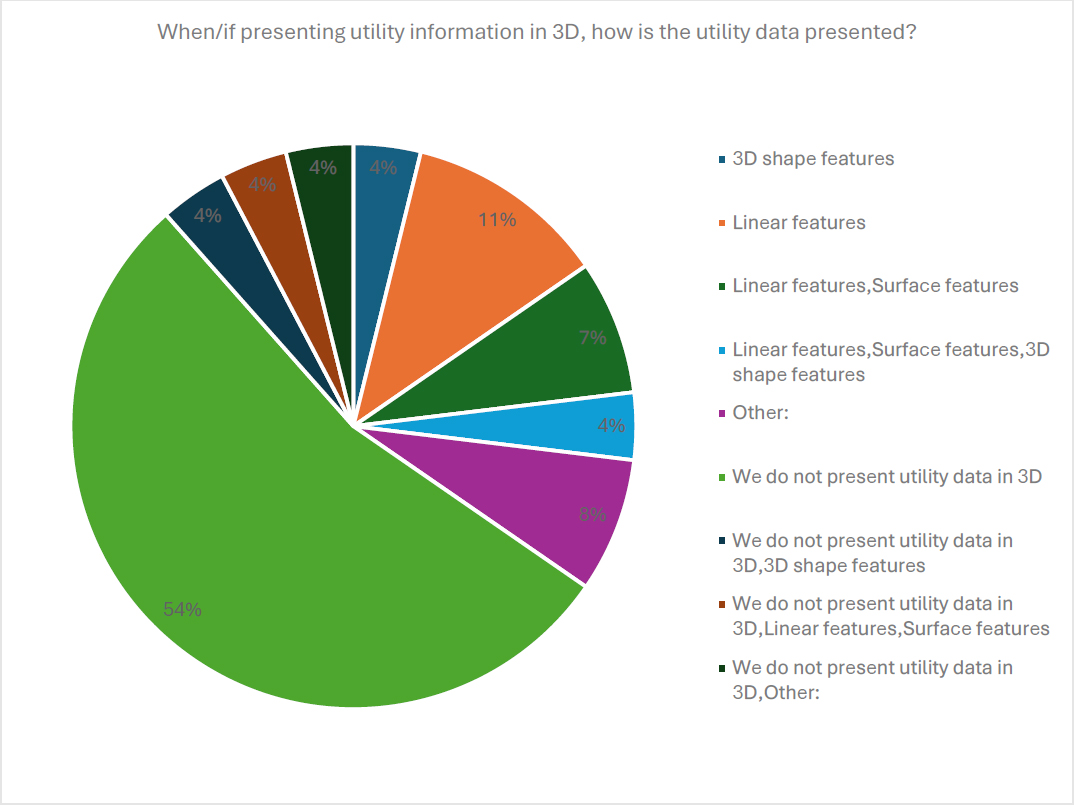
Respondents were also asked, “When/if presenting utility information in 3D, how is the utility data presented?” A total of 26 responses were received, of which 54% indicated “We do not present utility data in 3D,” 11% indicated “linear features,” 7% indicated “linear features and surface features,” 4% indicated “3D shape features,” 4% indicated “linear features, surface features and 3D shape features,” 8% indicated “other,” 4% indicated “We do not present utility data in 3D and 3D shape features,” 4% indicated “We do not present utility data in 3D, Linear features and Surface features,” and 4% indicated “We do not present utility data in 3D, Other.” These responses are seen in Figure 24.
Those respondents who indicated they represent utilities in 3D were asked, “When/if presenting utility information in 3D, how is the utility data presented?” A total of 3 responses were received, as listed in Table 2.
Table 2: When/if presenting utility information in 3D, how is the utility data presented?
| S/N | Responses |
|---|---|
| 1 | We are just beginning 3D depiction using Bentley Microstation Connect and OpenRoads |
| 2 | We have 3D as an option, but have not used it to date. |
| 3 | We are still working on it. |
Respondents were also asked, “Do you provide the 3D model to the contractor as part as the contract documents?” A total of 9 responses were received, of which 33% indicated “Yes, as part
of the contract documents,” 22% indicated “For informational purposes only,” and 45% indicated “No.” These results are presented in Figure 25.

Next, respondents were asked, “Does your depiction of utilities vary depending on whether their relocation/installation is included as work to be performed by the highway construction contractor, and if so, please elaborate.” A total of 23 responses were received as listed in Table 3.
Table 3: Does your depiction of utilities vary depending on whether their relocation/installation is included as work to be performed by the highway construction contractor, and if so, please elaborate:
| S/N | Responses |
|---|---|
| 1 | Yes, plan and profile is always provided for contract installations. |
| 2 | Yes, we would then include in the plan and profile and cross sections. I don’t believe we’re doing any 3D design for utilities that are part of our plan yet. |
| 3 | No, we depict their location only. |
| 4 | If utility work is to be done by the utility companies, there will be a note indicating the work is to be done by others. |
| 5 | No. |
| 6 | No. |
| 7 | Absolutely, if the utility is being impacted and/or relocated, extra effort and details would be required opposed to the scenario of the utility line is not being impacted based on preliminary investigations. |
| 8 | No variation. |
| 9 | Pictural depiction is the same, but more information is provided (i.e. Station/Offset callouts, Pay Item assignments, construction details as required). |
| 10 | No. |
| 11 | Yes. We indicate responsible party. For work by contractor, we must be very specific - plan, profile, etc. |
| 12 | No. |
| 13 | Yes, 3D design to identify conflicts and constructability. |
| 14 | Yes. 3D design to ID conflicts and verify constructability. |
| 15 | Work in the contract is depicted on Utility Construction plans (typically just water/sewer). Work relocated by the utility owners themselves are depicted on Utility by Others plans (UBO). |
| 16 | No. |
| 17 | Yes, we would add a profile for the utility relocation, if being performed as part of the project. |
| 18 | No. |
| 19 | Yes, the information is included if the utilities relocations are done after the project is let for construction either by the contractor or others. |
| 20 | No. |
| 21 | Yes, alternative delivery projects in general have a higher level of detail. |
| 22 | ITD only notes what utility needs to be relocated or installed. |
| 23 | No. |
Respondents were next asked, “In what format do you communicate the utility data collected (e.g., on a separate set of plans, within the design itself, in a GIS system, etc.)?” A total of 24 responses were received as listed in Table 4.
Table 4: In what format do you communicate the utility data collected (e.g., on a separate set of plans, within the design itself, in a GIS system, etc.)?
| S/N | Responses |
|---|---|
| 1 | On construction details sheets. |
| 2 | We label contacts and depict utility lines on plans. |
| 3 | I understand this information is included in the design itself, but we are working on a process to include in GIS. |
| 4 | Within the design plan sheets only. |
| 5 | Existing utilities are shown on the construction plans. |
| 6 | ADOT recently has transitioned to digital delivery in pdf sheets & ORD format. |
| 7 | Is requested to be submitted as CAD data on as-built record plans. Have a new pay item for Subsurface Utility Survey work that requires the survey data to be submitted by the best available on-site survey means (GPS, Total Station, etc.). |
| 8 | Depends on the level of detail required and whether the utility is being impacted by the project improvements. |
| 9 | Both via pdf plan set and digital CAD files |
| 10 | Plans. |
| 11 | Drainage and Utility Plan set typically. |
| 12 | If a lot of work, on utility plans. If a little, we just add to general highway/construction plans. |
| 13 | The utility data is shown within the design itself as well as on a separate color utility plan for distribution to the utility companies. |
| 14 | On separate set of plans. |
| 15 | Separate set of utility plans. |
| 16 | DGN and PDF. |
| 17 | Within the overall construction plan set for the DelDOT project. |
| 18 | Separate plan sheets. |
| 19 | In the project’s topographic base mapping. |
| 20 | Proposed relocation plans. |
| 21 | SUE utility info sheets are included in our plan sets as “series 11-sheets.” |
| 22 | All formats, the level of detail usually depends on the type and magnitude of the utility in question. |
| 23 | The utility data can either be on the construction plans or separate utility plans based on the number of utilities and project complexity. |
| 24 | Within the design itself. |
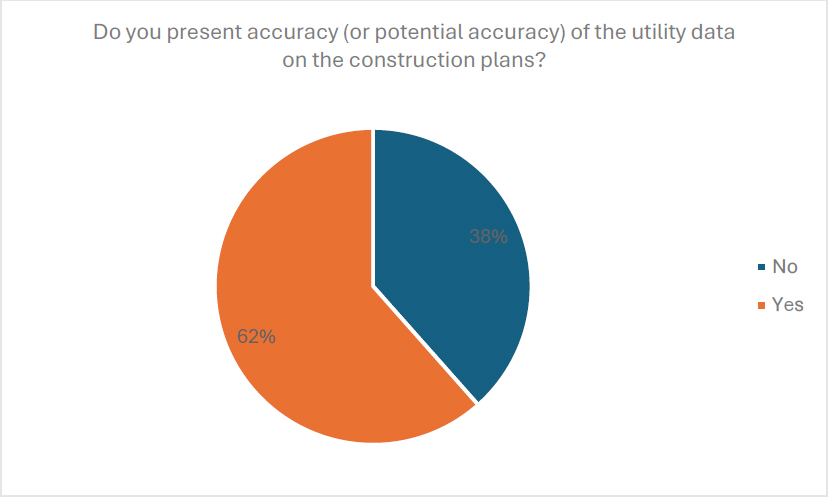
Respondents were also asked, “Do you present accuracy (or potential accuracy) of the utility data on the construction plans?” Twenty-six responses were received, and as seen in Figure 26, 62% indicated “Yes” while 38% indicated “No.”
Next respondents were asked, “How do you present the accuracy of utility data in construction plans (i.e. labeled with SUE quality level, noted from as-built information or utility records, or some combination thereof)?” There were 16 responses received as presented in Table 5 below.
Table 5: How do you present the accuracy of utility data in construction plans (i.e. labeled with SUE quality level, noted from as-built information or utility records, or some combination thereof)?
| S/N | Responses |
|---|---|
| 1 | Combo. |
| 2 | We list the quality level which is typically D or C. If we have and include SUE data then we include the quality level obtained. |
| 3 | Standard Specifications indicate that the known utilities depicted in the plans are approximate. The contractor is required to have them located on the ground. |
| 4 | A note is sometimes included to indicate utilities shown are based on as-builts, or saying location must be field verified. |
| 5 | Utility data are labeled with SUE quality levels A thru D. |
| 6 | The accuracy of the construction data is to be recorded and submitted as part of the subsurface survey data file (e.g., GIS geo file). |
| 7 | We generally indicate how the utility information being portrayed on the plans secured (i.e. - utility company mark-ups, SUE, etc. |
| 8 | SUE quality levels, test hole data sheets may also be provided to contractors. |
| 9 | Combination of label utility with SUE quality level, note from record, etc. |
| 10 | Labeled with SUE quality level and name sources of data. |
| 11 | Different CAD styles for certain SUE types. Sometimes there are callouts per utility records/as-builts/etc. |
| 12 | Labeled w/ SUE Quality Level. |
| 13 | Information is obtained from survey data. |
| 14 | QL’s are defined for each utility line identified. |
| 15 | All utilities are based on a OneCall and survey locate. |
| 16 | The plans are labeled with SUE quality levels and utility records when SUE is used. |
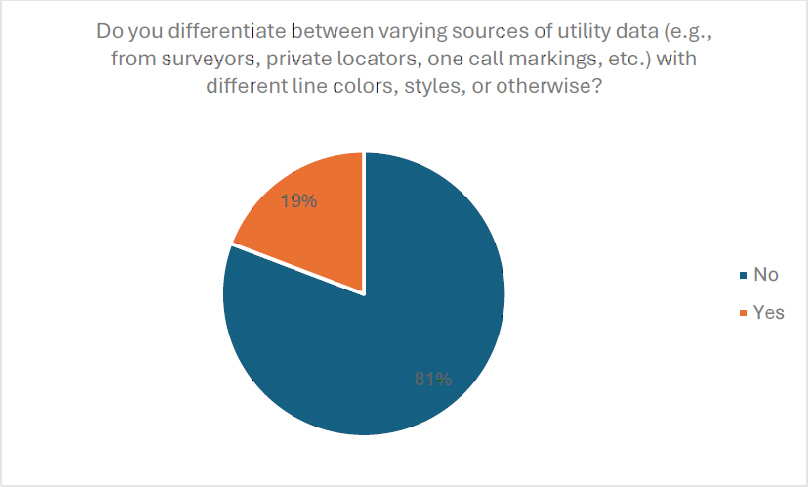
Respondents were also asked, “Do you differentiate between varying sources of utility data (e.g., from surveyors, private locators, one call markings, etc.) with different line colors, styles, or otherwise?” As presented in Figure 27, total of 26 responses were received, of which 81% indicated “No” while 19% indicated “Yes.”
As a follow up to the responses in Figure 27, respondents were asked, “If yes, how so?” The 4 responses received are listed in Table 6 below.
Table 6: If yes, how so?
| S/N | Responses |
|---|---|
| 1 | Sometimes a note may be included to indicate certain utilities are depicted based on as-builts. |
| 2 | Different sources are usually documented on separate levels in the utility base file. one combined representation, typically in consultation with the owner, is reconciled for plan presentation. |
| 3 | Different CAD layers with different colors are provided for record utilities vs estimated/surveyed information. |
| 4 | We do not fully understand the question. |
Next, respondents were asked, “Does your state have standard line styles for depicting utilities when utility information is collected through any of the following means or formats?” A total of 24 responses were received as listed in Table 7. Nine respondents indicated that they did not have standard line styles for depicting utilities.
Table 7: Does your state have standard line styles for depicting utilities when utility information is collected through any of the following means or formats?
| S/N | Responses |
|---|---|
| 1 | We do not have standard line styles for depicting utilities. |
| 2 | We do not have standard line styles for depicting utilities. |
| 3 | We do not have standard line styles for depicting utilities. |
| 4 | We do not have standard line styles for depicting utilities. |
| 5 | We do not have standard line styles for depicting utilities |
| 6 | We do not have standard line styles for depicting utilities |
| 7 | We do not have standard line styles for depicting utilities |
| 8 | We do not have standard line styles for depicting utilities |
| 9 | We do not have standard line styles for depicting utilities |
| 10 | Survey of one call marks, Verbal information, Field visits, SUE providers with quality levels (ASCE 38), Proposed utility relocations/installations (to be completed by the highway construction contractor). |
| 11 | Survey of one call marks, Proposed utility relocations/installations (to be completed by the highway construction contractor). |
| 12 | Records from utilities, Images/aerial imagery, Previous project plans, Utility as-builts, Field visits, SUE providers with quality levels (ASCE 38), Proposed |
| utility relocations/installations (to be completed by utility company contractors), Proposed utility relocations/installations (to be completed by the highway construction contractor). | |
| 13 | SUE providers with quality levels (ASCE 38). |
| 14 | Survey of one call marks, Utility as-builts, Proposed utility relocations/installations (to be completed by utility company contractors), Proposed utility relocations/installations (to be completed by the highway construction contractor) |
| 15 | Records from utilities ,Survey of one call marks, Previous project plans, Utility as-builts, Field visits, SUE providers with quality levels (ASCE 38), Proposed utility relocations/installations (to be completed by utility company contractors), Proposed utility relocations/installations (to be completed by the highway construction contractor) |
| 16 | Records from utilities, Images/aerial imagery, Utility as-builts, SUE providers with quality levels (ASCE 38) |
| 17 | Records from utilities, Utility as-builts, Proposed utility relocations/installations (to be completed by utility company contractors), Proposed utility relocations/installations (to be completed by the highway construction contractor) |
| 18 | Records from utilities, Proposed utility relocations/installations (to be completed by utility company contractors), Proposed utility relocations/installations (to be completed by the highway construction contractor) |
| 19 | We do not have standard line styles for depicting utilities, Records from utilities, Proposed utility relocations/installations (to be completed by utility company contractors), Proposed utility relocations/installations (to be completed by the highway construction contractor) |
| 20 | SUE providers with quality levels (ASCE 38), Proposed utility relocations/installations (to be completed by utility company contractors), Proposed utility relocations/installations (to be completed by the highway construction contractor) |
| 21 | We do not have standard line styles for depicting utilities |
| 22 | Proposed utility relocations/installations (to be completed by utility company contractors), Proposed utility relocations/installations (to be completed by the highway construction contractor) |
| 23 | SUE providers with quality levels (ASCE 38), Proposed utility relocations/installations (to be completed by utility company contractors), Proposed utility relocations/installations (to be completed by the highway construction contractor) |
| 24 | Survey of one call marks, SUE providers with quality levels (ASCE 38) |
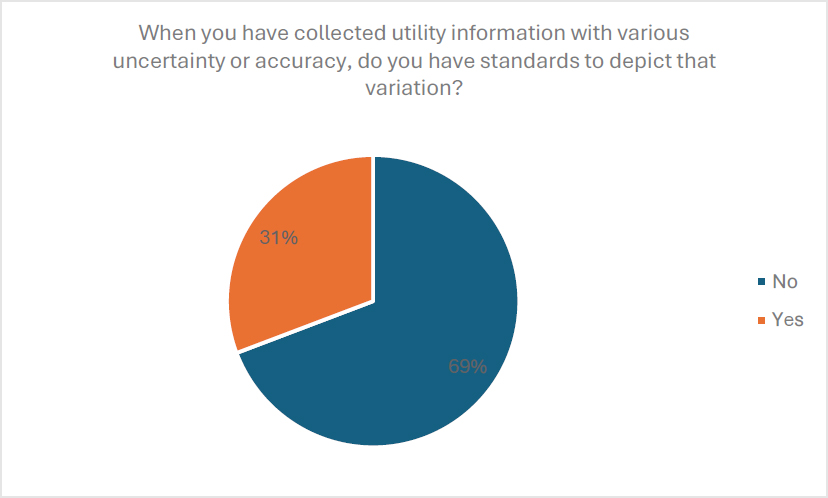
Respondents were asked, “When you have collected utility information with various uncertainty or accuracy, do you have standards to depict that variation?” A total of 26 responses were received, of which 31% indicated “Yes,” and 69% indicated “No,” as shown in Figure 28 below.
As a follow up to the previous question in Figure 28, respondents were asked for elaboration. The 7 responses collected are listed in Table 8 below.
Table 8: Please elaborate
| S/N | Responses |
|---|---|
| 1 | All will be depicted under QLD. |
| 2 | Use CAD element meta data to identify the data source. |
| 3 | Notes on the plans indicating how the utility information was secured. |
| 4 | Plan note citing source of utility information, coupled with standard note informing contractor to verify location of existing utilities. |
| 5 | We would note accuracy typically using SUE level. |
| 6 | We elaborate source as part of our design backup. |
| 7 | https://connect.ncdot.gov/municipalities/Utilities/UtilitiesDocuments/Memo-%20Utilities%20Information%20Shown%20on%20Roadway%20Plans.pdf |
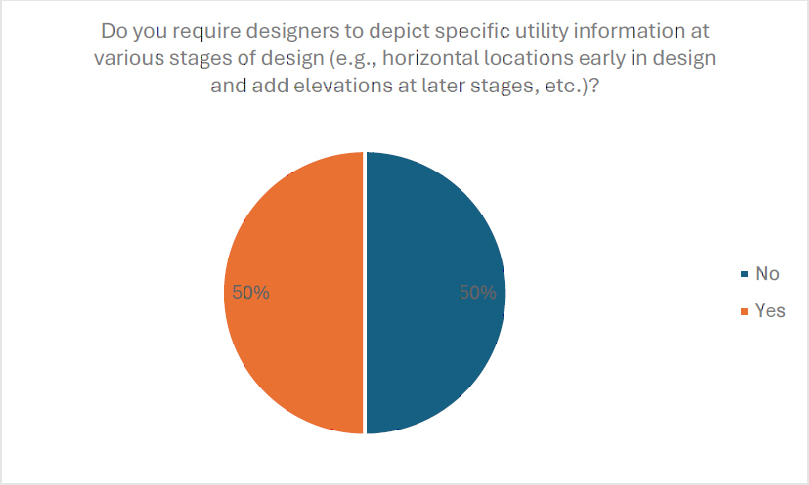
Next, respondents were asked, “Do you require designers to depict specific utility information at various stages of design (e.g., horizontal locations early in design and add elevations at later stages, etc.)?” Twenty-six responses were received, with 50% indicating “Yes” and 50% indicating “No,” as shown in Figure 29.
As a follow up to the question in Figure 29, respondents were asked for elaboration. The 11 responses received are listed in Table 9.
Table 9: Please elaborate
| S/N | Responses |
|---|---|
| 1 | Pothole as needed. |
| 2 | Project mapping depicts all existing utilities; designed utilities horizontal and vertical are to be in the Right-of-Way & Utility plans and cross sections. |
| 3 | Horizontal will be depicted at 30% submittal & vertical at 60% submittal. |
| 4 | Horizontal representations early in the concept development and initial design stages. vertical locations established by SUE or test pits in the Preliminary Engineering Phase for locations that require more design detail and accuracy. |
| 5 | Utilities with the potential for conflict will be provided a higher accuracy of location during the design process to confirm design. This accuracy and designer’s intent to either avoid or relocate the utility would be depicted on the plans. |
| 6 | Proposed horizontal locations are shown on the 25% design and elevations are provided at the 75%. |
| 7 | Horizontal at 25% design. Horizontal and vertical at 75% design to final. |
| 8 | Horizontal locations early in design and add elevations at later stages. |
| 9 | We require the information to be depicted as received from the SUE provider throughout design. Typically, we are getting horizontal (i.e. designation) early in design and go out for elevations obtained through TH’s as the design progresses. The TH info will allow additional elevation info to be added to the plans. We are also working through a 3D designation process so our SUE firms provide some level of elevation on linework as part of the designation delivery. This is in very early stages but the Z value would be refined throughout the design process as TH’s are performed and more accurate data is obtained. |
| 10 | 2D Existing utility contact information & location. Proposed relocations are not currently added to the construction plans. |
| 11 | On cross sections with existing and proposed utility information. |
Next, respondents were asked, “What annotations for utility attributes do you require to be depicted?” Twenty-four responses were received as listed in Table 10 below.
Table 10: What annotations for utility attributes do you require to be depicted?
| S/N | Responses |
|---|---|
| 1 | Size |
| 2 | Size, Material type, Warnings (corrosive, explosive, contains asbestos, etc.), Contact information, Appurtenances (anchors, thrust blocks, etc.) |
| 3 | Size, Material type, Substance (gas, petroleum, jet fuel, etc.), Pressure/Voltage |
| 4 | Transmission/distribution/service |
| 5 | Size, Material type, Encasement, Duct banks, Substance (gas, petroleum, jet fuel, etc.), Transmission/distribution/service, Pressure/Voltage, Private versus public |
| 6 | Size, Material type, Encasement, Duct banks, Substance (gas, petroleum, jet fuel, etc.), Transmission/distribution/service, Pressure/Voltage, Inverts (e.g., in a sanitary manhole, etc.), Appurtenances (anchors, thrust blocks, etc.) |
| 7 | Size, Material type, Substance (gas, petroleum, jet fuel, etc.) |
| 8 | Size, Material type, Encasement, Duct banks, Substance (gas, petroleum, jet fuel, etc.), Pressure/Voltage, Inverts (e.g., in a sanitary manhole, etc.) |
| 9 | Size, Material type, Encasement, Duct banks, Substance (gas, petroleum, jet fuel, etc.), Transmission/distribution/service, Inverts (e.g., in a sanitary manhole, etc.), Contact information |
| 10 | Size, Material type, Encasement, Duct banks, Transmission/distribution/service, Inverts (e.g., in a sanitary manhole, etc.) |
| 11 | Size, Material type, Encasement, Duct banks, Substance (gas, petroleum, jet fuel, etc.), Transmission/distribution/service, Pressure/Voltage, Inverts (e.g., in a sanitary manhole, etc.), Contact information |
| 12 | Size, Material type, Encasement, Duct banks, Substance (gas, petroleum, jet fuel, etc.), Inverts (e.g., in a sanitary manhole, etc.), Private versus public, Contact information, Appurtenances (anchors, thrust blocks, etc.) |
| 13 | Size, Material type, Encasement, Duct banks, Substance (gas, petroleum, jet fuel, etc.), Transmission/distribution/service, Pressure/Voltage, Inverts (e.g., in a sanitary manhole, etc.), Installation date, Private versus public, Appurtenances (anchors, thrust blocks, etc.) |
| 14 | Size, Material type, Encasement, Duct banks, Substance (gas, petroleum, jet fuel, etc.), Pressure/Voltage, Inverts (e.g., in a sanitary manhole, etc.), Installation date, Warnings (corrosive, explosive, contains asbestos, etc.), Private versus public, Appurtenances (anchors, thrust blocks, etc.) |
| 15 | Size, Material type, Encasement, Duct banks, Substance (gas, petroleum, jet fuel, etc.), Pressure/Voltage, Inverts (e.g., in a sanitary manholes, etc.), Installation date, Warnings (corrosive, explosive, contains asbestos, etc.), Appurtenances (anchors, thrust blocks, etc.) |
| 16 | Size, Material type, Encasement, Duct banks, Substance (gas, petroleum, jet fuel, etc.), Inverts (e.g., in a sanitary manhole, etc.) |
| 17 | Size, Material type, Duct banks, Substance (gas, petroleum, jet fuel, etc.), Inverts (e.g., in a sanitary manhole, etc.), Appurtenances (anchors, thrust blocks, etc.) |
| 18 | Other: |
| 19 | Size, Material type, Encasement, Duct banks, Substance (gas, petroleum, jet fuel, etc.), Inverts (e.g., in a sanitary manhole, etc.) |
| 20 | Size, Material type, Substance (gas, petroleum, jet fuel, etc.), Transmission/distribution/service, Inverts (e.g., in a sanitary manhole, etc.), Private versus public, Contact information, Appurtenances (anchors, thrust blocks, etc.) |
| 21 | Size, Material type, Encasement, Duct banks, Substance (gas, petroleum, jet fuel, etc.), Transmission/distribution/service, Inverts (e.g., in a sanitary manhole, etc.), Private versus public, Contact information, Other: |
| 22 | Size, Material type, Encasement, Duct banks, Substance (gas, petroleum, jet fuel, etc.), Transmission/distribution/service, Inverts (e.g., in a sanitary manhole, etc.) |
| 23 | Substance (gas, petroleum, jet fuel, etc.), Inverts (e.g., in a sanitary manhole, etc.) |
| 24 | Size, Material type, Encasement, Duct banks, Substance (gas, petroleum, jet fuel, etc.) |
Those who selected “other” in the responses seen in Table 10 were asked to input an explanation of that response. Two responses were received and are listed in Table 11 below.
Table 11: Other
| S/N | Responses |
|---|---|
| 1 | Line location only |
| 2 | Active vs Abandoned |
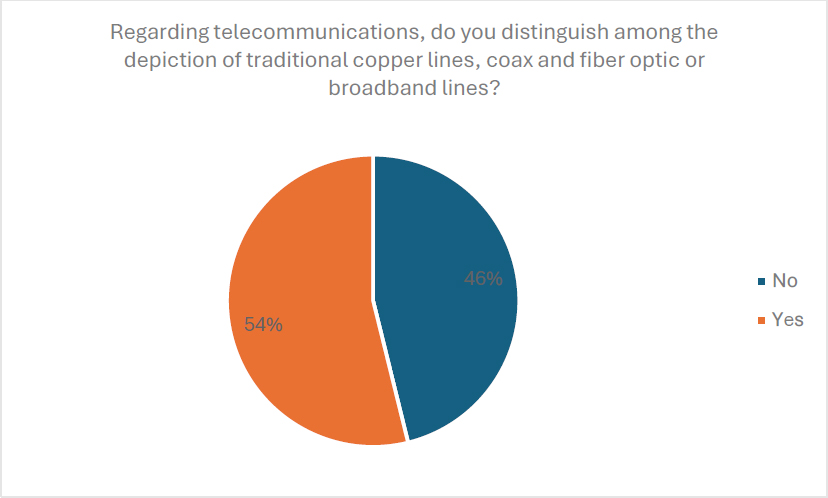
Respondents were also asked, “Regarding telecommunications, do you distinguish among the depiction of traditional copper lines, coax and fiber optic or broadband lines?” A total of 26 responses were received, of which 46% indicated “No,” while 54% indicated “Yes,” as seen in Figure 30.
As a follow up to previous question, respondents were asked to describe their distinction approach. A total of 9 responses were received as listed in Table 12 below.
Table 12: Please describe your distinction approach.
| S/N | Responses |
|---|---|
| 1 | See the Survey Collection Manual. |
| 2 | Typical depictions are FO, T & TV. |
| 3 | We would distinguish fiber telecommunications with FO indicating fiber optic. |
| 4 | Fiber and their carriers are especially important to distinguish. Often utilities lease space on their poles to “dark fiber” companies which should be identified and coordinated during design to avoid construction delays. |
| 5 | These lines are distinguished to the maximum extent possible using the information available. |
| 6 | Denote copper, coax and fiber optic or broadband. |
| 7 | For buried facilities we call them out as telephone, cable, or fiber optic (or duct bank). |
| 8 | Fiber, copper, duct bank etc. |
| 9 | ITD only differentiates fiber optic lines from other telecommunications. This is done through different line styles. |
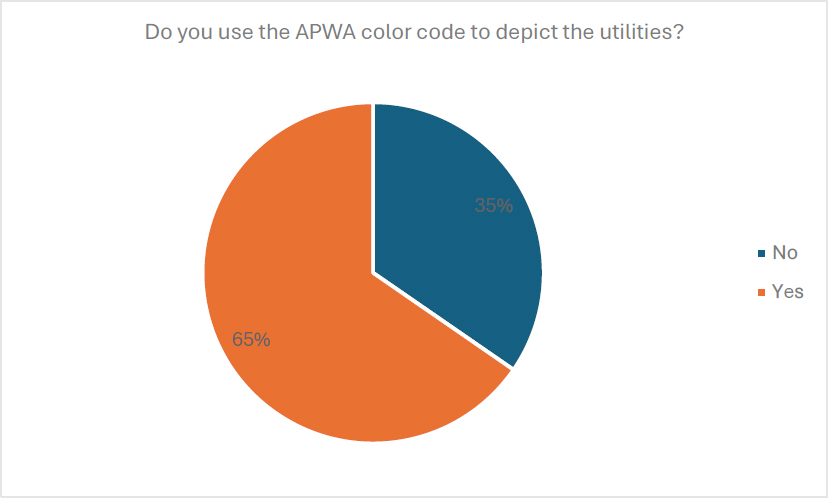
Respondents were asked, “Do you use the APWA color code to depict the utilities?” A total of 26 responses were received, of which 35% indicated “No” while 65% indicated “Yes,” with the responses shown in Figure 31.
As a follow up to the previous question, respondents were asked, “Please describe the use of the APWA color code, is it uniform across CAD files, working files, and final plans, is color allowed within final plan sets, and are the colors according to the Pantone Matching System (PMS) codes?” A total of 14 responses were received which are listed in Table 13 below.
Table 13: Please describe the use of the APWA color code, is it uniform across CAD files, working files, and final plans, is color allowed within final plan sets, and are the colors according to the Pantone Matching System (PMS) codes?
| S/N | Responses |
|---|---|
| 1 | Uniform across CAD files |
| 2 | This is a good question. One that I don’t have the answer to but will work on finding. My assumption is that this is the same across all files. |
| 3 | Standard colors are used in the plans with the expectation of gas. Gas was modified to purple as yellow is not easily seen in the plans. |
| 4 | Modified use of the color code. Changed some colors that displayed too similarly (i.e., repurposed the color purple), darken yellow to display better/photocopy better. NYSDOT developed specific colors for each type of utility displayed on final plans. |
| 5 | Color coding used in working files and CAD base files. Final plans are not in color. Utility agreement plans use a different coloring system to represent existing facilities to remain (black), existing facilities to be removed (red), temporary facilities (yellow), and proposed facilities (green). |
| 6 | CAD files only. |
| 7 | Utility agreement/relocation plans for agencies require use of the colors. |
| 8 | The color code is uniform across all files. Color is allowed within the final plan set. |
| 9 | We mirror APWA. We are not familiar with PMS codes. |
| 10 | Generally it is used in the CAD environment and designers provide working plans (pdfs) to utility companies with facilities depicted based on the APWA color code. Generally, the PDF plans used for coordination with utility companies are roll plans to make it easier for companies to evaluate the entire project. Sometimes these may be provided as .KMZ files for ease of use. A PDF set of the actual construction plan set is also provided to utilities but the linework is not shown in color. CAD files are also typically provided to utility companies with each milestone as some will utilize the files to review and provide relocation designs. |
| 11 | Actually....I’m not sure! You’ve put together some great questions!! Several can help me put together additional requirements on our own plans. Can you share these questions? |
| 12 | Arkansas One Call marking code is used. This should match APWA. |
| 13 | The line styles are predefined in the CAD file. |
| 14 | We use the basic APWA color code. |
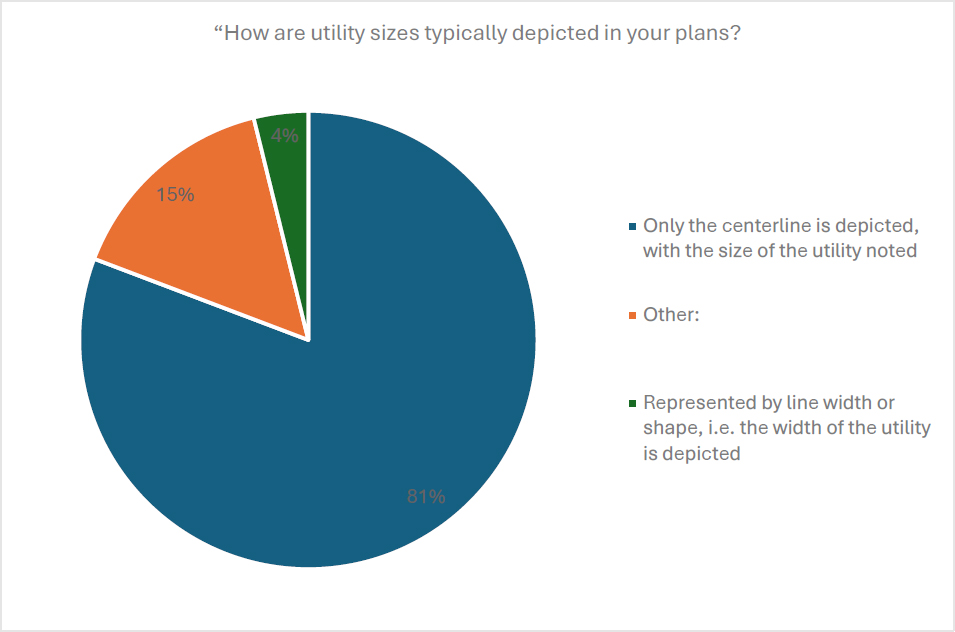
Respondents were asked, “How are utility sizes typically depicted in your plans?” Twenty-six responses were received, of which 81% indicated “Only the centerline is depicted, with the size of the utility noted,” 15% indicated “Other,” while 4% indicated “Represented by line width or shape, i.e. the width of the utility is depicted.” These results are shown in Figure 32 below.
As follow up to the respondents of Figure 32 selecting “Other,” four responses provided additional information listed in Table 14 below.
Table 14: Other
| S/N | Responses |
|---|---|
| 1 | Both methods are used depending on size & type. |
| 2 | The centerline is depicted unless the utility diameter is 2 feet or greater and then the width is depicted. |
| 3 | This will change, as ASCE 38-22 is more universally used. |
| 4 | Utility size is called-out in a leader. |
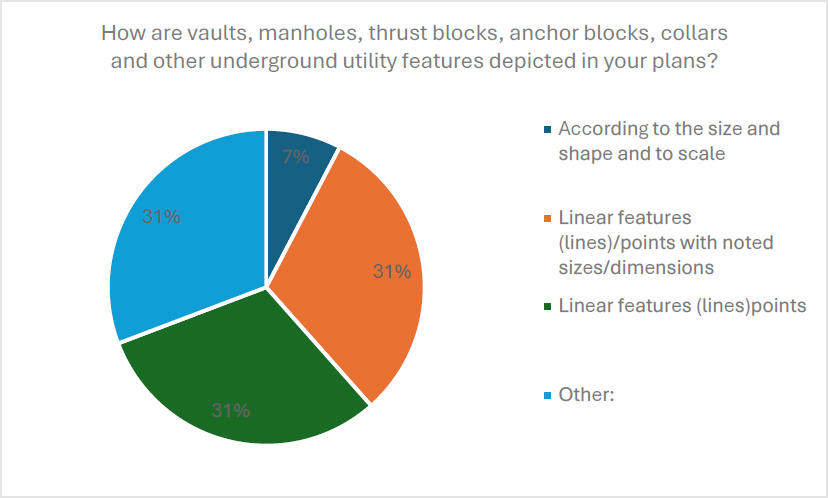
Respondents were asked, “How are vaults, manholes, thrust blocks, anchor blocks, collars and other underground utility features depicted in your plans?” A total of 26 responses were received, of which 7% indicated “According to the size and shape and to scale,” 31% indicated as “Linear features (lines)/points with noted sizes/dimensions,” 31% indicated as “Linear features (lines)points,” and 31% indicated “Other.” The results are shown in Figure 33 below.
As a follow up to the previous question, those who indicated “Other” were asked to explain further. A total of 8 responses were received as listed in Table 15 below.
Table 15: Other
| S/N | Responses |
|---|---|
| 1 | Location is only depicted by a standard mapping cell representing the item. |
| 2 | Depict vaults & manholes. |
| 3 | Symbology for manholes and valves only. |
| 4 | Vaults, manholes would be shown. Anchor blocks and collars would be shown on proposed facilities. |
| 5 | Generally they are shown as linear features and points for plan purposed but designers will show more realistic features in the CAD environment. |
| 6 | Only vaults & manholes are depicted with a linear line or point, but only if we have the info available to us. |
| 7 | MH’s, vaults shown, but not anchors, collars, thrust blocks. |
| 8 | Standard Symbols. |
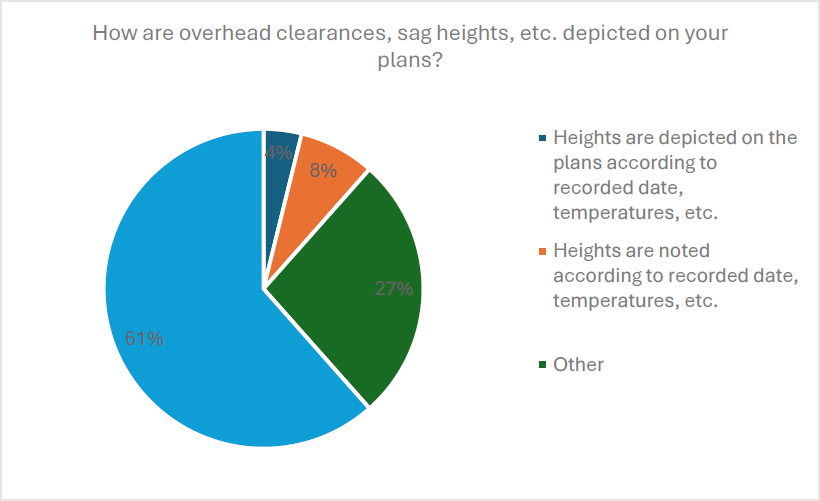
Next, respondents were asked, “How are overhead clearances, sag heights, etc. depicted on your plans?” A total of 26 responses are presented in Figure 34, with 61% indicating “These are not typically depicted or communicated,” 8% selecting “Heights are noted according to recorded date, temperatures, etc.,”, 4% selecting “Heights are depicted on the plans according to recorded date, temperatures, etc.” and 27% selecting “Other.” The majority of the “Other” responses indicated approach was completed as required by the project needs.
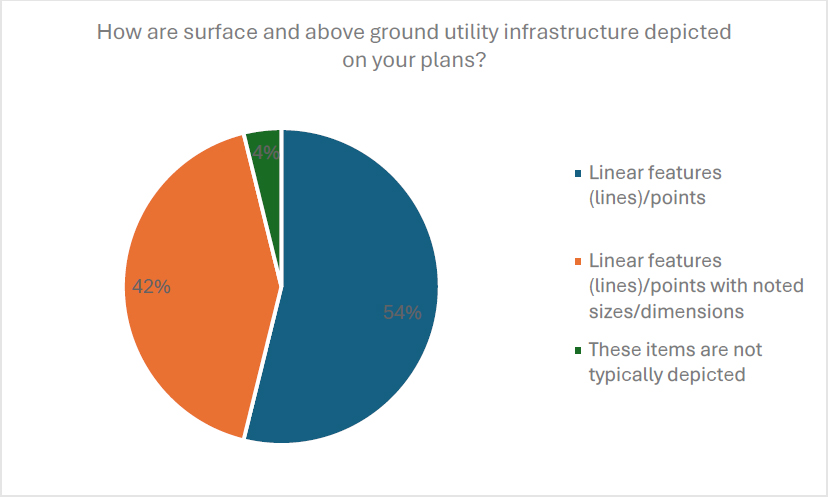
Respondents were next asked “How are surface and above ground utility infrastructure depicted on your plans?” A total of 26 responses were received, with 54% indicating depiction by “Linear features (lines)/points”, 42% by “Linear features (lines)/points with noted sizes/dimensions” and 4% noted “These items are not typically depicted.” These results are shown in Figure 35.
Respondents were next asked, “How are surface and above ground utility appurtenances (e.g. guy wires, anchors, etc.) depicted on your plans?” Figure 36 presents the breakdown of the 26 responses received, with 58% indicating depiction by “Linear features (lines)/points”, 11% by “Linear features (lines)/points with noted sizes/dimensions”, 4% indicated “Other”, 23% indicated “These items are not typically depicted” and 4% indicated depiction by “According to sizes and shapes and to scale.”

Next respondents were asked, “How are layers used to depict utilities within your plans (e.g. all utilities in one layer, each utility type in their own layer, etc.)?” A total of 25 responses were received with the 5 respondents indicating all the utilities are depicted in one layer, a majority indicated each utility was in their own layer, and the remainder indicating they were not sure.
Respondents were also asked how they depicted abandoned utilities, with the majority of the 24 responses indicating the utilities were simply labeled as abandoned.
In response to, “Do you provide guidance on depicting utility land rights and/or interests?,” a total of 26 responses indicated the results seen in Figure 37.

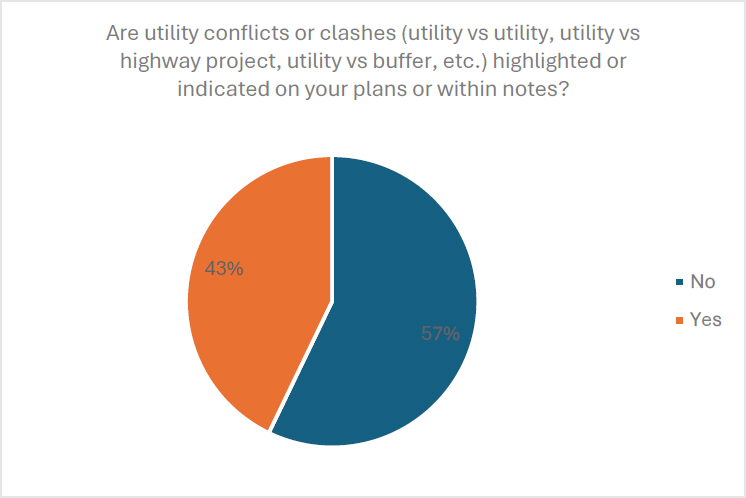
Next, respondents were asked, “Are utility conflicts or clashes (utility vs utility, utility vs highway project, utility vs buffer, etc.) highlighted or indicated on your plans or within notes?” A total of 21 responses were received, as shown in Figure 38. The majority of those indicating the clashes noted they were called out by notations or placed in a table.
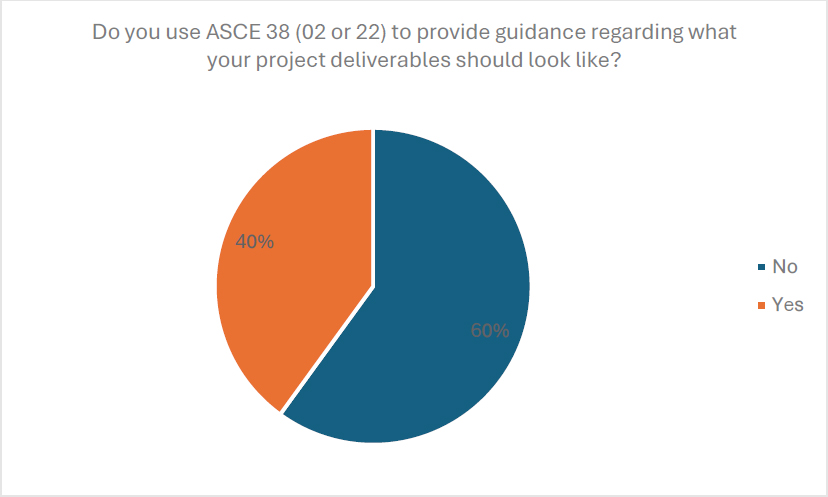
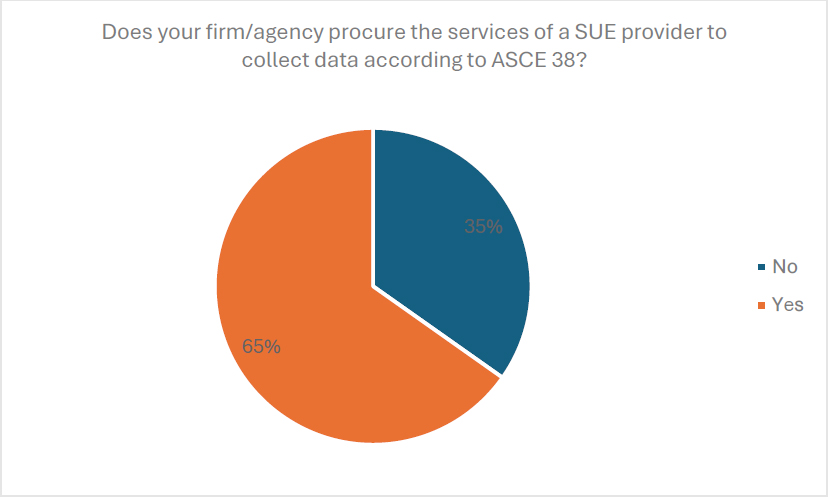
Respondents were next asked, “Do you use ASCE 38 (02 or 22) to provide guidance regarding what your project deliverables should look like?” A total of 25 responses were received as presented in Figure 39.
The respondents from Figure 39 who responded “Yes,” were asked, “Does this guidance include the depiction examples in the appendix of the ASCE 38 (02 or 22) appendices?” The 10 responses received are presented in Figure 40. Those not including the examples, noted that guidance for depiction was provided in various sources of standards.

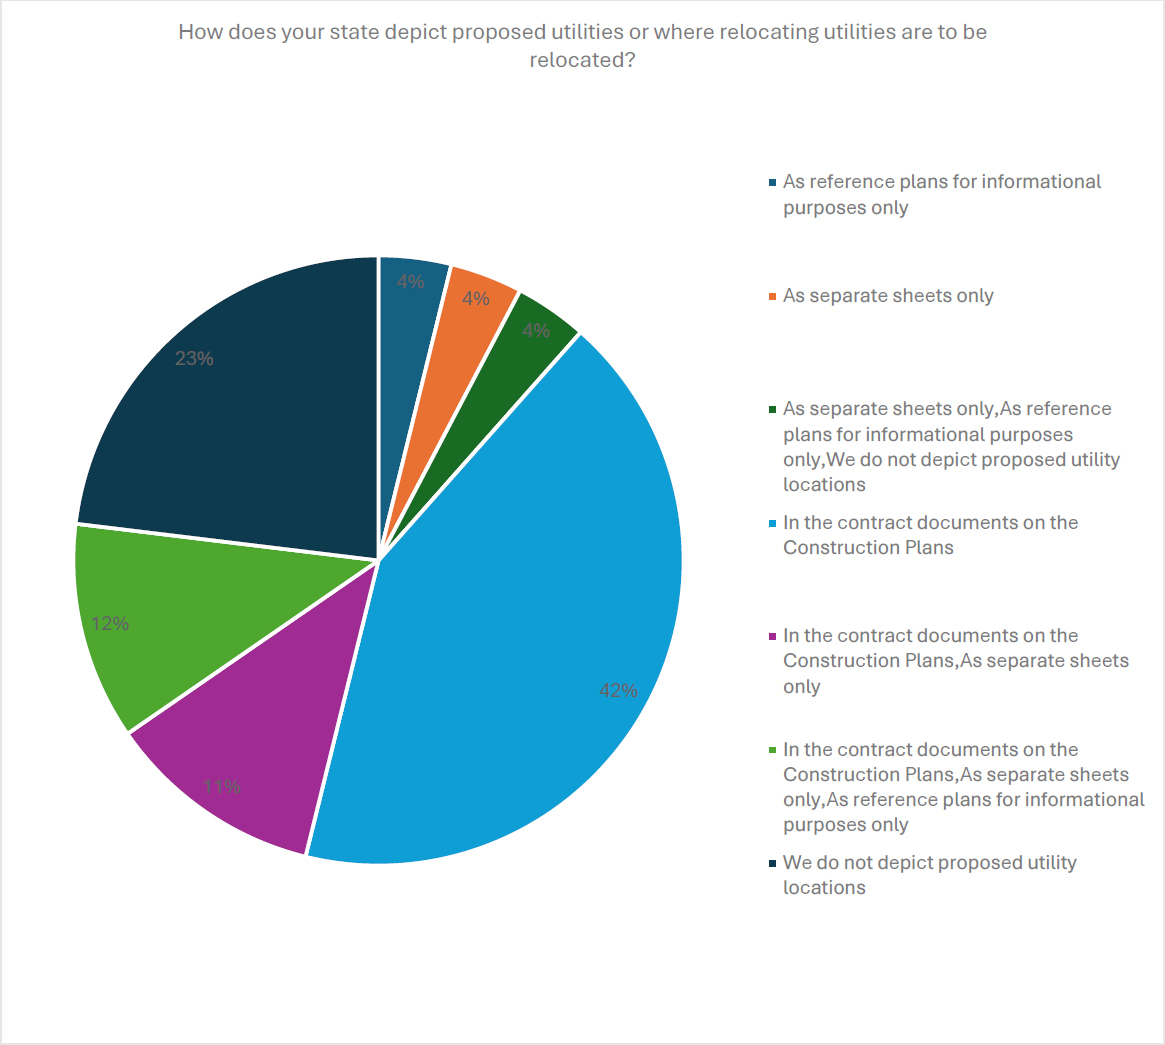
Respondents were next asked, “How does your state depict proposed utilities or where relocating utilities are to be relocated?” The 26 responses received are shown in Figure 41.
Respondents were also asked how they depict unknown utilities and how they balance depiction with over-cluttering plans. The responses to these questions varied but indicated a wide range of approaches and a lack of standard approach.
Respondents more consistency in using firm/agency survey crews to collect one call markings and/or above ground utility features. The 23 responses to this question are presented in Figure 42.


Based on having these various sources of data, respondents were asked who analyzed the data to bring it into consensus. The respondents largely noted that this task was left up to the survey crews, while others noted it was completed by the SUE provider or by team effort. Again, an indication of needing a standard approach.
Next, respondents were asked when utility data was provided to design teams and how changes in utility data were communicated to design teams. These responses indicated a wide range of responses and indicated a need for consistency. An example of this variation is seen in the 23 responses provided in response to, “How is utility data presented to the design team?” These responses are presented in Figure 45.

There was improved consistency in the 23 responses to, “Within your firm/agency, how is utility data used within the development of a transportation project?” This is presented in Figure 46.

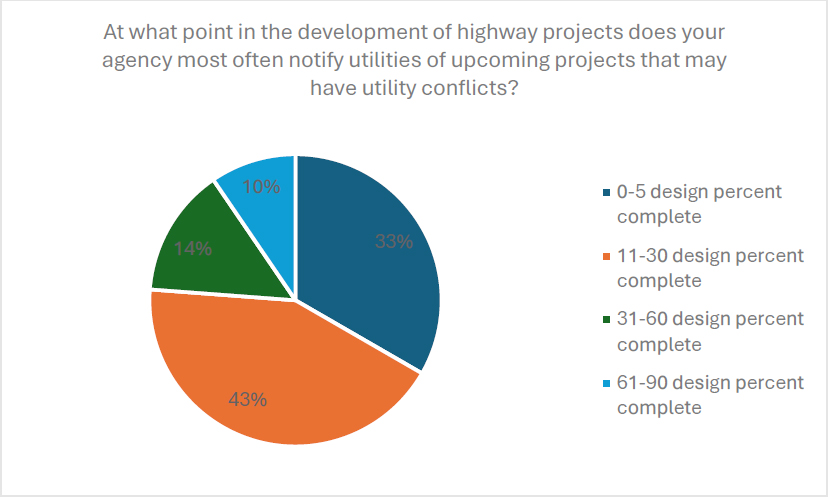
The variation of responses returned when discussing utility as-builts. While the majority of the respondents indicated that they adopted or planned to adopt the ASCE 75-22 (“Utility As-built Standard”), the use of as-builts, collection and storage of as-builts, and use of utility repositories varied widely. There was also variation in the 21 responses to when utilities were notified of conflicts, as seen in Figure 47.
Findings and Knowledge Gaps from the Practitioner Survey Feedback
The feedback from the practitioner surveys was focused on the responses provided by the state DOTs and consultants. While there are additional survey questions completely displayed herein, the bulk of the feedback is summarized above. The findings represent feedback focused on the objective of understanding how state DOTs depict utilities in highway plans. While ASCE 38 and 75 standards provide general guidelines and serve a role in delivering these objectives, there are notable details lacking where state DOTs could provide further information. However, stemming from the feedback summarized herein, it seems several state guidelines also have limitations in this area or there is at least significant variation across states. A few state DOTs noted more advanced practices, such as noting shape details, using APWA color coding, labeling utilities according to SUE quality levels, and additional best practices. These are examples of practices that will be highlighted in the final guidance of this project.
As summarized from the results herein, it appears there are deficiencies in depicting utility sizes, shapes, and appurtenances, deficiencies in depicting utilities in 3D, and unstandardized notation of the quality levels or source of data regarding utility locations. It also appears that there are lesser deficiencies in depicting the depth or elevation of a utility. These findings further indicate a need for this research and guidance to build consistency. The findings also highlight states where practices can be collected to assist in the development of the guidelines. The state DOTs that provided notable feedback of importance to the guidelines include Arizona, California, Colorado, Delaware, Georgia, Massachusetts, New Jersey and Texas.


