Developing a Guide to Depicting Utility Facilities in Design Plans (2026)
Chapter: Appendix A: Literature Review
Appendix A—Literature Review
Overview of SUE
Subsurface utility engineering (SUE) is defined by the American Society of Civil Engineers (ASCE) in 2022 as: “the specialty practice of civil engineering’s Utility Engineering branch that includes the investigation, analysis, judgment, and documentation of existing Utility networks.” This broad definition includes the original premise and practices of SUE which were the use of appropriate geophysics to attempt to find all known and unknown utilities within a project’s limit, and then safely expose those utilities at points of potential conflict with design elements. These original performance goals have, at times, been subverted with the rapid growth of the practice, resulting in a wide range of disparate means and methods, deliverables, and scopes of work. To uninformed users, the term SUE can mean almost anything so long as a pipe and cable locator and/or a vacuum machine were used as tools. However, for engineering professionals the practice of SUE has evolved from a mere designating and locating technique to an entire utility risk management process that is usually tailored to individual projects.
Evolution of ASCE SUE Standards
In 2002, the American Society of Civil Engineers formally established a standard (ASCE 38-02) for collecting and depicting subsurface utility data. ASCE 38-02 was primarily developed to address the unknown reliability and lack of credibility of utility data as depicted on design and construction plans coming from a variety of sources such as in permit records, as-built plans, past design plans, maintenance or repair records, visual observation and word of mouth. This lack of reliability has associated utility conflict resolution costs that are passed on to the public (Thelin et al. 2011). The FHWA (2017) report SUE then and now provides a historical background for the development of Subsurface Utility Engineering (SUE) from the early 1980s to what it is today. This is supplemented with additional details in the NCHRP Synthesis 583 Implementation of Subsurface Utility Engineering for Highway Design and Construction (Sturgill et al. 2022).
One of the primary benefits of ASCE 38-02 is the allocation of quality levels to sources of utility data depicted on plans (QLA to QLD with QLA being the most detailed). The quality levels help designers to allocate risk associated with the data, thereby making risk-informed decisions in their design.
QLA, also known as “locating”, is the highest level of accuracy presently available, but typically only at a single point where the utility is safely exposed. It provides information at points of potential design conflicts and provides the type, size, condition, material and other characteristics of underground features (FHWA, 2018).
QLB involves application of appropriate surface geophysical methods to determine the existence and horizontal position of virtually all utilities within the project limits. This activity is called “designating”. The information obtained in this manner is surveyed to project control
and is used to identify problems caused by inaccurate or missing utility records, abandoned or unrecorded facilities, and lost references. Using QLB information, decisions regarding location of storm drainage systems, footers, foundations and other design features can be made to successfully avoid conflicts with existing utilities. Slight adjustments in design can produce substantial cost savings by eliminating utility relocations (FHWA, 2018).
QLC involves surveying visible utility facilities (e.g., manholes, valve boxes, etc.), opening vaults and other structures, and correlating this information with existing utility records (QLD information). During QLC investigations, it is not unusual to find that many underground utilities have been either omitted or erroneously plotted. Its usefulness, therefore, is primarily on rural projects where utilities are not prevalent, or are not too expensive to repair or relocate (FHWA, 2018), or when more certainty cannot be obtained. This is the most commonly used level of information and is identical to a topo survey.
QLD contains data that is primarily obtained from existing utility records or verbal recollections, both typically considered unreliable sources. Combined, these sources may provide an overall “feel” for the congestion of utilities. QLD is useful primarily for project planning and route selection activities (FHWA, 2018) and when more certainty cannot be obtained.
Therefore, the summary of the SUE QLs is as follows:
QLA provides precise location of utilities via nondestructive exposure of underground utilities]
QLB uses surface geophysical methods to determine the existence and horizontal position of utilities
QLC involves surveying visible utility facilities and correlating this information with existing utility records
QLD involves solely using existing utility records or verbal recollections that are both typically unreliable sources.
In addition to ASCE 38-02, ASCE is developed ASCE 75 which is often termed the ASCE as-built standard. The new ASCE 75 Standard Guideline for Recording and Exchanging Utility Infrastructure Data is expected to serve as the standard guideline for depicting utility infrastructure when this infrastructure is being “newly installed” or “exposed.” It is expected to complement ASCE 38-02, which is the standard for depicting “existing” or “already buried” utilities. ASCE 75 includes standards for using spatial data and feature attributes that together provide 3D models of utility installations tied to real-world coordinates. The standard provides a common definition for positional accuracy of utility infrastructure and defines a minimum criterion for data attributes that help to understand a facility such as a type, material, function, ownership, etc. The standard will be relevant to both aboveground and underground facilities for permanently recording the locations of these facilities through direct measurement methods (Sturgill et al. 2022). It is further important to note that ASCE 38 was revised in 2022.
SUE Implementation Challenges and Successes
Despite the benefits of the standard, the application of ASCE 38-02 by state departments of transportation (DOTs) has not been entirely consistent or successful. For example, in a survey study of Texas DOT by Kraus et al. (2012), they found that stakeholders did not readily see the benefits of QLA and QLB SUE investigation, especially in terms of return on investment (ROI). The survey further showed that several stakeholders were confused about the SUE terminology and often attributed QLA/QLB as SUE. While they may have depicted QLC and QLD data as part of their design process, activities associated with achieving these QLs were not associated by these stakeholders as being SUE. Furthermore, the stakeholders also confused one call service as QLA or QLB. One call service is the national call before you dig number which when contacted allows utility owners to markup the approximate location of their utilities to prevent accidental utility strikes during digging.
Other challenges associated with improper understanding and inability to appropriately implement SUE also exist. For example, Kraus et al. (2012) noted that the Texas DOT and their stakeholders often found achieving higher levels of SUE (i.e., QLA and QLB) challenging due to lack of specialized equipment. This led to the infrequent use of QLA and QLB depiction of utility data. This challenge of achieving higher QLs is not unique to Texas. Past research has found that 53% of state DOTs indicated that their method of utility investigation was via as-built plans and One Call services (FHWA 2018). This report further stated that only 12 DOTs used a risk-based SUE approach for locating utilities. Recognizing these challenges, Kraus et al. (2012) recommended training and education on SUE.
Despite these challenges, successful implementation of SUE occurs regularly. Thelin et al. (2011) studied two DOT projects (I-5 At Beltline Interchange Project, Oregon and I-82 at Valley Mall Boulevard Interchange Project, Washington) in order to extract information on the implementation of SUE. In each project, SUE process was fully adopted including a records search, surveying, designating, locating, data management and utility coordination. In the I-5 At Beltline Interchange Project, an example of the successful implementations included the use of QLD, QLC and QLB information in order to recommend QLA test holes to confirm depths at construction areas. Based on these test holes, 3D models were developed enabling the resolution of select utility conflicts by design modification and planning of relocation of utilities, which helped achieve the project schedule. In the I-82 at Valley Mall Boulevard Interchange Project, successful SUE implementation was exemplified through preliminary clarification of discrepancies between base plans and QLC and QLD generated plans, which was combined with QLB to further designate utilities. The discovery of significant information of utilities using QLC, QLD and QLB together resulting in non-recommendation of test holes to save cost.
Retrieval, management, and depiction of data for various utilities
Common subsurface utility locating technologies
Depending on the underlying geophysical technology, utility investigation methods can generally be classified into three categories which are often combined in a typical SUE investigation to achieve a more accurate and reliable data (Kraus et al. 2013). These include:
- Electromagnetic wave methods (e.g., Ground Penetrating Radar [GPR], pipe and cable locators, electromagnetic induction, and electromagnetic terrain conductivity and Infrared thermography),
- Mechanical wave methods (e.g. acoustic location),
- Other methods (e.g., electricity resistivity methods, magnetic methods, micro-gravitational methods, and chemical methods).
Geophysical methods are often known to be more reliable for providing horizontal locations of utilities rather than vertical locations, even after applying rigorous engineering judgement (Quiroga et al. 2018). In addition, the use of radio frequency identification (RFID) marker balls to mark the location of utility facilities can significantly reduce utility damage events which may be caused by incorrect utility markings (Quiroga et al. 2018). Additionally, efforts have been made to improve existing geophysical methods of utility investigation. For example, the details of improvements made to GPR, time-domain electromagnetic induction (TDEMI) system and high frequency seismic imaging technologies can be found in the SHRP2 report R01B Utility-Locating Technology Development Using Multisensor Platforms. The improvements were geared towards data collection accuracy and efficiency as well as improved visualization and interpretation (Young et al. 2014).
According to Anspach et al. (2012), some utilities can be detected by several methods, others by a single method or some only from excavation. The ability to locate these utilities is highly dependent on the method used by the utility owner. To help engineers determine which type of geophysics to employ in a particular situation, decision-making tools have been developed. Two key tools include:
- Selection Assistant for Utility Locating Technologies (SAULT): The SAULT decision tool was developed based on the general guidance of experienced utility location professionals to serve as a starting point for evaluating the expected success rate of various utility locating activities. SAULT receives its inputs through a web based interactive dialogue that guides the user through series of choices. The user then receives a summary report listing all the suitable utility locating methods for the site under consideration (Sterling et al. 2011).
- Deterministic Parallel Selection Technique (DPST) : This tool takes site conditions as inputs to the decision framework and uses the deterministic parallel selection technique (DPST) to evaluate the applicability of various subsurface imaging technologies based on a pre-established knowledge base. The tool then discards irrelevant technologies and ranks
- the remaining imaging technologies based on their appropriateness for the site (Jeong and Abraham 2004).
Development of new technologies for acquiring better utility data
Variations in soil, geology and environmental conditions as well as utility material, depths and diameters has necessitated the development of a suite of new technologies for detecting and mapping utilities. According to Anspach, J. H. (2018), government sponsored programs have supported the advancement in technology for utility investigation including Optimizing Radar to Find Everything Under the Street (ORFEUS) by the European Union, Mapping the Underworld project by England and the Strategic Highway Research Program by United States. Some of the developed technologies that resulted from these programs include:
- Multi-channel GPR
- Time-Domain Electromagnetics
- Pipe and Cable locating devices.
The SHRP2 report S2-R01-RW Encouraging Innovation in Locating and Characterizing Underground Utilities (Sterling et al. 2009) presented procedures for improving surface geophysical techniques, using existing techniques more effectively, and integrating the techniques with better recordkeeping. The research documented ongoing technology developments through various research and development programs. Some of these included:
- American Water Works Association Research Foundation (AWWARF)/Operations Technology Development(OTD)/Gas Technology Institute(GTI) Partnership Program which investigates emerging technologies such as capacitive tomography, radio frequency vibration, acoustic pipeline locating, and visualization technologies
- The acoustic pipe locator program by GTI which can detect plastic pipes at a 36 to 1 depth to diameter ratio
- The locatable plastic pipe developed by GTI which was ingested with magnetized strontium ferrite particles,
- The array remote sensing technology developed by Witten Technologies that provides sufficient data for tomographic reconstruction of buried objects
- The Terravision GPR unit developed by Underground Imaging Technologies, Inc. that includes a multisensor time domain electromagnetic system and software capable of data in 3D workspace
- The forced resonance system developed by Bhaktar Associates capable of detecting small diameter objects in conductive soils,
- NYSEARCH which uses a technique called hyper radar to detect buried objects with high depth to diameter ratio and the double threshold detection approach developed by Ingegneria dei Sistemi SpA (IDS).
Apart from these programs, the SHRP2 report also suggested areas of improvement for finding deep utilities, nonconducting utilities, congested utilities, unfavorable site conditions, mitigation
of practical limitations on theoretical performance of locating technologies, multisensor approaches, target recognition, 3-D location, and transfer to GIS/CAD (Sterling et al. 2009).
In a follow up SHRP2 S2-R01C-RW-1 research titled Innovations to Locate Stacked or Deep Utilities (Hammerschmidt et al. 2014), they presented research and development efforts for detecting, identifying and mapping deeply buried utilities and utilities that are stacked or congested. A total of five technologies were identified for review in the report and two of these technologies (long range RFID tags and active acoustic locating devices) were further developed as prototypes (Hammerschmidt et al. 2014). The technologies were as follows:
- The proposed modification to RFID tags called RuBee tags that works at a lower frequency and is able to detect buried pipes at depths of up to 35fts.
- The inertial navigation system which will see improvements such as hot tapping to enable installation on live utilities, integration with smart tags for more accurate distance calculations and the use of long armed keyhole tools to minimize the size of excavation needed to install the inertial mapping tools.
- The electromagnetic (EM) noncontact technology which has proposed improvements that will allow it to detect multiple metal pipes without the need to inject current into the pipe by passing a prototype tool through non-metallic pipes. The EM technology can also detect RFID or RuBee tags.
- The seismic reflection technology which improves on previous technology by using horizontal and vertical shear waves to detect deeply buried pipes. These S-waves have shorter wavelength which helps improve pipe imaging.
- The active injection acoustic technology which uses sound waves that travel in one direction (from pipe to surface) which has reduced attenuation due to lesser distance traveled for detection. The technology also works at lower frequencies which also reduces attenuation and can detect passive noise such as flow noises in natural gas or water pipes.
Finally, Zeiss (2018) reported the development of a combined mobile LiDAR and GPR system for the 3D mapping of aboveground and underground facilities. The system was first developed by Ingegneria dei Sistemi (IDS) GeoRadar and it combines GPR with mobile LiDAR into a single towed rig unit. The combined system was successfully tested on a roadway project at Mississauga, Ontario with data collected by a Siteco rig which consisted of a Faro mobile LiDAR scanner and Sensor and Software GPR arrays. The Siteco rig was able to collect data at speeds 80 to 90km/hr and the Siteco software made it possible to visualize aboveground LiDAr imagery side by side with underground GPR scans. This allowed for the generation of unified 3D as built plans in a safer, cost effective and rapid manner.
Examples of Utility Depiction from ASCE 38-22 and State DOTs
ASCE 38-22 provides the general guidance for depiction of utilities on design plans, however, there are some variations within each DOT on how utilities are depicted. This section provides some of the examples of how utilities are depicted.
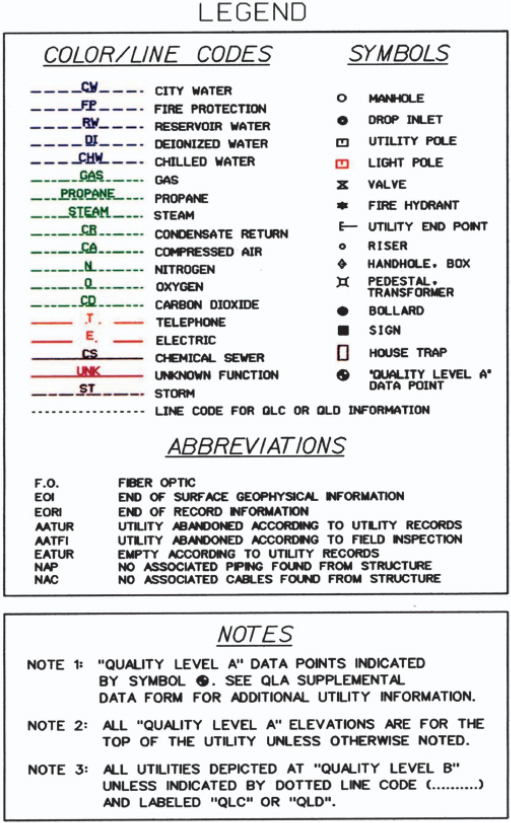
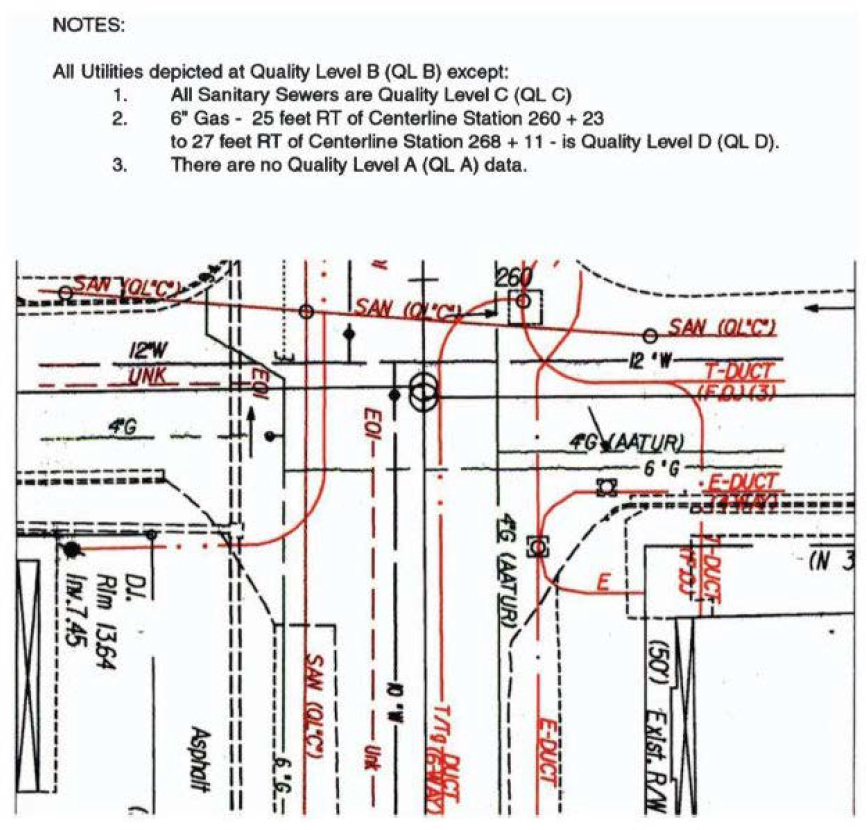
Figure 1, Figure 2 and Figure 3 are examples from the ASCE 38-22 standard showing line styles and symbology that could be used to clearly depict utilities and the associated QL of the data used to depict them. Figure 1 also illustrates how color can be used to in depicting utilities and conforms to the American Public Works Association’s standardized color coding for utility types.
![The drawing presents multiple utility alignments with labeled ducts, cables, and pipes crossing a roadway and adjacent parcels. Test holes labeled T H 21, T H 22, T H 23, T H 24, and T H 25 are along the alignments. Each test hole includes associated notes listing elevation at top and bottom, coordinates, width, and material type. The plan indicates that all utilities are depicted at Q L B [Quality Level B] unless otherwise noted. A data summary section lists detailed information for each test hole. Utility lines, such as duct, cables, gas lines, and water lines, are traced through the corridor. Coordinate references and benchmark information are on the top of the drawing.](https://www.nationalacademies.org/read/29433/assets/images/img-32-1.jpg)

The next several figures present examples as presented in specific state DOT guidance. Figure 5 is an example of depiction provided in Pennsylvania DOT (PennDOT) guidance. In following, the ASCE 38 approach, PennDOT uses QL indications within the line work to communicate the QL of the data represented by the line.
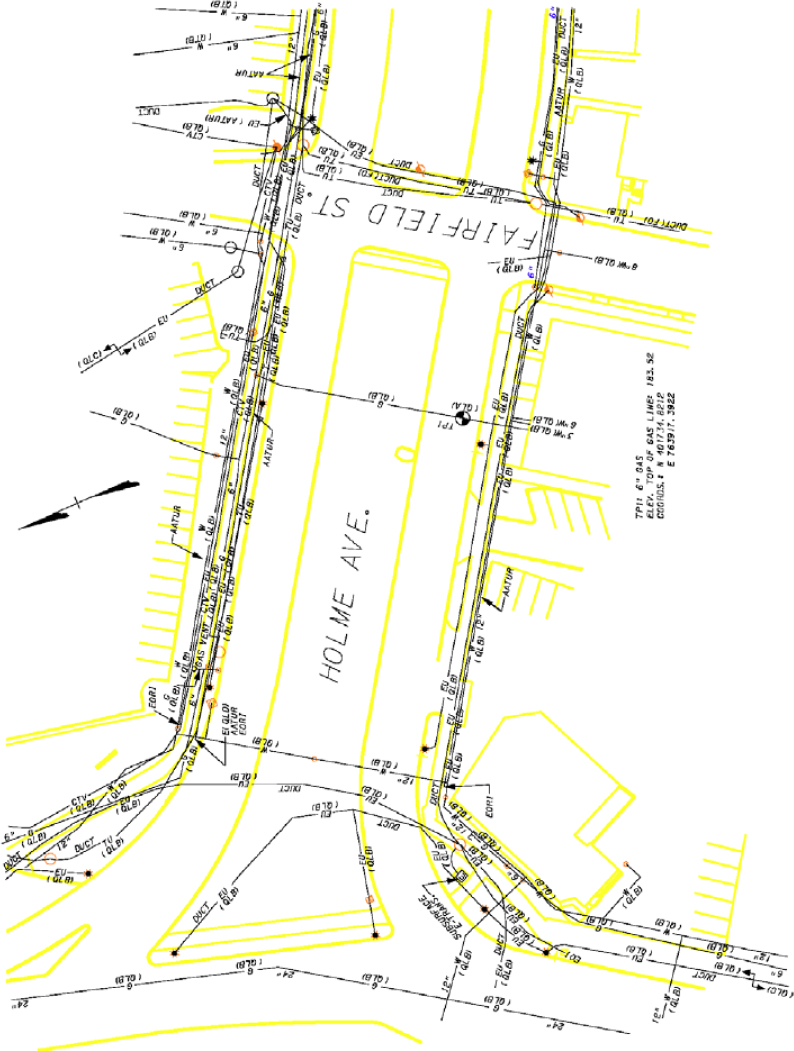
Figure 6 through Figure 14 illustrate depiction approaches used by the Texas DOT (TxDOT). Figure 6 illustrates how layout sheet can be used to indicate the areas that specific utilities are located, before getting into sheets that are more detailed. This figure also shows how line styles can be used to indicate varying QL’s of the depicted utilities.

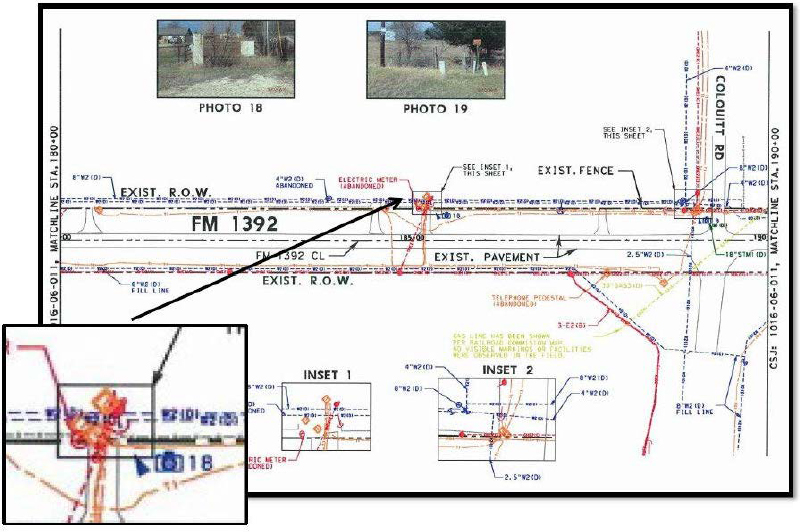
Figure 7 and Figure 8 illustrate how call-outs can be used to make clarifications or, as seen in Figure 7, how areas can be magnified to in bubbles to provide clarity to over detailed areas. The level of detail and amount of line work is a common complaint regarding the depiction of utilities on plan sets. TxDOT presents additional effective practices for overcoming these challenges. One effective practice is to use specific utility sheets and grey-out background information to make the utilities more pronounced. This approach is presented in Figure 9.


Figure 10 shows another effective TxDOT practice to clarify field conditions by not only including photos in the plan set, but illustrating where those photos were taken.
Another common challenge in depicting utilities is related to overhead or aerial utilities. It is often difficult to represent multiple lines along a shared pole pathway, details regarding such lines, and where they may terminate. Figures 11 through 13 present TxDOT practices to represent these difficult scenarios. Figure 11 illustrates the use of a table and notes to indicate the lines carried along a pole alignment.
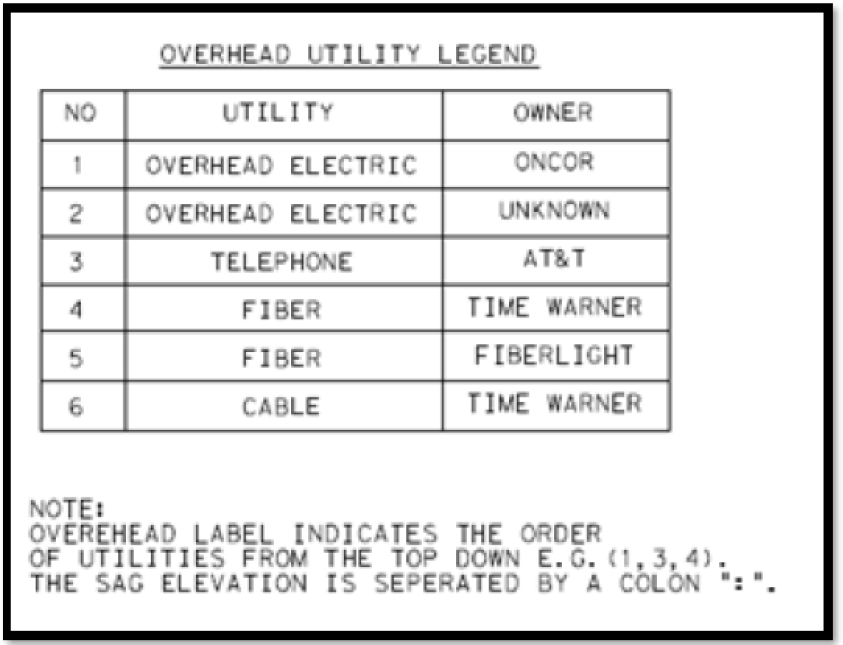
Figure 12 shows how TxDOT indicates the sag heights of lines are points of interest within the project and Figure 13 presents approaches to show the terminations of aerial lines.


Finally, Figure 14 illustrates how TxDOT depicts the locations of test holes.
These state DOT effective practices, while documented are not commonly accepted or used in a standardized manner among a majority of state DOTs. This was found and noted in recent research regarding the depiction of utility facilities in as-built documentation.
![The plan view drawing of a road and nearby areas. A box highlights test holes labeled T H 0 1, T H 0 2, and T H 2 A. Each test hole appears as a circular symbol with a leader line to the label. Utility lines run parallel to and across the road. Text along the road reads F M 720. Additional test holes labeled T H 0 3 and T H 0 4 appear on the right side. Dashed lines mark boundaries. Irregular closed shapes appear near the road and utilities. Text at the bottom reads Plan View, 1 inch equals 100 feet, and Planimetric D G N Provided by T x D O T [Texas Department of Transportation].](https://www.nationalacademies.org/read/29433/assets/images/img-42-1.jpg)
Depiction of utilities on as built drawings
As built drawings contain information that are useful for future highway design and maintenance. As built drawings usually depict changes that are being made to designs during construction. These changes were traditionally indicated via markups on design drawings. However, advanced technologies such as Lidar are now being used to depict as built drawings. As built drawings are a significant aspect of SUE as they provide the first source of information for utility coordination. The more accurate the as built plans are, the lesser the effort required to carry out the SUE process. This section presents the state of practice of as built based on past research work.
Taylor et al. (2020) conducted a literature review of state DOT manuals to extract information on as built practices for NCHRP Synthesis 548 Development and Use of As-Built Plans by State
Departments of Transportation. Through a survey and case studies, this research found that as built drawings could be developed by either in-house employees, design consultants or contractors of the DOTs. They also found that most DOTs are not using latest technologies such as Lidar for as built development. Instead, they use hand or manual techniques and sometimes electronic means for developing as built in PDF or CAD format. Additionally, the as built were stored in a variety of formats, such as microfilm, hard-copy prints, or electronically stored plans. The electronically stored plans are then integrated into electronic document management systems. Finally, DOTs generally have requirements for information to be included in as built during revision such as changes in horizontal and vertical alignment, grade revisions, correction or adjustment to stationing, etc. (Taylor et al. 2020).
Research has shown that, in addition to DOT data requirements, georeferenced data in as built plans can enhance, accuracy, coordination, and standardizations of as built records. In the NCHRP 20-07, Task 418 report An Impact and Value Analysis of Requiring Geospatial Locations for Utility Installation As-Builts (Meis et al. 2020), they found that geospatially accurate and standardized records are the most pragmatic and efficient means of enabling better coordination with transportation projects. However, the study found that most DOTs are not collecting or maintaining geospatially referenced as built data. Only two DOTs, Colorado and Montana, are identified as having pilot programs for collecting georeferenced as built data. Many DOTs, however, have identified the desire to collect such data but are facing barriers. An industry wide standard is believed to resolve many of the issues. Barriers include:
- Inadequate knowledge on how to initiate requirements
- Lack of confidence about their legal authority to require such information
- Lack of understanding on how to store and use this data.
In NCHRP 20-07, Task 418, utility companies also expressed reservations about sharing georeferenced as built data with state transportation agencies due to concerns over the protection of proprietary data and security of the utility facilities. Utility companies identified a lack of resources to collect such data. The report, nonetheless, buttressed that the future benefits of collecting georeferenced as built data significantly outweigh the initial investments needed to collect such data. The report estimated that $250 million can be saved through damage prevention and another $384 million dollars saved through reduced cost of SUE investigations as result of having geospatially referenced as built data (Meis et al. 2020).
From an as built retrieval standpoint, the SHRP 2 report R01A Technologies to Support Storage, Retrieval, and Use of 3-D Utility Location Data (Gale et al. 2015) investigated the best practices for using 3D utility location data and developed a 3D utility location data repository. This repository was then tested in a pilot implementation for a road renewal project. The study involved the development of a framework of policies, procedures and systems for using 3D utility location data. The system developed consisted of a content manager used to collect utility feature data in multiple formats, a 3D utility data storage system used to store the utility system of records for DOT and a client system consisting of various CAD and GIS editing software. Some of the features of the developed system includes:
- The ability to prevent re-inventory of utility features on new renewal project by adequately capturing changes in permits as they are being made on the infrastructure.
- An integrated system of all utilities in the right of way as well as the ability to allow for multiple groups to access the system data with a variety of tools.
- The ability to preserve 3D designs or as built of newly installed or exposed utilities that was noted as an uncommon practice.
- The ability to capture data quality levels according to ASCE 38 and identifying them with various colors and symbology.
- 3D data that was developed in such a manner that it was independent of various vendor software making it possible to be accessed by various users using multiple types of software.
- Smooth integration of the system with existing business processes of the DOTs making the adoption of the system more cost effective (Gale et al. 2015).
Complicating the as built recording process, the FHWA report Feasibility of Mapping and Marking Underground Utilities by State Transportation Departments (Quiroga et al. 2018) stated that DOTs must interact with and manage utilities which they do not own. It is, therefore, not legally or operationally possible for them to serve as a unique central repository for all information on utility facilities. While some laws require utility owners to provide information to services such as one call, there’s no legal requirement for such information to be accurate and comprehensive. This often results in state DOTs doing additional utility investigations themselves to develop quality data (Quiroga et al. 2018).
Recognizing these challenges, the report Subsurface Utility Engineering for Municipalities: Prequalification Criteria and Scope of Work Guide by Anspach and Scott (2019) gives minimum guidance for qualifying consultants that provide SUE services and develops a checklist of scoping items that affect SUE cost and schedules. At the very least,
- The SUE provider must be registered professional engineer or surveyor with demonstrated experience in utility infrastructure mapping.
- The registered engineer must have on his team a utility designator with at least 3 years’ experience and a utility locator with at least one-year experience exposing or excavating utilities.
- The engineer’s team should also consist of a survey party chief responsible for surveying and identifying visible utility features and a CAD technician with at one-year experience depicting utilities in the client’s CAD platform.
The guidance also includes minimum criteria for equipment that must be available to consultants and accuracy levels. Also, the scoping items depend on the level of detail required for the final deliverable whether 2D, 2½ D or 3D and involves answering yes or no on the level of effort required by the client.
Additionally, research by Sturgill et al. (2022) found that, as at 2004, most SUE contracts were awarded as cost plus fee (42% of all contracts) while others were awarded as unit price (32% of
all contracts), daily rate (14% of all contracts) and lump sum (12% of all contracts). The contract selections were done based of balancing advantages and tradeoffs between DOTs and consultants across the scope of the services required.
Based on the aforementioned research studies it is clear that accurate as built drawings are desirable across the highway industry. Despite the challenges of retrieving accurate as built drawings, the future advantages of having such accurate as built significantly outweigh the challenges. Geospatially accurate as built are the most desired type of as built because they make easy to locate utilities in the future when there’s new construction affecting the area depicted. Hence, state DOTs need to start making conscious efforts to retrieve geospatially accurate as built drawings during new utility installations or relocations. Also, the depiction of as built in 3D provides more accurate and reliable data than 2D. Finally, as built consultants must be carefully selected based on some the criteria mentioned to ensure the data gathered are precise and accurate.
Data Storage Mechanisms
Once subsurface utility information is collected, it must be stored. Technologies available for electronic storage, retrieval and analysis of utility data include Computer Automated Design(CAD), Geographic Information System (GIS), and Building Information Modelling (BIM) (Anspach et al. 2012). Often, older, hardcopy drawings of utilities are still relevant which are scanned and stored in PDF or TIF format. CAD is generally the most popular method of storing utility data and has additional functionalities such as layers for superimposing other information on drawings, annotations such as call-outs for additional textual details, and metadata often included in title blocks. GIS has also become popular in the last decades for depicting utility data due to its compatibility with CAD, though there is room for improvements in areas such as coordinate system transformation, uniformity in data structure and user preferences (Anspach et al. 2012). One of the key benefits of GIS is the ability to perform advanced queries and analytics based on location and other attributes or metadata. BIM is an enhancement to CAD by using 3D models for advanced design and conflict analysis. New tools are continuously being developed in BIM to support the depiction of utility data. Ultimately, these mechanisms are only beneficial if the technologies are interoperable with each other.
Resources on determining and depicting utility conflicts:
According to NCHRP synthesis 405 Utility Location and Highway Design (National Cooperative Highway Research Program et al. 2010), there are two extremes under consideration for the potential impact of utilities on highway projects. One extreme is to relocate utilities that are in conflict with highway projects and the other extreme is to design out utility conflicts on highway projects by leaving utilities in place. The space between these two extremes is where utility coordination and utility conflict management occurs.
Utility conflict management usually occurs as a sub activity of the utility coordination process. Utility coordination encompasses all other activities including the utility conflict management that
are needed to resolve and manage potential utility impacts throughout the lifecycle of a highway project. Utility coordination is defined as “the active effort to communicate, share information, and interact productively with all applicable stakeholders about utility involvement, adjustment, and relocation during all phases of the delivery of a transportation project” (Sturgill et al. 2017). Historically, utilities are relocated when they are impacted during construction, but this practice has been found to cause unnecessary cost overruns and schedule impacts on highway projects (National Cooperative Highway Research Program et al. 2010). Recognizing this, the recommendation is to practice utility coordination very early in the design stage in other to be able to consider various alternatives to resolving utility conflicts.
This need to identify potential utility conflicts early in the design stage led to the development of the SHRP2 report on the Identification of Utility Conflicts and Solutions (Quiroga et al. 2014). This research resulted in the production of optimized tools for utility conflict management. Prior to the report, there were disparate implementations of utility conflict management across DOTs and other agencies. The optimized tools were developed as a result of the review of these disparate practices across DOTs. The output of the report included:
- A stand-alone utility conflict matrix in excel containing a utility conflict table
- A supporting spreadsheet for utility conflict resolution
- Utility conflict data model that can be used to manage utility conflict in a database environment and a 1-day UCM training course.
An example UCM and conflict depiction is seen below:


These tools were then piloted through an implementation program by Kraus et al. (2015) in the project SHRP2 R15C. The pilot implementation took place at Maryland State Highway Administration (MDSHA). Other piloted occurred at Michigan DOT and Kentucky DOT. Michigan DOT enhanced their Utility Relocation Tracking System (URTS) with an additional module containing the UCM while Kentucky Utilities and Rail Tracking System (KURTS) was also enhanced using the UCM. Some of the benefits identified during the pilot implementations included:
- Savings in money and time (one of the projects saved $500,000 and avoided 4-6 months delay) (Kraus et al. 2015)
- Increased awareness of utility conflicts among the project team (Kraus et al. 2015),
- Better coordination with utility owners,
- Better early documentation of conflicts,
- Better internal communication within agencies,
- Better discussion and resolution of utility conflicts,
- Better resolution strategy assessment, and
- Increased teamwork
- Proactive identification of utility conflicts and alternative design solutions thereby minimizing costs
- Promotes better communications among relevant agencies and utility companies
- Enhanced personnel’s overall utility coordination process and cultivated increased transparency/collaboration between stakeholders
- Cost comparison and schedule impacts of various alternative solutions thereby providing a more holistic perspective to decision makers on the potential impact to the road projects, and
- Provides opportunity to avoid or minimize impacts and not just recommending relocations.
The implementation challenges included:
- Effort required to populate the UCM,
- Absence of quality level data in design plans,
- Improvements in UCM structure such as hyperlink to drawings, and
- Absence of utility relocation schedule.
The report NCHRP Synthesis 506 Effective Utility Coordination: Application of Research and Current Practices (Sturgill et al. 2017) conducted surveys to tease out successful practices about utility coordination in state DOTs. The successful practices identified include:
- Early utility involvement in design (30% or earlier),
- Utility preconstruction meetings,
- Defined procedures,
- Consideration of utilities relocation schedules in relation to project schedules,
- Use of SUE,
- Regularly scheduled meetings with utility owners,
- Communication of short-range transportation plan,
- Use of utility corridors,
- Use of standardized utility agreements,
- Identification and planning for long-lead items,
- Utility mapping system, and
- Communication of long-range transportation plan.
The FHWA report National Utility Review: Utility Coordination Process (FHWA 2018) found that not all states abide by the federal regulation under section 635.309 of Title 23 of the Code of Federal Regulations (CFR), which requires that all federal aid projects complete utility certification to confirm that utility coordination occurred before highway project construction. The failure to comply with this directive has been found to be a major cause for project delays and cost overruns in highway projects. Also 23 CFR 645.113 requires proper documentation of utility relocation plans, estimates and relocation schedules in the utility agreements. The poor utility coordination process often originates from inadequate utility investigations which undermines the value of the coordination process. Accurately locating and depicting utility locations remains the bedrock of a successful utility coordination process. It was found that many of the requirements of CFR 645.113 were not present in the required detail in most of the utility agreements of the surveyed DOTs. However, some successful practices were also identified. For instance, Florida DOT implements the use of test holes to confirm the location of utilities which helps improve the reliability of relocation plans; Massachusetts DOT developed a relocation scheduling process
known as project utility coordination form which helps integrate utility relocation work of various owners and develops a sequential list of the related activities to execute the relocation and some DOTs included utility relocation work in highway contracts. It was recommended that some of these successful practices be adopted by other DOTs.
Utility Coordination pursued alternative contracting methods
Resources also exist for those wishing to purpose alternative contracting methods (ACMs). In the NCHRP 20-07, Task 373 Utility Coordination Using Alternative Contracting Methods (Gransberg et al. 2017) provides guidelines for state transportation agencies for carrying out utility coordination on projects that use ACMs. The justification for using ACMs is that they allow for early contractor design involvement and help resolve inefficiencies induced in the delivery process due to utility coordination. ACMs allow contractors to personally get involved in the utility coordination process early in the design stage. The type of ACM used, however, determines where in the project lifecycle that specific utility coordination activity falls. The report used guidelines developed by Indiana DOT to summarize utility coordination activities into eight phases including utility coordination initiation phase, utility research phase, utility initial notice phase, utility verification phase, utility conflict analysis phase, utility work plans phase, utility agreement phase and utility construction phase. These utility coordination phases were then overlaid with the typical project development stages of each ACM. Typically, utility issues come up when performing risk assessment of the ACM to be selected. Some of the utility issues that must be considered when selecting ACMs were discussed in the report. The report also contains flowcharts for developing utility coordination within various ACMs including construction manager/general contractor (CMGC), design-build (DB) and public private partnership projects (P3) (Gransberg et al. 2017).
In similar research, NCHRP 20-07, Task 407 Utility Coordination Efficiency, Safety, Cost, and Schedule Impacts using various Contracting Methods (Taylor et al. 2021) evaluated the impact on utility coordination of using various ACMs with respect to the efficiency, safety, cost and schedule. Generally, the ACMs such as CMGC, DB and P3 have impact on utility coordination by shrinking the available time for conducting the coordination compared to traditional methods such as design bid build (DBB). The research found that for DB and P3 projects, the contractor often absorbs unnecessary risk in their contracts which often leads to the inflation of costs. One way to reduce this risk transfer is by STAs starting the utility coordination process before any contractual arrangements. All information gathered during the STA early utility coordination process must be made available to the contractor during the contracting process which leads to reduced risk markup. The STA must also continue oversight of the utility coordination process after contract award to ensure the contractors follow required policies and regulations. CMGC also encourages early utility coordination by bringing contractor consultant on board early in the design phase to provide their perspectives on the design impacts. The early contractor involvement also facilitates early discussions with utility companies and coordinators regarding schedule, cost, risk allocation and management (Taylor et al. 2021).
State DOT commissioned research, policy and procedure manuals
A number of states have policies and manuals for the depiction of utility data. Pennsylvania DOT commissioned Pennsylvania State University’s Institute of Transportation to carry out a study on the effective use of SUE at the DOT and also evaluate the benefit cost analysis of their SUE programs. This study was geared towards the development of a SUE manual for the state. The study involved four tasks including:
- Quantifying the benefits of SUE,
- Define factors that affect the accuracy of SUE,
- Develop a decision matrix tool to determine utility complexity level and which projects should use what level of SUE, and
- SUE manual which summarizes the output of the previous tasks.
According to the manual, some of the factors affecting the accuracy of SUE are:
- Type of utility,
- Material of utility,
- Depth of utility,
- Type of soil,
- Ground surface condition,
- Access point of utility,
- Internal condition of utility,
- Density of utility,
- Special materials for detecting non-metallic utility, and
- Qualified SUE provider.
The manual also contains utility impact rating designed to recommend appropriate SUE level based on utility impact score. The impact rating is calculated in three steps using preliminary QLC and QLD data to answer questions posed and using the impact score table to determine what quality level is required for each project location. The impact score was further used to develop the decision matrix which helps engineers weigh their decision on the SUE quality level selected against the amount project risk they are willing to accept. If an engineer chose a quality level lower than what is recommended in the decision matrix, they will compensate for that decision by accepting more project risk such as paying for change orders. Case studies were also demonstrated for using the stepwise impact rating technique. The manual also contained a detailed list of benefit factors of SUE and cost factors of SUE. Benefit-cost analysis was also carried out on ten SUE projects executed by the DOT and they found that SUE accounted for a savings of $22.21 for every $1 spent on SUE (Sinha et al. 2007).
Another DOT led project by Michigan DOT was entitled Geospatial Utility Infrastructure Data Exchange (GUIDE). GUIDE was an initiative by the Michigan Utility Coordination Committee (MUCC) to collect and store 3D geospatial location data of utilities at the time of installation. MUCC and utility companies (Consumer Energy, DTE Energy and AT&T) piloted the initiative
on seven projects identified by each utility company. At the end of the pilot initiative, several findings and recommendations were proposed. Several revisions were proposed to the GUIDE requirements document including:
- Expansion on the requirements for changes in geometry
- Revised data format requirement
- Expansion of data attribution and development of submittal, QA/QC review, data acceptance and final upload process.
The study findings include:
- There will be significant impact on transportation agency in terms of data management and IT resource allocation
- Need for more personnel and resource commitment to long term maintenance of data.
- For wider adoption of GUIDE, there will be need industry wide training of contractors, roadway agencies, utility companies and consultants.
- Survey staff need to be close to the site to reduce data acquisition cost.
- It was challenging to coordinate survey staff for the acquisition of the geospatial data.
It was recommended that utility companies include GUIDE coordination as a pay item in contracts to serve as incentive to contractors to adequately coordinate efforts for the data acquisition. Finally, in order to calculate the return on investment of GUIDE programs it was important to have reliable data on the cost of utility conflicts which is currently unavailable. The main benefits of the GUIDE program include
- Early identification of utility conflicts
- Reduction in future utility conflicts during construction,
- Better design coordination
- Reduction in public impact
- Improved public safety
- Reduced owner risk (Barden 2015).
Summary of Literature Review
A number of studies, standards and guidance documents provide utility depiction approaches at varying levels of details. The ASCE 38 standard provides a standardized approach that can be used when that standard is implemented but there are additional approaches that may be used for utility investigations. Additionally, there additional details could be developed to further support the standard. The literature supports this need and the results of this research will aid in filling this void.


