Previous Chapter: 2 Research Approach
Suggested Citation: "3 Findings and Applications." National Academies of Sciences, Engineering, and Medicine. 2026. Developing a Guide to Depicting Utility Facilities in Design Plans. Washington, DC: The National Academies Press. doi: 10.17226/29433.

Chapter 3 – Findings and Applications

The findings from the research are summarized in the following chapter, with the most implementable elements of the research being the associated guide, provided in a separate document. The following summarizes the research-related findings of the literature reviews, practitioner surveys, and exchanges. The report appendices provide the expanded findings as applicable.

Findings and Knowledge Gaps of the Literature Review

The literature reviewed provided that while some effective practices and resources are documented for achieving the research objectives of this project, there was evidence of a gap regarding centralized guidance for collecting, managing, and depicting utility information on highway plans. The utility data depiction appeared to be the most limited of the topics discussed. A number of studies, standards, and guidance documents provide utility depiction approaches at varying levels of detail. The ASCE 38 standard provides a standardized approach that can be used when that standard is implemented for a standardized subsurface utility engineering (SUE) investigation, but there are additional approaches that may be used for utility investigations. Additionally, there are additional details that could be developed to further support the standard. The literature reviewed supports this need, and the results of this research aid in filling this void. The need to understand state DOT approaches in greater depth pointed to the necessity to survey practitioners for collecting effective practices.

The literature review highlighted a need for standardization and guidance for utility data collection management and depiction. The ASCE 38 and 75 standards provide general guidelines and serve a role in supporting the objectives of this research, but there are notable details lacking that will be addressed through collecting effective practices during this research effort. The surveys conducted in this research assisted in collecting additional information necessary to develop the guidance.

Findings and Knowledge Gaps from the Practitioner Survey Feedback

The feedback from the practitioner surveys was focused on the responses provided by the state DOTs and consultants. While the complete survey responses and questions are provided in the appendices, the following summarizes the findings. The surveys to understand how state DOTs depict utilities in highway plans. As mentioned, the ASCE 38 and 75 standards provide general guidelines regarding depiction with some need for additional details. It was believed this was a point where state DOTs could provide further information and detail. However, stemming from the survey feedback, it seems several state guidelines also have limitations in this area, or there is at least significant variation across states. A few state DOTs noted more advanced practices, such as noting shape details, using APWA color coding, labeling utilities according to SUE quality levels, and additional best practices, though there was significant variation. An example of this variation is seen in Figure 4, noting the varying ways in which state DOT present utilities.

Suggested Citation: "3 Findings and Applications." National Academies of Sciences, Engineering, and Medicine. 2026. Developing a Guide to Depicting Utility Facilities in Design Plans. Washington, DC: The National Academies Press. doi: 10.17226/29433.
The data from the pie chart are as follows: Plan, Profile, Cross-section: 42 percent; Plan: 31 percent; Plan, Profile: 15 percent; Plan, Cross-section: 8 percent; We do not present utility data in 2 D, Plan, Profile, Isometric: 4 percent.
Figure 4. Utility Presentation Approaches of DOTs Surveyed

As summarized from the survey results, it was found that there are deficiencies in depicting utility sizes, shapes, and appurtenances, deficiencies in depicting utilities in 3D, and unstandardized notation of the quality levels or source of data regarding utility locations. It was also found that there are deficiencies in depicting the depth or elevation of a utility. These findings further indicate a need for guidance provided by this research to build consistency. The findings also highlighted states where practices can be collected to assist in the development of the guidelines. The state DOTs that provided notable feedback of importance to the guidelines include Arizona, California, Colorado, Delaware, Georgia, Massachusetts, New Jersey, and Texas.

Findings and Knowledge Gaps from the Exchanges with Practitioners

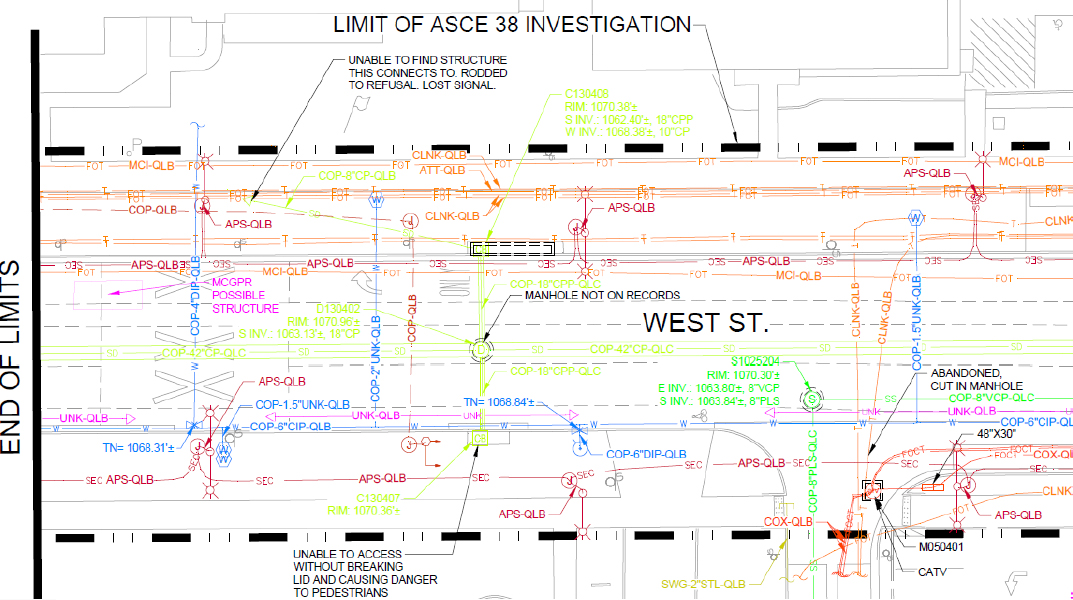
The research team also conducted large and small exchanges with practitioners that included state DOT design and utility consultant personnel, utility coordination consultants, design consultants, SUE providers, highway construction contractors, and consultants of utility companies. This effort was coordinated with the panel to identify appropriate practitioners to participate in these events. Beyond the highlights mentioned below, the outline of the guidelines was discussed and modified in these exchanges. Examples of symbols, line styles, and depiction were also shared as seen in Figure 5 and 6.

Suggested Citation: "3 Findings and Applications." National Academies of Sciences, Engineering, and Medicine. 2026. Developing a Guide to Depicting Utility Facilities in Design Plans. Washington, DC: The National Academies Press. doi: 10.17226/29433.
The utility symbols are as follows: The symbols in red are as follows. A circle labeled T R: Traffic control manhole. A circle labeled J: Traffic signal junction box. A small circle above a short vertical line: Traffic signal. A horizontal line with two vertical arms with circular ends and radiating lines around one circular end: Traffic signal light pole. A horizontal line with two vertical arms with one circular end: Traffic signal pole. Two filled circles connected by lines: Crosswalk signal. A circle labeled J: Street light junction box. A labeled, rounded vertical rectangle pointing downward: U G traffic vault. A square labeled C A B: Electric cabinet. A circle labeled J: Electric junction box. A circle labeled E: Electric manhole. A circle labeled M: Electric meter. Two parallel vertical lines connected by curves at the top and bottom labeled E: U G electric vault. A square with a short diagonal: Electric riser slash outlet. A square labeled T: Electric transformer. An arrow pointing right connected to an arrowhead pointing left: Light, arm. A small mark with short radiating lines: Light, ground. A small circle with short radiating lines: Light dash round. A circle labeled C T V: C A T V manhole. Two short vertical bars: C A T V riser. A short horizontal bar with a small vertical stem: C A T V warning sign. A rounded rectangle pointing upward labeled U G: U G C A T V vault. The symbols in orange are as follows. A circle labeled T: Telephone manhole. A square with an X: Telephone riser. A small rectangle attached to a short horizontal bar: Telephone warning sign. A rounded rectangle labeled T: U G telephone vault. A rectangle attached to a short horizontal bar: Fiber optic warning sign. A square with a triangle and thicker upper and right sides: Fiber optic riser. A rounded rectangle labeled F pointing upward: U G fiber optic vault. The symbols in orange are as follows. A circle with the letters F M inside: Freeway management system manhole. A labeled rounded rectangle: U G freeway management system vault. The symbols in light green are as follows. A small vertical marker with a pointed base: Gas fink. A circle with the letter G inside: Gas manhole. A hexagon with the letter G inside: Gas meter. A partially shaded rectangle: Gas riser. Two opposing triangular shapes forming a bow tie: Gas valve. A rectangle attached to a short horizontal bar: Gas warning sign. A rounded rectangle with the letter G inside: U G gas vault. The symbols in black are as follows. A left brace attached to a horizontal line: Guy anchor. A crosshair style marker with four points: Testhole marker. A filled triangle: Control point. The symbols in light green are as follows. A square with letters C B inside and a circle with letters C B inside: Catch basin. The symbols in green are as follows. Letters S S C followed by a diamond: Sanitary sewer cleanout. A circle with the letter S inside: Sanitary sewer manhole. The symbols in light green are as follows. S D C: Storm drain cleanout. A circle with the letter D inside: Storm drain manhole. A small V shaped mark: Stand pipe. A small crown shaped mark: Storm roof drain. A square with two vertical bars inside: Curb inlet. A solid rectangle: Ditch inlet. A circle with internal markings D W: Dry well. The symbols in blue are as follows. A bow-tie shaped form with a short extension: Air release valve. An angled line with a short perpendicular segment: Backflow preventer. A plus-shaped form: Fire department connection. A circle with a dot inside and two radiating lines at the top: Fire hydrant. A partially filled circle labeled M W: Monitoring well. A circle labeled P I V: Post indicator valve. A rounded rectangle labeled U G: U G water vault. A circle labeled W: Water manhole. A hexagon labeled W: Water meter. Short connected vertical lines, with a thicker left line: Water valve. A square labeled W: Water handhole. A small circular dot with short extensions: Water spigot. Stacked circles: Water well. The symbols in purple are as follows. A rectangle, with its right half shaded: Irrigation control. A partially shaded circular form with short extensions: Irrigation gate valve. A square with an internal grid: Irrigation flood valve. A circle labeled I R: Irrigation manhole. A hexagon labeled I: Irrigation meter. The symbols in pink are as follows. A circle labeled J: Unknown junction box. A circle labeled U: Unknown manhole. A hollow square: Unknown riser. A rectangle labeled U, with a curved section on the right edge: Unknown cabinet. A rounded rectangle labeled U: U G unknown vault. A vertical line with a small circle and short horizontal arms: Utility pole. The symbol in teal is as follows. A hollow square: Edge of concrete. The symbols in black are as follows. A hollow circle with a short horizontal line on each side: Pole. A filled circle: Bollard. A square outline with corner brackets: Underground vault or catch basin structure. The symbol in gray is as follows. A circular outline with dashed rings: Underground manhole barrel structure. An orange rectangular outline with a cut in each edge: Underground telephone or cable T V vault structure, see plans for sizes. A red double rectangular outline: Cable T V, double pull box, see plans for sizes. An orange double rectangular outline: Telephone or fiber optic double pull box, see plans for sizes. A red single rectangular outline: Cable T V, single pull box, see plans for sizes. An orange single rectangular outline: Telephone or fiber optic single pull box, see plans for sizes. A small red square with internal grid: Cable T V, hand hole, see plans for sizes. An orange small square with internal grid: Telephone slash or optic hand hole, see plans for sizes. The utility line types are as follows. An orange line labeled T S: Traffic signal line, quality level is as noted. A dashed orange line: Traffic signal line, quality level is as noted. A red line labeled S L: Street light line, quality level is as noted. A red line labeled C H S L: Overhead street light line, owner as noted. A red line labeled E: Electric line, owner as noted, quality level is as noted. A red line labeled C H E: Overhead electric line, owner as noted. A red line labeled C T V: Cable T V line, owner as noted, quality level is as noted. A red line labeled C H C T V: Overhead cable T V line, owner as noted. A red line labeled F O C T: Fiber optic cable T V line, owner as noted, quality level is as noted. An orange line labeled T: Telephone line, owner as noted, quality level is as noted. An orange line labeled C H T: Overhead telephone line, owner as noted. An orange line labeled F O T: Fiber optic telephone line, owner as noted, quality level is as noted. A light orange line labeled F O C: Fiber optic communication line, owner as noted, quality level is as noted. A yellow line labeled G: Gas line, quality level is as noted. A light green line labeled S D: Storm drainage line, owner as noted, quality level is as noted. A light green line labeled S D L: Storm drainage lateral line, owner as noted, quality level is as noted. A green line labeled S S: Sanitary sewer line, owner as noted, quality level is as noted. A green line labeled S S L: Sanitary sewer lateral line, owner as noted, quality level is as noted. A blue line labeled W: Water line, owner as noted, quality level is as noted. A blue line labeled W L: Water lateral line, owner as noted, quality level is as noted. A pink line labeled U N K: Unknown utility line, quality level is as noted. The symbols in black are as follows. A line labeled A B A N: Abandoned utility line, quality level is as noted. A dashed line with thin vertical segments in between long horizontal segments: A S C E 38 investigation boundary line. A dashed line with thick, short segments: Construction boundary line. A hollow triangle pointing upward: End or loss of signal. A curved S shaped mark: Limits of A S C E 38 investigation. An X mark: Change of A S C E 38 quality level. A short horizontal line connected to small, vertical lines at each end: End of utility line. A closed semicircle with a thick border at the bottom: Line leads toward building. An angled line pointing left: Utility pipe size reduction. C O P-36 inches V C P-Q L D: Utility owner-size and or type-A S C E quality level.
Figure 5. Example Utility Symbols and Line Styles (Source: Anspach)
Suggested Citation: "3 Findings and Applications." National Academies of Sciences, Engineering, and Medicine. 2026. Developing a Guide to Depicting Utility Facilities in Design Plans. Washington, DC: The National Academies Press. doi: 10.17226/29433.
The plan presents a roadway section labeled West Street with multiple horizontal and vertical alignments and utility lines crossing the corridor. The limits of A S C E 38 investigation are marked along the upper portion of the drawing. Various utilities are identified and marked. Manholes and connection points are along the corridor. Notes indicate areas where structures cannot be found or accessed. Abandoned utilities and city manholes are labeled near the right side. Elevation values, rim data, and invert measurements are distributed across the plan. The layout integrates survey information, utility types, and quality indicators within the roadway limits.
Figure 6. Example of SUE-based Depiction (Source: Anspach)

Our research team conducted multiple virtual peer exchanges to collect feedback from a broad number of participants. We also arranged a smaller event, including a cross-section of previous participants of the peer-exchange groups, to allow coordinating feedback from across the groups of the previous sessions. This feedback is woven into the guidelines with the main points summarized in the following.

The objective of the discussions at these exchanges was to gain insight from the various user groups and stakeholders who gather, reference, and/or work with utility information on design plans. Through the interviewing and questioning in the focus groups, the following feedback was obtained relative to the current state of practice for depicting existing utilities on project basemaps, completeness, and accuracy of the data collected. The focus group experience and challenges in utility data and depiction were discussed. In addition, feedback pertaining to new ideas and opportunities for addressing utility depiction challenges was covered. The following summarizes highlights of those discussions.

  • Depiction of Elements & Appurtenances

Depicting utility elements on highway plans presents multiple challenges. For presenting the linear elements of conduits and pipes, it is often appropriate to depict them with a representative size, i.e., a 24-inch pipe should not be depicted as a single line without scale. Elements such as vaults or other underground structures of notable size should also be depicted according to proper scale. Utility appurtenances, such as thrust blocks, guy wires, etc., should be depicted or noted according.

  • Explanation of Utility Data and Data Integrity

To the extent possible, the utility data used to depict utilities should be properly detailed and explained. Designers and contractors should be able to discern the sources of utility data used,

Suggested Citation: "3 Findings and Applications." National Academies of Sciences, Engineering, and Medicine. 2026. Developing a Guide to Depicting Utility Facilities in Design Plans. Washington, DC: The National Academies Press. doi: 10.17226/29433.

e.g., One Call markings versus surveyed visible features. There can be notable differences in data reliability and the users of that data must be able to manage the risks inherent in the data. SUE providers also noted that utility data provided by their investigations and professionally stamped should not be modified or mixed with other utility sources of data.

  • Coordination of Data Sources

Utility data used in highway projects will come from various sources at varying points along the highway project timeline. These sources may also include existing, relocated, or planned to be relocated utilities. Again, the status of the data must be clearly discernable. Utility companies noted that this can become a challenge for them when attempting to plan relocations using older data, only to find the space they planned to relocate is now occupied, potentially by another utility.

  • Clarity of Depiction

Depicting utilities in highway plan sets with a notable level of detail can create issues of clarity in the plan and profile sheets. An effective practice noted is to have a unique set of detail utility plan sheets. These sheets can also evolve with the highway project as the data will have varying uses, e.g., avoidance, relocation, phase planning, etc. The utility depictions for use during the design process should be in accessible layers that can be toggled on and off at the designer’s discretion, but guidance should encourage the use of those layers for decision-making.

  • Legends, Line Styles, and Colors

Clarity and completeness of utility depictions can be improved with properly detailed utility legends, line styles, and colors. In further discussions with SUE providers and with DOT feedback, the following are examples determined to provide effective details of a SUE investigation.

These findings aided in the development of the guide, which was next validated through a final exchange via a workshop approach.

Suggested Citation: "3 Findings and Applications." National Academies of Sciences, Engineering, and Medicine. 2026. Developing a Guide to Depicting Utility Facilities in Design Plans. Washington, DC: The National Academies Press. doi: 10.17226/29433.
Page 11
Suggested Citation: "3 Findings and Applications." National Academies of Sciences, Engineering, and Medicine. 2026. Developing a Guide to Depicting Utility Facilities in Design Plans. Washington, DC: The National Academies Press. doi: 10.17226/29433.
Page 12
Suggested Citation: "3 Findings and Applications." National Academies of Sciences, Engineering, and Medicine. 2026. Developing a Guide to Depicting Utility Facilities in Design Plans. Washington, DC: The National Academies Press. doi: 10.17226/29433.
Page 13
Suggested Citation: "3 Findings and Applications." National Academies of Sciences, Engineering, and Medicine. 2026. Developing a Guide to Depicting Utility Facilities in Design Plans. Washington, DC: The National Academies Press. doi: 10.17226/29433.
Page 14
Suggested Citation: "3 Findings and Applications." National Academies of Sciences, Engineering, and Medicine. 2026. Developing a Guide to Depicting Utility Facilities in Design Plans. Washington, DC: The National Academies Press. doi: 10.17226/29433.
Page 15
Next Chapter: 4 Conclusions and Suggested Research
Subscribe to Emails from the National Academies
Stay up to date on activities, publications, and events by subscribing to email updates.