Red-Tinted Bus Lane Experience (2026)
Chapter: 3 Transportation Agency Survey

CHAPTER 3
Transportation Agency Survey
This chapter describes the purpose, methodology, and results of the survey of U.S. and Canadian transportation agencies and jurisdictions that have experience planning, implementing, operating, enforcing, and maintaining red-tinted bus lanes.
Purpose
The purposes of the survey were to:
- Obtain relevant information about red-tinted bus lanes that have been implemented in the United States and Canada;
- Identify lessons learned by transportation agencies that have implemented or operate, enforce, and maintain red-tinted bus lanes; and
- Identify transportation agencies for more detailed discussions in the form of case examples.
The remainder of this chapter reports survey results pertinent to the first two goals. With respect to the third goal, the process for identifying case examples is described in Chapter 4.
Methodology
The project team developed a set of survey questions intended to obtain the aforementioned survey outcomes. This questionnaire was reviewed by the synthesis panel and is provided in Appendix A.
The project team then generated a list of 35 metro areas where red-tinted bus lanes were in use at the time and sent survey invitations to key agencies in those metro areas. The invitees included transit agencies and local government transportation departments.
The project team created an online survey from the questionnaire. The online survey was developed in Qualtrics, an online survey tool, and pilot-tested by the panel. The revised survey was launched on March 15, 2024, and remained live until April 3, 2024. While the online survey was live, the project team sent follow-up e-mails and made follow-up calls as needed to encourage agencies to participate in the survey.
Results
The project team contacted agencies and jurisdictions in 35 metro areas and received 28 responses covering 25 metro areas; the team achieved a 71% response rate with respect to the metro areas. Of the 28 responses, one agency declined to participate because its red-tinted
bus lanes were still in the pilot phase and it did not believe it could provide adequate information for the survey. Of the 27 remaining responses, 21 (covering 19 metro areas) were deemed to be complete or containing enough data to meaningfully inform the study. The information provided in the remainder of this chapter reflects the 21 complete responses and 19 metro areas. The 27 agencies/cities from which complete responses were received are listed in Appendix B.
Characteristics of Responding Metro Areas
The 19 metro areas represented by the complete surveys are distributed across the United States and in multiple FTA regions, as shown in Figure 13. No metro areas in Canada submitted complete surveys.
Figure 14 shows that 90% (19 of 21) of the survey respondents are local government departments of transportation (DOTs), independent transit agencies, or transit agencies that are also city departments. Both city DOTs and independent transit agencies responded for Denver and Los Angeles.
Characteristics of Metro Areasʼ Red-Tinted Bus Lanes
Seventy-four percent (14 of 19) of the metro areas represented in the survey created at least one of their red-tinted bus lanes by applying red tinting to an existing bus lane. Seventy-four percent (14 of 19) created at least one of their red-tinted bus lanes as new bus lanes (e.g., as newly constructed bus lanes or by repurposing existing general traffic lanes into red-tinted bus lanes).
Figure 15 shows the types of red-tinting treatments used by the respondents at the time of the survey. Forty-seven percent (9 of 19) of the metro areas use red MMA, and 37% (7 of 19) use red thermoplastic. Twenty-one percent (4 of 19) of the metro areas represented in the “other”
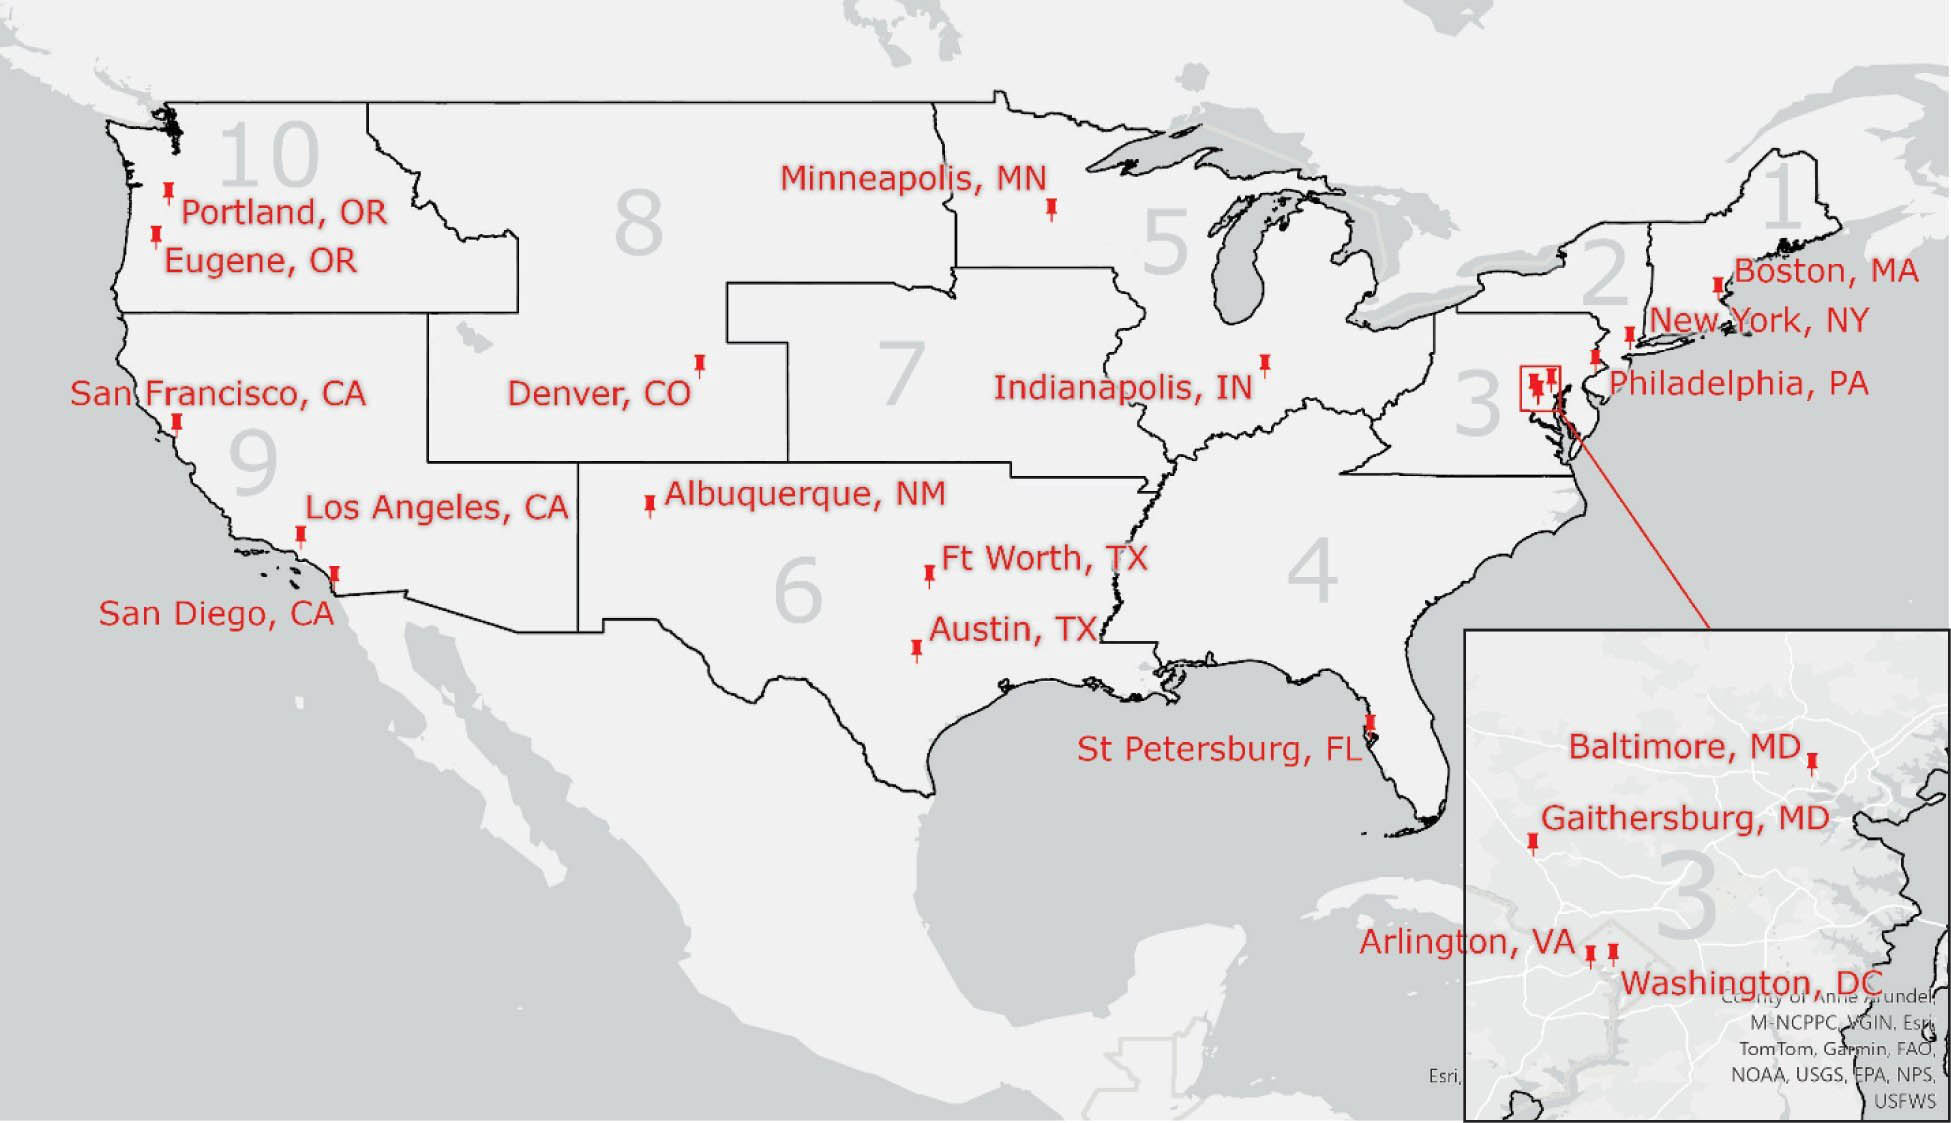
Long Description.
The map of the United States shows multiple city locations marked across regions, including Portland, Oregon; Eugene, Oregon; San Francisco, California; Los Angeles, California; San Diego, California; Denver, Colorado; Albuquerque, New Mexico; Minneapolis, Minnesota; Indianapolis, Indiana; Fort Worth, Texas; Austin, Texas; Saint Petersburg, Florida; Boston, Massachusetts; New York, New York; Philadelphia, Pennsylvania. The inset area includes Baltimore, Maryland; Gaithersburg, Maryland; Arlington, Virginia; and Washington, DC.
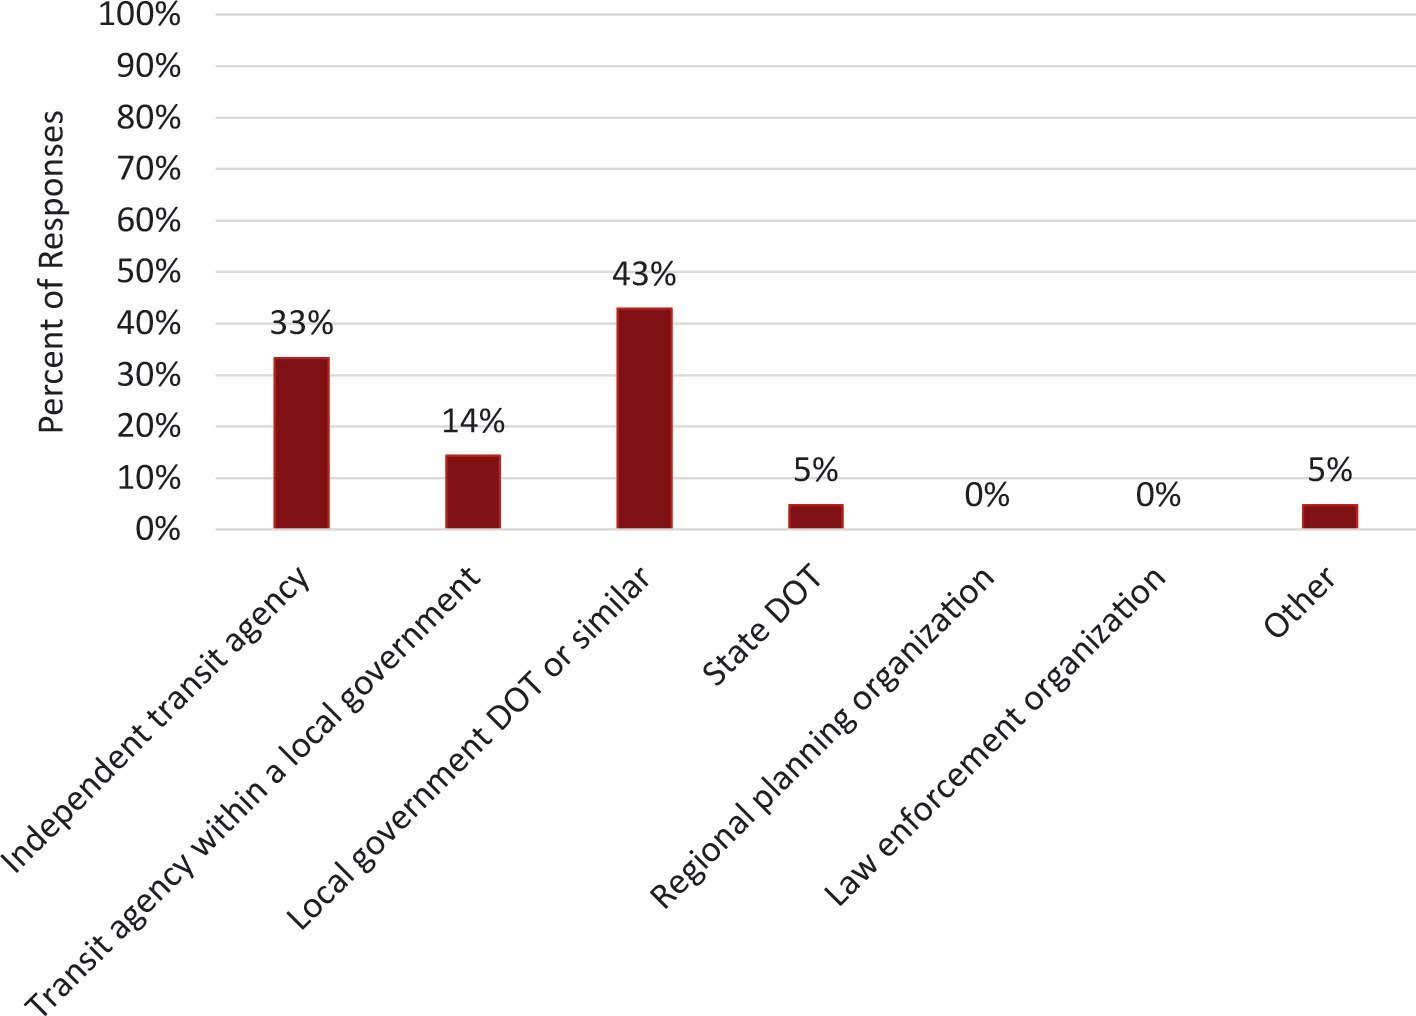
Long Description.
The x-axis represents organization types, including independent transit agency, transit agency within a local government, local government DOT or similar, state DOT, regional planning organization, law enforcement organization, and other. The y-axis represents the percentage of responses ranging from 0 percent to 100 percent in increments of 10. The data given in the bar graph are as follows: Independent transit agency: 33 percent. Transit agency within a local government: 14 percent. Local government DOT or similar: 43 percent. State DOT: 5 percent. Regional planning organization: 0 percent. Law enforcement organization: 0 percent. Other: 5 percent. The values are accurate.
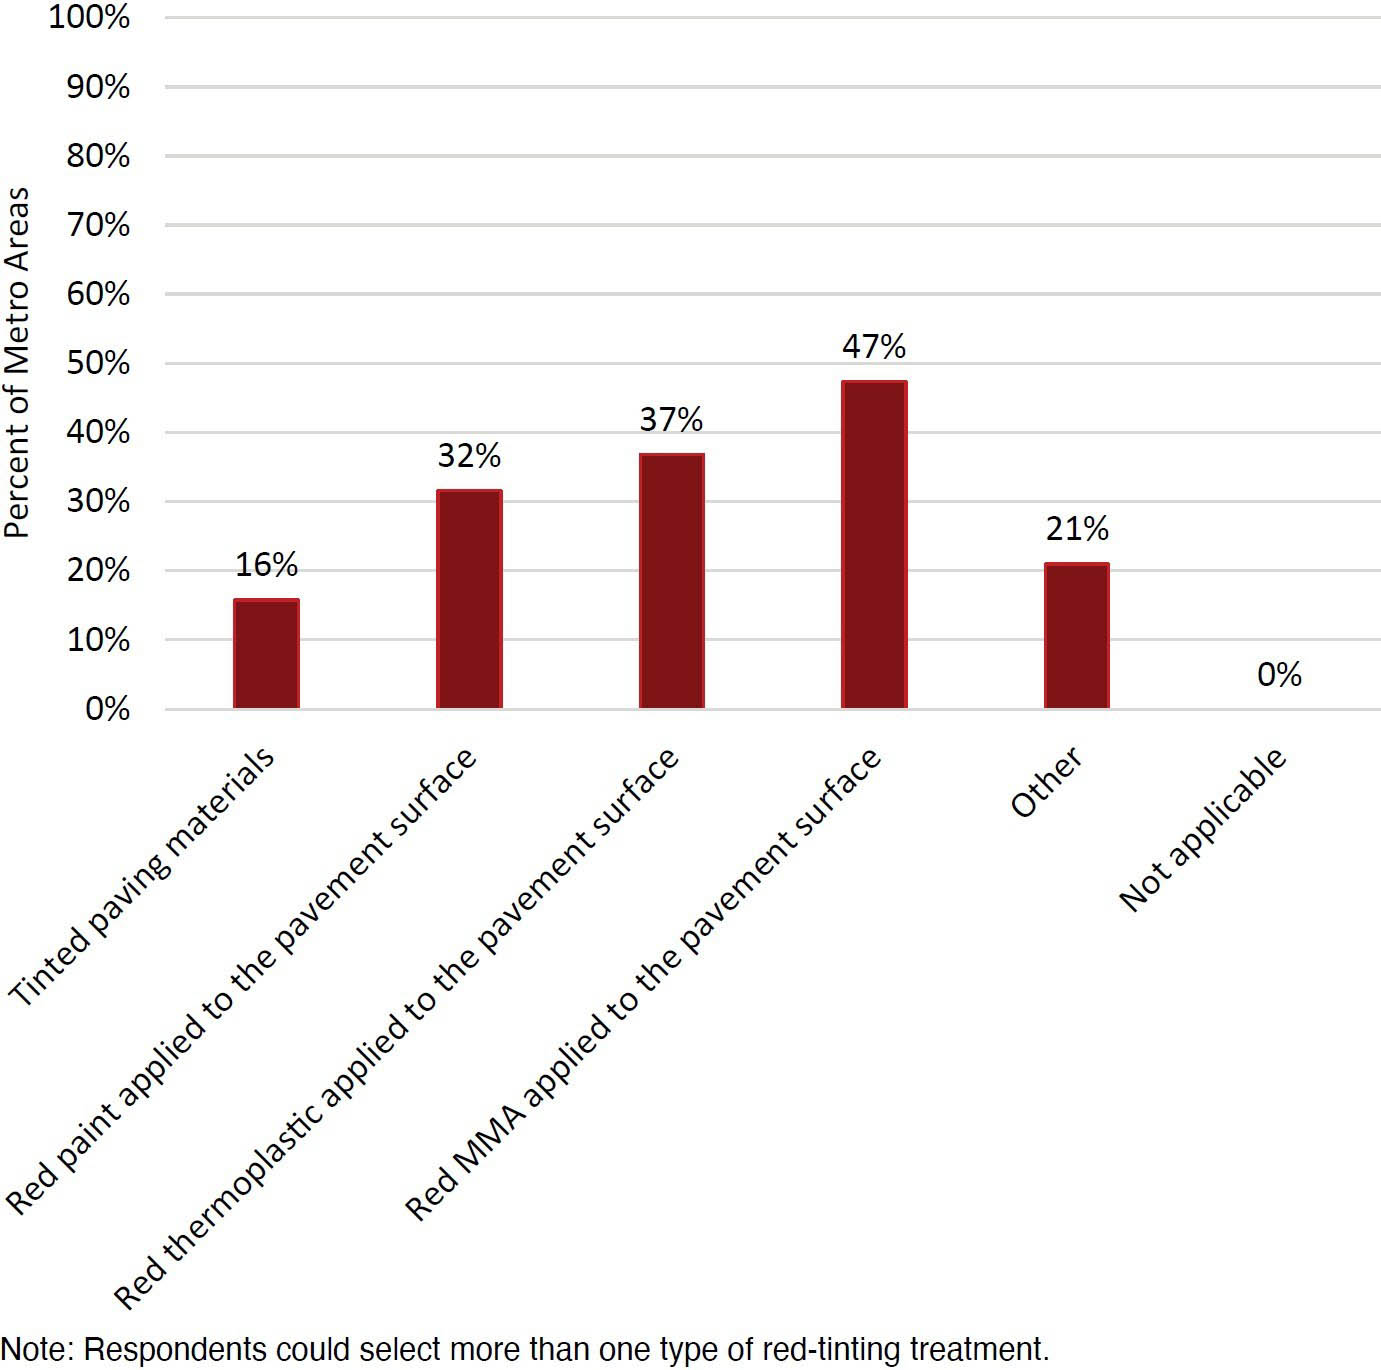
Long Description.
The x-axis represents red tinting treatments, including tinted paving materials, red paint applied to the pavement surface, red thermoplastic applied to the pavement surface, red MMA applied to the pavement surface, other, and not applicable. The y-axis represents the percentage of metro areas ranging from 0 percent to 100 percent in increments of 10. The data given in the bar graph are as follows: Tinted paving materials: 16 percent. Red paint applied to the pavement surface: 32 percent. Red thermoplastic applied to the pavement surface: 37 percent. Red MMA applied to the pavement surface: 47 percent. Other: 21 percent. Not applicable: 0 percent. The values are accurate. Note: Respondents could select more than one type of red tinting treatment.
responses use a high-friction surface treatment (HFST) (i.e., epoxy with color-coated glass aggregate); one of these uses a supplemental aggregate with the color-coated glass aggregate.
Figure 16 shows the types of red-tinting treatments used by the respondents in the past. Forty-two percent (8 of 19) of metro areas used red paint in the past. Twenty-one percent (4 of 19) used red thermoplastic, and 21% (4 of 19) used red MMA. The “not applicable” responses represent metro areas (7 of 19) that implemented their first red-tinted bus lanes relatively recently and have not tried other treatments. One of the two “other” respondents used an HFST (i.e., epoxy with color-coated glass aggregate) with no supplemental aggregate. The second “other” respondent used an epoxy-modified acrylic spray coating. Comparison of Figure 15 and Figure 16 suggests that some metro areas have moved away from red paint treatments over time.
The survey respondents listed advantages and disadvantages of the red-tinting treatments that they have used. The responses indicate that, collectively, the surveyed agencies and jurisdictions consider the following factors when choosing red-tinting treatments:
- Applying treatments in the correct season and under the correct weather conditions (e.g., in warm and dry conditions)
- Coordination with other jurisdictions
- Cost of implementation (including labor and equipment)
- Cost of maintenance (including frequency as well as labor and equipment needs)
- Cost of the product
- Durability (expressed in terms of limited fading, adequate adherence to a given pavement surface, and sustained skid resistance in the local climate)
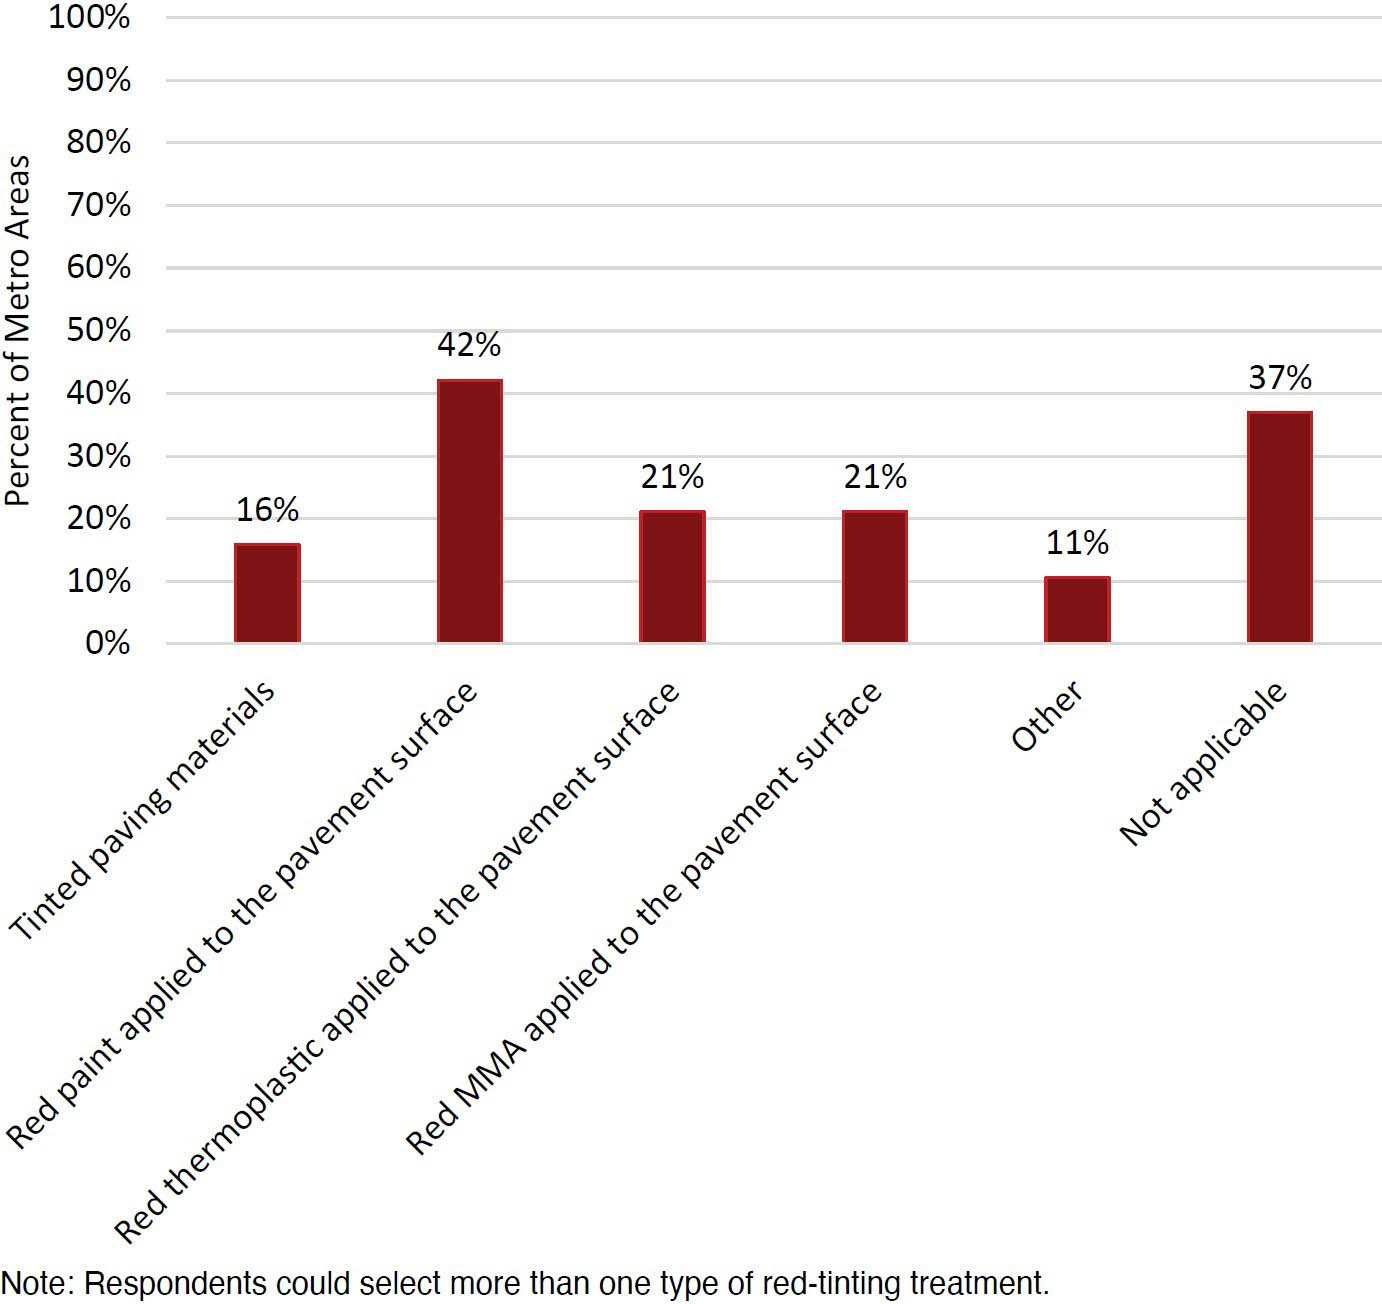
Long Description.
The x-axis represents red tinting treatments, including tinted paving materials, red paint applied to the pavement surface, red thermoplastic applied to the pavement surface, red MMA applied to the pavement surface, other, and not applicable. The y-axis represents the percentage of metro areas ranging from 0 percent to 100 percent in increments of 10. The data given in the bar graph are as follows: Tinted paving materials: 16 percent. Red paint applied to the pavement surface: 42 percent. Red thermoplastic applied to the pavement surface: 21 percent. Red MMA applied to the pavement surface: 21 percent. Other: 11 percent. Not applicable: 37 percent. The values are accurate. Note: Respondents could select more than one type of red tinting treatment.
- Effectiveness of the product (expressed in terms of lane-use compliance and visibility in different conditions)
- Environmental impacts
- Expected lifespan of the product (on a given pavement surface and in the local climate)
- Installer/contractor availability
- Product availability
- Safety (expressed in bus lane visibility and level of skid resistance)
- Short-term installation issues such as odor and fumes
- Simplicity of implementation (as implementation of some treatments requires specialized training or equipment as well as advance pavement surface preparation)
- Speed of implementation (as implementation can disrupt transit service, general traffic flow, and driveway access and can also require advance preparation of the pavement surface)
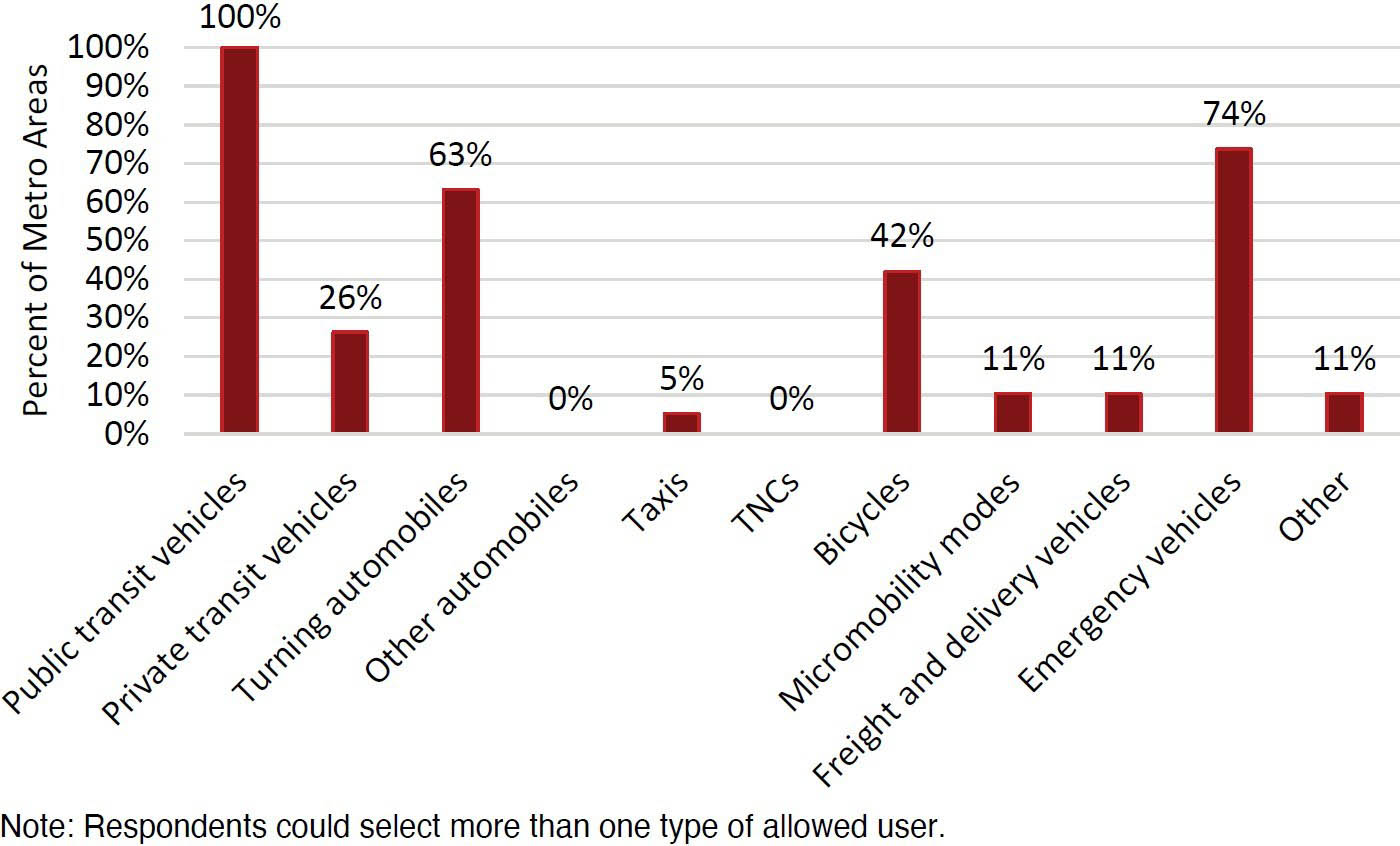
Figure 17 shows that 74% (14 of 19) of the responding metro areas allow emergency vehicles to use their red-tinted bus lanes. (Note: It is not clear from the survey responses if emergency vehicles are allowed at all times or only when an emergency is in progress.) Sixty-three percent (12 of 19) allow turning automobiles to use their red-tinted bus lanes. Some metro areas also allow private transit vehicles, taxis, bicycles, and micromobility modes to use their red-tinted bus lanes. Two (11%) noted that freight vehicles are allowed under limited circumstances. None of the responding metro areas allow transportation network companies (TNCs) to use their red-tinted bus lanes. The “other” response represents vanpools of seven or more.
Sixty-eight percent (13 of 19) of the responding metro areas do not change the allowed users of their red-tinted bus lanes by time of day or day of week. The six (32%) responding metro areas that indicated that they do change the allowed users by time of day or day of week clarified that they operate one or more of their red-tinted bus lanes as part-time bus lanes. During off-peak periods, the part-time bus lanes can be used by general traffic or for parking.
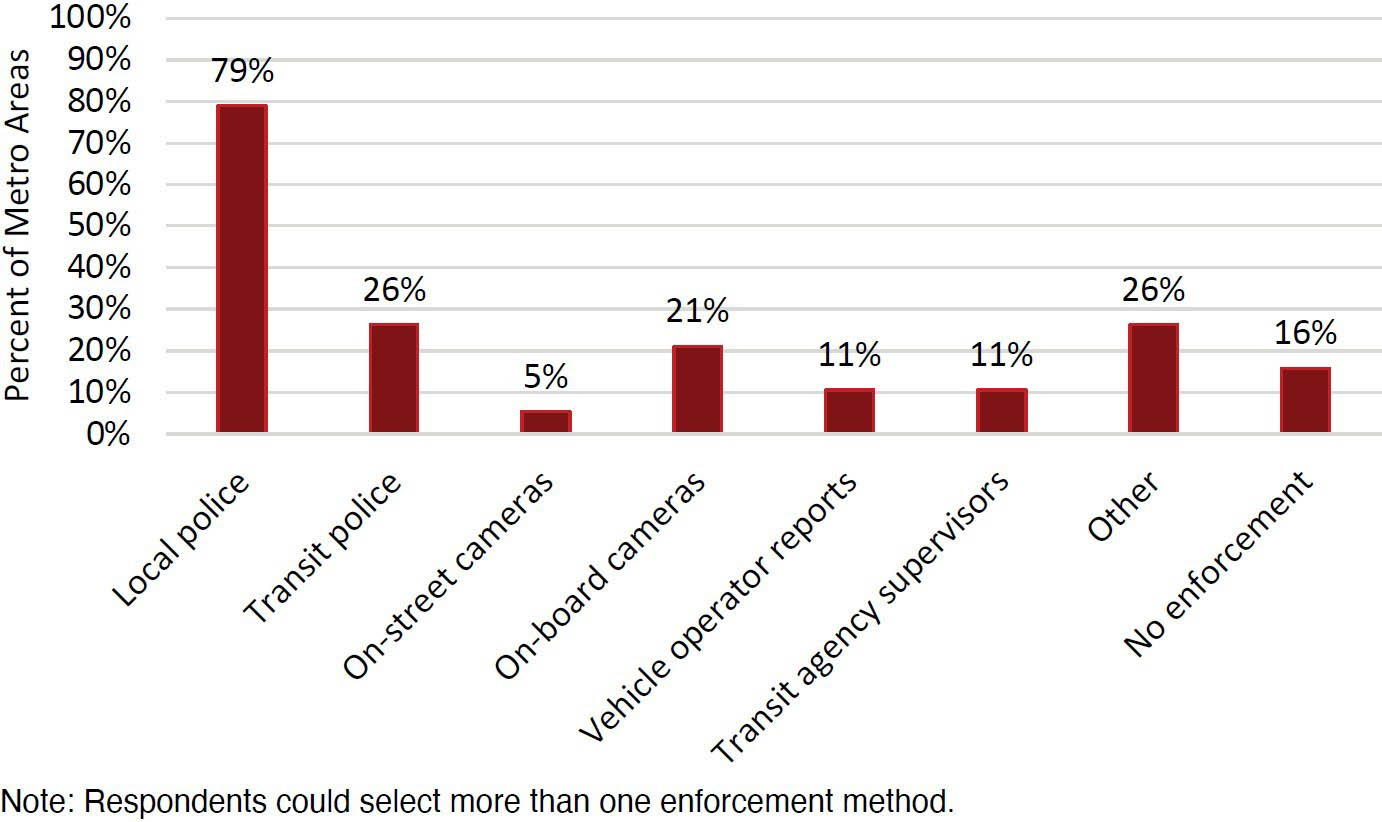
Figure 18 shows that 79% (15 of 19) of the responding metro areas rely on local police to some extent to enforce red-tinted bus lane usage restrictions. Five (26%) of the responding metro areas use transit police to some extent, and four (21%) use on-board cameras to some extent. Four of the five “other” responses stated that parking enforcement staff are used to some extent to enforce
Long Description.
The x-axis represents allowed users, including public transit vehicles, private transit vehicles, turning automobiles, other automobiles, taxis, TNCs, bicycles, micromobility modes, freight and delivery vehicles, emergency vehicles, and others. The y-axis represents the percentage of metro areas ranging from 0 percent to 100 percent in increments of 10. The data given in the bar graph are as follows: Public transit vehicles: 100 percent. Private transit vehicles: 26 percent. Turning automobiles: 63 percent. Other automobiles: 0 percent. Taxis: 5 percent. TNCs: 0 percent. Bicycles: 42 percent. Micromobility modes: 11 percent. Freight and delivery vehicles: 11 percent. Emergency vehicles: 74 percent. Other: 11 percent. The values are accurate. Note: Respondents could select more than one type of allowed user.
Long Description.
The x-axis represents enforcement methods, including local police, transit police, on-street cameras, on-board cameras, vehicle operator reports, transit agency supervisors, other, and no enforcement. The y-axis represents the percentage of metro areas ranging from 0 percent to 100 percent in increments of 10. The data given in the bar graph are as follows: Local police: 79 percent. Transit police: 26 percent. On-street cameras: 5 percent. On-board cameras: 21 percent. Vehicle operator reports: 11 percent. Transit agency supervisors: 11 percent. Other: 26 percent. No enforcement: 16 percent. The values are accurate. Note: Respondents could select more than one enforcement method.
red-tinted bus lane use restrictions. One respondent noted that there is little coordination between different enforcement entities. In 32% (6 of 19) of the responding metro areas, red-tinted bus lanes extend into or cross multiple jurisdictions.
Planning and Implementation of Metro Areasʼ Red-Tinted Bus Lanes
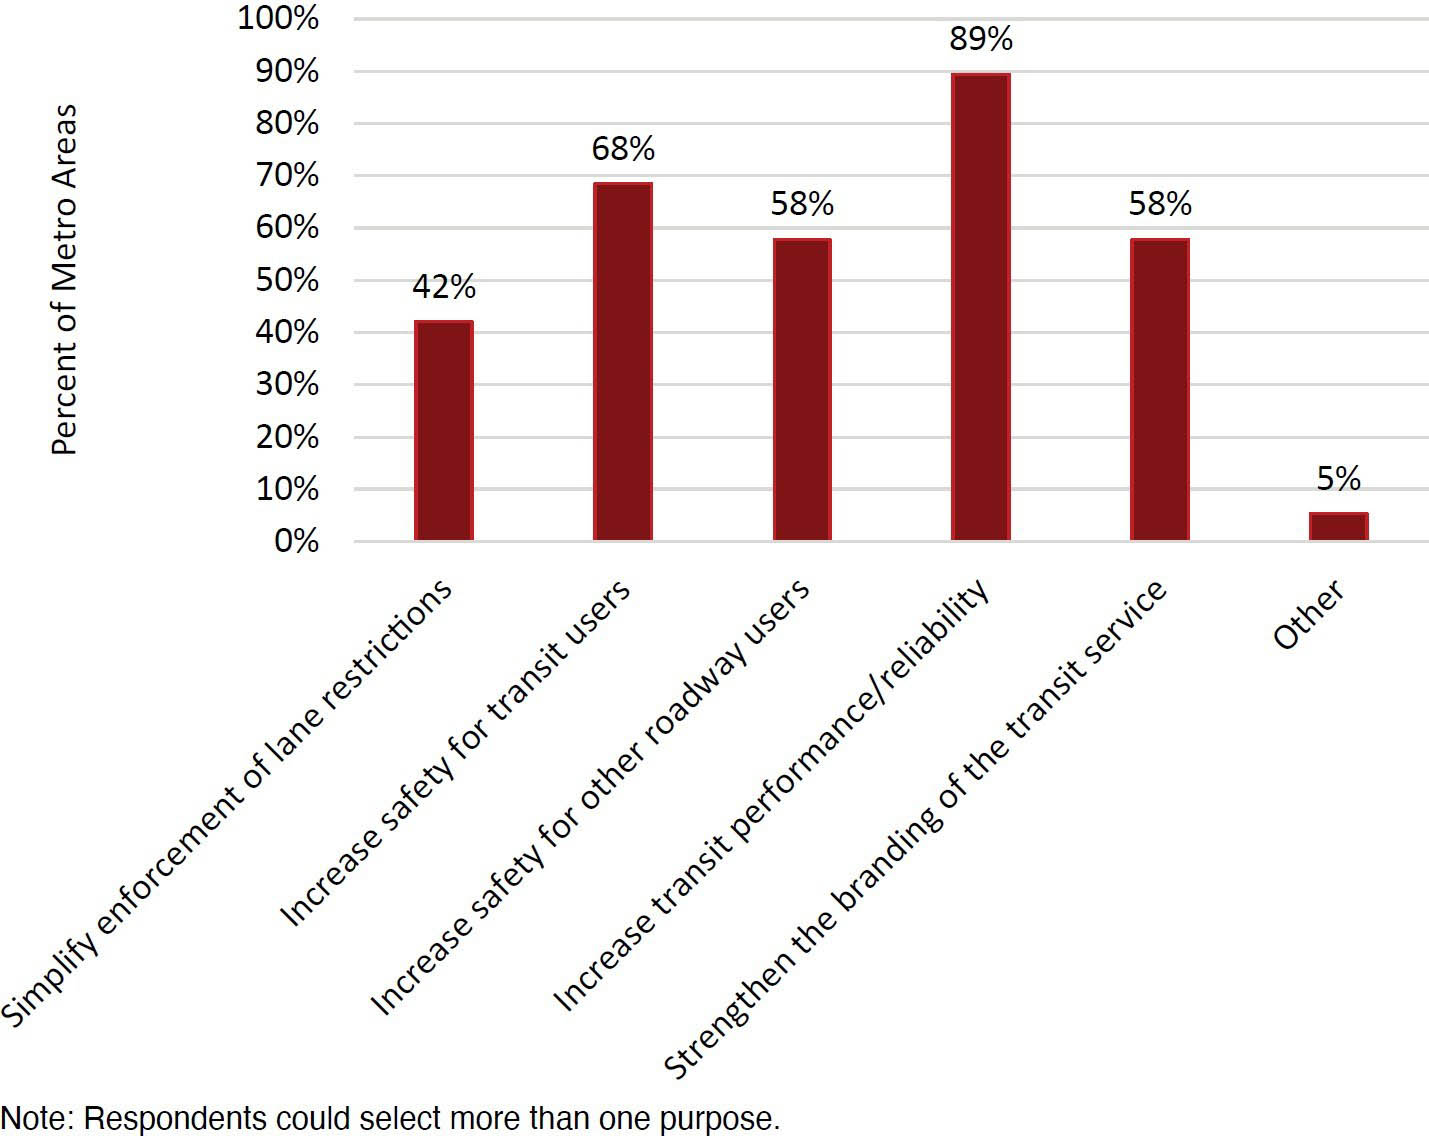
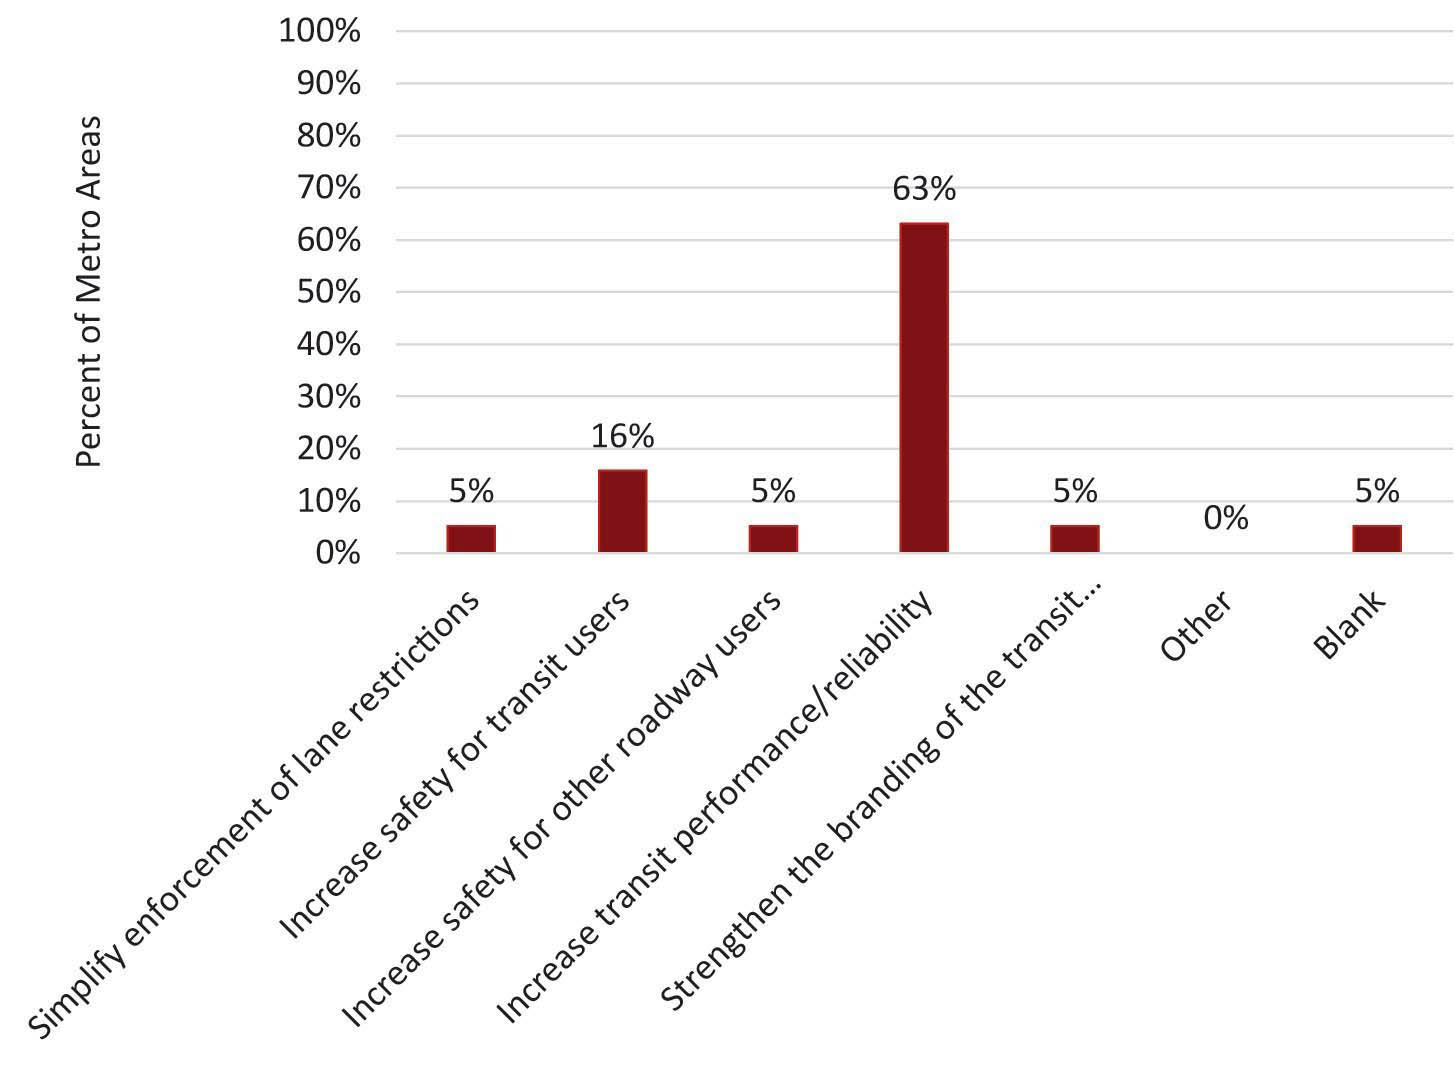
Figure 19 shows that 89% (17 of 19) of responding metro areas implemented red-tinted bus lanes to increase transit performance and reliability (e.g., by reducing delay to buses). Sixty-eight percent (13 of 19) implemented red-tinted bus lanes to increase safety for transit users, 58% (11 of 19) implemented red-tinted bus lanes to increase safety for other roadway users, and 58% (11 of 19) implemented red-tinted bus lanes to enhance the branding of the transit service or services that use the lanes. As Figure 20 shows, 63% (12 of 19) of responding metro areas indicated that increasing transit performance and reliability was the most important purpose of their red-tinted bus lanes.
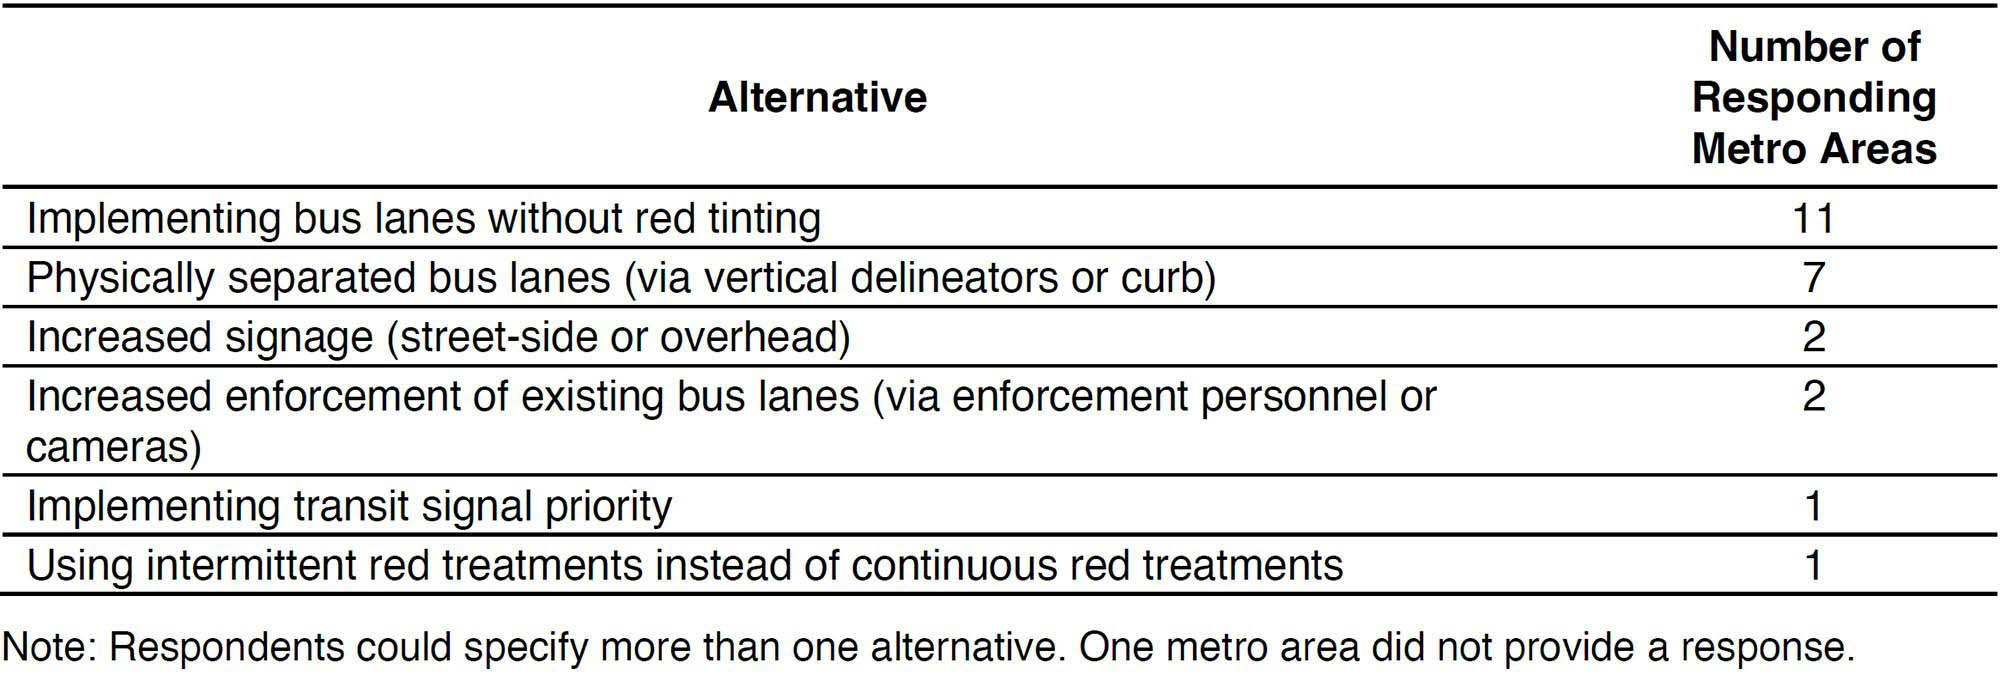
The responding metro areas reported that they considered implementing—in one or more corridors—the alternatives to red-tinted bus lanes listed in Table 6. The metro areas reported moving forward with red-tinted bus lanes in the relevant corridors because the alternatives came with higher costs, more complexity, or less effectiveness. One metro area noted that operating peak-period-only lanes makes physically separated alternatives infeasible. Another noted that each red-tinted bus lane project is evaluated in context.
Methods that the responding metro areas used to educate the public about the purpose and usage of red-tinted bus lanes included posts on agency and partner websites and social media accounts, on-board flyer distribution, posted flyers, public meetings, workshops, open houses, block walks, social media ad campaigns, construction notices, wayside and overhead signs (static or dynamic), back-of-bus signs, direct outreach to adjacent property owners, meetings with community organizations and businesses, meetings with elected officials, online videos, instructional documents distributed via driving schools and community organizations, radio public service announcements, community newsletters, media interviews, and ribbon-cutting ceremonies. These methods might have been employed with implementation of specific red-tinted bus lane projects or as part of more general educational campaigns for using bus lanes.
Long Description.
The x-axis represents purposes, including simplifying the enforcement of lane restrictions, increasing safety for transit users, increasing safety for other roadway users, increasing transit performance or reliability, strengthening the branding of the transit service, and others. The y-axis represents the percentage of metro areas ranging from 0 percent to 100 percent in increments of 10. The data given in the bar graph are as follows: Simplify enforcement of lane restrictions: 42 percent. Increase safety for transit users: 68 percent. Increase safety for other roadway users: 58 percent. Increase transit performance or reliability: 89 percent. Strengthen the branding of the transit service: 58 percent. Other: 5 percent. The values are accurate. Note: Respondents could select more than one purpose.
Long Description.
The x-axis represents the most important purposes, including simplify enforcement of lane restrictions, increase safety for transit users, increase safety for other roadway users, increase transit performance or reliability, strengthen the branding of the transit service, other, and blank. The y-axis represents the percentage of metro areas ranging from 0 percent to 100 percent in increments of 10. The data given in the bar graph are as follows: Simplify enforcement of lane restrictions: 5 percent. Increase safety for transit users: 16 percent. Increase safety for other roadway users: 5 percent. Increase transit performance or reliability: 63 percent. Strengthen the branding of the transit service: 5 percent. Other: 0 percent. Blank: 5 percent. The values are accurate.
Long Description.
The column headers of the table are alternative and the number of responding metro areas. The data given in the table row-wise are as follows: Row 1: Implementing bus lanes without red tinting, 11. Row 2: Physically separated bus lanes (via vertical delineators or curb), 7. Row 3: Increased signage (street-side or overhead), 2. Row 4: Increased enforcement of existing bus lanes (via enforcement personnel or cameras), 2. Row 5: Implementing transit signal priority, 1. Row 6: Using intermittent red treatments instead of continuous red treatments, 1. Note: Respondents could specify more than one alternative. One metro area did not provide a response.
Impacts of Metro Areasʼ Red-Tinted Bus Lanes
Eighty-four percent (16 of 19) of responding metro areas describe their red-tinted bus lanes as being effective overall. The other metro areas reported that the effectiveness of their red-tinted bus lanes was unknown at the time of the survey.
When asked to elaborate on why their red-tinted bus lanes have been effective overall, responding agencies offered the following comments:
- Non-transit vehiclesʼ intrusions into the red-tinted bus lanes are less frequent than in other sections of bus lanes.
- Red tinting largely eliminated a situation in which drivers were confused about the bus lane and entered it unintentionally.
- There are fewer violations, and preliminary data show a 46% to 71% improvement in bus lane compliance due to the red tinting.
- Before the lanes were painted, there was a high rate of lane use by non-transit vehicles. Since painting the lanes, use of the lanes by non-transit vehicles has stopped.
- Red tinting is more visible. Lane-usage compliance is higher, and it is easier for transit operators to use the lanes.
- Red-tinted bus lanes have improved transit travel times and reliability by removing general traffic from bus lanes and allowing buses to travel faster. Lane violations are not affecting overall bus speeds.
- Red-tinted lanes have reduced delay on many of the most heavily used transit corridors by preserving space for buses and trains and reducing violations compared to untinted lanes. Ridership growth in corridors where red tinting has been implemented has generally outpaced system ridership growth.
- Red-tinted bus lanes have been very effective in improving transit performance while mitigating the potential for increased violations that come with bus lanes.
- Red-tinting enhanced bus service travel times, convenience, and safety for all in the downtown area.
- Red tinting has increased safety and lane compliance.
- Transit service is more reliable.
- Red-tinted bus lanes have generally improved the speed and efficiency of transit operations.
- Red-tinted bus lanes have been largely effective at delineating road space for transit, allowing buses to bypass traffic congestion.
- Red-tinted bus lanes effectively separate buses from general traffic, improving speed and reliability.
- Red-tinted bus lanes are one of the more visible transit priority treatments, and they improve reliability and reduce delay.
- Red tinting has raised the profile of transit in the city.
- Red tinting clearly indicates roadway space for transit and is supported by enforcement.
- Red tinting highlights the presence of the bus lane and reminds the public about transit investments.
- Red tinting helps drivers know to stay out of the bus lane, which reduces conflicts between general traffic and bus operations. Yet, more enforcement will be needed to ensure effectiveness and create the perception that the bus lanes are effective. Speeding by some drivers in the bus lanes creates safety concerns.
Most of the responding metro areas were not able to provide quantitative information about the impacts of their red-tinted bus lanes specifically (beyond what is documented in Chapter 2 and Chapter 5). Likewise, many of the responding metro areas were not able to isolate the costs of enforcing and maintaining their red-tinted bus lanes from other enforcement and maintenance costs.
Key Challenges
Planning Red-Tinted Bus Lanes
The responding metro areas identified the following key challenges in planning red-tinted bus lanes:
- Funding
- Understanding the types of materials that are available, their costs, their effects on installation and maintenance, and how the public will perceive them
- Lack of guidelines for using specific materials (e.g., what kind of paint to use in a given context)
- Getting concurrence on projects and designs from all roadway owners and decision-makers, particularly when consistency across the transit system is desired
- Availability of local government staff to review proposed red-tinting projects
- Lack of before data to demonstrate that previous red-tinting projects have been a worthwhile investment
- Getting buy-in on maintenance responsibilities
- Ongoing coordination with partners and other jurisdictions
- Determining where the red-tinting treatment will be installed, what treatment will be used, and whether the treatment will be continuous or intermittent
- Public opposition to the aesthetics of the red-tinting treatment or the association of red-tinted bus lanes with gentrification or other controversial issues
- Diminishing number of suitable corridors (e.g., with sufficient levels of bus service)
The responding metro areas also identified key challenges associated with planning bus lanes in general, such as public opposition, balancing competing uses for street space, and the challenge of increasing transit frequencies enough to justify converting a general traffic lane to a bus lane.
Implementing Red-Tinted Bus Lanes
The responding metro areas identified the following key challenges in implementing red-tinted bus lanes:
- Funding
- Deciding on materials and application methods for specific locations
- Communicating with the public
- Implementing red-tinting treatments when weather conditions and pavement temperature comply with manufacturer recommendations
- Developing an implementation schedule that allows adequate time for curing, installation, demobilization, and other activities while minimizing adverse impacts on local stakeholders (e.g., maintaining parking lot access)
- Adjusting the implementation schedule in response to weather, traffic volumes, and stakeholder needs
- Developing a traffic control plan
- Communicating with transit operators (e.g., to address their concerns about traction on red-tinted surfaces)
- Minimizing disruptions to transit service during implementation
- Materials availability
- Procurement
- Minimizing the amount of time lanes are closed (e.g., closing lanes for hours, not days)
- Operational resource limitations (e.g., level of internal expertise, lack of internal staff availability, lack of necessary equipment, and number of available and qualified contractors)
- The roadway ownerʼs approval process
Operating and Enforcing Red-Tinted Bus Lanes
Nearly all of the responding metro areas identified having inadequate enforcement resources as the key challenge of operating and enforcing red-tinted bus lanes. This is a challenge that applies to bus lanes in general. Related challenges are that some responding entities do not have legal authority to enforce bus lane restrictions, and enforcement technologies and policies are likely to change over time.
The responding metro areas noted that red tinting can improve compliance and reduce the amount of enforcement needed, but it does not eliminate noncompliance. Some responding metro areas observed that it is easier to issue citations when red tinting is in place because violations can be more clearly seen, particularly when cameras (on-board or on-street) are used to detect violations. One responding metro area reported a local concern about enforcement disproportionately affecting lower-income individuals. One responding metro area identified technological challenges as an issue associated with automated enforcement. Approaches to enforcement are likely to change as technology changes.
Maintaining Red-Tinted Bus Lanes
The responding metro areas identified the following key challenges in maintaining red-tinted bus lanes:
- Funding
- Specific weather impacts
- Managing fading of the red color
- Replacing and repairing red-tinting treatments when weather conditions and pavement temperature comply with manufacturer recommendations
- Lack of available and qualified contractors
- Limited availability of contractors to replace damaged components of a particular red-tinting treatment (e.g., all contractors located in other states)
- Developing maintenance agreements with partners
- Ongoing construction and utility projects (which might damage the red-tinting treatment)
- Developing specifications for restoring damaged red-tinting treatments and a process for requiring utility companies, developers, and so forth to repair the damages
- Deficient original application of the red-tinting treatment (e.g., to surfaces that were not prepared correctly)
- Not originally selecting a red-tinting treatment with maintenance needs in mind
Several responding metro areas noted that their red-tinted bus lanes have not been in place long enough to have required significant maintenance.
Guidance for Other Metro Areas
The responding metro areas offered the following guidance for other metro areas that have implemented red-tinted bus lanes or are considering implementing red-tinted bus lanes:
- Planning and public awareness
- Seek advice and guidance from agencies that have implemented red-tinted bus lanes.
- Start the red-tinted bus lane development process early.
- Collect high-quality before-and-after data to document the impacts and potential benefits of the red-tinting treatments used.
- Have solid justification for why you want to create a red-tinted bus lane, especially if you are converting a general traffic lane into a bus lane.
- Conduct targeted outreach to transit riders as well as the local community. Publicize how the red-tinting project will provide benefits.
- Communicate with adjacent businesses in advance.
- Work closely with the local jurisdiction(s) to make sure everyone is on the same page with respect to the planning process, corridor selection, type and extent of the red-tinting treatment, and materials to be used. These project components can have a consequential impact on costs and public perception.
- Design and implementation
- Take the time to carefully calculate the amount of material needed to install red-tinting treatments. MMA, for example, expires and can be challenging to dispose of.
- Use trial-and-error and pilot efforts to determine what works best for your circumstances. Pilot efforts can help build relationships between partners. Seek input from the crews that install the treatments during the pilot efforts.
- Develop design standards for red-tinted bus lanes that include general specifications and discuss implementation and usage.
- Use intermittent or background red-tinting treatments to save costs, unless continuous red-tinting treatments are needed to reduce driver confusion, to maximize the effectiveness of the bus lane, or to emphasize the visibility of the transit service or services that use the bus lane. Intermittent and background treatments might be more suitable for part-time bus lanes or bus lanes where violation rates are low.
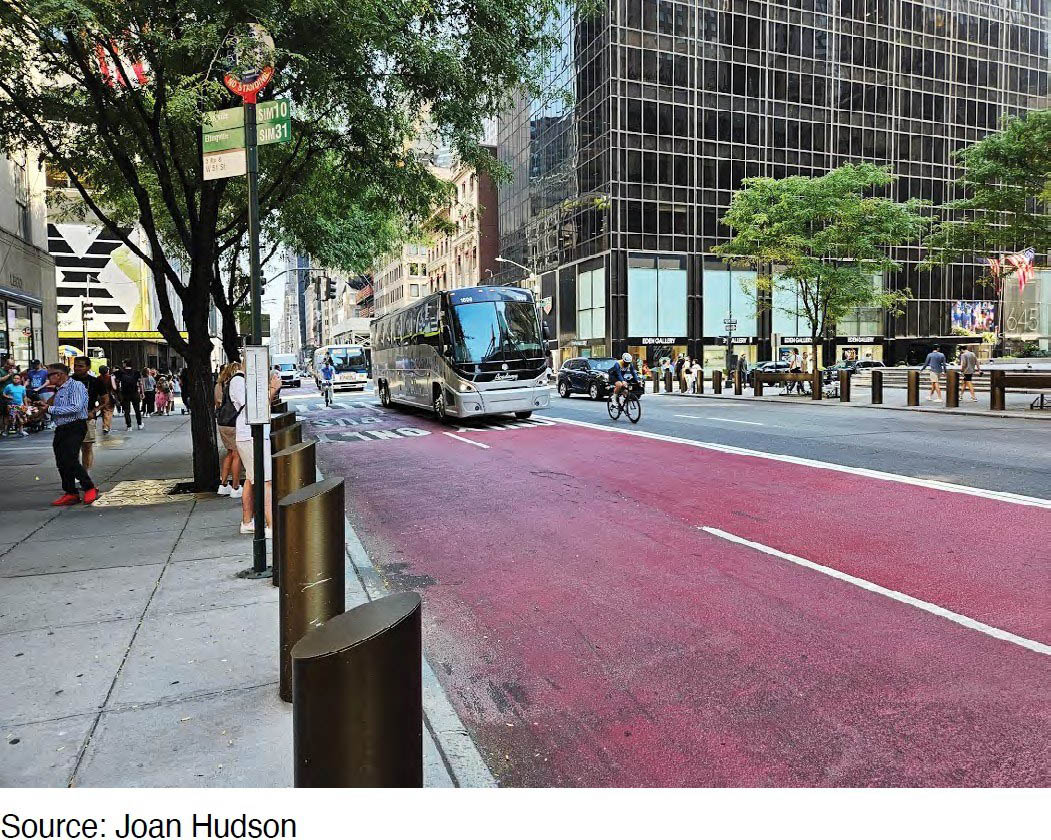
- In the busiest bus corridors, consider using a double red-tinted bus lane design (as illustrated in Figure 21) so that through buses can bypass stopped buses. This also allows space for vehicle loading and separation from right-turning vehicles. Consider single bus lanes as peak-period-only bus lanes so that they can be used as parking during the off peak. This creates a narrower roadway with visual friction to slow speeding vehicles.
- Be aware that some suppliers of red-tinting materials will not guarantee their materials if they are applied on substandard pavement.
- Operations and enforcement
- If possible, begin with untinted lanes and study enforcement challenges. Proceed with red-tinted bus lanes only if the enforcement need is elevated and there is confidence that red-tinted lanes will have a positive impact.
- Education and enforcement should accompany implementation.
- Maintenance
- Use durable red-tinting materials.
- The up-front cost of some red-tinting treatments might be higher than other treatments, but their durability and visibility might be worth the higher cost. Less-expensive products might require maintenance—or replacement—sooner or more frequently.
- Develop a process for requiring utility companies and construction companies to restore red-tinting treatments damaged during their projects or to contribute funding toward the repairs. One agency requires a new warranty for red-tinting materials that are replaced by utility companies.


