Previous Chapter: 3 State-of-Practice Survey
Suggested Citation: "4 Survey Results." National Academies of Sciences, Engineering, and Medicine. 2026. Developing a Guide to Manage Out-of-Service Utility Facilities. Washington, DC: The National Academies Press. doi: 10.17226/29497.

CHAPTER 4—SURVEY RESULTS

Survey Respondents

In total, 125 respondents participated in the survey. Of those, 23 provided substantially incomplete or blank answers, resulting in 102 valid responses. Survey participants were asked to identify as one of five stakeholder types, as shown in Table 6.

Table 6. Survey Respondents by Stakeholder Type.

Stakeholder Type Count Percentage
Project Owner (DOT, MPO, etc.) 69 68%
Contractor 3 3%
Consultant 1 1%
Other 7 7%
Utility Owner 22 22%
Total 102 100%

Most survey participants were project owners, followed by utility owners and a few contractors and consultants. Participants in the other category included members of utility damage notification centers, hazardous liquid pipeline operators, and damage prevention professionals.

To contrast differences in perception among stakeholders, researchers compared the answers of project owners with all other groups combined for some of the survey questions. To simplify the comparison, and because the consultant and contractor groups had low numbers of responses, researchers compared project owners with all others (i.e., other than project owners). Table 7 reflects this grouping.

Table 7. Survey Respondents Grouped as Project Owners and Other than Project Owners.

Stakeholder Type Count Percentage
Project Owner (DOT, MPO, etc.) 69 68%
Other than Project Owner 33 32%
Total 102 100%

Of the 22 participating utility owners, most were employed by natural gas or oil companies. Table 8 shows respondents identifying as utility owners by type of utility. Participants were allowed to select multiple answers.

Table 8. Utility Owner Respondents by Utility Type.

Utility Type Count
Natural Gas 10
Oil 9
Suggested Citation: "4 Survey Results." National Academies of Sciences, Engineering, and Medicine. 2026. Developing a Guide to Manage Out-of-Service Utility Facilities. Washington, DC: The National Academies Press. doi: 10.17226/29497.
Wastewater 3
Potable Water 4
Electric 4
Other 2
Total 32

Survey participants were involved in all typical phases of a highway project delivery process, as shown in Table 9. Multiple answer selections were allowed. In total, 88 respondents provided 193 responses, suggesting that each respondent was involved in slightly more than two project phases on average.

Table 9. Survey Respondents by Phase of the Project Delivery Process.

Project Phase Count
Planning 34
Preliminary Design 43
Detailed Design 41
Construction 53
Operation and Maintenance 22
Total 193

Potential Outcomes of OOS Utilities

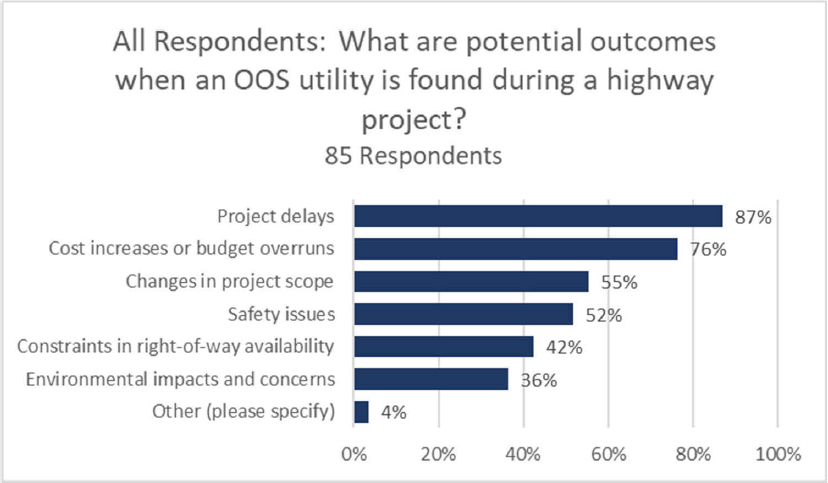
Survey participants were asked to select potential outcomes when an OOS utility is found during a highway project. A list of potential outcomes was provided, and survey participants were allowed to select multiple answers including other, which allowed respondents to manually enter an answer not provided. In total, 86 participants responded, making 301 selections (about four selections per participant on average). Figure 9 shows that 87 percent of participants identified project delays and 76 percent of participants identified cost increases and budget overruns as potential outcomes of an OOS utility found during a highway project. About half of participants identified changes in project scope and safety issues as potential outcomes. Constraints in right-of-way availability was identified as a potential outcome by 42 percent of participants, and about one-third identified environmental impacts and concerns as a potential outcome. For other potential outcomes, participants noted that OOS utilities are mostly unrecorded, utility ownership is often unclear, and utility status (i.e., active or out of service) is typically unknown when found.
Suggested Citation: "4 Survey Results." National Academies of Sciences, Engineering, and Medicine. 2026. Developing a Guide to Manage Out-of-Service Utility Facilities. Washington, DC: The National Academies Press. doi: 10.17226/29497.
The x-axis shows percentages from 0 percent to 100 percent in increments of 20. The y-axis includes, from top to bottom, project delays, cost increases or budget overruns, changes in project scope, safety issues, constraints in right-of-way availability, environmental impacts and concerns, and other (please specify). The data given in the bar graph are as follows: Project delays: 87 percent. Cost increases or budget overruns: 76 percent. Changes in project scope: 55 percent. Safety issues: 52 percent. Constraints in right-of-way availability: 42 percent. Environmental impacts and concerns: 36 percent. Other (please specify): 4 percent. The number of respondents is 85, and the values are accurate.
Figure 9. All Respondents: Potential Outcomes of OOS Utilities Found During a Highway Project.

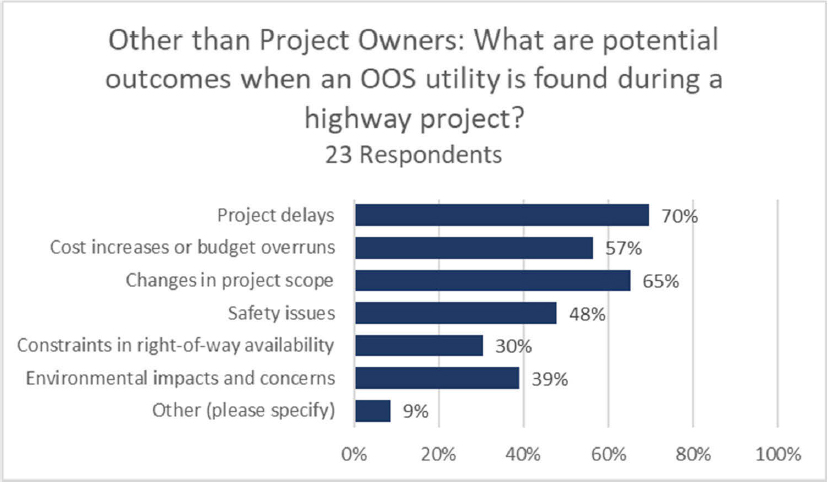
Comparing responses from project owners to other stakeholders, most project owners believed that project delays (94 percent) and cost increases (84 percent) are a potential outcome, compared to 70 percent and 57 percent of participants identifying as other stakeholders, respectively (Figure 10 and Figure 11). However, a larger percentage of participants identifying as other stakeholders identified changes in project scope as a potential outcome when an OOS utility is found during a highway project than the project owners (65 percent versus 52 percent). Regarding constraints to the available right-of-way, 47 percent of project owners believed this to be a potential outcome versus 30 percent of the participants identifying as other stakeholders.
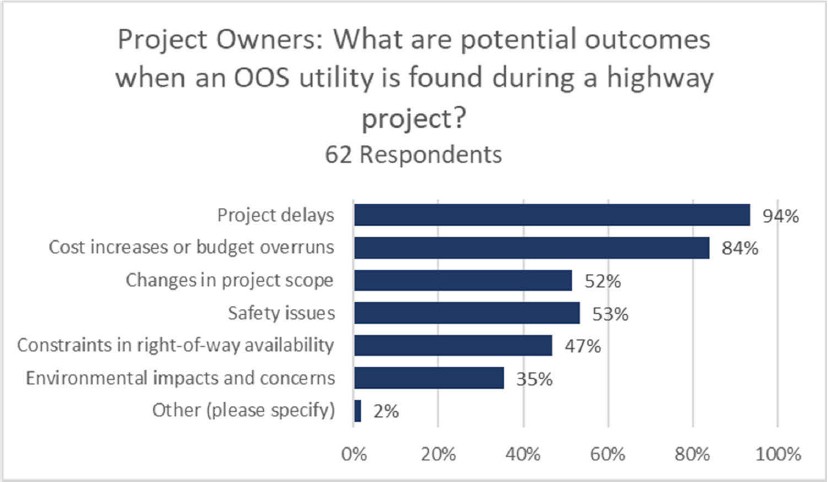
The x-axis shows percentages from 0 percent to 100 percent in increments of 20. The y-axis includes, from top to bottom, project delays, cost increases or budget overruns, changes in project scope, safety issues, constraints in right-of-way availability, environmental impacts and concerns, and other (please specify). The data given in the bar graph are as follows: Project delays: 94 percent. Cost increases or budget overruns: 84 percent. Changes in project scope: 52 percent. Safety issues: 53 percent. Constraints in right-of-way availability: 47 percent. Environmental impacts and concerns: 35 percent. Other (please specify): 2 percent. The number of respondents is 62, and the values are accurate.
Figure 10. Project Owners: Potential Outcomes of OOS Utilities Found During a Highway Project.
Suggested Citation: "4 Survey Results." National Academies of Sciences, Engineering, and Medicine. 2026. Developing a Guide to Manage Out-of-Service Utility Facilities. Washington, DC: The National Academies Press. doi: 10.17226/29497.
The x-axis shows percentages from 0 percent to 100 percent in increments of 20. The y-axis includes, from top to bottom, project delays, cost increases or budget overruns, changes in project scope, safety issues, constraints in right-of-way availability, environmental impacts and concerns, and other (please specify). The data given in the bar graph are as follows: Project delays: 70 percent. Cost increases or budget overruns: 57 percent. Changes in project scope: 65 percent. Safety issues: 48 percent. Constraints in right-of-way availability: 30 percent. Environmental impacts and concerns: 39 percent. Other: 9 percent. The number of respondents is 23, and the values are accurate.
Figure 11. Respondents Other than Project Owners: Potential Outcomes of OOS Utilities Found During a Highway Project.

Project Owner Perspectives

Situations Addressed in Daily Duties

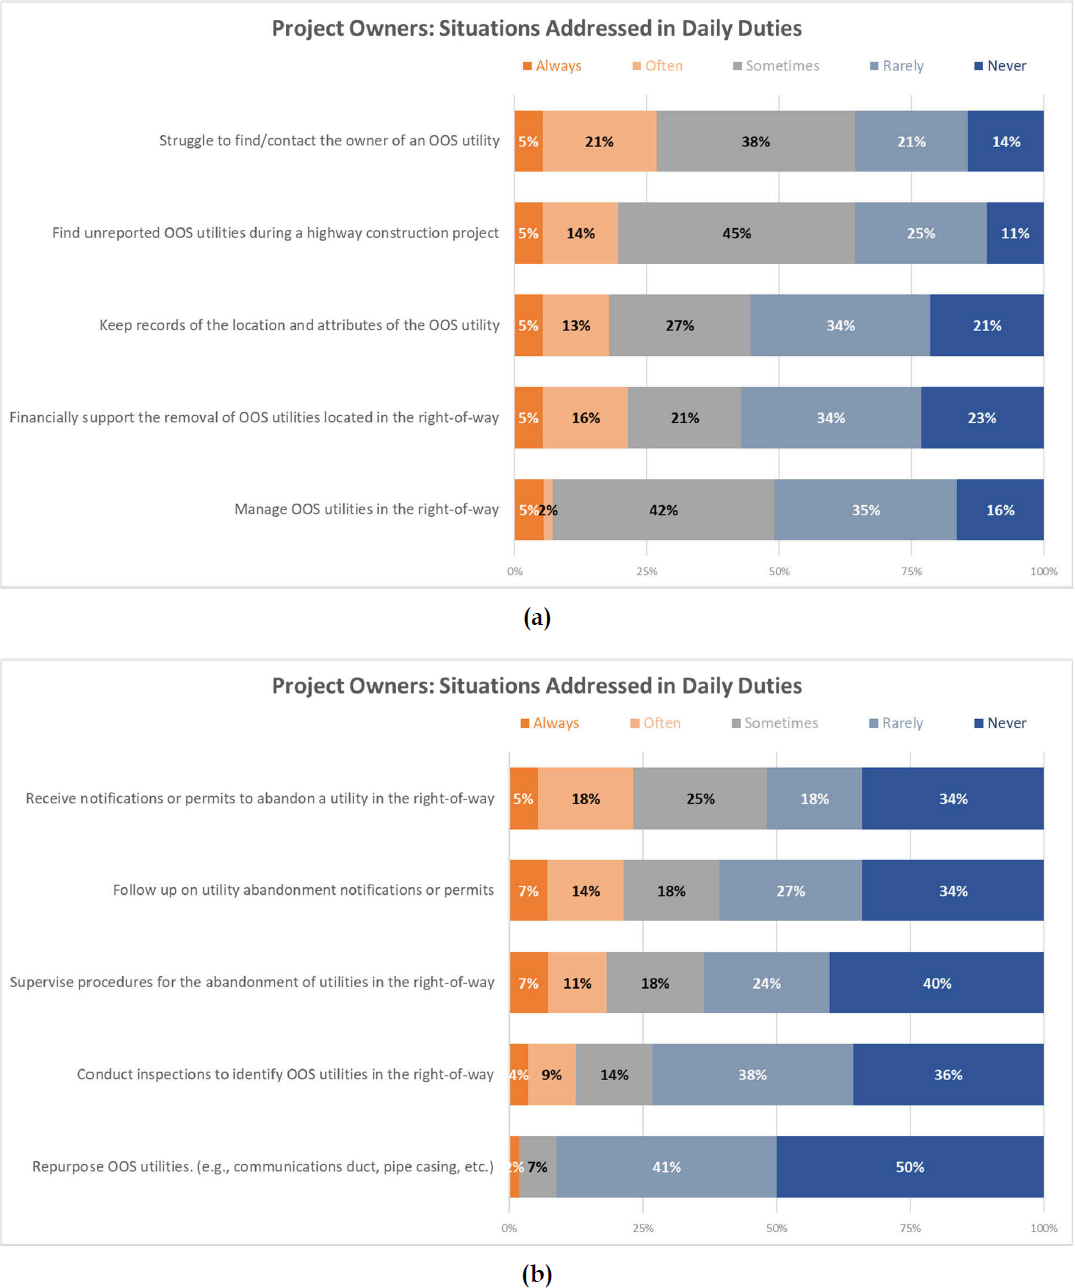
Researchers asked project owners how often they address situations that may arise when dealing with OOS utilities. Researchers provided the following list of situations and asked respondents to indicate their frequency using never, rarely, sometimes, often, or always:

  • Conduct inspections to identify OOS utilities in the right-of-way.
  • Financially support the removal of OOS utilities located in the right-of-way.
  • Find unreported OOS utilities during a highway construction project.
  • Follow up on utility abandonment notifications or permits.
  • Keep records of the location and attributes of OOS utilities.
  • Manage OOS utilities in the right-of-way.
  • Receive notifications or permits to abandon utilities in the right-of-way.
  • Repurpose OOS utilities (e.g., communications duct, pipe casing, etc.).
  • Struggle to find/contact the owner of OOS utilities.
  • Supervise procedures for the abandonment of utilities in the right-of-way.

Figure 12 (a) and (b) provide an overview of the responses, ranked by the frequency with which project owners addressed these situations in their daily duties. Overall, project owners rarely or never dealt with most situations, with two exceptions. Project owners more frequently reported struggling to find/contact the owner of an OOS utility and finding unreported OOS utilities during a highway construction project as part of their daily duties.
Suggested Citation: "4 Survey Results." National Academies of Sciences, Engineering, and Medicine. 2026. Developing a Guide to Manage Out-of-Service Utility Facilities. Washington, DC: The National Academies Press. doi: 10.17226/29497.

Challenges Managing OOS Utilities

Project owners were asked what challenges or obstacles their department faces when dealing with OOS utilities in the right-of-way. Appendix B provides a summary of the responses. The issues mentioned most frequently were determining utility ownership, locating OOS utilities, and managing utility conflicts during an active construction project. The research team categorized and summarized the comments provided by survey respondents related to utility coordination, right-of-way management, and construction challenges as follows:

  • Ownership and verification challenges.
    • Difficulty determining ownership of facilities.
    • Difficulty verifying whether a utility is truly out of service.
    • Difficulty identifying the correct owner, especially with frequent ownership changes.
    • Lack of documentation/outdated records make it hard to locate abandoned lines.
    • Poor recordkeeping and slow response in identifying OOS utilities.
  • Documentation and reporting issues.
    • Poor documentation of the location of OOS infrastructure.
    • Lack of a method to change the status or ownership of existing permits.
    • Inadequate rules or policies addressing OOS facilities in current regulations.
    • Utilities not maintaining records/flagging OOS utilities, as required by state law.
  • Coordination and communication issues.
    • The permit office is not always in the loop, leading to follow-up challenges.
    • Lack of updated contact information.
    • Decisions by field engineers not shared or consulted with others.
    • Difficulty gaining consensus on allowing OOS utilities in the right-of-way.
    • Difficulty getting utility companies to admit ownership or cooperate.
  • Construction and project management issues.
    • Difficulty confirming a utility is abandoned in the field during construction.
    • Late identification of OOS utilities leads to project rescope/rework.
    • Inability to locate abandoned lines threatens the safety of construction field workers.
    • Unplanned utility work in active construction zones results in project delays.
    • Difficulty tracking down owners of abandoned facilities during construction.
  • Project workflow disruptions.
    • Delays in construction when OOS utilities are encountered.
    • Work stoppages to confirm utility status diminishes productivity.
    • Claims from contractors due to work stoppages during construction.
Suggested Citation: "4 Survey Results." National Academies of Sciences, Engineering, and Medicine. 2026. Developing a Guide to Manage Out-of-Service Utility Facilities. Washington, DC: The National Academies Press. doi: 10.17226/29497.
  • Regulatory compliance and policy challenges.
    • No funds available for OOS removal.
    • Utility owners with OOS utilities might discontinue participation in One Call, and One Call services might be unable to reach the owner of OOS utilities.
    • Environmental impacts related to utility infrastructure containing asbestos.

Experience with Removal of OOS Utilities

Project owners were asked whether they have experienced issues with the removal of OOS utilities during highway construction project. Of the 56 respondents, 38 had experienced issues, 11 had not, and seven were unsure (Figure 13).
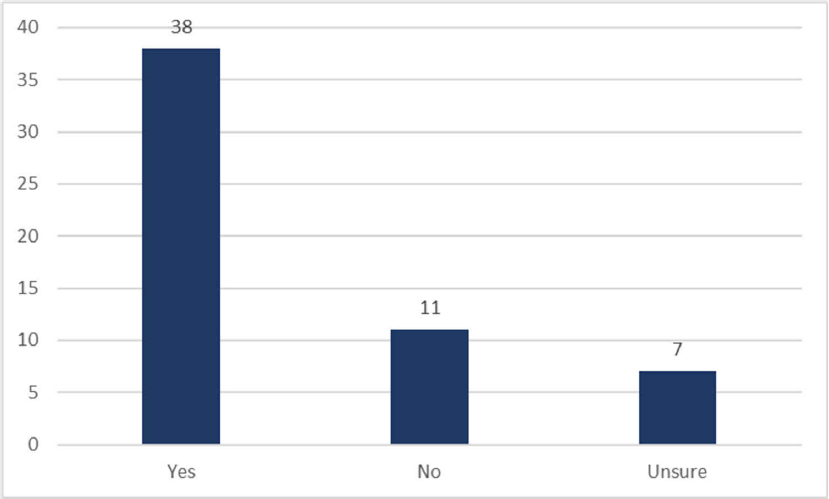
The x-axis lists three categories: Yes, No, and Unsure. The y-axis shows the number of respondents, ranging from 0 to 40 in increments of 5. The data given in the bar graph are as follows: Yes: 38, No: 11, and Unsure: 7. The values are accurate.
Figure 13. Project Owners Who Experienced Issues with the Removal of OOS Utilities During Highway Construction.

The 38 participants who responded affirmatively were asked to describe the issues they experienced with the removal of OOS utilities during a highway construction project. For the 34 participants who responded, the research team categorized and summarized their comments related to construction challenges, safety concerns, and regulatory issues, as follows:

  • Identification and ownership challenges.
    • Difficulty determining ownership of abandoned facilities in the right-of-way.
    • Difficulty determining ownership and responsibility for removal or mitigation.
  • Safety and environmental concerns.
    • Uncertainty about OOS utility contents and safety concerns during removal.
    • Injury/hospitalization from cutting unknown abandoned utility.
    • Contamination in facilities, including hazardous materials like asbestos.
Suggested Citation: "4 Survey Results." National Academies of Sciences, Engineering, and Medicine. 2026. Developing a Guide to Manage Out-of-Service Utility Facilities. Washington, DC: The National Academies Press. doi: 10.17226/29497.
  • Communication problems.
    • Confusion regarding the status of utilities (i.e., active or out of service).
    • Contractors must assume which facilities are out of service.
    • If contractors assume incorrectly, they may cause damage to active utilities.
    • Lack of standardized reporting for OOS utilities.
    • New utility owners destroy maps or never receive maps (records) from previous owners, making it difficult to identify utilities.
  • Construction and project delays.
    • Delays in construction due to the discovery of abandoned utilities.
    • Delays/costs incurred to relocate utilities during construction.
    • Delays/costs incurred if utilities are not relocated as specified.
    • Delays/costs incurred if unidentified utility lines are encountered.
    • Delays in receiving relocation plans from utilities.
    • Difficulty quickly determining how to keep contractors working during delays.
  • Financial and liability considerations.
    • Costs/risks during removal of facilities considered environmental concerns.
    • Financial burden on DOT when facilities were already in place on right-of-way.
  • Regulatory and legal issues.
    • Difficulty complying with utility permits for utilities containing asbestos.
    • Difficulty assigning removal/mitigation costs to owner/former owner.
    • Difficulty changing the status or ownership of existing permits.

Strategies to Manage and Resolve OOS Utilities

Project owners were asked about successful strategies or practices to manage and resolve OOS utilities. Of the 56 respondents, 39 provided an example of a successful strategy or practice; Appendix B summarizes these responses. Survey responses collectively emphasized the importance of proactive planning, communication, compliance, and technological tools to manage and mitigate issues related to OOS utilities during construction projects. The research team summarized these successful strategies and practices as follows:

  • Documentation and recordkeeping.
    • Tracking relocations and obtaining as-builts.
    • Keeping good records, including as-built records.
  • Communication and coordination.
    • Openly communicating and maintaining relationships with utility companies.
    • Building trustworthy business relationships.
    • Coordinating utilities during design and construction.
Suggested Citation: "4 Survey Results." National Academies of Sciences, Engineering, and Medicine. 2026. Developing a Guide to Manage Out-of-Service Utility Facilities. Washington, DC: The National Academies Press. doi: 10.17226/29497.
  • Regulatory compliance and policy implementation.
    • Ensuring compliance with state utility accommodation policy.
    • Enforcing policies for sharing utility information.
    • Tightening language on removal requirements for better enforcement.
    • Charging utilities for delays caused by OOS issues.
  • Technology and tools.
    • Implementing utility tracking software.
    • Using mapping tools for utility location data.
    • Performing SUE investigations.
  • Project planning and design.
    • Performing thorough SUE investigations.
    • Identifying utility issues during the planning phase.
    • Planning for utility identification and relocation deadlines.
    • Redesigning around obstructions, as feasible.
    • Designing with awareness of utilities within the right-of-way.
  • Enforcement and permitting.
    • Denying new utility permits for delayed relocations of OOS utilities.
    • Making utilities contractually responsible for meeting deadlines.
  • Prevention of future issues with OOS utilities.
    • Reporting OOS facilities to the state’s One Call system.
    • Denying applications to companies with abandoned utility lines.
    • Encouraging removal through negotiation with facility owners.

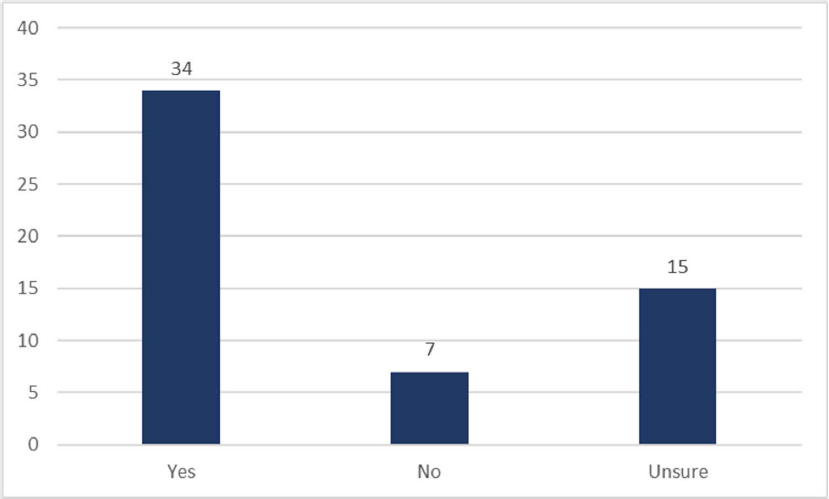
Project owners were asked whether their department has a manual, guideline, or document that describes the requirements to abandon a utility or place it out of service. Of the 56 respondents, 34 responded affirmatively, 7 responded negatively, and 15 were unsure (Figure 14).

The 34 participants who responded affirmatively were asked to provide a link to their department’s document(s); these links are included in Appendix B.
Suggested Citation: "4 Survey Results." National Academies of Sciences, Engineering, and Medicine. 2026. Developing a Guide to Manage Out-of-Service Utility Facilities. Washington, DC: The National Academies Press. doi: 10.17226/29497.
The x-axis lists three categories: Yes, No, and Unsure. The y-axis shows the number of respondents ranging from 0 to 40 in increments of 5. The data given in the bar graph are as follows: Yes: 34, No: 7, and Unsure: 15. The values are accurate.
Figure 14. Departments that have a Manual, Guideline, or Document with Requirements to Abandon a Utility or Place it Out of Service.

Project owners were asked whether their department has established guidelines for coordinating abandonment activities with a utility owner. Of the 55 respondents, 26 responded affirmatively, 9 responded negatively, and 20 were unsure (Figure 15).
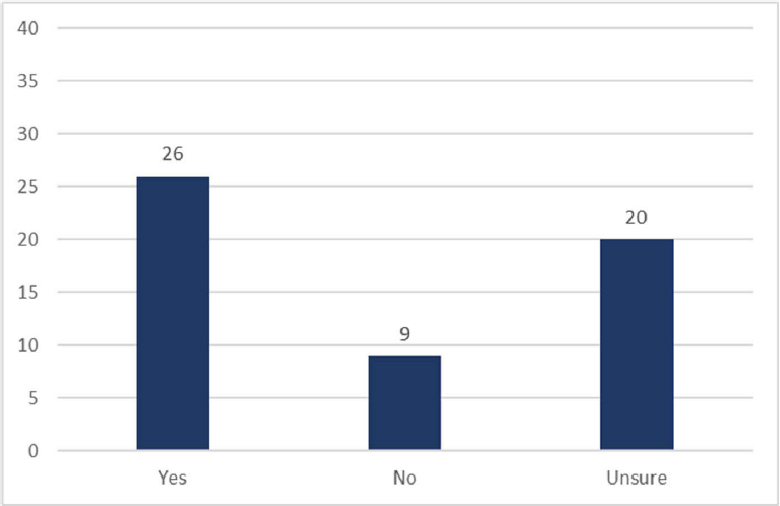
The x-axis lists three categories: Yes, No, and Unsure. The y-axis shows the number of respondents ranging from 0 to 40 in increments of 5. The data given in the bar graph are as follows: Yes: 26, No: 9, and Unsure: 20. The values are accurate.
Figure 15. Departments that have an Established Guideline or Procedure for Coordinating Abandonment Activities with a Utility Owner.
Suggested Citation: "4 Survey Results." National Academies of Sciences, Engineering, and Medicine. 2026. Developing a Guide to Manage Out-of-Service Utility Facilities. Washington, DC: The National Academies Press. doi: 10.17226/29497.

The 26 participants who responded affirmatively were asked to describe the guidelines further; Appendix B summarizes these responses. Several respondents pointed to state DOT manuals that provide guidance for managing utilities in state right-of-way, including both active and OOS utilities. Others responded that guidelines for coordinating abandonment procedures are only described at a cursory level; details are left to a utility coordinator or project manager.

Project owners were asked whether their department collaborates or coordinates with other government agencies or stakeholders when managing OOS utilities. Of the 55 project owners who responded, 25 responded affirmatively, 16 responded negatively, and 14 were unsure (Figure 16).

Among possible collaborators, respondents mentioned the One Call system, counties and municipalities, contractors (if the OOS utility is found during construction), and state agencies such as public utility commissions (PUCs) and environmental agencies. The most frequently mentioned response was local government agencies. Discussions often involve multiple agencies when utility projects involve more than one right-of-way owner with different rules for placing utilities out of service. Ideally, the utility owner conveys these differences in policies among multiple right-of-way owners because not all agencies have as strict of rules to place utilities out of service as the DOTs.
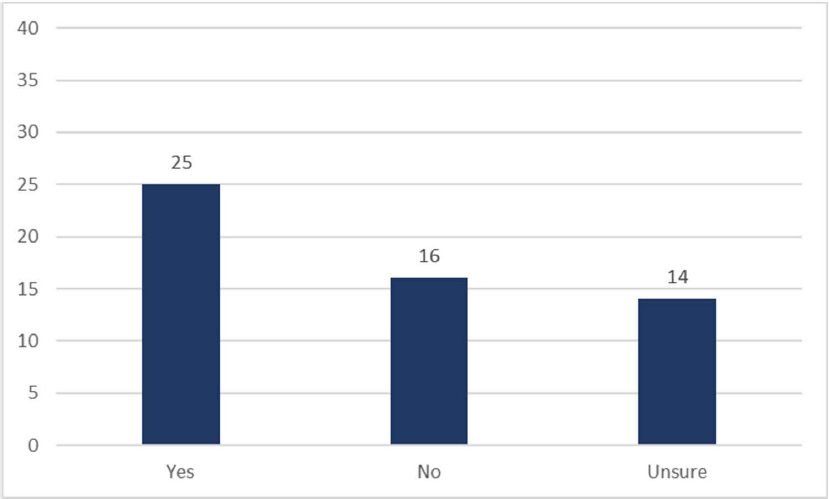
The x-axis lists three categories: Yes, No, and Unsure. The y-axis shows the number of respondents ranging from 0 to 40 in increments of 5. The data given in the bar graph are as follows: Yes: 25, No: 16, and Unsure: 14. The values are accurate.
Figure 16. Departments that Collaborate or Coordinate with Other Government Agencies or Stakeholders when Managing OOS Utilities.
Suggested Citation: "4 Survey Results." National Academies of Sciences, Engineering, and Medicine. 2026. Developing a Guide to Manage Out-of-Service Utility Facilities. Washington, DC: The National Academies Press. doi: 10.17226/29497.

Identification of OOS Utilities

Researchers asked project owners how OOS utilities are found and identified during a highway project. To get a more granular response, researchers requested responses based on three major phases of a highway project: the planning phase, the design phase, and the construction phase. Appendix B summarizes these responses.

Planning Phase

For the planning phase, project owners mentioned a review of available utility data, in coordination with utility owners. This data might include utility maps provided as portable document format files or geographic information system (GIS) files, old permit records, and markups of design files from utility owners. Less frequently, project owners mentioned activities to collect and manage the data that included field visits or advanced utility inspections, utility matrices, and information requests to the One Call system. One Call, however, typically does not maintain information about OOS utilities. Respondents also mentioned conducting topographic surveys, potholing, and SUE investigations, which might indicate the presence of otherwise unknown utilities. A few responses mentioned that institutional knowledge—otherwise undocumented—is an important source of information about OOS utilities. Alarmingly, some responses—such as simply notifying utility owners of upcoming work and/or ignoring the issue during the planning phase of a highway project—fell clearly short of the necessary work required to identify OOS utilities.

Design Phase

For the design phase, the 41 project owners who responded frequently mentioned utility coordination meetings, the One Call system, preliminary surveys, site visits, and SUE investigations. A few respondents acknowledged that OOS utilities might only occasionally be found while conducting SUE investigations. For example, an aboveground utility feature not owned by any of the utilities involved in the utility coordination process might indicate an OOS utility. Some respondents indicated that it is the utility owner’s responsibility to identify OOS utilities during project coordination meetings. Several respondents indicated few differences in the efforts to identify OOS utilities between the planning and design phases of a project.

Construction Phase

The 45 project owners who responded frequently mentioned that—in the construction phase—OOS utilities are often accidentally found during excavation activities. Several respondents noted that OOS utilities might not be marked by the One Call system or otherwise included in project plans. In other cases, OOS utilities are included in plans but incorrectly marked in the field. Some respondents noted that OOS utilities found during construction almost always create issues. One such issue is determining if the utility is in fact an OOS utility, which needs to be confirmed by the utility owner. Resolving this issue and determining how to proceed might take days or weeks.

The research team asked project owners whether their department uses any specific technologies or tools to aid in the identification of OOS utilities. Of the 54 project owners who responded, 13 responded affirmatively, 27 responded negatively, and 14 were unsure (Figure 17).

Suggested Citation: "4 Survey Results." National Academies of Sciences, Engineering, and Medicine. 2026. Developing a Guide to Manage Out-of-Service Utility Facilities. Washington, DC: The National Academies Press. doi: 10.17226/29497.
The x-axis lists three categories: Yes, No, and Unsure. The y-axis shows the number of respondents ranging from 0 to 40 in increments of 5. The data given in the bar graph are as follows: Yes: 13, No: 27, and Unsure: 14. The values are accurate.
Figure 17. Departments that Use Specific Technologies or Tools to Identify OOS Utilities.

The 13 participants responding affirmatively were asked to describe the technologies or tools used to aid in identifying OOS utilities. The 12 participants who responded provided examples such as One Call locates, test holes, potholing, and, most frequently, SUE investigations.

Assessment of Risks Associated with OOS Utilities

Researchers asked project owners whether their department has a procedure for identifying and assessing risks associated with OOS utilities. Of the 54 project owners who responded, 9 responded affirmatively, 25 responded negatively, and 20 were unsure (Figure 18).
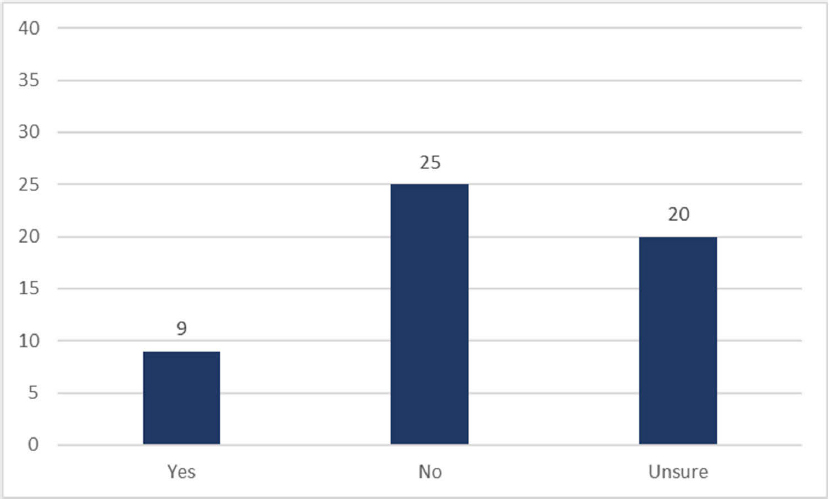
The x-axis lists three categories: Yes, No, and Unsure. The y-axis shows the number of respondents ranging from 0 to 40 in increments of 5. The data given in the bar graph are as follows: Yes: 9, No: 25, and Unsure: 20. The values are accurate.
Figure 18. Departments that have a Procedure for Risk Identification and Assessment for OOS Utilities.
Suggested Citation: "4 Survey Results." National Academies of Sciences, Engineering, and Medicine. 2026. Developing a Guide to Manage Out-of-Service Utility Facilities. Washington, DC: The National Academies Press. doi: 10.17226/29497.

The nine participants responding affirmatively were asked to describe their department’s procedure for the identification and assessment of risks associated with OOS utilities. The 8 participants who responded referenced the state utility manual, use of a utility conflict matrix to track utility conflict information, field meetings with utilities, One Call location information, and SUE investigations.

Researchers asked project owners whether their department has a dedicated team or personnel responsible for addressing OOS utilities. Of the 54 project owners who responded, 24 responded affirmatively, 22 responded negatively, and eight were unsure (Figure 19).

The 24 participants responding affirmatively were asked to describe their department’s dedicated team or personnel responsible for addressing OOS utilities. The 21 participants who responded mainly highlighted the work of utility coordinators or the utility section at the state DOT’s district, noting that the identification of OOS utilities is part of their regular duties. While utility coordinators or right-of-way utility agents are typically responsible for managing OOS utilities, some states have utility engineers assigned for that purpose. Overall, it appeared that the management of OOS utilities is the responsibility of utility coordinators or utility sections at state DOTs in most states.
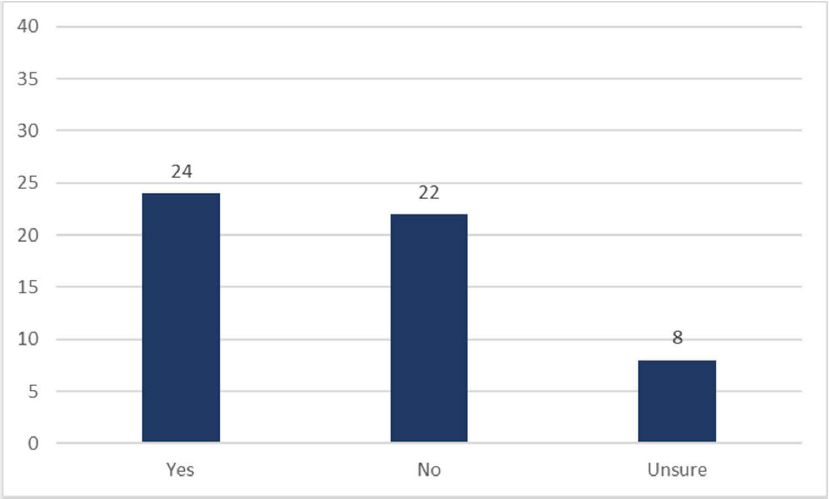
The x-axis lists three categories: Yes, No, and Unsure. The y-axis shows the number of respondents ranging from 0 to 40 in increments of 5. The data given in the bar graph are as follows: Yes: 24, No: 22, and Unsure: 8. The values are accurate.
Figure 19. Departments that have a Dedicated Team or Personnel Responsible for Addressing OOS Utilities.

Management of OOS Utilities

Researchers asked project owners how they manage an OOS utility that is found during a highway project. To get a more granular response, researchers requested responses based on three major phases of a highway project: the planning phase, the design phase, and the construction phase. Appendix B summarizes the full responses to this question.

Suggested Citation: "4 Survey Results." National Academies of Sciences, Engineering, and Medicine. 2026. Developing a Guide to Manage Out-of-Service Utility Facilities. Washington, DC: The National Academies Press. doi: 10.17226/29497.
Planning Phase

For the planning phase, the 32 project owners who responded frequently outlined a process in which the utility coordinator contacts the utility owner, verifies the OOS status of the utility, and determines a strategy to remove or relocate the utility. Some respondents noted that their department has a policy of first avoiding the utility altogether. If avoidance is not possible, their second option is to minimize the conflict by redesigning the highway project. If a redesign is not feasible, the third option is to accommodate the utility relocation. Other respondents simply focused on efforts to relocate the OOS utility. In addition, several respondents mentioned that—at this stage in the project process—it does not matter much if the utility is active or out of service. For others, dealing with an OOS utility at this stage in the process was a rare event and probably too early to take any action.

Design Phase

For the design phase, the responses provided by the 34 project owners were similar to those responses provided in the planning phase. A few project owners stressed that avoidance of utility conflicts at this stage in the project process could be feasible and should be evaluated. If work to relocate the utility was initiated in the planning phase, now would be the time to confirm that the utilities have been relocated and to get as-built information from the utility companies.

Construction Phase

For the construction phase, the 41 project owners who responded mentioned strategies such as coordinating with utility companies for the relocation of OOS utilities and confirming abandonment. Respondents reiterated the need for confirming ownership, scheduling conflict resolutions, and coordinating with various stakeholders. Respondents also highlighted the need for ongoing coordination with contractors to mitigate risks, a thorough researching of old permits, and involvement of the district utility coordinator; responsibilities for pipeline cutting, purging, and capping are assigned to utility owners. Respondents mentioned the need for an efficient management process that involves engagement with the utility company, documentation, escalation, and, if necessary, legal action when issues arise with an unresponsive utility company.

The research team asked project owners how they manage OOS utilities outside of an active highway construction project. The 37 project owners who responded indicated that this task is typically assigned to a maintenance group at the DOT. Procedures to manage an OOS utility outside of an active highway construction project are often similar to those procedures applied in the planning phase of a highway project, when a lot more time is available to find a solution and a lot less pressure exists to act. Some project owners allow abandonment if feasible and if right-of-way space is available for other utilities. Some respondents noted that the same process is used both for OOS utilities and new utility installations in the permitting process. However, permitting systems might be set up for new utility installations, so some of the information about OOS utilities, such as active status, might not be captured.

Suggested Citation: "4 Survey Results." National Academies of Sciences, Engineering, and Medicine. 2026. Developing a Guide to Manage Out-of-Service Utility Facilities. Washington, DC: The National Academies Press. doi: 10.17226/29497.
Tools and Procedures to Manage OOS Utilities

The research team asked project owners whether their department uses any tools or procedures to track the status of OOS utilities. Of the 52 project owners who responded, 10 responded affirmatively, 27 responded negatively, and 15 were unsure (Figure 20).
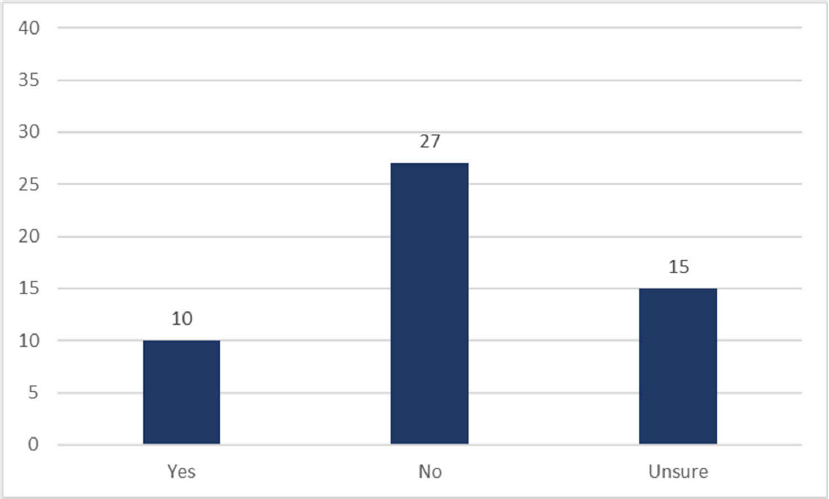
The x-axis lists three categories: Yes, No, and Unsure. The y-axis shows the number of respondents ranging from 0 to 40 in increments of 5. The data given in the bar graph are as follows: Yes: 10, No: 27, and Unsure: 15. The values are accurate.
Figure 20. Departments that Use Tools or Procedures to Track the Status of OOS Utilities.

The 10 participants responding affirmatively were asked to describe the tools or procedures their department uses to track the status of OOS utilities. The nine project owners who responded mentioned tools such as a utility permit database, workflow software, utility conflict matrix, data from SUE investigations, and GIS database systems. One respondent noted that OOS utilities that remain in the right-of-way also remain permitted; therefore, permit information is available when a new project is started in that area. One respondent mentioned CityWorks—a software package linked to an Oracle Primavera database—that allows the DOT to create reports about utilities in areas of interest. One respondent mentioned that utility owners have increased privacy concerns about their data and are increasingly requesting nondisclosure agreements (NDAs) before providing information about their facilities in the right-of-way.

Improvements to the Process of Managing of OOS Utilities

The research team asked project owners what improvements or additional measures could be implemented to enhance the management of OOS utilities in the right-of-way. The 32 project owners who responded provided a variety of ideas for improving the OOS utility management process. Collectively, respondents highlighted improvements related to communication, documentation, technology, accountability, and legal aspects to enhance the management of utility facilities during the project development process. The research team summarized these improvements as follows:

Suggested Citation: "4 Survey Results." National Academies of Sciences, Engineering, and Medicine. 2026. Developing a Guide to Manage Out-of-Service Utility Facilities. Washington, DC: The National Academies Press. doi: 10.17226/29497.
  • Communication and coordination.
    • Maintain a solid working relationship with utilities for effective communication.
    • Incorporate owner and location information in local and state GIS.
    • Incorporate utility coordination in planning, design, and construction phases.
  • Documentation and recordkeeping.
    • Emphasize better as-built plans by utility owners.
    • Improve data tracking, consistent management, and recordkeeping.
    • Document OOS utility location, ownership, size, material, transmittance, etc.
  • Technological improvements.
    • Capture accurate subsurface utility location data.
    • Embrace digital solutions, including GIS, digital as-builts, and tracking software.
  • Accountability and cost management.
    • Hold utilities more accountable for costs associated with their OOS facilities.
    • Establish agreements with utilities for future OOS facility cost responsibilities.
    • Incentivize improved OOS management by imposing accountability measures.
  • Legal and regulatory measures.
    • Legally require utilities to promptly complete relocations after DOT notification.
    • Revise state codes to mandate sharing of essential utility information with DOTs.

Frequency of OOS Utility Types

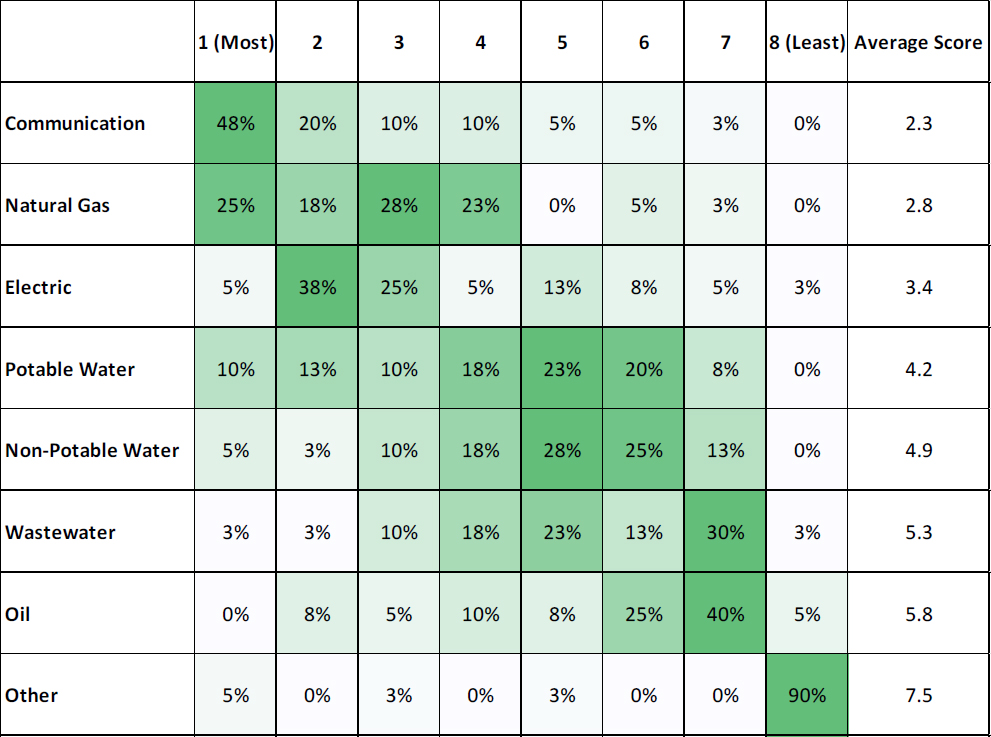
The research team asked project owners how frequently certain types of utility facilities are placed out of service by their department. Survey participants were presented with a list of eight types of utilities—communication, electric, natural gas, non-potable water, oil, potable water, wastewater, and other—and were asked to rank them from most frequent to least frequent.

In total, 40 project owners responded, providing 320 responses—one response per respondent and utility type. Figure 21 provides an overview of the responses, ranked by the average score (last column). Darker shades of green indicate higher percentage values for a utility type and ranking. For each utility type, a percentage was calculated for each frequency ranking by dividing the number of responses for that ranking by the total number of responses for that utility type. For example, 19 of 40 or 48 percent of project owners ranked communication utilities as most frequently out of service. An average ranking score was calculated for each utility type by multiplying the percentage values by the frequency rankings, summing these values, and dividing by the number of responses. Thus, an average score of 1.0 would mean that all survey respondents had given that utility type a frequency ranking of 1.
Suggested Citation: "4 Survey Results." National Academies of Sciences, Engineering, and Medicine. 2026. Developing a Guide to Manage Out-of-Service Utility Facilities. Washington, DC: The National Academies Press. doi: 10.17226/29497.
The column headers of the data table are blank, 1 (most), 2, 3, 4, 5, 6, 7, 8 (least), and Average Score. The data given in the table row-wise are as follows: Row 1: Communication: 48 percent, 20 percent, 10 percent, 10 percent, 5 percent, 5 percent, 3 percent, 0 percent, 2.3. Row 2: Natural gas: 25 percent, 18 percent, 28 percent, 23 percent, 0 percent, 5 percent, 3 percent, 0 percent, 2.8. Row 3: Electric: 5 percent, 38 percent, 25 percent, 5 percent, 13 percent, 8 percent, 5 percent, 3 percent, 3.4. Row 4: Potable water: 10 percent, 13 percent, 10 percent, 18 percent, 23 percent, 20 percent, 8 percent, 0 percent, 4.2. Row 5: Nonpotable water: 5 percent, 3 percent, 10 percent, 18 percent, 28 percent, 25 percent, 13 percent, 0 percent, 4.9. Row 6: Wastewater: 3 percent, 3 percent, 10 percent, 18 percent, 23 percent, 13 percent, 30 percent, 3 percent, 5.3. Row 7: Oil: 0 percent, 8 percent, 5 percent, 10 percent, 8 percent, 25 percent, 40 percent, 5 percent, 5.8. Row 8: Other: 5 percent, 0 percent, 3 percent, 0 percent, 3 percent, 0 percent, 0 percent, 90 percent, 7.5.
Figure 21. Project Owner Frequency of Utility Types Placed Out of Service.

Based on the responses, communication utilities were placed out of service most frequently, followed by natural gas and electric utilities. Potable water, non-potable water, and wastewater utilities were placed out of service less frequently. Oil utilities were least frequently placed out of service. Some respondents mentioned that it was difficult to rank utility types because placing utilities out of service happens infrequently.

Repurposing of OOS Utilities

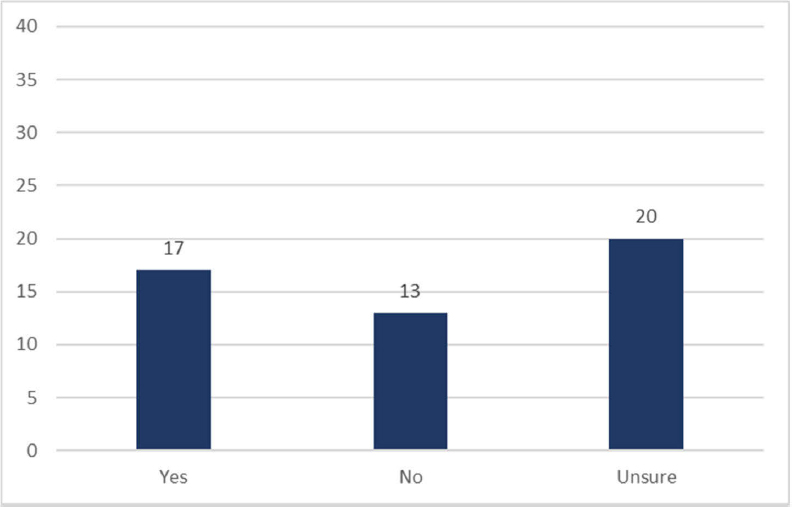
The research team asked project owners whether their department allows the repurposing of OOS utilities by other utilities (e.g., the use of abandoned lines by communication facilities). Of the 50 project owners who responded, 17 responded affirmatively, 13 responded negatively, and 20 were unsure (Figure 22).

The 17 participants responding affirmatively were asked to further describe their department’s experience with repurposing OOS utilities as other facilities. The 14 project owners who responded provided the following examples of repurposing:

  • Communication utilities using conduits from electric or other communication utilities.
  • Repurposing of electrical conduit for other utility types.
  • Repurposing of old water mains for communication utilities.
  • Communication utilities placing fiber inside old OOS natural gas lines.
Suggested Citation: "4 Survey Results." National Academies of Sciences, Engineering, and Medicine. 2026. Developing a Guide to Manage Out-of-Service Utility Facilities. Washington, DC: The National Academies Press. doi: 10.17226/29497.
The x-axis lists three categories: Yes, No, and Unsure. The y-axis shows the number of respondents ranging from 0 to 40 in increments of 5. The data given in the bar graph are as follows: Yes: 17, No: 13, Unsure: 20. The values are accurate.
Figure 22. Departments that Allow Repurposing of OOS Utilities.

One project owner mentioned that, if the ownership of an OOS utility cannot be determined, the DOT can take ownership of the conduits for its own various purposes. Project owners also mentioned that, if a utility is repurposed, the original owner might have to transfer ownership and responsibilities for mapping and data management to the repurposing utility. This process might require a new permit from the DOT. Other respondents mentioned that repurposing is a rare event; they have not yet been approached by any interested utilities but would allow it.

Preventing Unauthorized OOS Utilities

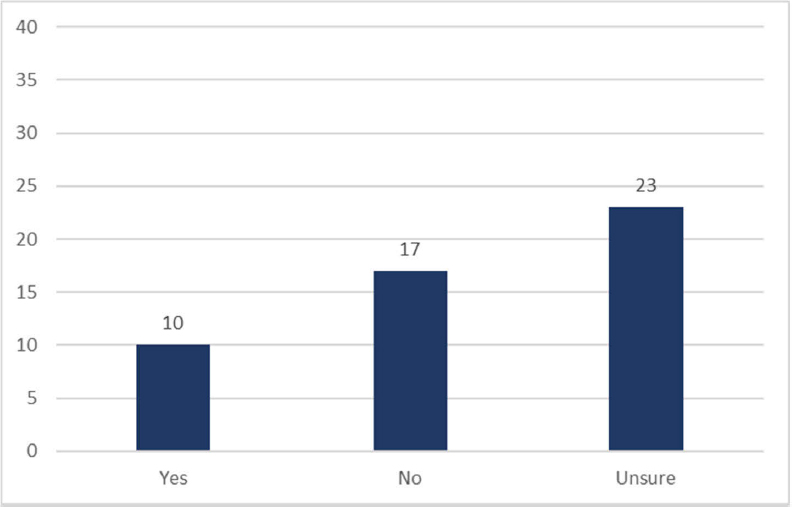
The research team asked project owners whether their department has a practice or policy for preventing unauthorized abandonment of utilities in the right-of-way, including fines, permit restrictions, or other. Of the 50 project owners who responded, 10 responded affirmatively, 17 responded negatively, and 23 were unsure (Figure 23).

The 17 participants responding affirmatively were asked to further describe their department’s practice or policy for preventing unauthorized abandonment of utilities in the right-of-way. The nine project owners who responded mentioned that penalties can be applied to utilities that do not follow the rules specified as part of the agency’s utility accommodation rules; however, this authority is not often exercised. An effective way to achieve compliance with utility owners is to restrict future permits for as long as the utility is not in compliance with current accommodation rules.
Suggested Citation: "4 Survey Results." National Academies of Sciences, Engineering, and Medicine. 2026. Developing a Guide to Manage Out-of-Service Utility Facilities. Washington, DC: The National Academies Press. doi: 10.17226/29497.
The x-axis lists three categories: Yes, No, and Unsure. The y-axis shows the number of respondents ranging from 0 to 40 in increments of 5. The data given in the bar graph are as follows: Yes: 10, No: 17, Unsure: 23. The values are accurate.
Figure 23. Departments that have a Practice or Policy for Preventing Unauthorized Abandonment of Utilities.

Need for Federal Legislative Changes

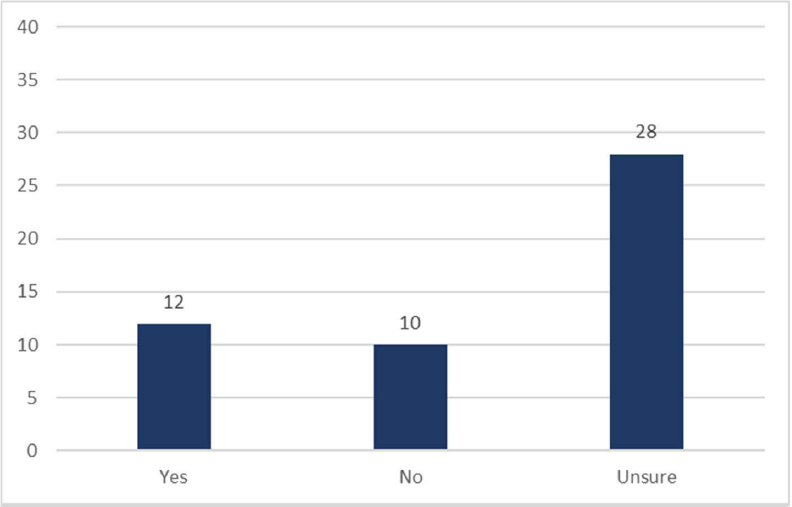
The research team asked project owners whether there is a need to update or modify federal laws or regulations to improve management of OOS utilities in the public right-of-way. Of the 50 project owners who responded, 12 responded affirmatively, 10 responded negatively, and 28 were unsure (Figure 22).

The 12 participants responding affirmatively were asked to further describe how federal laws or regulations should be updated to improve the management of OOS utilities in the public right-of-way. The nine project owners who responded suggested that agencies should have the authority to fine utilities for not promptly removing or identifying lines and to charge delay claims for incorrect or incomplete information. Issues with OOS utilities could be avoided by mandating the removal of old or unused underground lines. Similarly, retired in-place lines should be entirely removed from sites. Project owners also highlighted the importance of mandates and fines, particularly to encourage accurate data sharing between utility owners and state DOTs. Strengthening requirements and consequences could potentially attract federal funding for states to update their mapping and tracking of OOS utilities, thereby reducing delays during construction projects. However, project owners acknowledged the complexities of dealing with utility owners, stressing the importance of finding a balanced approach in regulations that considers timeliness, costs, and the ability of utilities to recover approved relocation costs.
Suggested Citation: "4 Survey Results." National Academies of Sciences, Engineering, and Medicine. 2026. Developing a Guide to Manage Out-of-Service Utility Facilities. Washington, DC: The National Academies Press. doi: 10.17226/29497.
The x-axis lists three categories: Yes, No, and Unsure. The y-axis shows the number of respondents ranging from 0 to 40 in increments of 5. The data given in the bar graph are as follows: Yes: 12, No: 10, Unsure: 28. The values are accurate.
Figure 24. Need to Update or Modify Federal Laws or Regulations to Improve Management of OOS Utilities in the Public Right-of-Way.

Contractor and Consultant Perspectives

The research team specifically solicited responses from contractors and consultants during the administration of the survey. However, given that the response rates were so low—just 3 percent for contractors and 1 percent for consultants—the results throughout this section also include responses from participants who identified as other stakeholders. Participants in the other category had a 7 percent response rate and included members of utility damage notification centers, hazardous liquid pipeline operators, and damage prevention professionals who may have similar viewpoints. Results in this section are based on potential responses from 11 total survey respondents.

Situations Addressed in Daily Duties

The research team asked contractors and consultants how often they address situations that may arise when dealing with OOS utilities. The research team provided the following six situations and asked participants to indicate their frequency using never, rarely, sometimes, often, or always:

  • Change a design/construction procedure due to OOS utilities found during construction.
  • Delay some tasks due to OOS utilities found during construction.
  • Find a mislocated OOS utility during construction.
  • Find an unreported OOS utility during construction.
  • Manage/remove an OOS utility within the project limits.
  • Request a change order from the project owner to manage/remove an OOS utility.

Figure 25 provides an overview of the responses, ranked by how frequently contractors and consultants addressed these situations in their daily duties. Overall, these respondents indicated

Suggested Citation: "4 Survey Results." National Academies of Sciences, Engineering, and Medicine. 2026. Developing a Guide to Manage Out-of-Service Utility Facilities. Washington, DC: The National Academies Press. doi: 10.17226/29497.

having dealt with each of these situations at least once. Nearly half (44 percent) of the contractors and consultants reported often or always changing a design or construction procedure due to OOS utilities found during construction. One-third (33 percent) of these participants reported often or always delaying some tasks due to OOS utilities found during construction. Nearly half (44 percent) of the contractors and consultants reported often or always requesting a change order from the project owner to manage/remove an OOS utility.
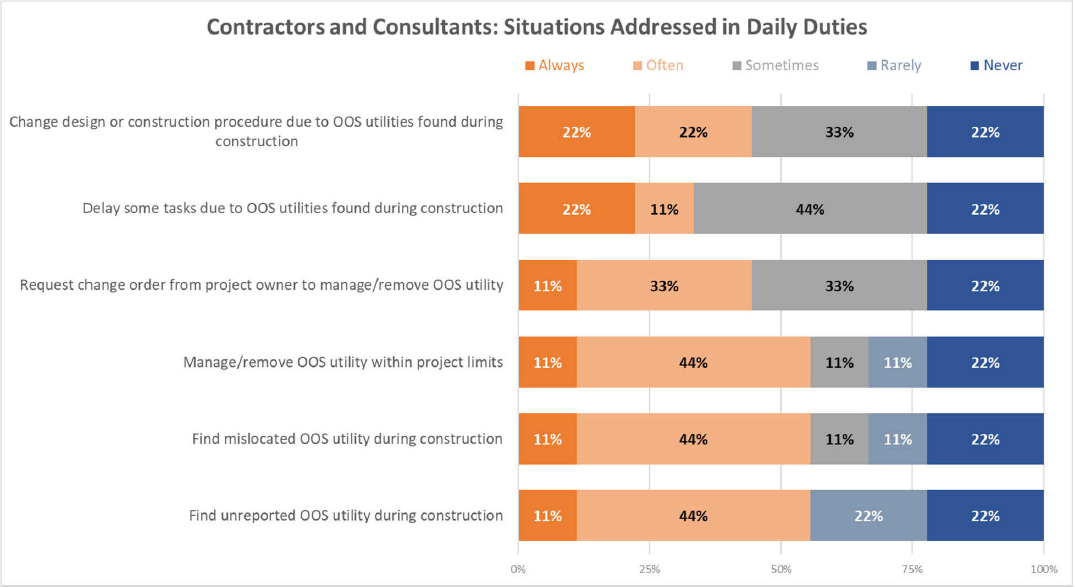
The x-axis shows percentages from 0 percent to 100 percent in increments of 25. The y-axis includes, from top to bottom, change design or construction procedure due to O O S utilities found during construction, delay some tasks due to O O S utilities found during construction, request change order from project owner to manage or remove O O S utility, manage or remove O O S utility within project limits, find mislocated O O S utility during construction, and find unreported O O S utility during construction. Dark orange indicates always, light orange indicates often, gray indicates sometimes, light blue indicates rarely, and dark blue indicates never. The data given in the bar graph are as follows: Change design or construction procedure due to O O S utilities found during construction: Always: 22 percent, often: 22 percent, sometimes: 33 percent, never: 22 percent. Delay some tasks due to O O S utilities found during construction: Always: 22 percent, often: 11 percent, sometimes: 44 percent, never: 22 percent. Request change order from project owner to manage or remove O O S utility: Always: 11 percent, often: 33 percent, sometimes: 33 percent, never: 22 percent. Manage or remove O O S utility within project limits: Always: 11 percent, often: 44 percent, sometimes: 11 percent, rarely: 11 percent, never: 22 percent. Find mislocated O O S utility during construction: Always: 11 percent, often: 44 percent, sometimes: 11 percent, rarely: 11 percent, never: 22 percent. Find unreported O O S utility during construction: Always: 11 percent, often: 44 percent, rarely: 22 percent, never: 22 percent. The number of respondents is 9, and the values are accurate.
Figure 25. Contractors and Consultants: Situations Addressed in Daily Duties (9 Respondents).

Challenges Managing OOS Utilities

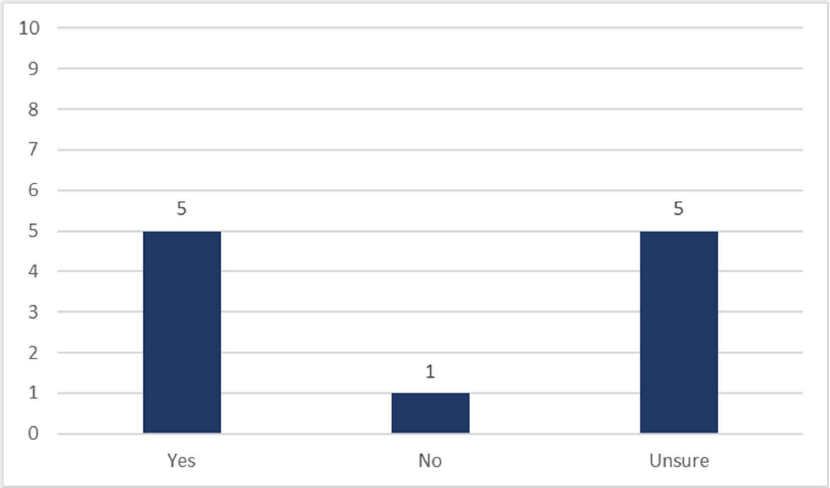
Survey respondents who identified as contractors, consultants, or other types of stakeholders were asked whether they have experienced constructability or other issues when finding OOS utilities within the project limits of a highway project. Appendix B summarizes these responses. Of the 11 respondents, 5 responded affirmatively, 1 responded negatively, and five were unsure (Figure 26).

The five participants responding affirmatively were asked to further describe the constructability or other issues experienced when finding OOS utilities within the project limits of a highway project. The three participants who responded noted that issues with OOS utilities during the construction phase of a project could have been mitigated during the planning and design phases of the project. This assertion might point to a lack of education or understanding about available technologies to detect OOS utilities by the design engineer in charge of project design.
Suggested Citation: "4 Survey Results." National Academies of Sciences, Engineering, and Medicine. 2026. Developing a Guide to Manage Out-of-Service Utility Facilities. Washington, DC: The National Academies Press. doi: 10.17226/29497.
The x-axis lists three categories: Yes, No, and Unsure. The y-axis shows the number of respondents ranging from 0 to 10 in increments of 1. The data given in the bar graph are as follows: Yes: 5, No: 1, Unsure: 5. The values are accurate.
Figure 26. Contractors and Consultants Who Experienced Constructability or Other Issues with OOS Utilities During a Highway Project.

Experience with Removal of OOS Utilities

Contractors and consultants were asked if they have experienced issues with the removal of OOS utilities during highway project construction. Of the 11 respondents, 4 responded affirmatively, 3 responded negatively, and four were unsure (Figure 27).
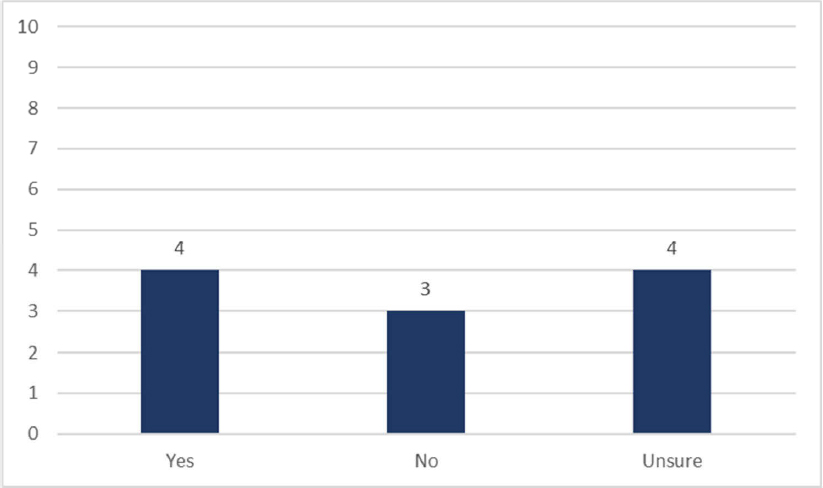
The x-axis lists three categories: Yes, No, and Unsure. The y-axis shows the number of respondents ranging from 0 to 10 in increments of 1. The data given in the bar graph are as follows: Yes: 4, No: 3, Unsure: 4. The values are accurate.
Figure 27. Contractors and Consultants Who Experienced Issues with Removal of OOS Utilities During Highway Construction.
Suggested Citation: "4 Survey Results." National Academies of Sciences, Engineering, and Medicine. 2026. Developing a Guide to Manage Out-of-Service Utility Facilities. Washington, DC: The National Academies Press. doi: 10.17226/29497.

The four participants responding affirmatively were asked to further describe the issues they experienced with the removal of OOS utilities during highway project construction. The 3 participants who responded noted, for example, that issues with removal are common when multiple owners of utility facilities are using the same pole or conduit.

Strategies to Manage and Resolve OOS Utilities

Contractors and consultants were asked what successful strategies or practices are used to manage and resolve issues related to OOS utilities. Noteworthy responses from the 7 participants who responded include the following:

  • Allow contractors to remove, cut, bypass, or take whatever actions are needed to avoid project delays if the One Call system cannot determine an owner or a third party.
  • Encourage project owners to require a separate contract to move/relocate all remaining utilities prior to issuing the main contract.
  • Encourage early engagement with all stakeholders during project planning and design phases to identify, prioritize, and manage risk factors.
  • Develop partnerships with utility entities in the early project phases to improve project coordination.
  • Perform SUE investigations during project planning and design phases to find OOS utilities.
  • Consider new approaches to finding OOS utilities, such as combining PUC record searches, satellite imagery, and artificial intelligence (AI) to find trench lines.

The research team asked contractors and consultants what improvements or additional measures could be implemented to enhance the management of OOS utilities in the right-of-way. Noteworthy responses from the six participants who responded include the following:

  • Use SUE and ground penetration radar in the right-of-way.
  • Involve right-of-way and utility groups during project predesign and preconstruction phases.
  • Use online utility coordination tools like Coordinate PA in Pennsylvania in other states.
  • Encourage coordination, collaboration, communication, and cooperation by all stakeholders on every project.
  • Allow fewer instances of placing utilities out of service.

Identification of OOS Utilities

Contractors and consultants were asked how OOS utilities are found during a highway project. The seven participants who responded highlighted the use of One Call systems, the use of SUE and ground-penetrating radar (GPR) technology, and coordination with utility owners to obtain utility records. Other participants noted that OOS utilities are mostly found during digging or excavation activities on a project.

Suggested Citation: "4 Survey Results." National Academies of Sciences, Engineering, and Medicine. 2026. Developing a Guide to Manage Out-of-Service Utility Facilities. Washington, DC: The National Academies Press. doi: 10.17226/29497.

Contractors and consultants were asked whether any specific technologies, practices, or tools are used by their respective companies to aid in the identification and management of OOS utilities. Of the ten participants who responded, six responded affirmatively, two responded negatively, and two were unsure (Figure 28).
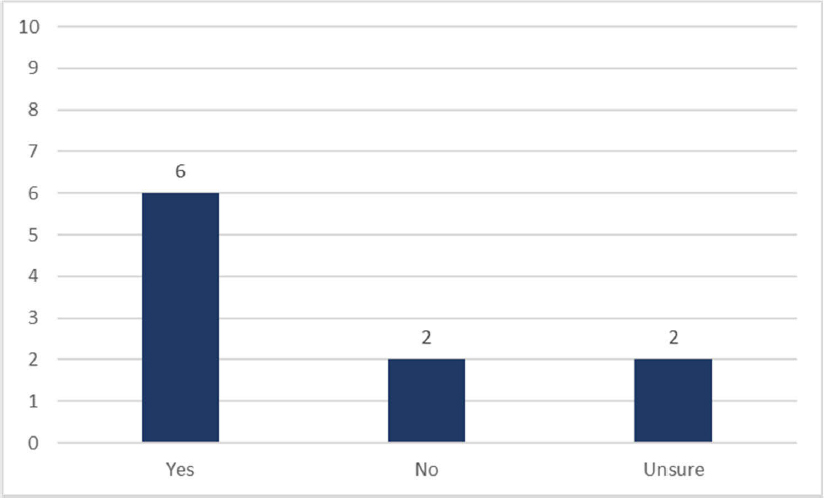
The x-axis lists three categories: Yes, No, and Unsure. The y-axis shows the number of respondents ranging from 0 to 10 in increments of 1. The data given in the bar graph are as follows: Yes: 6, No: 2, Unsure: 2. The values are accurate.
Figure 28. Contractors and Consultants Who Use Technologies or Tools to Identify and Manage OOS Utilities.

The six participants responding affirmatively were asked to further describe the technologies, practices, or tools used by their companies to aid in the identification and management of OOS utilities. The six participants who responded reported using SUE investigations, nondestructive excavation techniques, tools that combine satellite imagery with AI technology, information from utility owners, and information from utility permits.

Contractors and consultants were asked how they deal with an OOS utility that is found during a highway project. The six participants who responded mentioned applying avoid/minimize/mitigate strategies; simply removing, cutting, or bypassing the OOS utility; investigating potential utility ownership; and coordinating with relevant stakeholders, including the contractor.

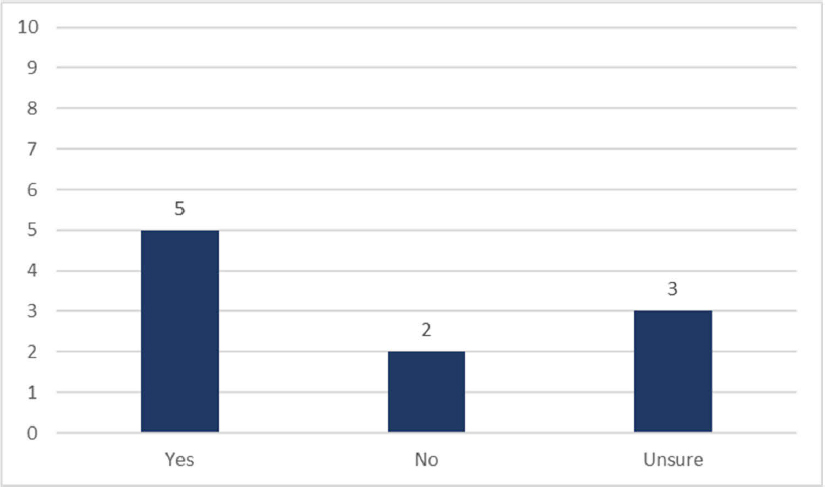
Contractors and consultants were asked whether their companies use a standard or symbology to depict OOS utilities in plans. Of the 10 participants who responded, five responded affirmatively, two responded negatively, and three were unsure (Figure 29).
Suggested Citation: "4 Survey Results." National Academies of Sciences, Engineering, and Medicine. 2026. Developing a Guide to Manage Out-of-Service Utility Facilities. Washington, DC: The National Academies Press. doi: 10.17226/29497.
The x-axis lists three categories: Yes, No, and Unsure. The y-axis shows the number of respondents ranging from 0 to 10 in increments of 1. The data given in the bar graph are as follows: Yes: 5, No: 2, Unsure: 3. The values are accurate.
Figure 29. Contractors and Consultants Who Use a Standard or Symbology to Depict OOS Utilities in Plans.

The five participants responding affirmatively were asked to further describe the standard or symbology used by their companies to depict OOS utilities in plans. The four participants who responded noted the use of ASCE standards 38-22 and 75-22, state DOT computer-aided design (CAD) standards, and colored marker markups. One respondent mentioned the use of the Coordinate PA online service, which facilitates coordination, collaboration, and cooperation among project stakeholders and documentation of key project information. Since its inception in 2018, more than 45,000 projects have used this service. In April 2023, use of the site has become mandatory for all complex projects.

Frequency of OOS Utility Types

The research team asked contractors and consultants how frequently certain types of utility facilities are placed out of service. Survey participants were presented with a list of eight types of utilities—communication, electric, natural gas, non-potable water, oil, potable water, wastewater, and other—and were asked to rank them from most frequent to least frequent.

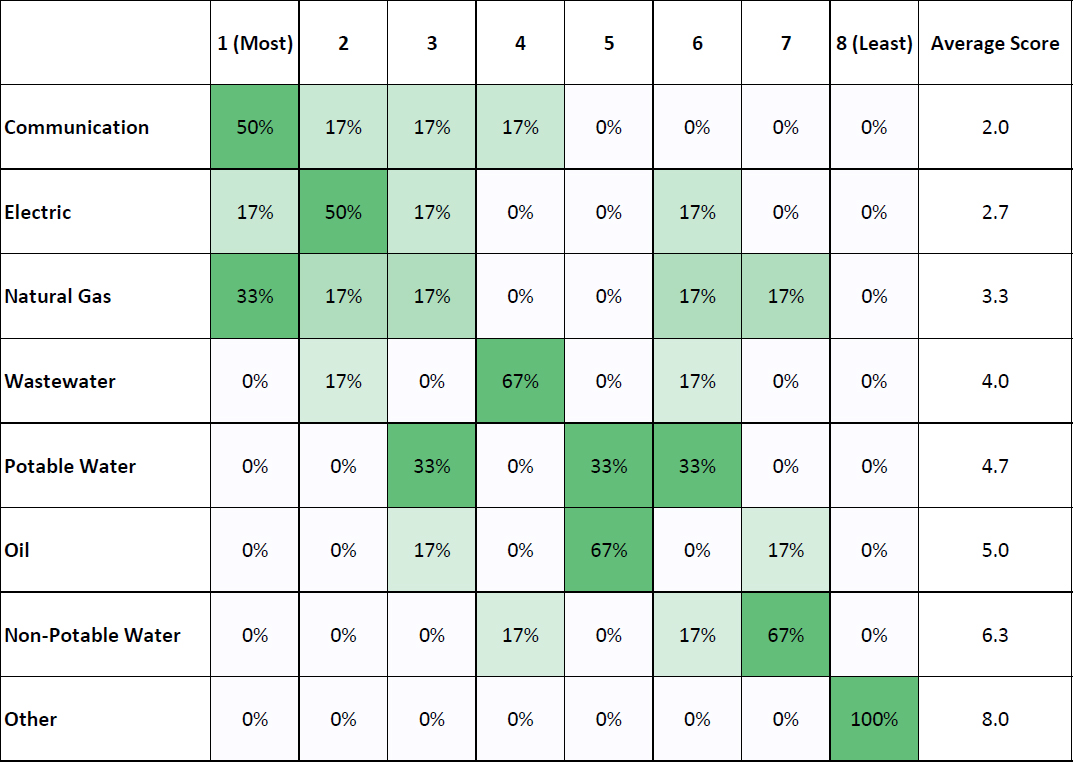
In total, six participants responded, providing 48 responses—one response per respondent and utility type. Figure 30 provides an overview of the responses. For each utility, a percentage was calculated for each frequency ranking by dividing the number of responses for that ranking by the total number of responses for that utility type. An average ranking score was calculated for each utility type by multiplying the percentage values by the frequency rankings, summing these values, and dividing by the number of responses.
Suggested Citation: "4 Survey Results." National Academies of Sciences, Engineering, and Medicine. 2026. Developing a Guide to Manage Out-of-Service Utility Facilities. Washington, DC: The National Academies Press. doi: 10.17226/29497.
The column headers of the data table are blank, 1 (most), 2, 3, 4, 5, 6, 7, 8 (least), and average score. The data given in the table row-wise are as follows: Row 1: Communication: 50 percent, 17 percent, 17 percent, 17 percent, 0 percent, 0 percent, 0 percent, 0 percent, 2.0. Row 2: Electric: 17 percent, 50 percent, 17 percent, 0 percent, 0 percent, 17 percent, 0 percent, 0 percent, 2.7. Row 3: Natural gas: 33 percent, 17 percent, 17 percent, 0 percent, 0 percent, 17 percent, 17 percent, 0 percent, 3.3. Row 4: Wastewater: 0 percent, 17 percent, 0 percent, 67 percent, 0 percent, 17 percent, 0 percent, 0 percent, 4.0. Row 5: Potable water: 0 percent, 0 percent, 33 percent, 0 percent, 33 percent, 33 percent, 0 percent, 0 percent, 4.7. Row 6: Oil: 0 percent, 0 percent, 17 percent, 0 percent, 67 percent, 0 percent, 17 percent, 0 percent, 5.0. Row 7: Non-potable water: 0 percent, 0 percent, 0 percent, 17 percent, 0 percent, 17 percent, 67 percent, 0 percent, 6.3. Row 8: Other: 0 percent, 0 percent, 0 percent, 0 percent, 0 percent, 0 percent, 0 percent, 100 percent, 8.0.
Figure 30. Contractor and Consultant Frequency of Utility Types Placed Out of Service.

Based on the responses, communication utilities were placed out of service most frequently (consistent with the project owner responses). However, contractors and consultants ranked electric utilities as the second most frequent OOS utility, followed by natural gas utilities. Project owners, by comparison, ranked the frequency of OOS electric utilities higher than the frequency of OOS natural gas utilities. Contractors and consultants ranked OOS wastewater utilities fourth, while project owners ranked OOS wastewater utilities sixth.

Repurposing of OOS Utilities

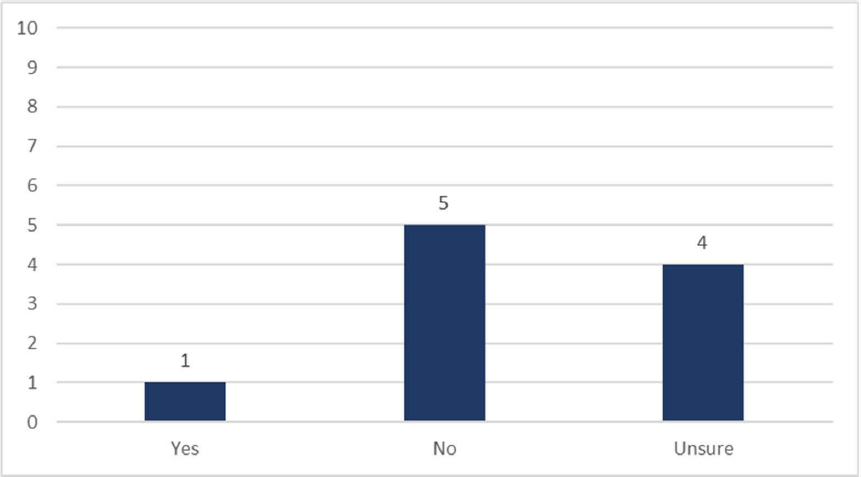
The research team asked contractors and consultants whether they have repurposed an OOS utility for use by an active utility (e.g., use of abandoned lines by communication facilities). Of the 10 participants who responded, one responded affirmatively, five responded negatively, and four were unsure (Figure 31).

The one participant responding affirmatively was asked to further describe how the OOS utility was repurposed for use by an active utility. The participant noted that no OOS utility has yet been repurposed, but that repurposing is part of their company’s policy.
Suggested Citation: "4 Survey Results." National Academies of Sciences, Engineering, and Medicine. 2026. Developing a Guide to Manage Out-of-Service Utility Facilities. Washington, DC: The National Academies Press. doi: 10.17226/29497.
The x-axis lists three categories: Yes, No, and Unsure. The y-axis shows the number of respondents ranging from 0 to 10 in increments of 1. The data given in the bar graph are as follows: Yes: 1, No: 5, Unsure: 4. The values are accurate.
Figure 31. Contractors and Consultants Who have Repurposed an OOS Utility for Use with an Active Utility.

Utility Owner Perspectives

Situations Addressed in Daily Duties

The research team asked utility owners how often they address situations that may arise when dealing with OOS utilities. The research team provided the following nine situations and asked participants indicate their frequency using never, rarely, sometimes, often, or always:

  • Conduct inspections to ascertain the status of an OOS utility in the right-of-way.
  • Find an unreported OOS utility during a utility installation.
  • Keep records of the location and attributes of the OOS utility.
  • Manage OOS utilities in the highway right-of-way.
  • Manage OOS utilities on a private easement.
  • Place a utility out of service in the highway right-of-way.
  • Receive a request to remove an OOS utility from a DOT.
  • Repurpose OOS utilities (e.g., communications duct, pipe casing, etc.).
  • Request abandonment of a utility in the highway right-of-way.

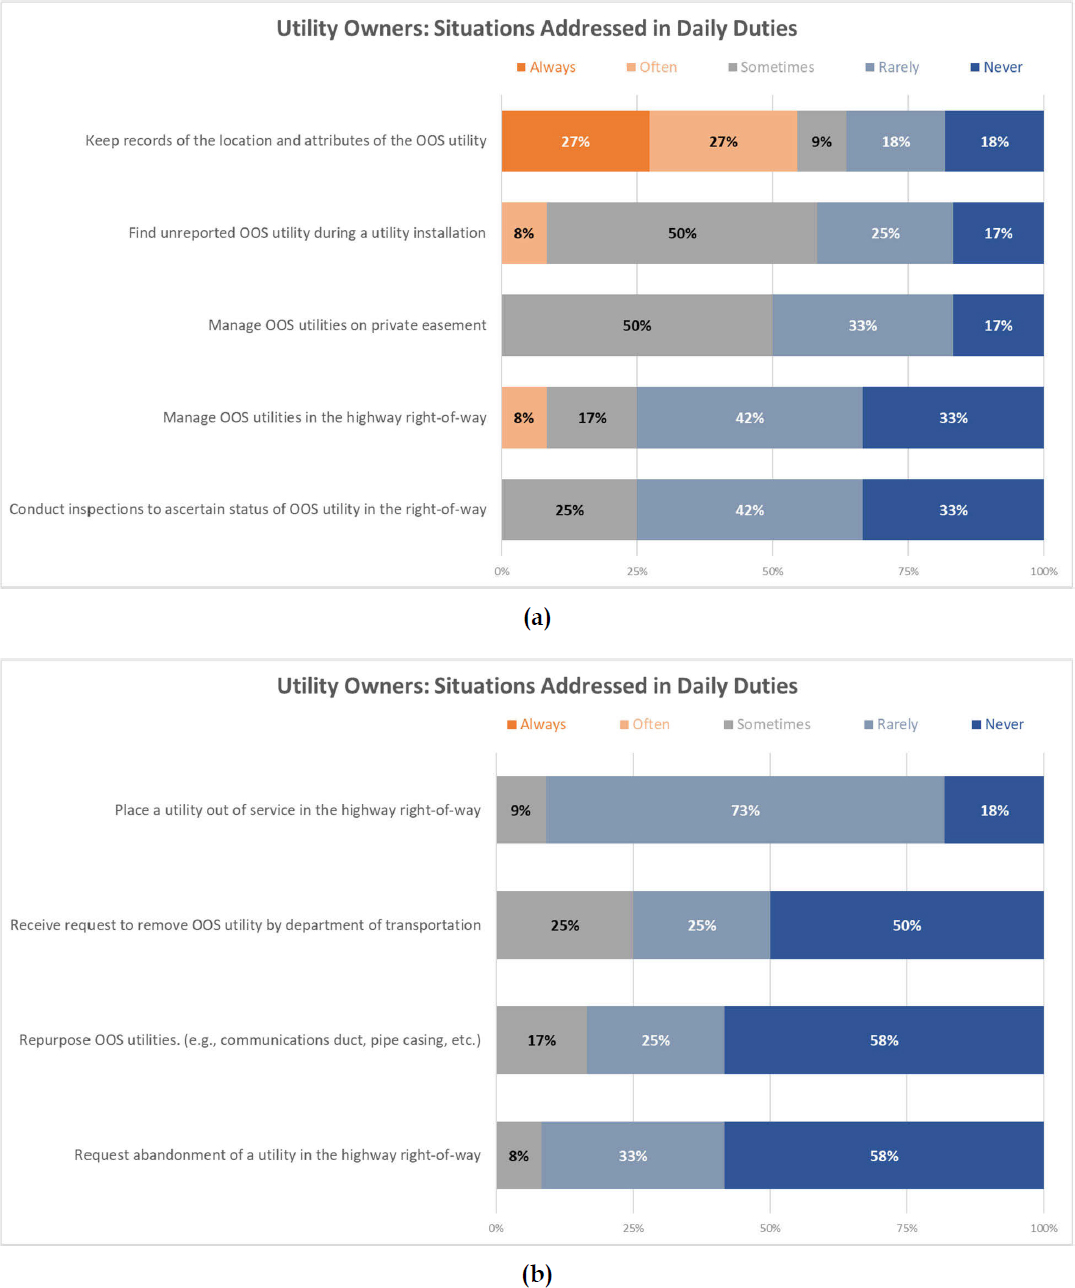
Figure 32 (a) and (b) provides an overview of the responses, ranked by how frequently utility owners address these situations in their daily duties. Overall, utility owners have rarely or never dealt with most situations, with three exceptions. Half of utility owners reported sometimes managing OOS utilities on a private easement. Half of utility owners also reported sometimes finding unreported OOS utilities during a utility installation; fewer utility owners (8 percent) reported often finding unreported OOS utilities during a utility installation. Most utility owners reported always or often keeping records of the location and attributes of the OOS utility; an additional 9 percent of utility owners reported sometimes keeping records.
Suggested Citation: "4 Survey Results." National Academies of Sciences, Engineering, and Medicine. 2026. Developing a Guide to Manage Out-of-Service Utility Facilities. Washington, DC: The National Academies Press. doi: 10.17226/29497.

Management of OOS Utilities

Utility owners were asked what regulations, policies, standards, manuals, practices, or procedure they follow to manage abandoned facilities. Eight participants responded, mentioning 49 CFR 192.727, state laws and regulations including laws mandating the use of One Call, state and federal hazardous liquid regulations and associated standards, and professional associations such as the Building Industry Consulting Service International (BICSI) and PHMSA. One respondent noted that not all state One Call systems require inclusion of OOS utilities. Other states have just recently included the requirement, so older OOS utilities might not be included in their database. Respondents also noted that construction requirements vary based on who owns the right-of-way.

Utility owners were asked what common causes or circumstances result in a utility being placed out of service. Notable responses from the nine utility owners who responded include the following:

  • Installation of a new service line.
  • Lack of use.
  • End of production at a well or closure of a refinery, eliminating the need for oil/gas transport.
  • Change in business climate (e.g., operating a pipeline becomes unprofitable).
  • Cost of upkeep or repair.
  • Poor condition of pipeline due to age or corrosive contents.
  • Poor maintenance or installation practices that cause integrity issues.
  • Nonfunctional utility facilities.

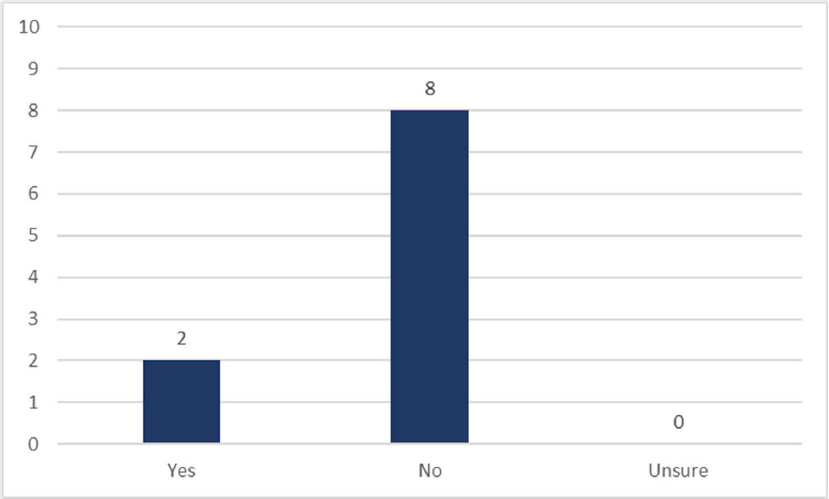
Utility owners were asked whether they have a dedicated team or personnel responsible for dealing with OOS utilities. Of the 10 utility owners who responded, two responded affirmatively and eight responded negatively (Figure 33). The utility owners who responded affirmatively mentioned that OOS utilities are the responsibility of a compliance team.
Suggested Citation: "4 Survey Results." National Academies of Sciences, Engineering, and Medicine. 2026. Developing a Guide to Manage Out-of-Service Utility Facilities. Washington, DC: The National Academies Press. doi: 10.17226/29497.
The x-axis lists three categories: Yes, No, and Unsure. The y-axis shows the number of respondents ranging from 0 to 10 in increments of 1. The data given in the bar graph are as follows: Yes: 2, No: 8, Unsure: 0. The values are accurate.
Figure 33. Utility Owners Who Have Dedicated Personnel for Dealing with OOS Utilities.

Transfer of Ownership

The research team asked utility owners whether they have transferred ownership of an OOS utility to a salvage company or any other utility owner. Of the 10 utility owners who responded, one responded affirmatively, six responded negatively, and three were unsure (Figure 34).
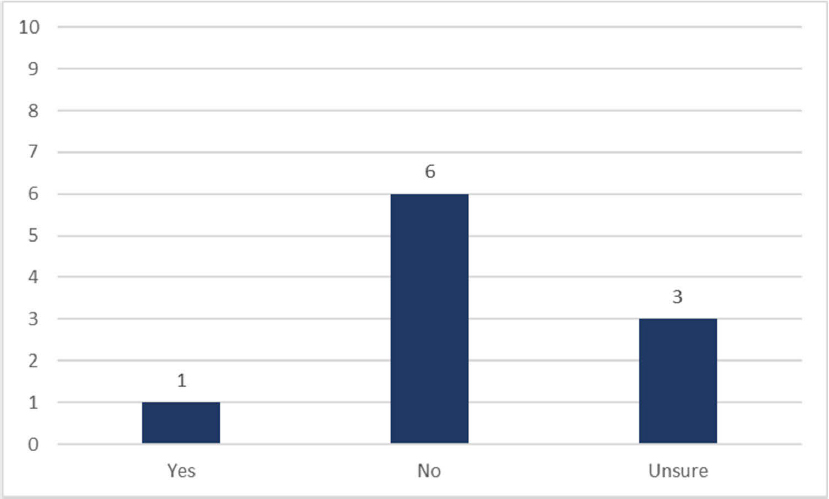
The x-axis lists three categories: Yes, No, and Unsure. The y-axis shows the number of respondents ranging from 0 to 10 in increments of 1. The data given in the bar graph are as follows: Yes: 1, No: 6, Unsure: 3. The values are accurate.
Figure 34. Utility Owners Who Have Transferred Ownership of an OOS Utility.

The one utility owner who responded affirmatively mentioned that the utility company sold an unused flow line to a company that wanted it for other purposes, allowing them to consolidate multiple production facilities.

Suggested Citation: "4 Survey Results." National Academies of Sciences, Engineering, and Medicine. 2026. Developing a Guide to Manage Out-of-Service Utility Facilities. Washington, DC: The National Academies Press. doi: 10.17226/29497.

Private Property with OOS Utilities

The research team asked utility owners whether they have ever placed utilities out of service on private property. Of the 10 utility owners who responded, eight responded affirmatively and two responded negatively (Figure 35).
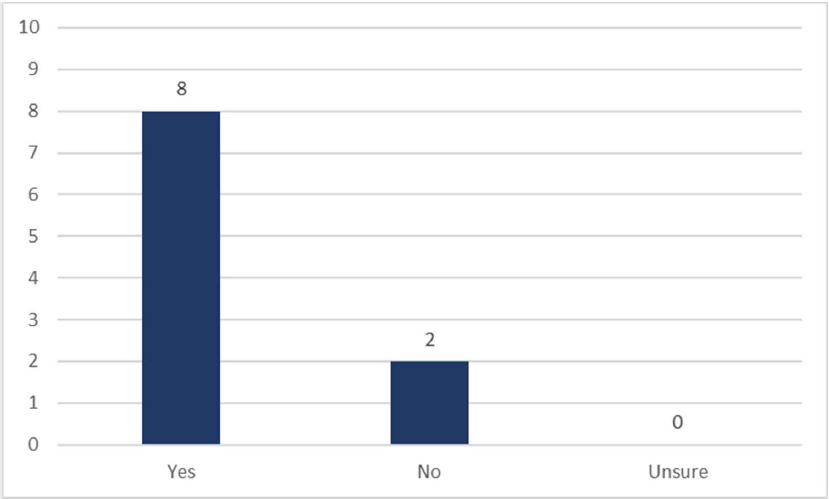
The x-axis lists three categories: Yes, No, and Unsure. The y-axis shows the number of respondents ranging from 0 to 10 in increments of 1. The data given in the bar graph are as follows: Yes: 8, No: 2, Unsure: 0. The values are accurate.
Figure 35. Utility Owners Who Have Placed Utilities Out of Service on Private Property.

Tracking of OOS Utility Information

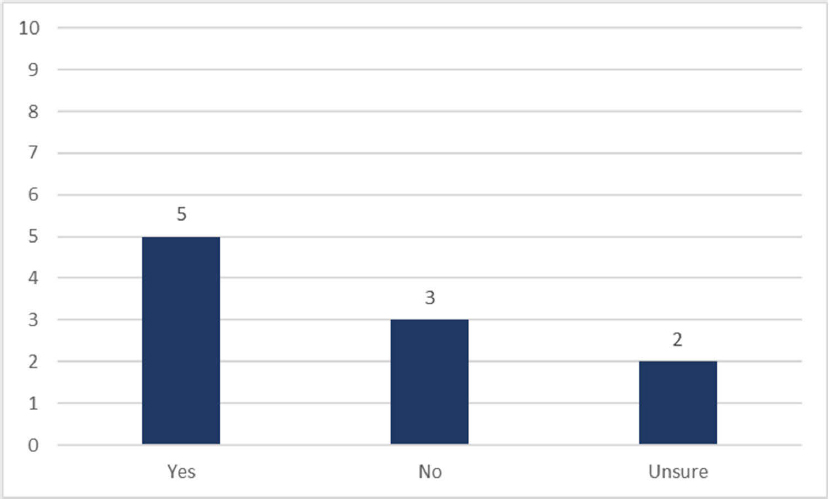
The research team asked utility owners whether they track information related to utilities placed out of service by their companies. Of the 10 utility owners who responded, five responded affirmatively, three responded negatively, and two were unsure (Figure 36).

The five utility owners who responded affirmatively were asked to describe how they track information about OOS utilities. The four utility owners who responded noted the use of GIS mapping systems. Among these four respondents, two respondents additionally noted that OOS utilities must be reported to the state and the One Call system on an annual basis in some states. Lastly, one utility owner stated that abandonment means that the utility facility no longer belongs to the utility owner.
Suggested Citation: "4 Survey Results." National Academies of Sciences, Engineering, and Medicine. 2026. Developing a Guide to Manage Out-of-Service Utility Facilities. Washington, DC: The National Academies Press. doi: 10.17226/29497.
The x-axis lists three categories: Yes, No, and Unsure. The y-axis shows the number of respondents ranging from 0 to 10 in increments of 1. The data given in the bar graph are as follows: Yes: 5, No: 3, Unsure: 2. The values are accurate.
Figure 36. Utility Owners Who Track Information Related to OOS Utilities.

Repurposing of OOS Utilities

The research team asked utility owners whether they have repurposed OOS utility for use by an active utility (e.g., use of an abandoned pipeline by communication facilities). Of the 10 utility owners who responded, one responded affirmatively, eight responded negatively, and one was unsure (Figure 37).

The one utility owner who responded affirmatively has put abandoned natural gas gathering lines into service as production lines or used them to transport different products, such as CO2.
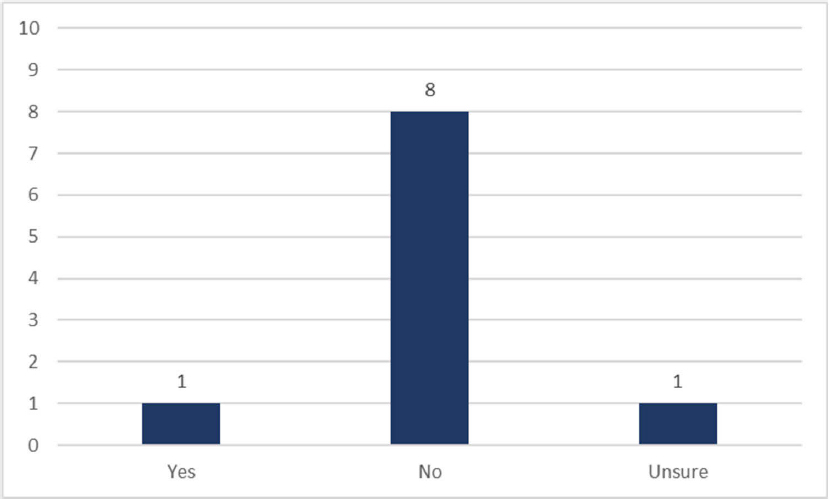
The x-axis lists three categories: Yes, No, and Unsure. The y-axis shows the number of respondents ranging from 0 to 10 in increments of 1. The data given in the bar graph are as follows: Yes: 1, No: 8, Unsure: 1. The values are accurate.
Figure 37. Utility Owners Who Have Repurposed an OOS Utility.
Suggested Citation: "4 Survey Results." National Academies of Sciences, Engineering, and Medicine. 2026. Developing a Guide to Manage Out-of-Service Utility Facilities. Washington, DC: The National Academies Press. doi: 10.17226/29497.

Stakeholder Lessons Learned

The research team asked all survey participants to share best practices or lessons learned when dealing with OOS utilities in the right-of-way. Table 10 provides a selection of responses by stakeholder type. Appendix B provides a complete list of responses.

Table 10. Best Practices for Dealing with OOS Utilities.

Stakeholder Type Response
Contractor Be cautious when digging.
Contractor If the owner of the utility cannot be identified, purge the utility if applicable and commence construction, unless it is an obstacle that requires removal.
Project Owner Try and find the owner. Tap the line to see what is in it. Depending on safety requirements, add removal of the line to the contractor’s duties. Charge the utility for removal of the abandoned line.
Project Owner Avoidance is best. Abandonment in place with an accurate as-built is preferred over removal.
Project Owner Be cautious until you are 100 percent sure it is in fact abandoned.
Project Owner Better coordination during the design phase between the DOT, consultant, and utility.
Project Owner Better tracking/records of the OOS facility. In most instances where an OOS facility was present and negatively impacted a project, the OOS facility was inherited, and no records were available to document its existence.
Project Owner Call in locates early so that knowledge of utilities can begin early, and potential OOS utilities can be identified to limit delay.
Project Owner Communicate. Understand both sides. Agree on expectations. Communicate. Repeat.
Project Owner Communicate to confirm they are in fact out of service or keep a schedule of cut-over dates when new utilities are being installed to replace old ones.
Project Owner Early and often communication and pushing utilities to be proactive with relocation efforts.
Project Owner Good recordkeeping for facilities when they change ownership. Communication with utility companies.
Project Owner Have a well-groomed relationship with utilities.
Project Owner Identify early, opt to remove in lieu of abandonment in place when practical.
Project Owner Planning phase diligence can save lots of money if utilities are identified in this phase rather than in the construction phase.
Project Owner Research records, communicate with all potential owners, and document location in an as-built.
Suggested Citation: "4 Survey Results." National Academies of Sciences, Engineering, and Medicine. 2026. Developing a Guide to Manage Out-of-Service Utility Facilities. Washington, DC: The National Academies Press. doi: 10.17226/29497.
Stakeholder Type Response
Utility Owner Designers need to engage utilities earlier in the process.
Utility Owner Locate all underground infrastructure, including abandoned lines, during the planning phase of a project.
Utility Owner There are a lot of abandoned pipelines out there. There needs to be a way for them to show up when someone submits a One Call ticket, so excavators are not surprised when they find them on accident.
Utility Owner Treat all abandoned pipelines as if they contain hazardous liquid or gas products until proved otherwise. It is expensive and slows down the project to stop and tap an unknown pipeline rather than cutting right through it, but it is much safer and will save time and effort in the long run if it is a line that was not properly purged when it was abandoned.
Utility Owner Treat them as if they have not been properly cleaned and abandoned and they are live and under pressure. Call Miss Dig (811) for locations. It is utterly amazing that the state and federal government agencies do not use Miss Dig (811)! We narrowly diverted disaster by sheer luck when the state wildfire division began plowing without calling in an emergency Miss Dig request while fighting wildfire. They ignored pipeline markers with emergency numbers and were stopped within feet of crude oil and produced gas line with 600 psi on it. State DOT does not appear to use Miss Dig either for all of their project requests.
Other Pennsylvania has 33 regional utility coordination committees that meet regularly and use Coordinate PA to share their projects throughout the process. One Call and the American Public Works Association (APWA) chapters help to spread the message and facilitate those committees.

The research team asked all survey participants if they would like to provide any additional comments regarding OOS utilities in the right-of-way. In total, 16 participants responded. Table 11 provides a selection of responses by stakeholder type.

Table 11. Additional Participant Comments About OOS Utilities.

Stakeholder Type Response
Utility Owner A lot of OOS utilities in the right-of-way were abandoned many, many years ago without good documentation. Getting good industry practice on how to properly abandon lines and how to manage abandoned lines going forward will be a good start, but we will always have to deal with legacy lines that were left in the ground, and the operator/owner walked away. Project managers need a good playbook for how to deal with an unexpected line at any stage of the project.
Other The APWA and the CGA Best Practices Committees have been wrestling with this issue for many years. The owners and government stakeholders must cooperate and fund the process of collecting and sharing the OOS data with project owners and their design and construction professionals for the betterment of all.
Suggested Citation: "4 Survey Results." National Academies of Sciences, Engineering, and Medicine. 2026. Developing a Guide to Manage Out-of-Service Utility Facilities. Washington, DC: The National Academies Press. doi: 10.17226/29497.
Stakeholder Type Response
Project Owner This is becoming a growing problem. The power company is now installing distribution lines underground. They will age out in 30 years and start to become the next abandoned utility issue. Currently the right-of-way is littered with abandoned fiber that is interfering with new builds.
Utility Owner Use Miss Dig (811) as the central resource of all underground facilities. Implement requirements for buried utilities’ status/mapping to be updated yearly. Encourage state and federal government agencies to abide by the same rules and regulations as the private sector when disturbances of the soil will take place.
Project Owner We need a lot of direction and help. We also need a specific set of laws that pertains to all agencies regarding all utilities in the right-of-way.

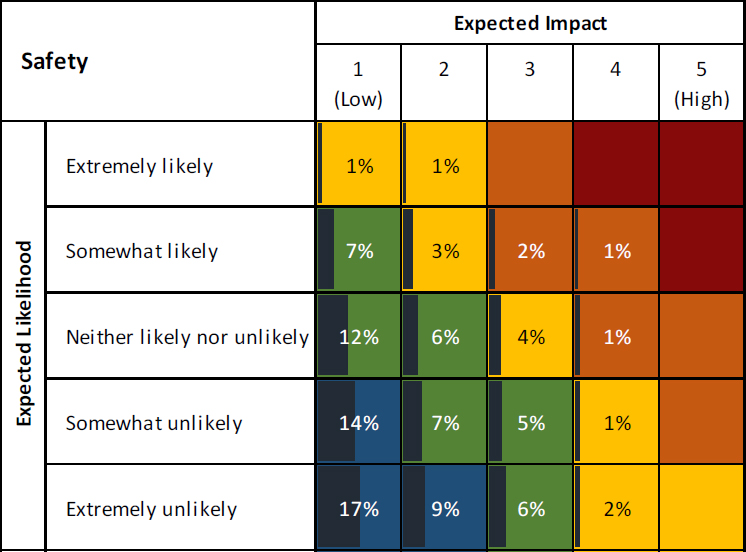
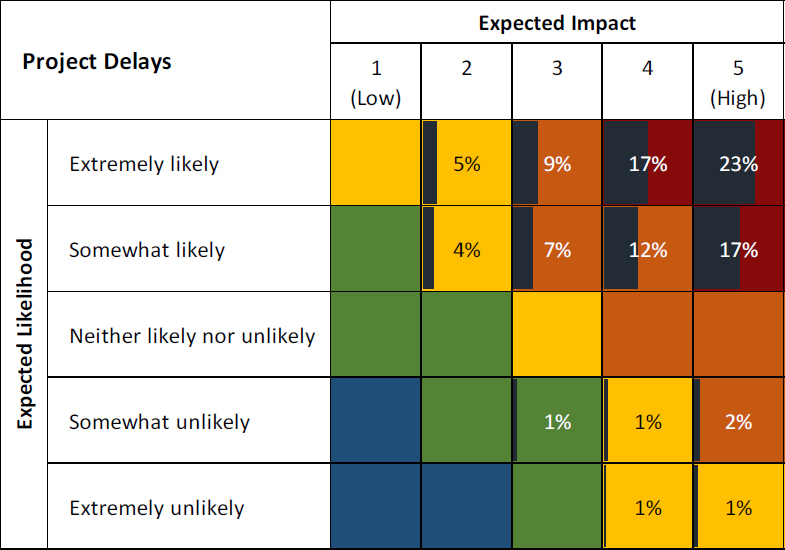
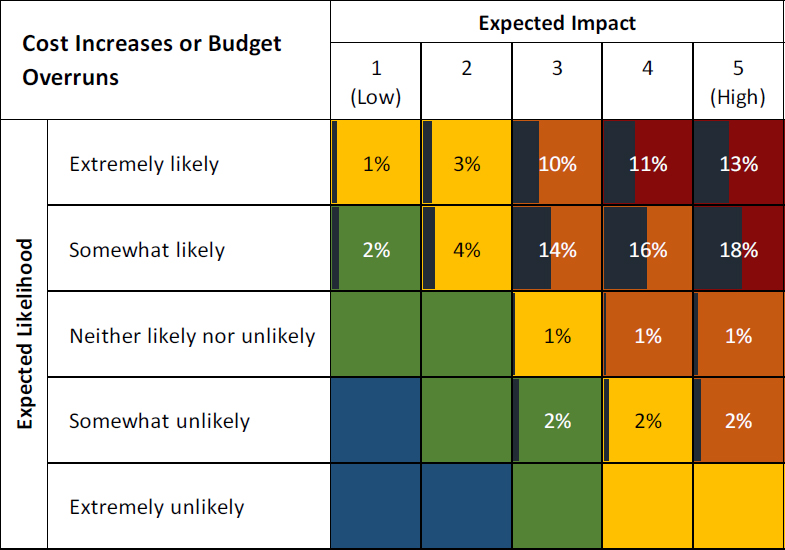
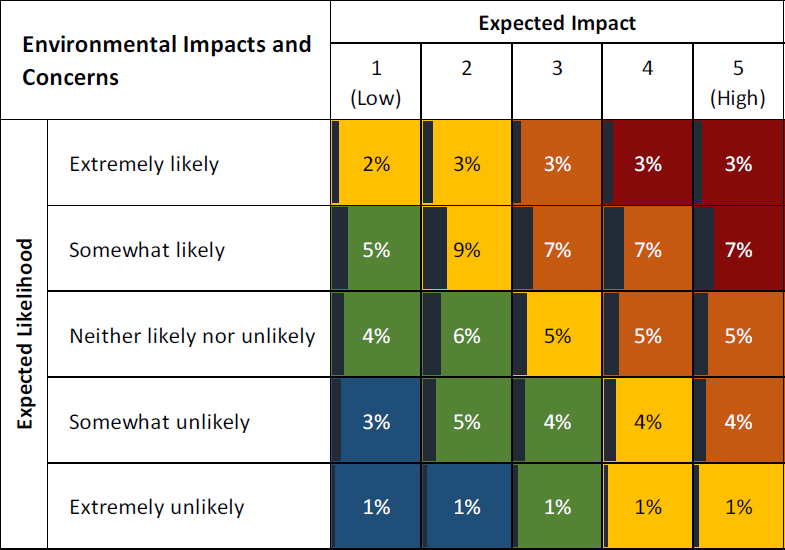
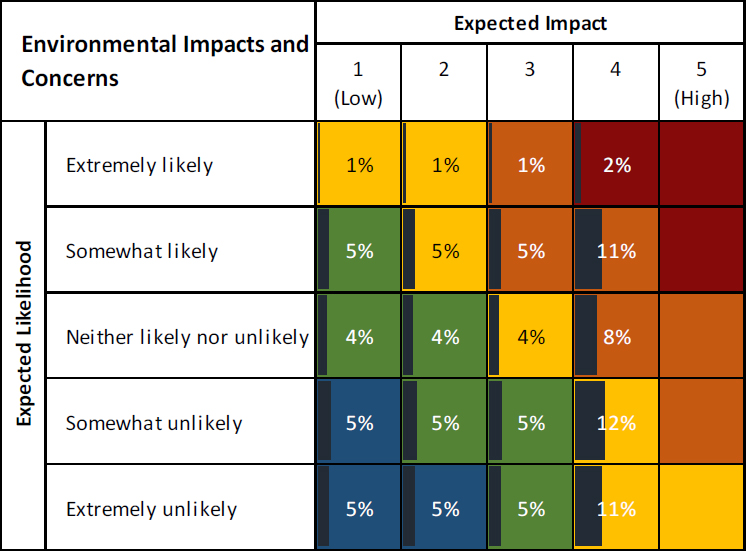
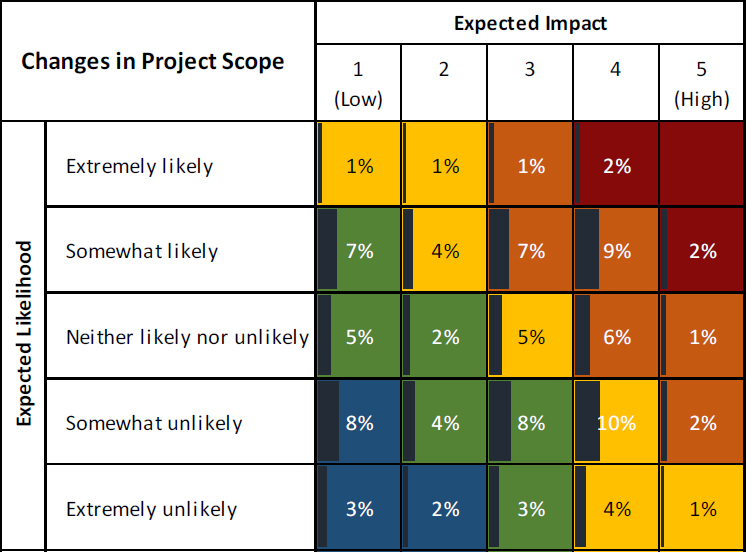
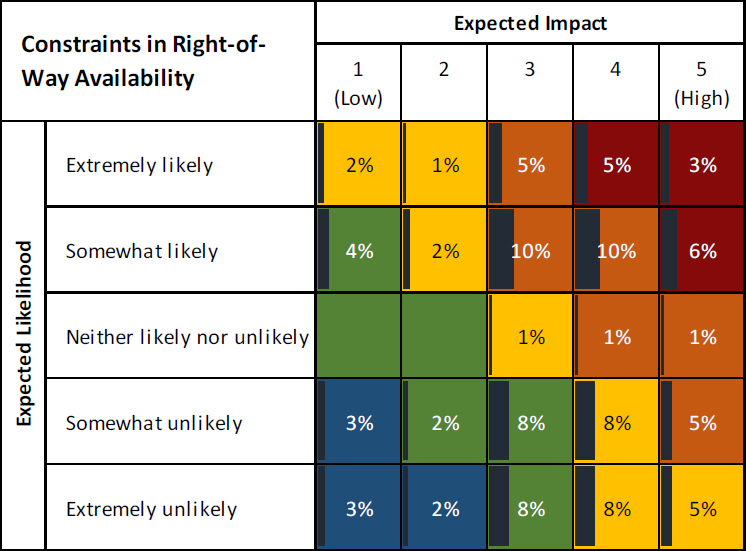
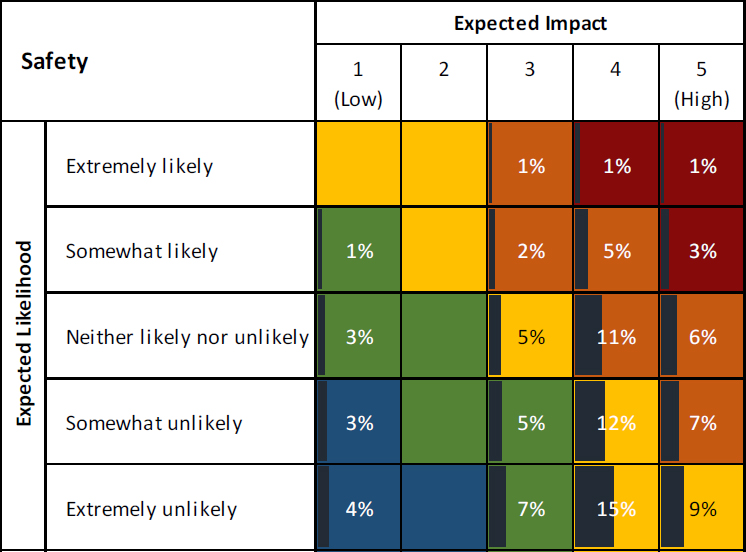
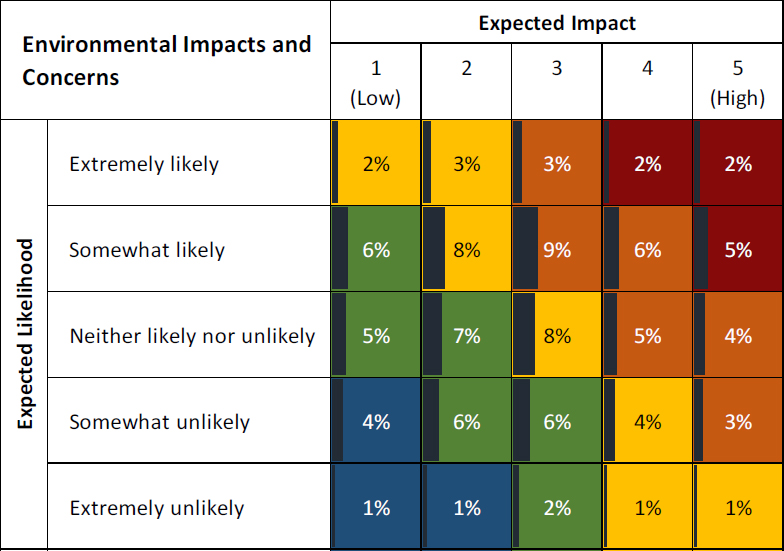
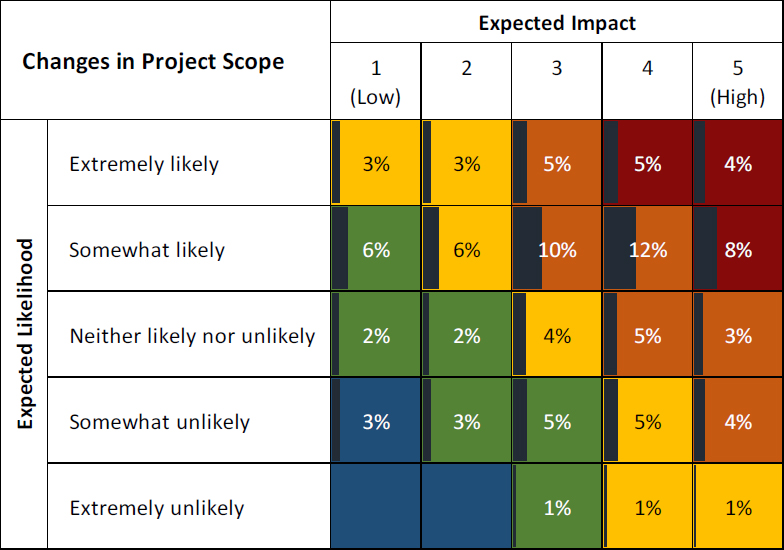
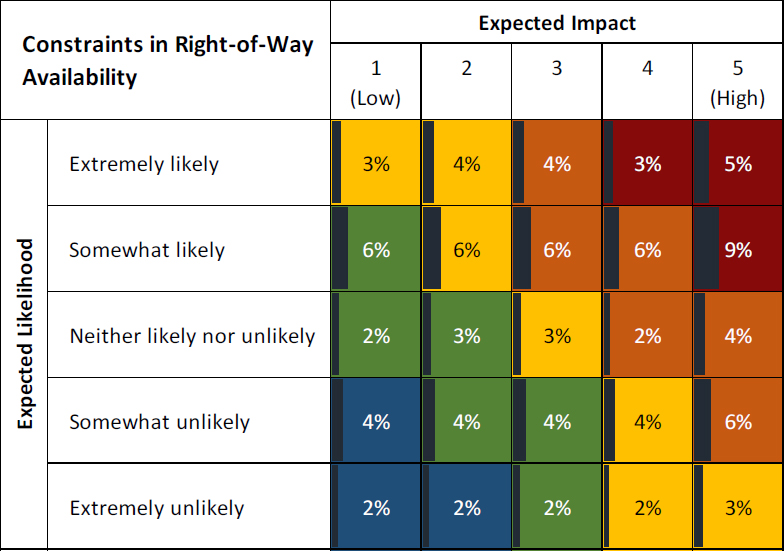
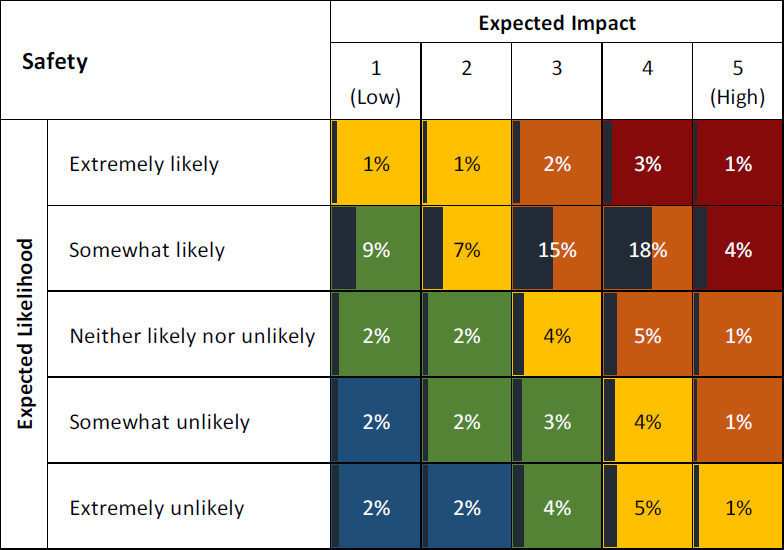
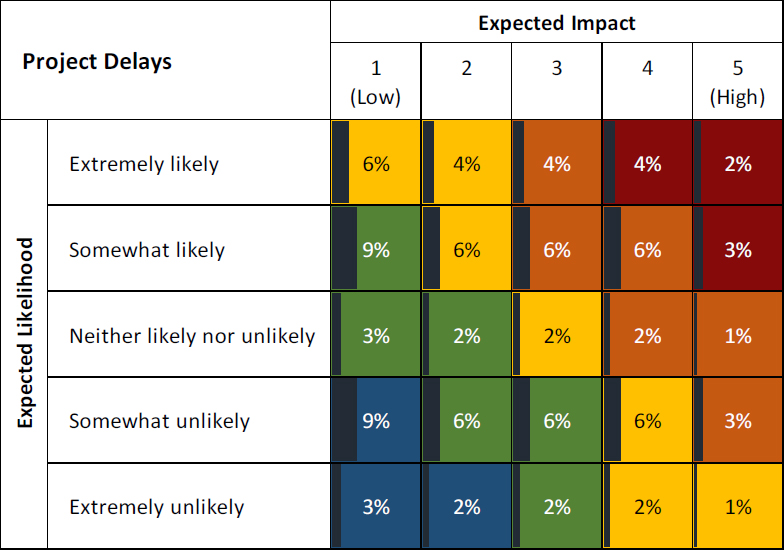
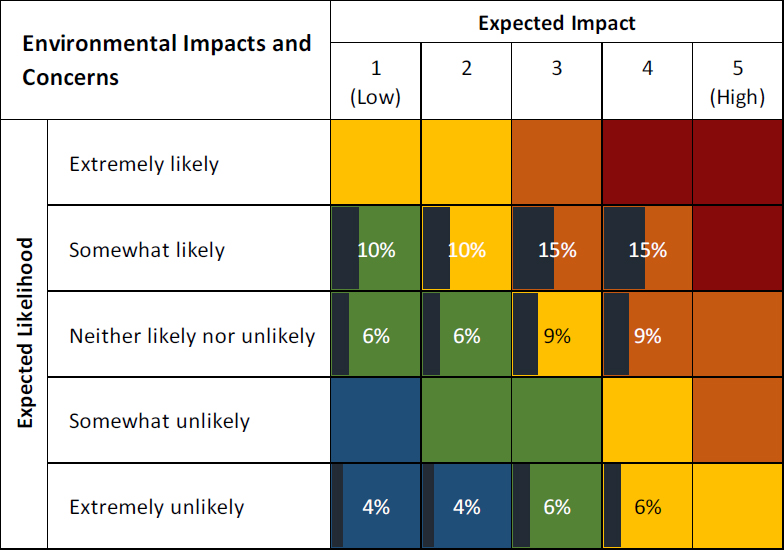
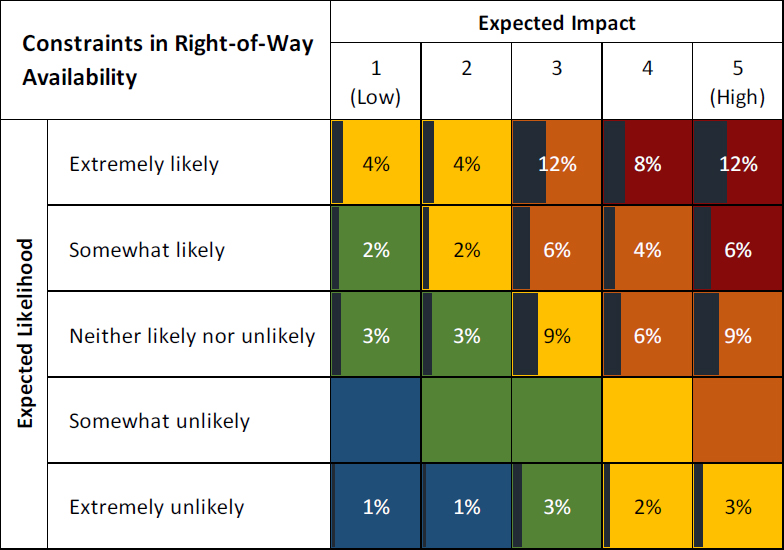
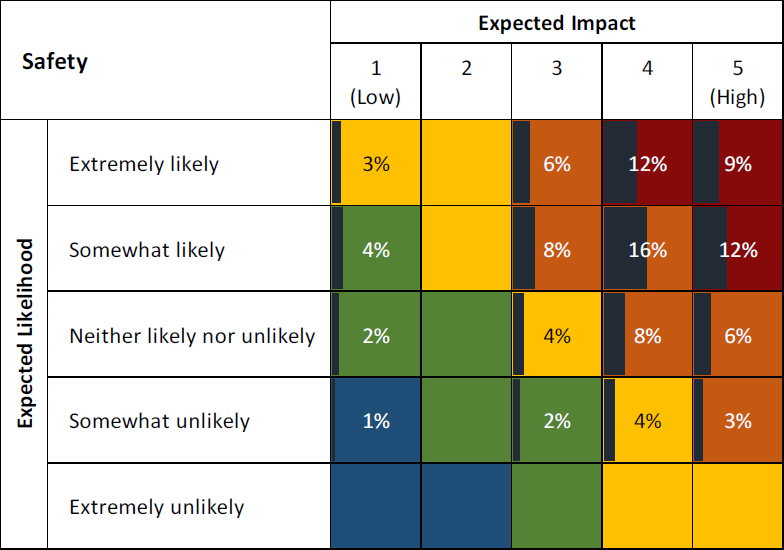
Expected Likelihood and Impacts of Outcomes

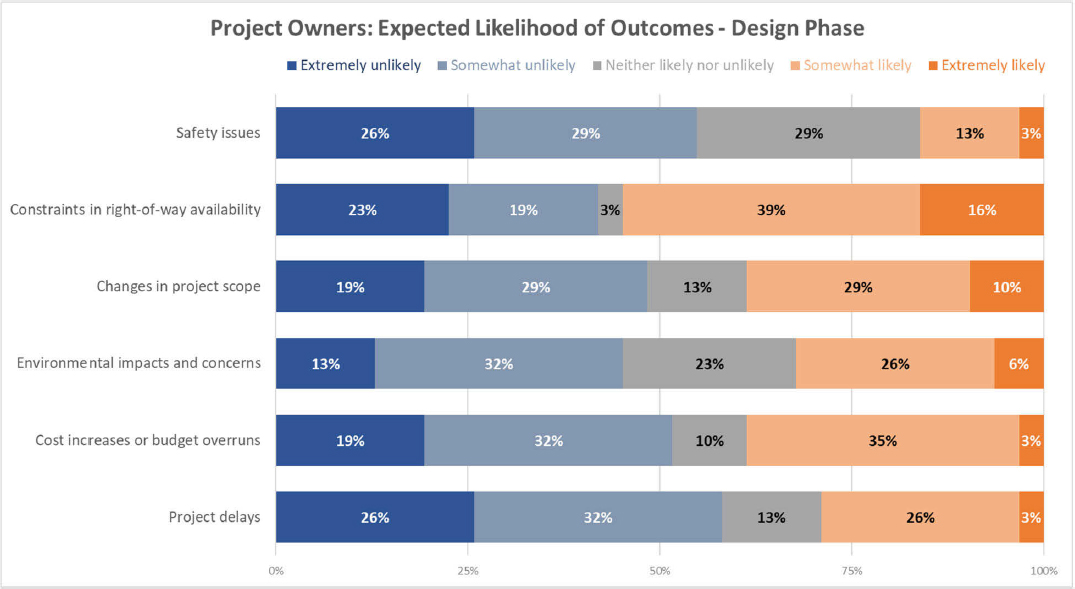
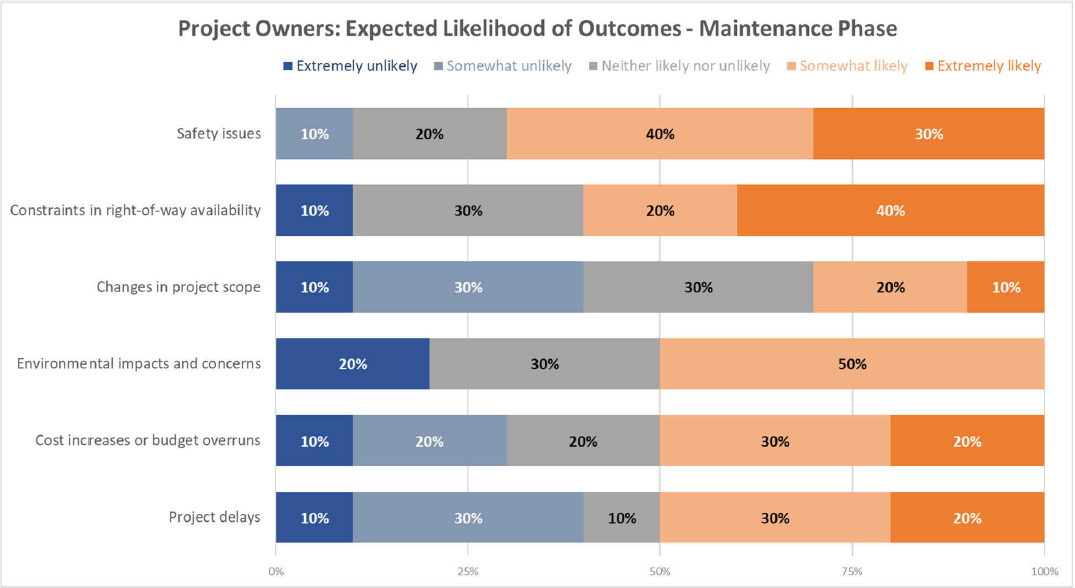
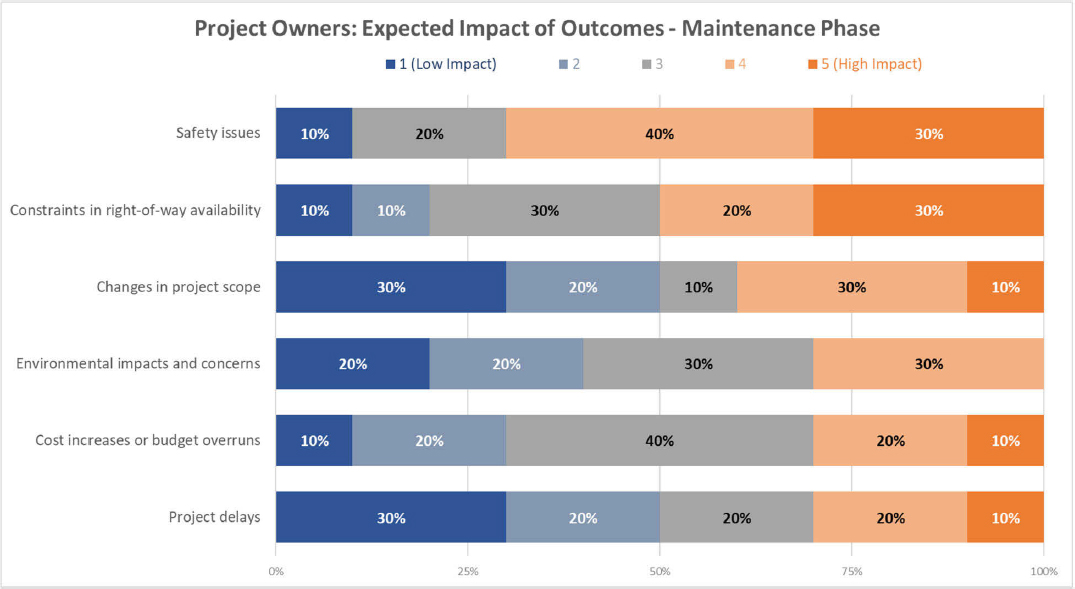
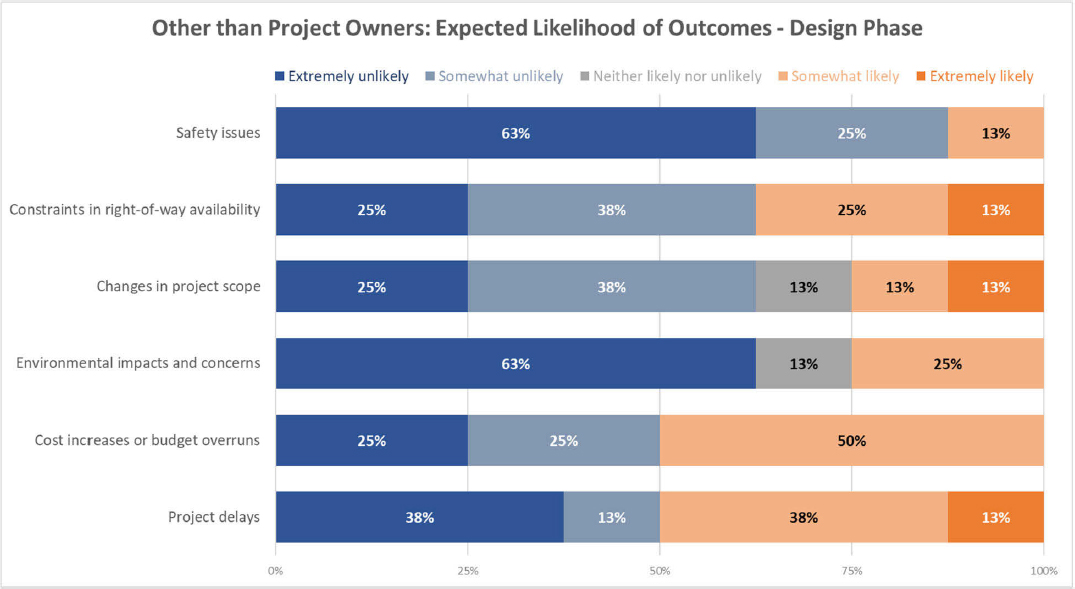
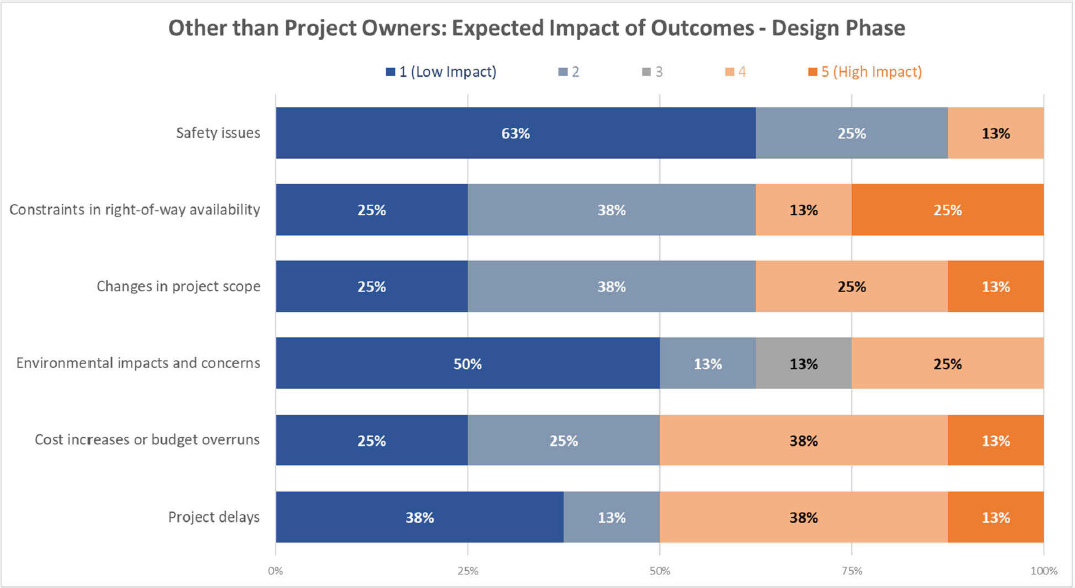
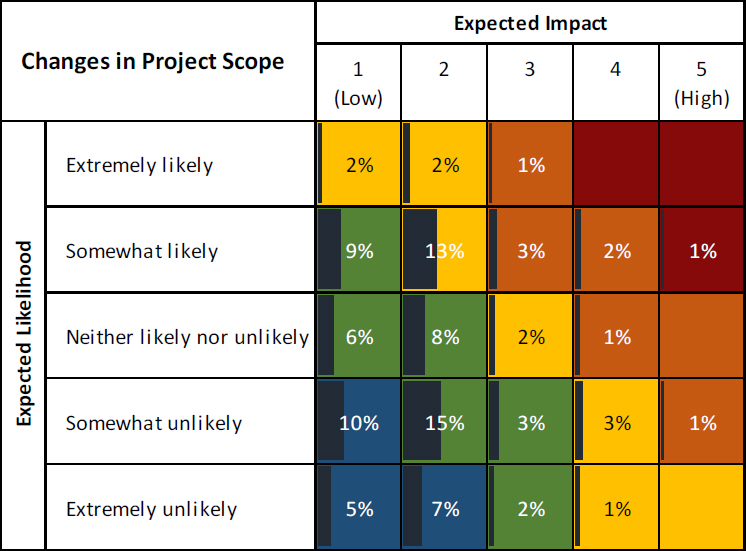
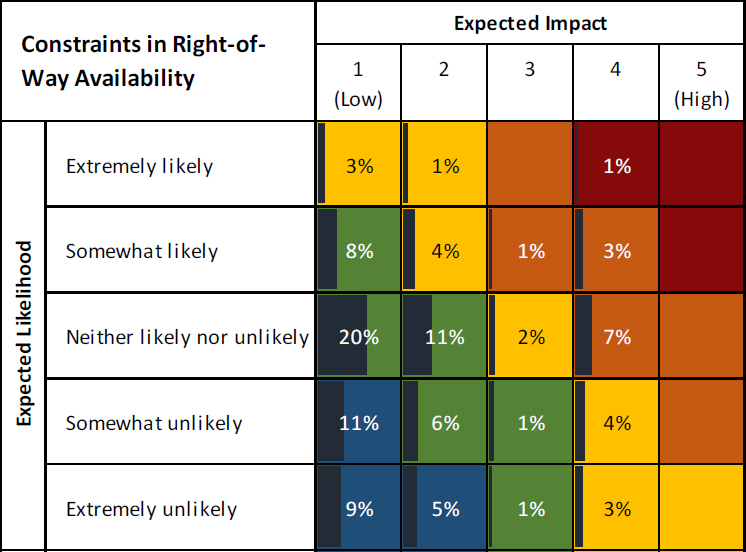
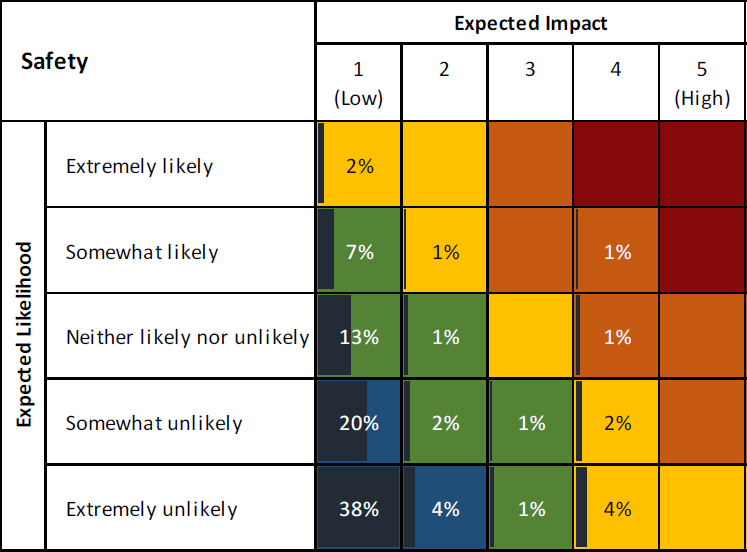
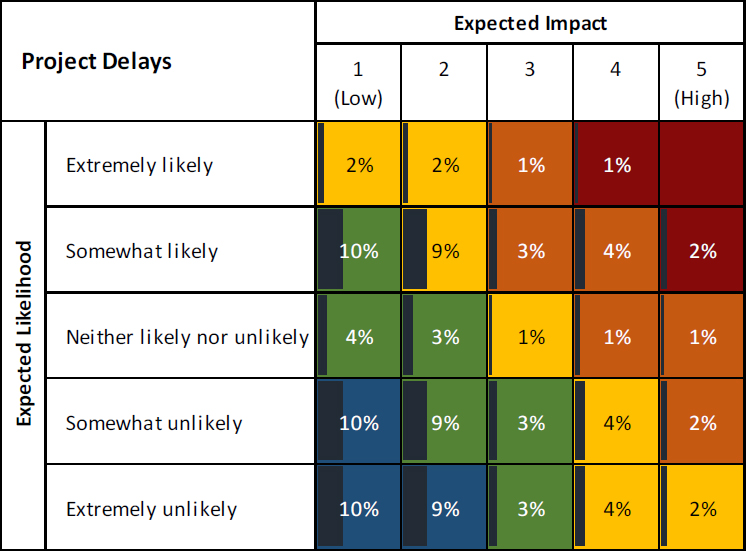
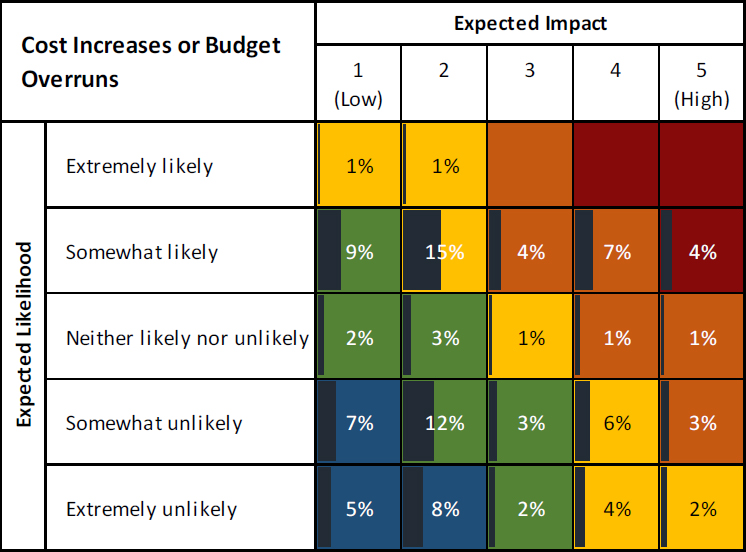
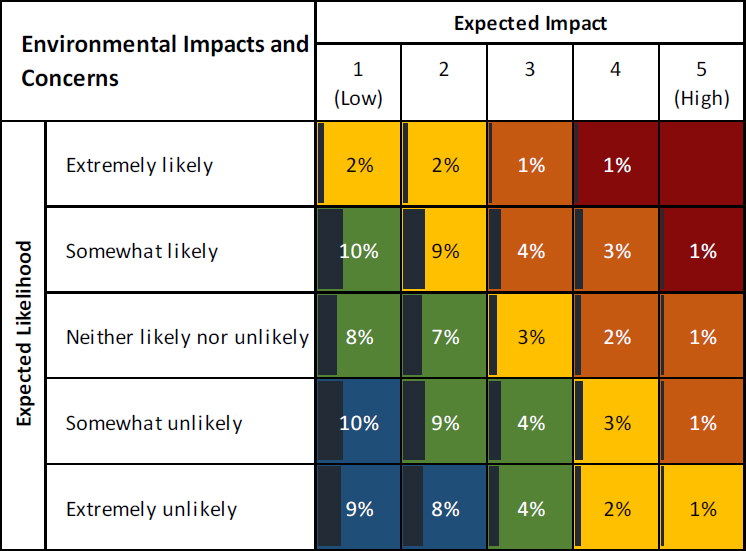
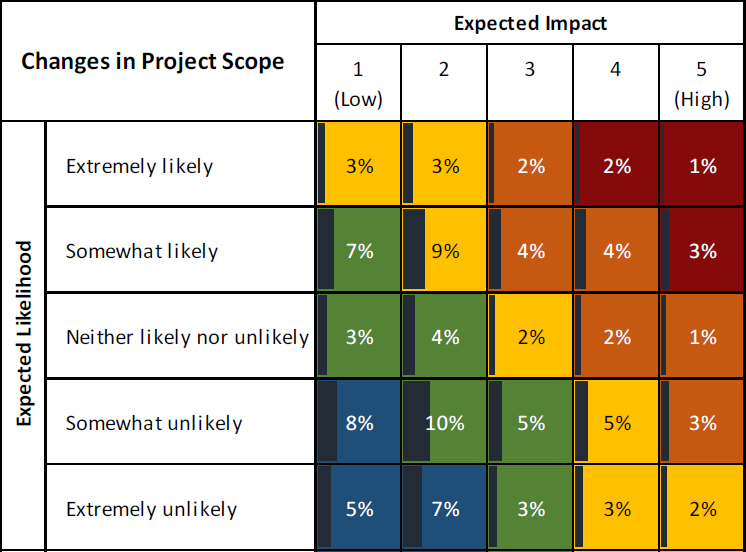
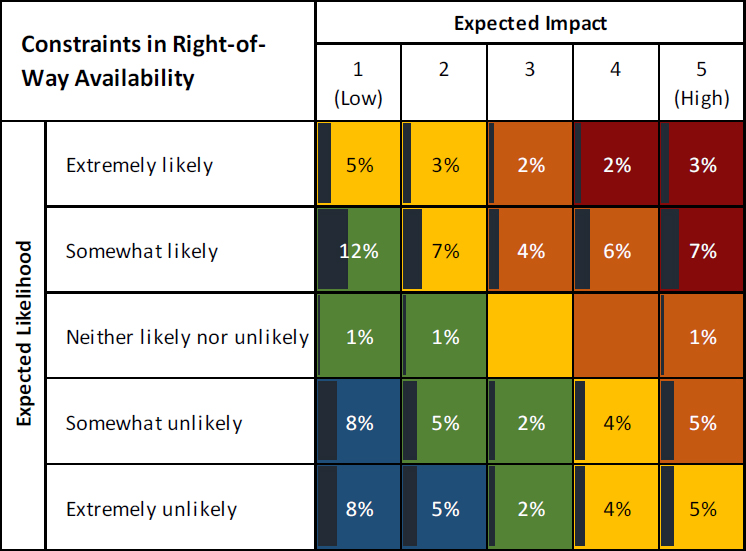
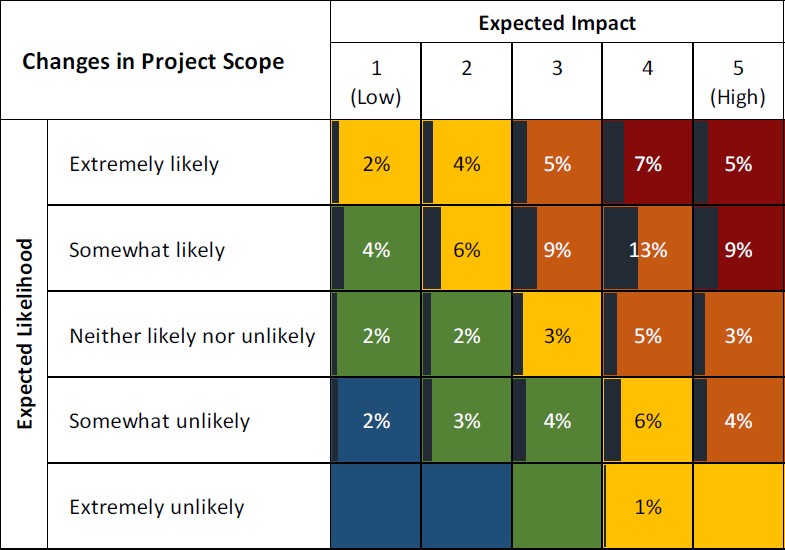
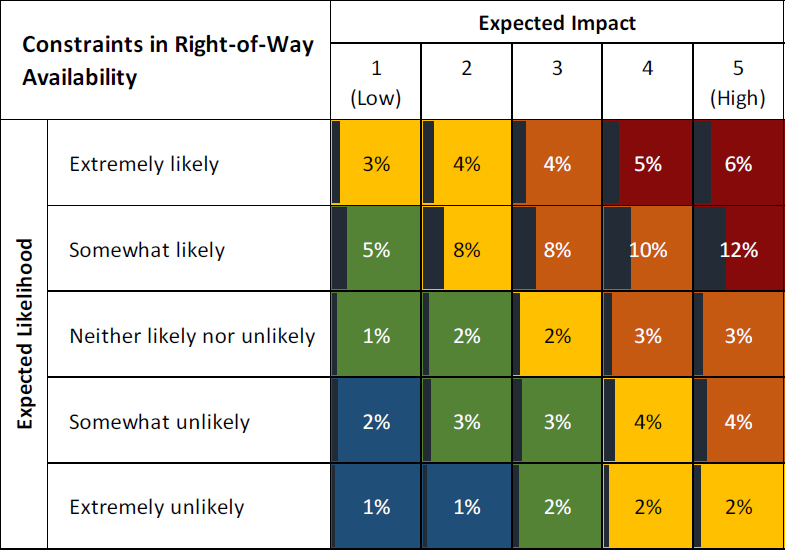
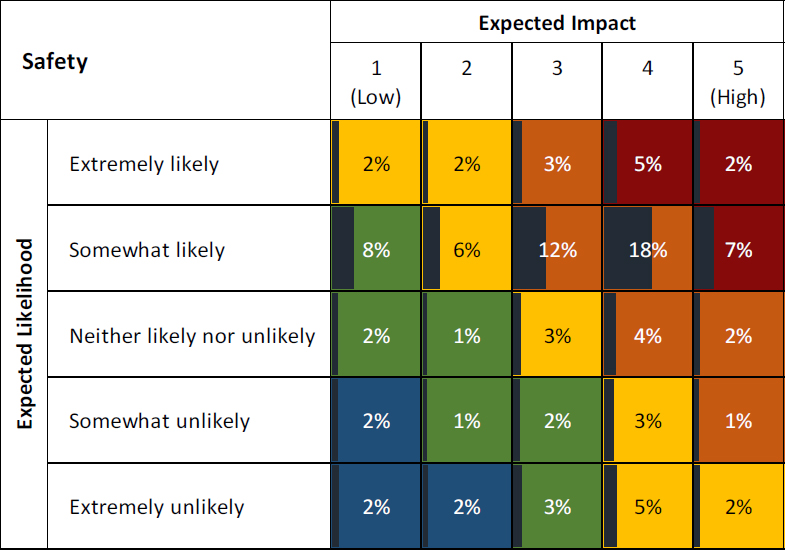
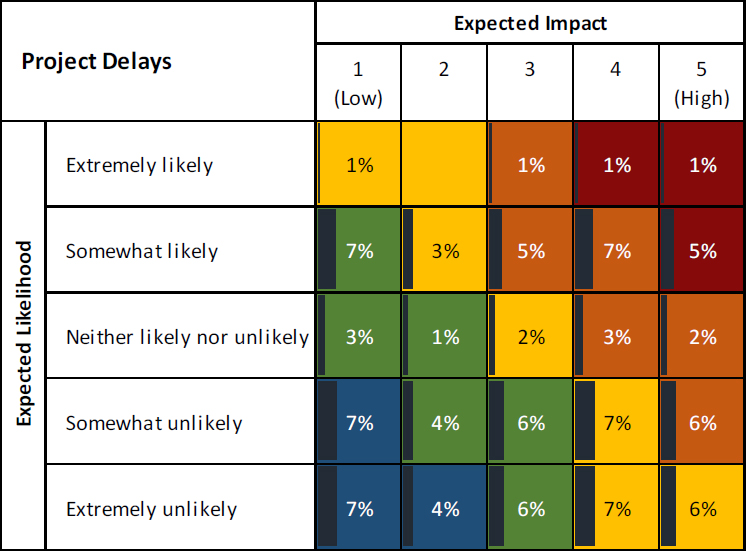
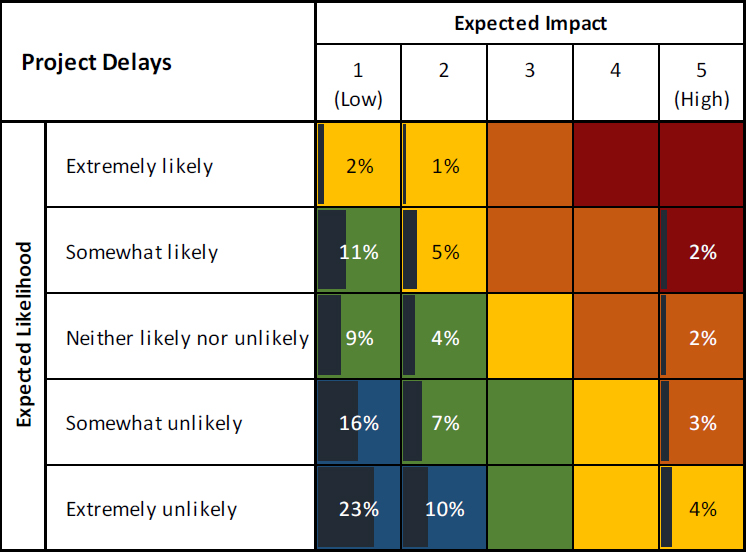
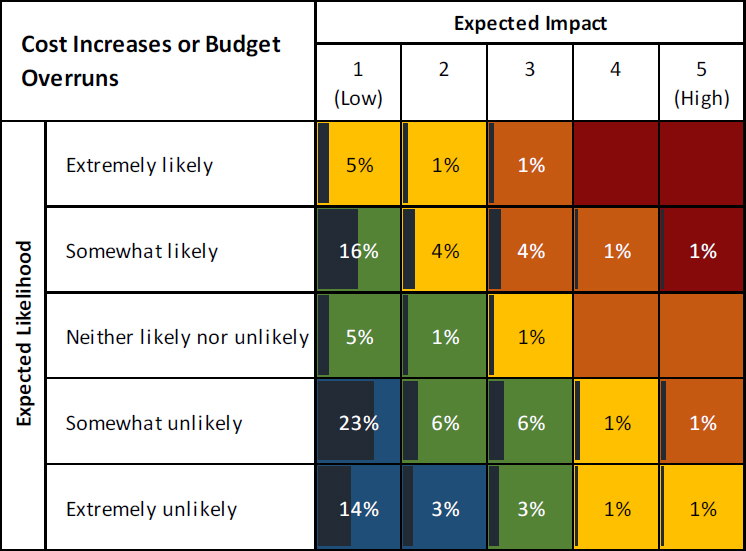
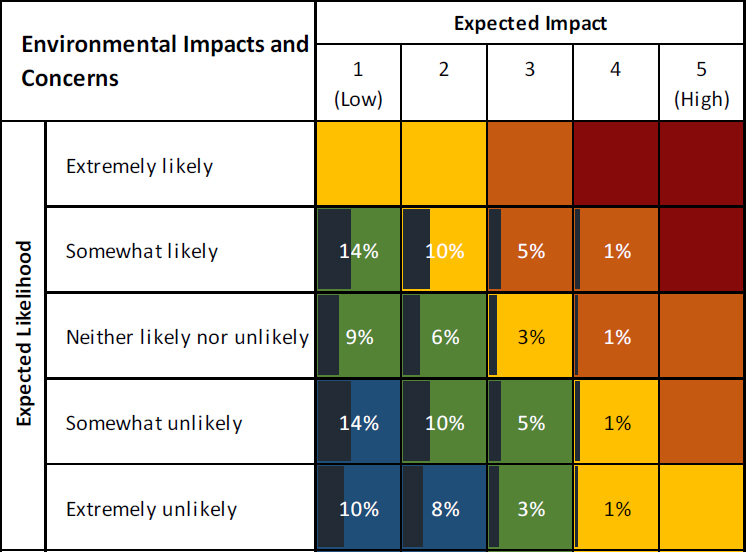
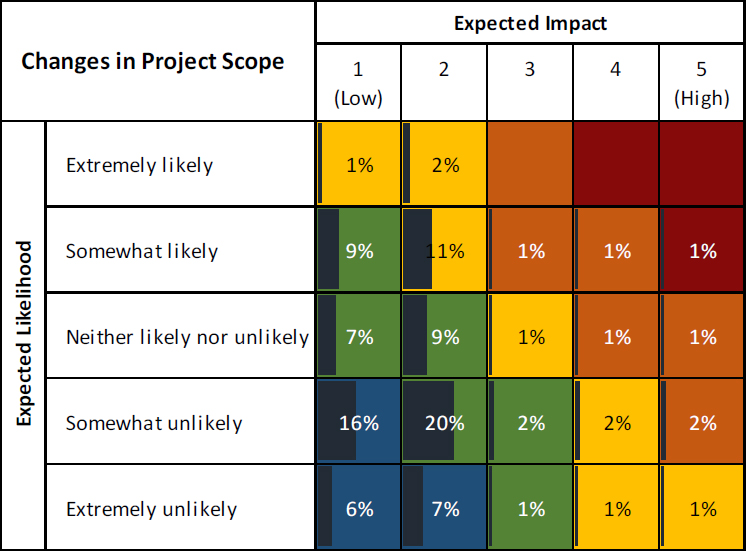
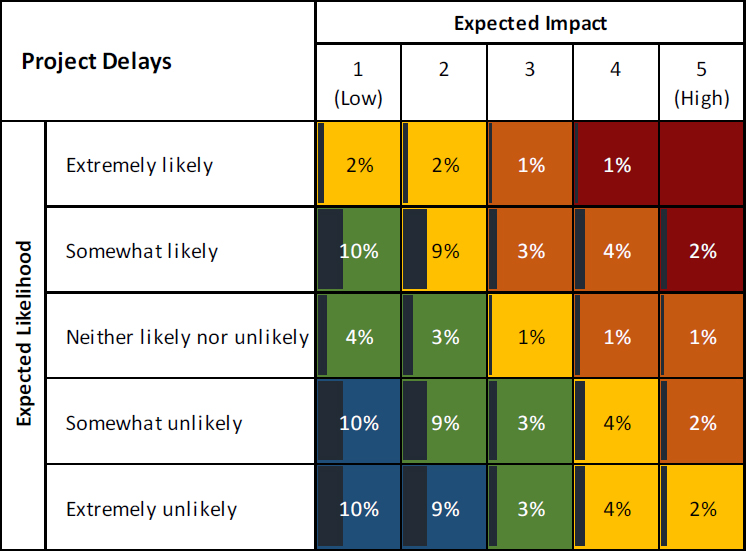
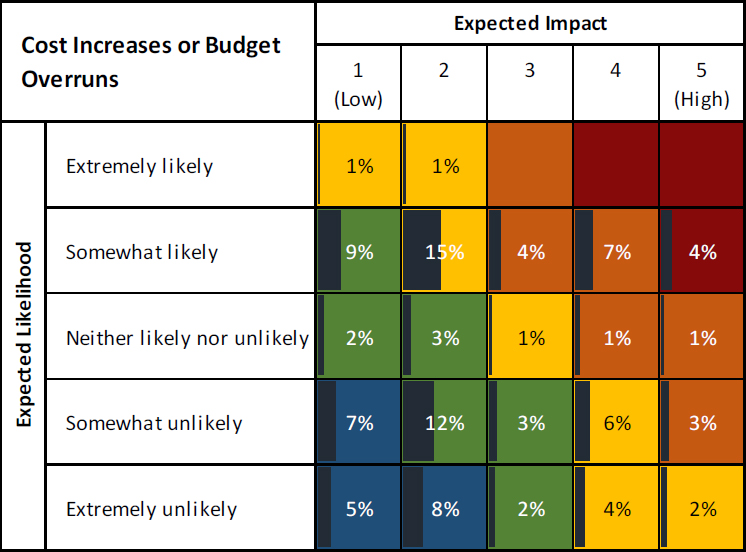
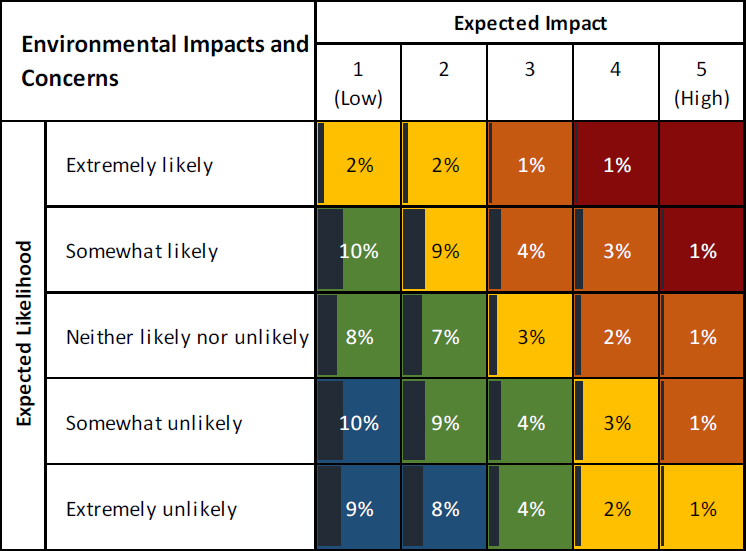
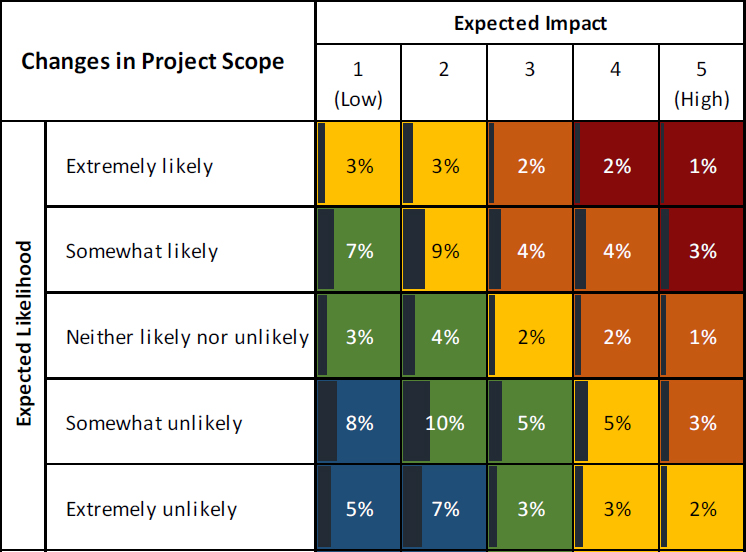
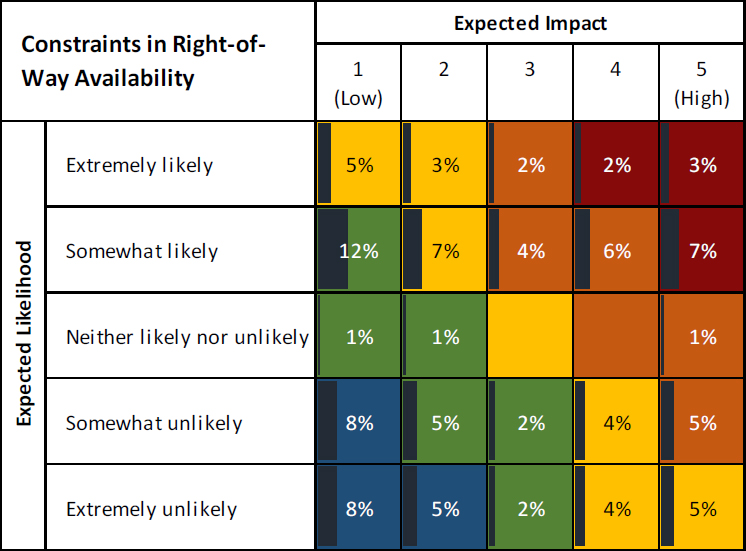
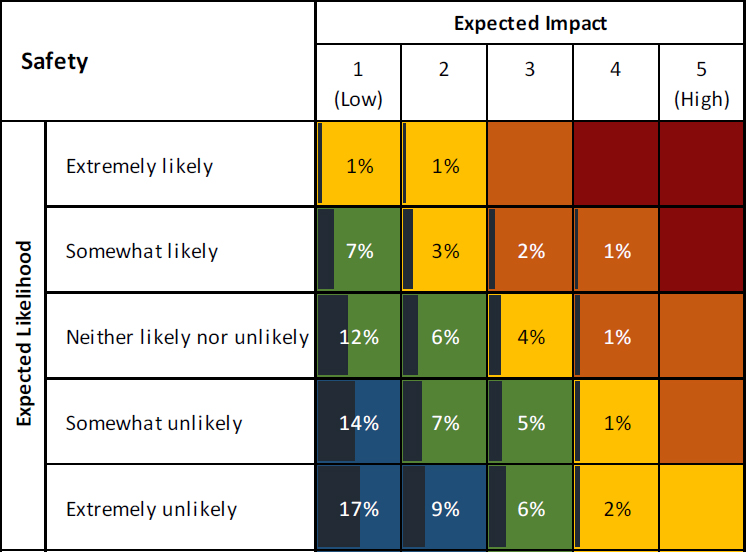
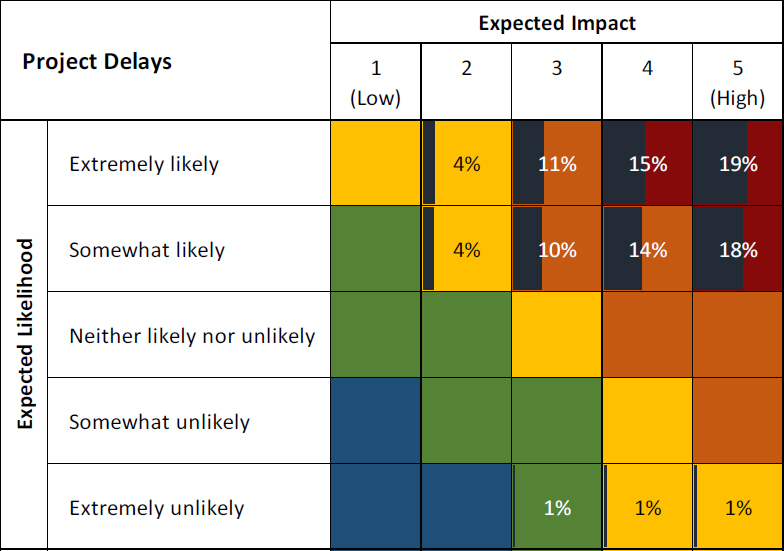
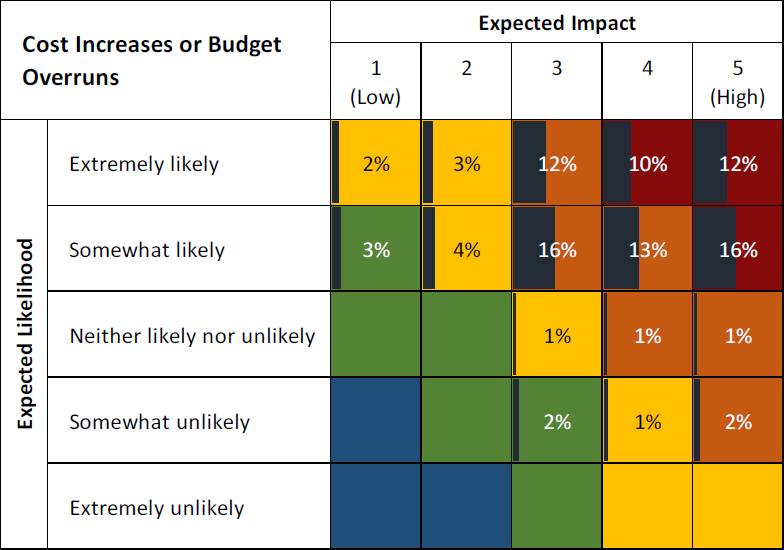
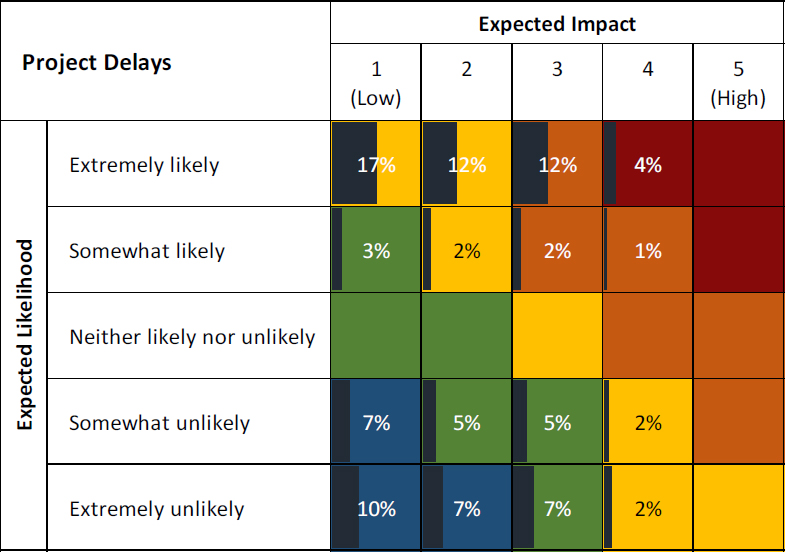
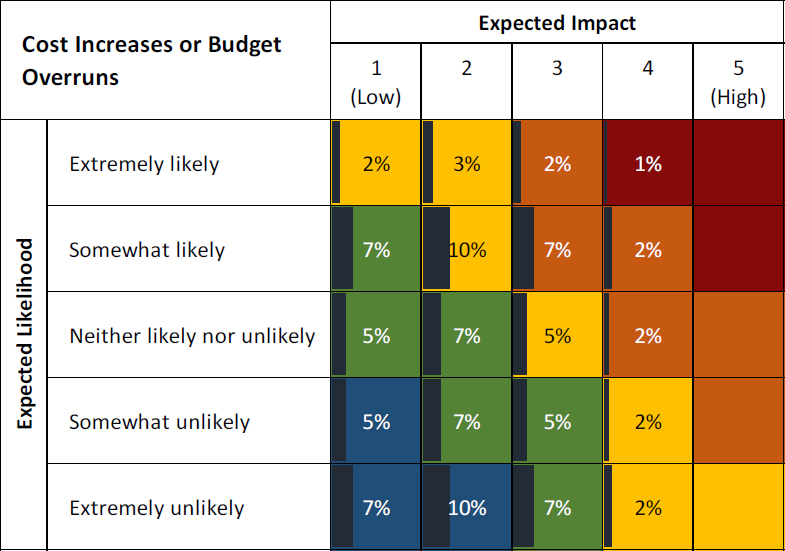
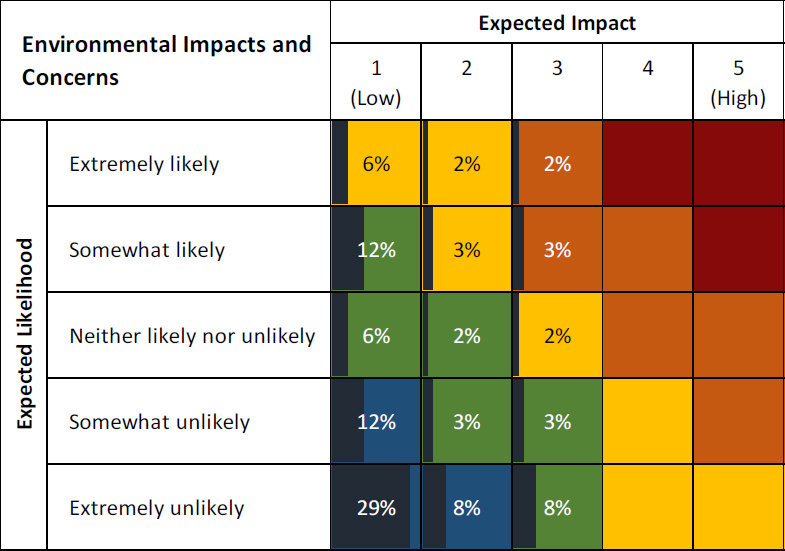
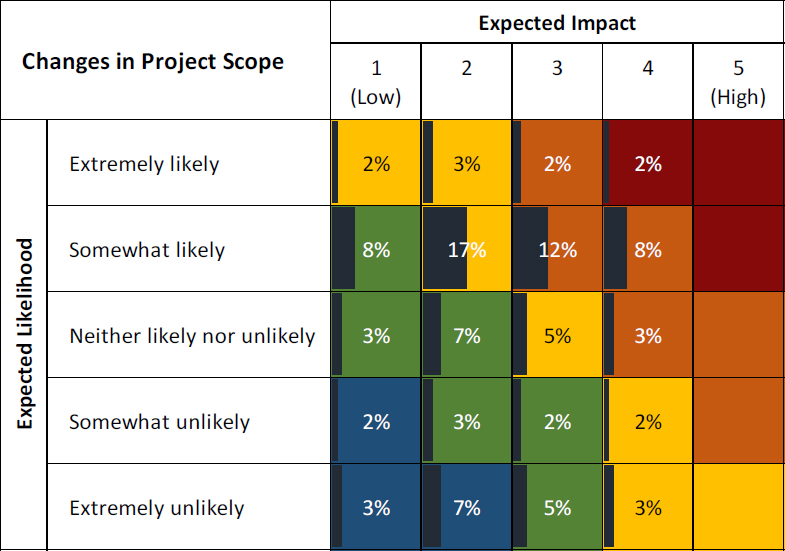
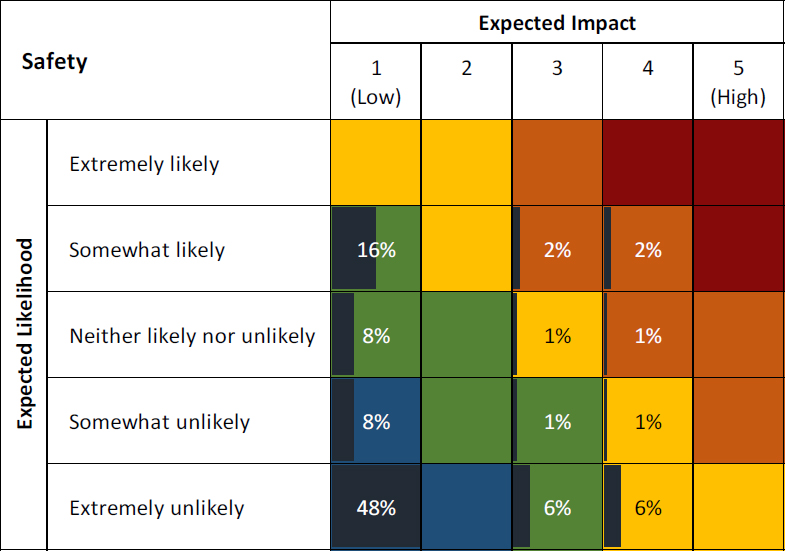
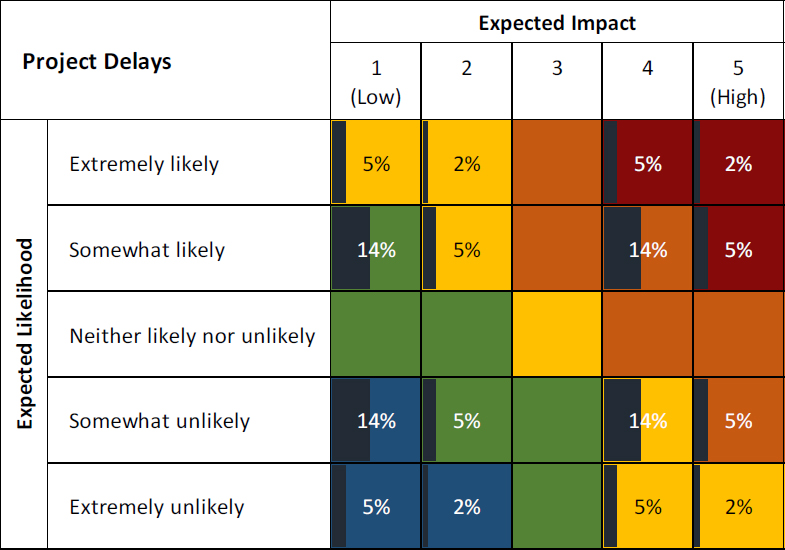
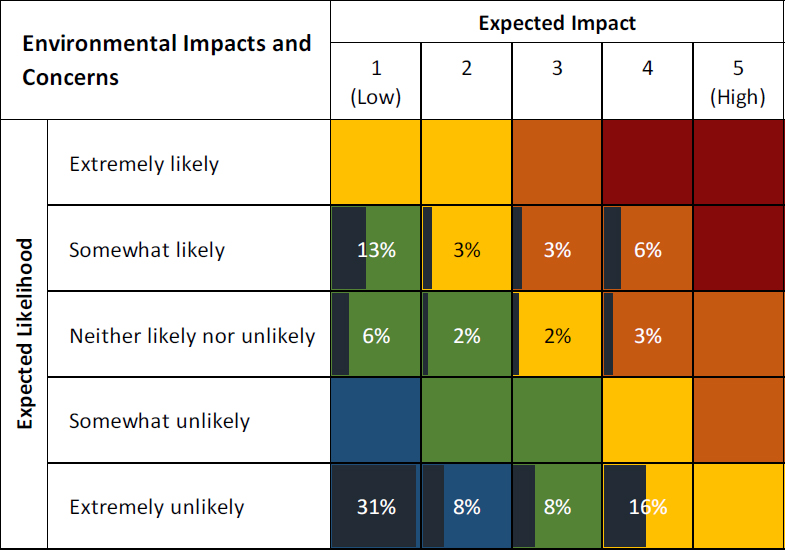
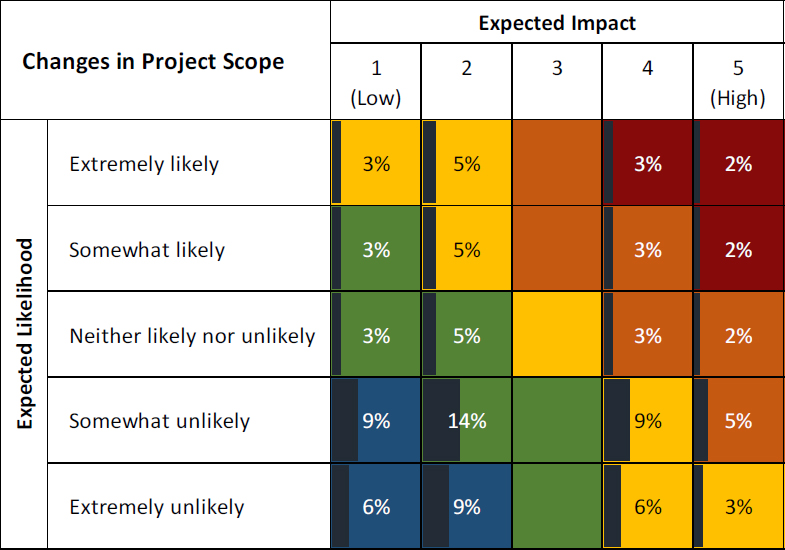
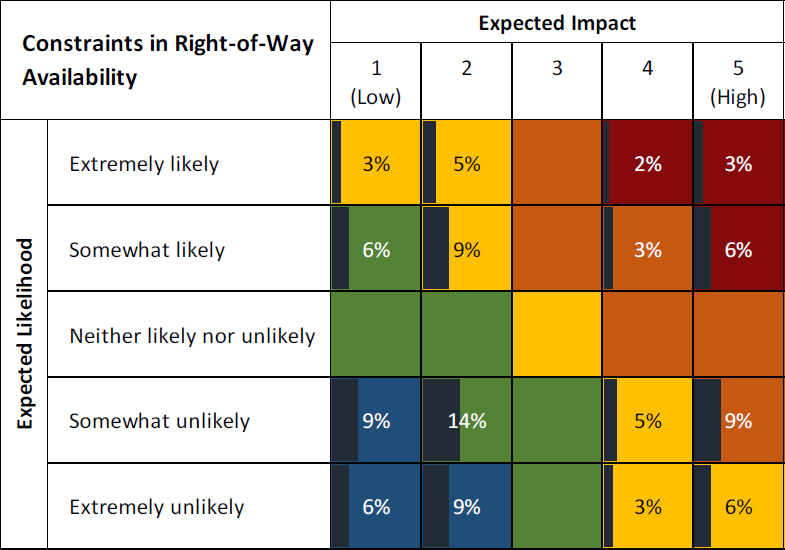
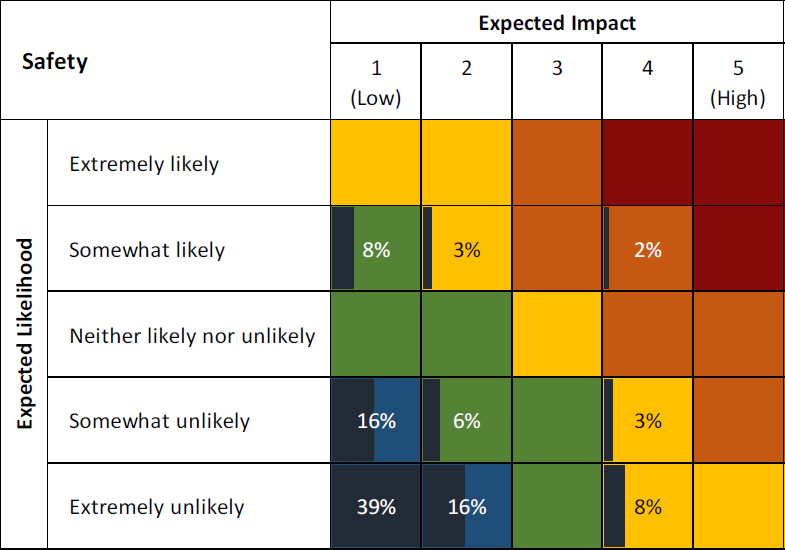
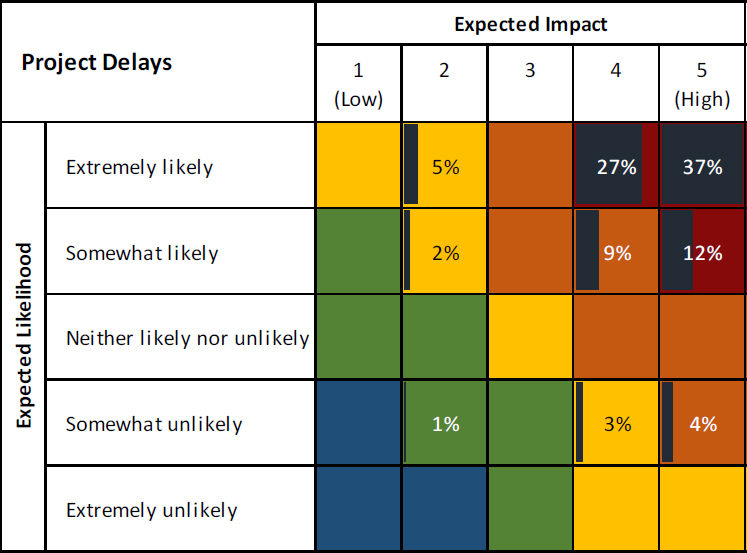
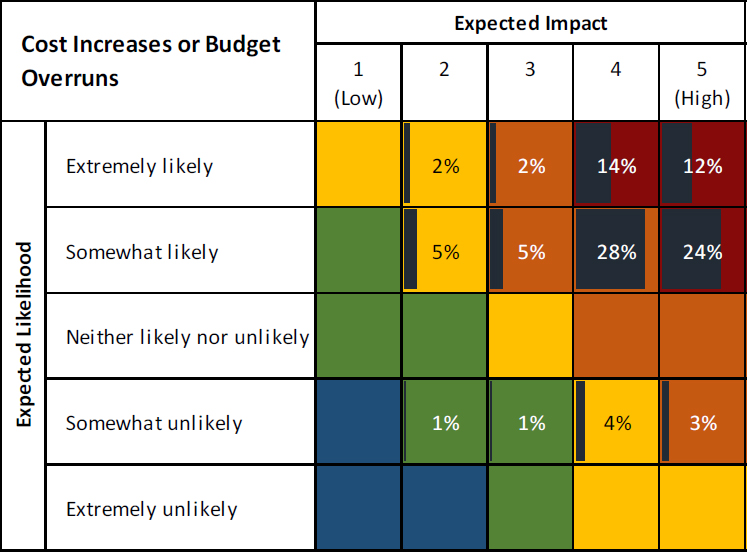
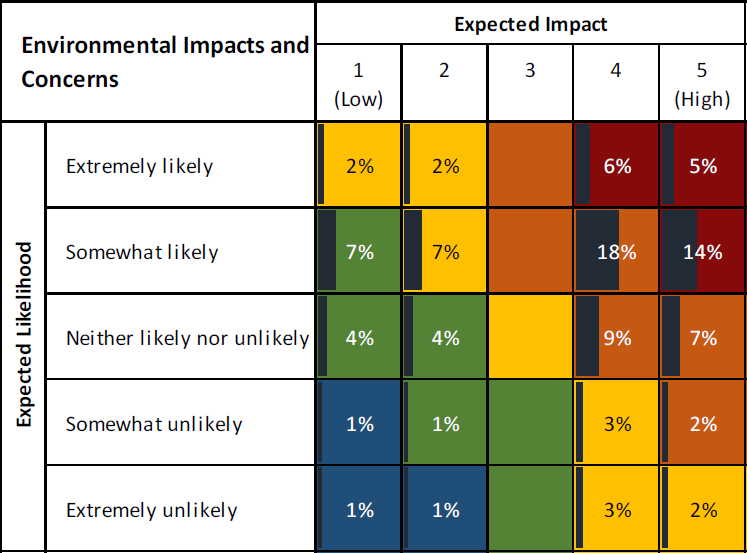
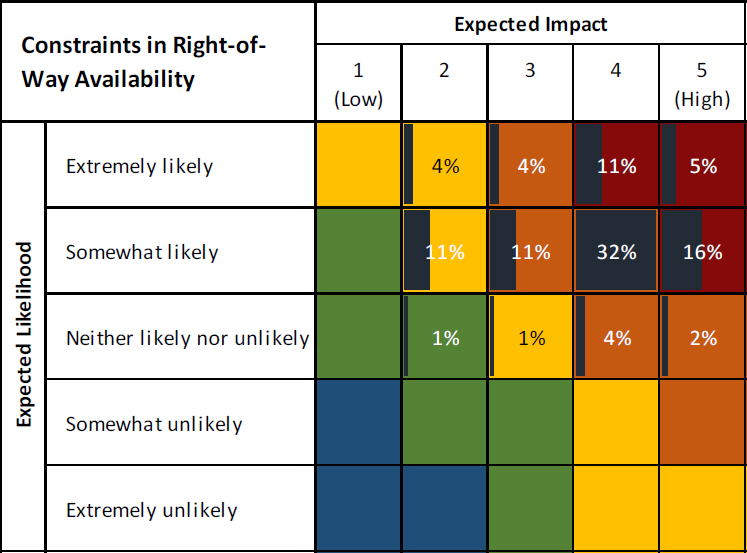
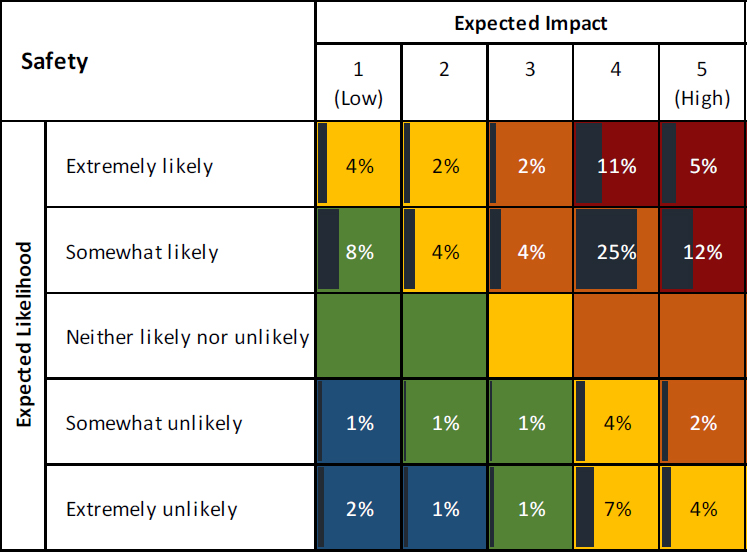
The research team asked survey participants about the expected likelihoods and impacts of outcomes related to OOS utilities. Survey participants were presented the following list of potential outcomes:

  • Safety issues.
  • Constraints in right-of-way availability.
  • Changes in project scope.
  • Environmental impacts and concerns.
  • Cost increases or budget overruns.
  • Project delays.

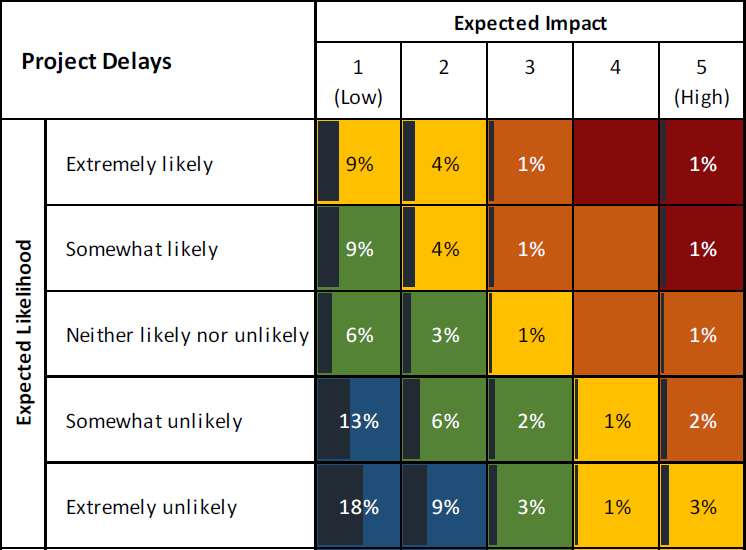
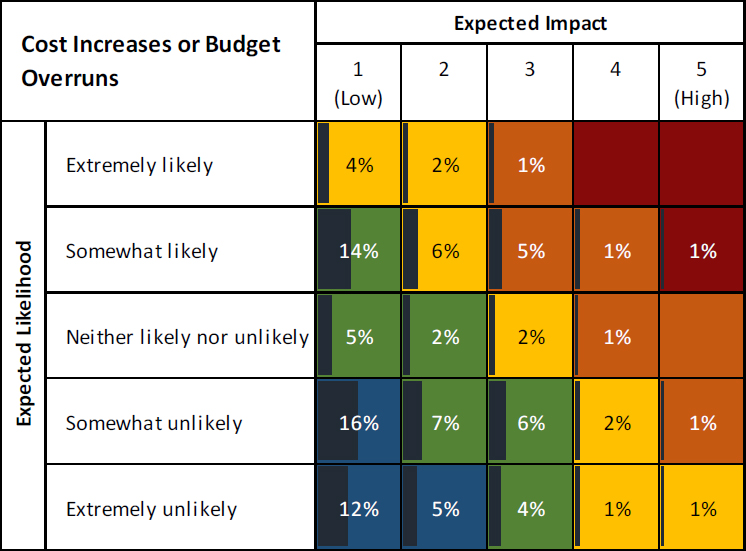
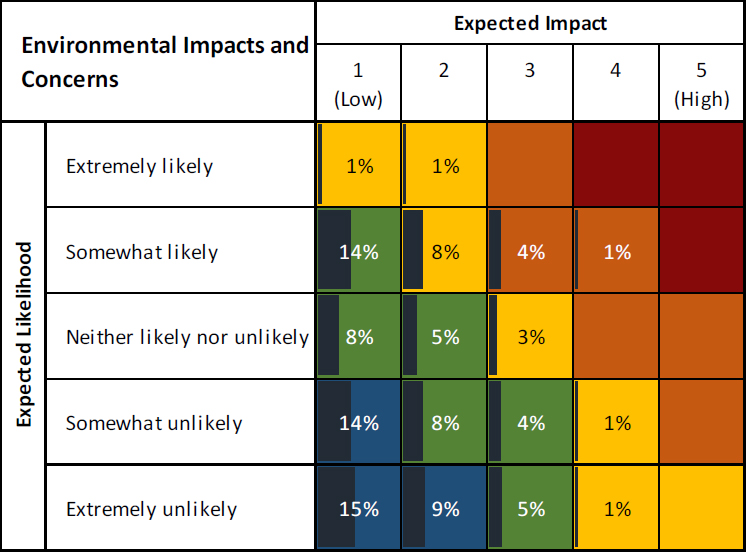
For each outcome, survey participants were asked to identify the likelihood of occurrence when an OOS utility is found on a highway project using the following 5-point likelihood scale:

  • Extremely unlikely.
  • Somewhat unlikely.
  • Neither likely nor unlikely.
  • Somewhat likely.
  • Extremely likely.

For each outcome, survey participants were also asked to estimate the impact when an OOS utility is found on a highway project using a 5-point impact scale, where 1=low impact and 5=high impact.

Survey participants were asked to estimate the likelihoods and impacts of OOS utility outcomes separately for the following four phases of the project development process:

  • Planning phase.
  • Design phase.
  • Construction phase.
Suggested Citation: "4 Survey Results." National Academies of Sciences, Engineering, and Medicine. 2026. Developing a Guide to Manage Out-of-Service Utility Facilities. Washington, DC: The National Academies Press. doi: 10.17226/29497.
  • Maintenance phase.

The research team gave survey participants the option of choosing which project phase(s) they provided responses for. As a result, the number of respondents for each project phase varied. Based on the responses, the research team calculated response percentages for each outcome in each phase to get an understanding of how stakeholders estimated the likelihoods and impacts of the outcomes. The research team first calculated these values for all survey participants and then calculated values separately based on responses for project owners and everyone other than project owners (i.e., utility owners, contractors, consultants, and other) to show how different participant groups differed in their estimated likelihoods and impacts.

All Respondents

Planning Phase

Survey respondents estimated that outcomes of OOS utilities in the planning phase are not likely. One-third of respondents estimated that project delays due to OOS utilities are somewhat or extremely likely at this stage. Participants estimated that changes in project scope and cost increases or budget overruns have approximately the same likelihood of occurrence. Safety issues were of least concern at this stage of the project; 11 percent of participants estimated safety issues to be somewhat or extremely likely (Figure 38).

Survey participants estimated that the impacts of outcomes related to OOS utilities in the planning phase are low. Constraints in right-of-way availability had the highest estimated impact. However, using the scale where 1=low impact and 5=high impact, 17 percent of survey participants ranked the potential impact of OOS utilities on constraints in right-of-way availability as 4 or higher. Most participants estimated the impacts of all potential outcomes as 1 or 2 in the planning phase (Figure 39).
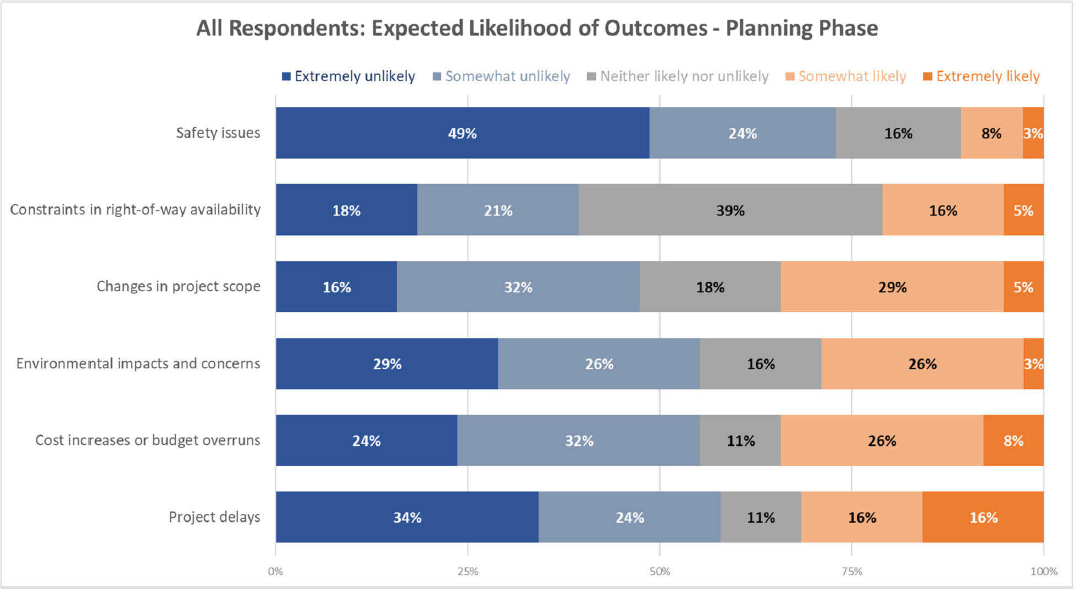
Suggested Citation: "4 Survey Results." National Academies of Sciences, Engineering, and Medicine. 2026. Developing a Guide to Manage Out-of-Service Utility Facilities. Washington, DC: The National Academies Press. doi: 10.17226/29497.
Design Phase

Survey respondents estimated the likelihoods of outcomes when an OOS utility is found in the design phase of a highway project (Figure 40). Compared to the estimates for the planning phase, participants estimated that all outcomes are slightly more likely to occur, with two exceptions. Changes in project scope and project delays were estimated overall to be as likely to occur in the design phase as the planning phase. Constraints in right-of-way availability was the one outcome estimated to be more likely to occur than not in the design phase.

Survey participants estimated that the impacts of outcomes related to an OOS utility that is found in the design phase of a highway project are higher than in the planning phase (Figure 41). Although the impacts of all outcomes were estimated to be higher than in the planning phase, using the scale where 1=low impact and 5=high impact, all outcomes were estimated to have a mean impact of 2 or lower. The outcome with the highest estimated impact in the design phase was constraints in right-of-way availability.
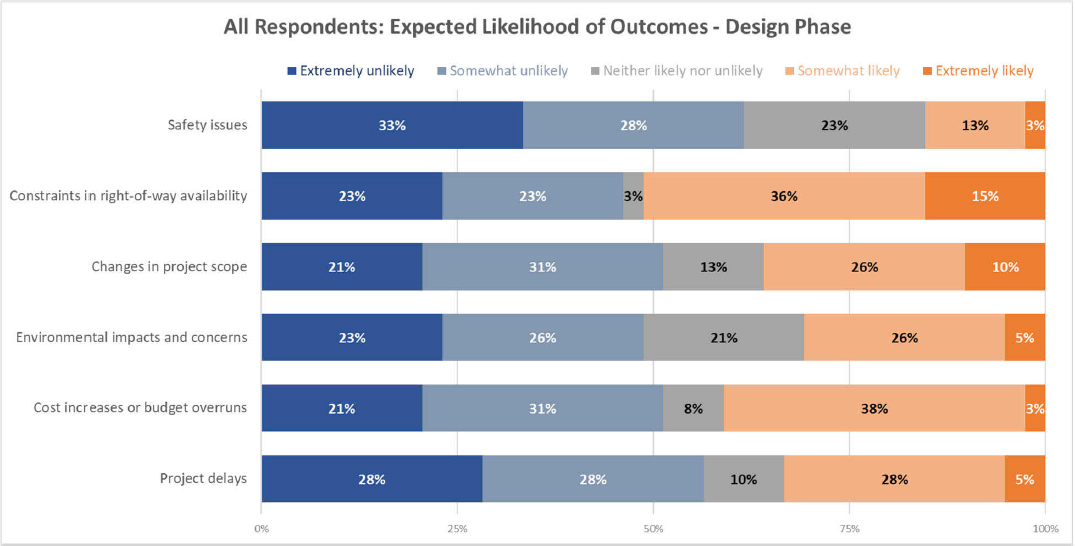
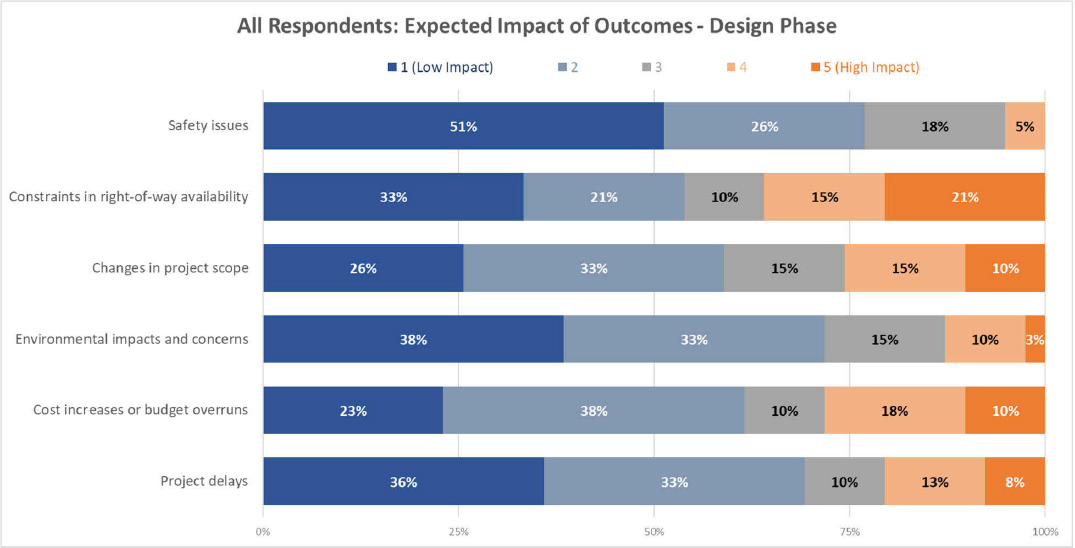
The x-axis shows percentages from 0 percent to 100 percent in increments of 25. The y-axis includes safety issues, constraints in right-of-way availability, changes in project scope, environmental impacts and concerns, cost increases or budget overruns, and project delays. Dark blue indicates extremely unlikely, light blue indicates somewhat unlikely, gray indicates neither likely nor unlikely, light orange indicates somewhat likely, and dark orange indicates extremely likely. The data given in the bar graph are as follows: Safety issues: Extremely unlikely: 33 percent, somewhat unlikely: 28 percent, neither likely nor unlikely: 23 percent, somewhat likely: 13 percent, extremely likely: 3 percent. Constraints in right-of-way availability: Extremely unlikely: 23 percent, somewhat unlikely: 23 percent, neither likely nor unlikely: 3 percent, somewhat likely: 36 percent, extremely likely: 15 percent. Changes in project scope: Extremely unlikely: 21 percent, somewhat unlikely: 31 percent, neither likely nor unlikely: 13 percent, somewhat likely: 26 percent, extremely likely: 10 percent. Environmental impacts and concerns: Extremely unlikely: 23 percent, somewhat unlikely: 26 percent, neither likely nor unlikely: 21 percent, somewhat likely: 26 percent, extremely likely: 5 percent. Cost increases or budget overruns: Extremely unlikely: 21 percent, somewhat unlikely: 31 percent, neither likely nor unlikely: 8 percent, somewhat likely: 38 percent, extremely likely: 3 percent. Project delays: Extremely unlikely: 28 percent, somewhat unlikely: 28 percent, neither likely nor unlikely: 10 percent, somewhat likely: 28 percent, extremely likely: 5 percent. The number of respondents is 39, and the values are accurate.
Figure 40. All Respondents: Expected Likelihoods of Outcomes in the Design Phase (39 Respondents).
Suggested Citation: "4 Survey Results." National Academies of Sciences, Engineering, and Medicine. 2026. Developing a Guide to Manage Out-of-Service Utility Facilities. Washington, DC: The National Academies Press. doi: 10.17226/29497.
The x-axis shows percentages from 0 percent to 100 percent in increments of 25. The y-axis includes safety issues, constraints in right-of-way availability, changes in project scope, environmental impacts and concerns, cost increases or budget overruns, and project delays. Dark blue indicates 1 (low impact), light blue indicates 2, gray indicates 3, light orange indicates 4, and dark orange indicates 5 (high impact). The data given in the bar graph are as follows: Safety issues: 1 (low impact): 51 percent, 2: 26 percent, 3: 18 percent, 4: 5 percent. Constraints in right-of-way availability: 1: 33 percent, 2: 21 percent, 3: 10 percent, 4: 15 percent, 5: 21 percent. Changes in project scope: 1: 26 percent, 2: 33 percent, 3: 15 percent, 4: 15 percent, 5: 10 percent. Environmental impacts and concerns: 1: 38 percent, 2: 33 percent, 3: 15 percent, 4: 10 percent, 5: 3 percent. Cost increases or budget overruns: 1: 23 percent, 2: 38 percent, 3: 10 percent, 4: 18 percent, 5: 10 percent. Project delays: 1: 36 percent, 2: 33 percent, 3: 10 percent, 4: 13 percent, 5: 8 percent. The number of respondents is 39, and the values are accurate.
Figure 41. All Respondents: Expected Impacts of Outcomes in the Design Phase (39 Respondents).
Construction Phase

Survey respondents estimated the likelihoods of outcomes when an OOS utility is found in the construction phase of a highway project to be much higher than in the design phase (Figure 42). In the construction phase, participants rated all outcomes to be more likely than not to occur. Nearly all participants (94 percent) estimated that project delays are somewhat or extremely likely to occur when an OOS utility is found in the construction phase. Similarly, 92 percent of participants estimated that cost increases or budget overruns are somewhat or extremely likely to occur in the construction phase. For all other outcomes, 49 to 65 percent of all participants estimated their occurrence to be somewhat or extremely likely.

Survey participants estimated that the impacts of outcomes related to an OOS utility that is found in the construction phase of a highway project are much higher than in the planning or design phases (Figure 43). Using the scale where 1=low impact and 5=high impact, all outcomes were estimated to have a mean impact score above 3. Participants estimated that project delays would have the highest impact, with 73 percent of respondents estimating an impact of 4 or 5.
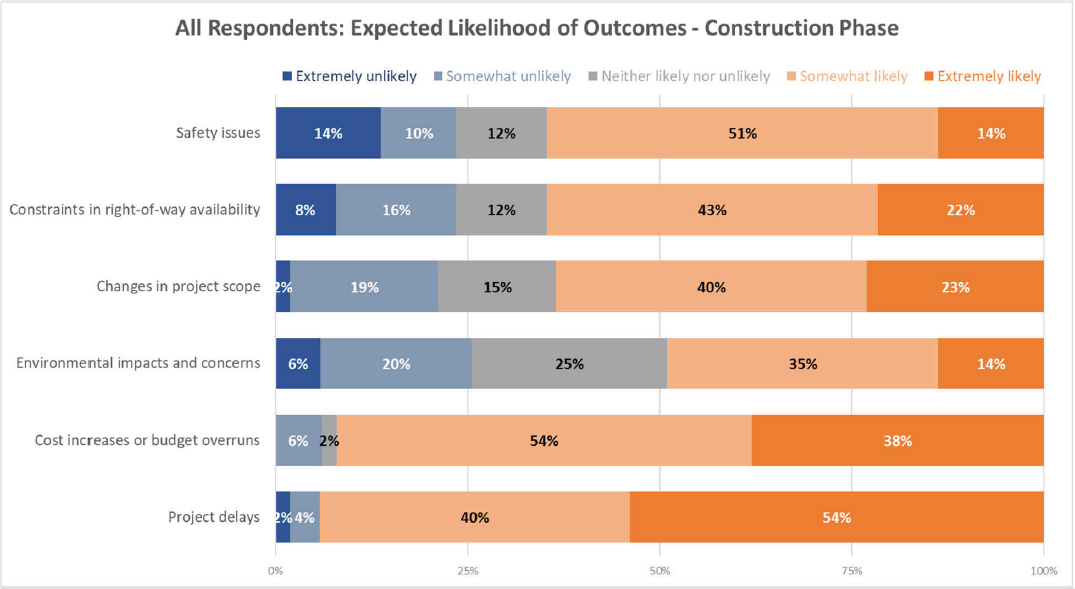
Suggested Citation: "4 Survey Results." National Academies of Sciences, Engineering, and Medicine. 2026. Developing a Guide to Manage Out-of-Service Utility Facilities. Washington, DC: The National Academies Press. doi: 10.17226/29497.
Maintenance Phase

Survey respondents estimated the likelihoods of outcomes when an OOS utility is found in the maintenance phase of a highway project to be higher than in the design phase of a project (Figure 44). However, the likelihoods of outcomes were estimated overall to be lower than in the construction phase of a project, with one exception. Participants estimated safety issues to be more likely in the construction phase. In the maintenance phase, participants estimated all outcomes to be more likely than not to occur.

Survey participants estimated that the impacts of outcomes related to an OOS utility that is found in the maintenance phase of a highway project are higher than in the design phase (Figure 45). Compared to the construction phase of a project, estimated impacts of outcomes were expected to be lower. Using the scale where 1=low impact and 5=high impact, the mean impact scores ranged from 2.8 to 3.7. Participants estimated that safety issues would have the highest impact, with 69 percent of respondents estimating an impact of 4 or 5.
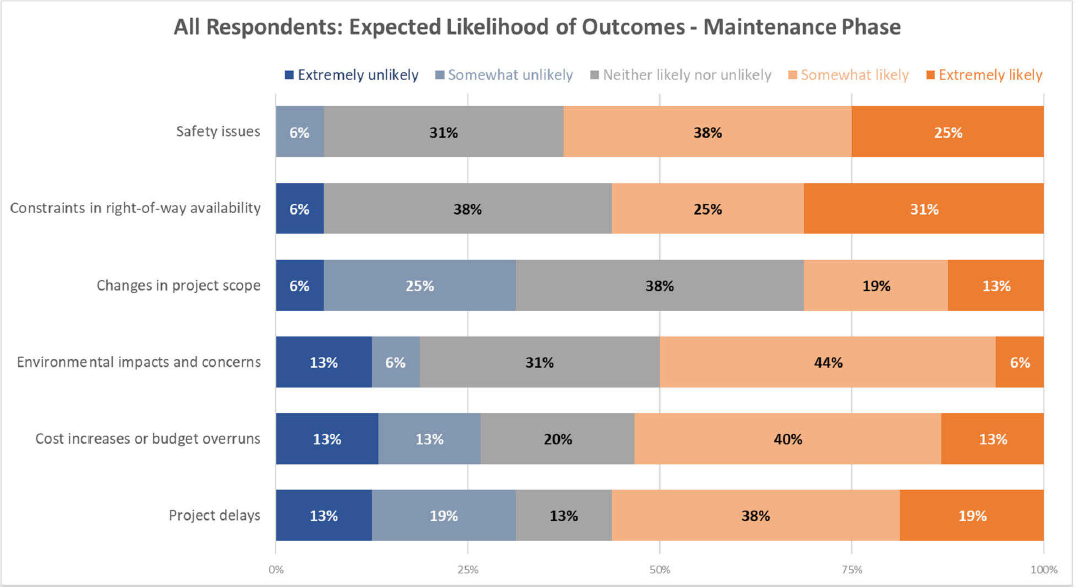
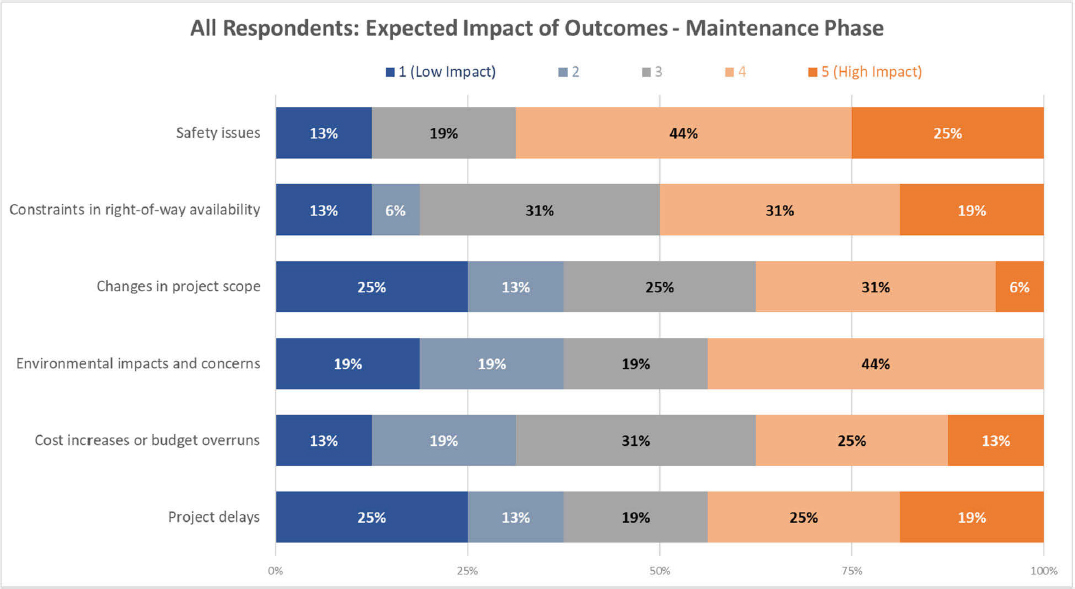
The x-axis shows percentages from 0 percent to 100 percent in increments of 25. The y-axis includes safety issues, constraints in right-of-way availability, changes in project scope, environmental impacts and concerns, cost increases or budget overruns, and project delays. Dark blue indicates extremely unlikely, light blue indicates somewhat unlikely, gray indicates neither likely nor unlikely, light orange indicates somewhat likely, and dark orange indicates extremely likely. The data given in the bar graph are as follows: Safety issues: Somewhat unlikely: 6 percent, neither likely nor unlikely: 31 percent, somewhat likely: 38 percent, extremely likely: 25 percent. Constraints in right-of-way availability: Extremely unlikely: 6 percent, neither likely nor unlikely: 38 percent, somewhat likely: 25 percent, extremely likely: 31 percent. Changes in project scope: Extremely unlikely: 6 percent, somewhat unlikely: 25 percent, neither likely nor unlikely: 38 percent, somewhat likely: 19 percent, extremely likely: 13 percent. Environmental impacts and concerns: Extremely unlikely: 13 percent, somewhat unlikely: 6 percent, neither likely nor unlikely: 31 percent, somewhat likely: 44 percent, extremely likely: 6 percent. Cost increases or budget overruns: Extremely unlikely: 13 percent, somewhat unlikely: 13 percent, neither likely nor unlikely: 20 percent, somewhat likely: 40 percent, extremely likely: 13 percent. Project delays: Extremely unlikely: 13 percent, somewhat unlikely: 19 percent, neither likely nor unlikely: 13 percent, somewhat likely: 38 percent, extremely likely: 19 percent. The number of respondents is 16, and the values are accurate.
Figure 44. All Respondents: Expected Likelihoods of Outcomes in the Maintenance Phase (16 Respondents).
Suggested Citation: "4 Survey Results." National Academies of Sciences, Engineering, and Medicine. 2026. Developing a Guide to Manage Out-of-Service Utility Facilities. Washington, DC: The National Academies Press. doi: 10.17226/29497.
The x-axis shows percentages from 0 percent to 100 percent in increments of 25. The y-axis includes safety issues, constraints in right-of-way availability, changes in project scope, environmental impacts and concerns, cost increases or budget overruns, and project delays. Dark blue indicates 1 (low impact), light blue indicates 2, gray indicates 3, light orange indicates 4, and dark orange indicates 5 (high impact). The data given in the bar graph are as follows: Safety issues: 1 (low impact): 13 percent, 3: 19 percent, 4: 44 percent, 5 (high impact): 25 percent. Constraints in right-of-way availability: 1: 13 percent, 2: 6 percent, 3: 31 percent, 4: 31 percent, 5: 19 percent. Changes in project scope: 1: 25 percent, 2: 13 percent, 3: 25 percent, 4: 31 percent, 5: 6 percent. Environmental impacts and concerns: 1: 19 percent, 2: 19 percent, 3: 19 percent, 4: 44 percent. Cost increases or budget overruns: 1: 13 percent, 2: 19 percent, 3: 31 percent, 4: 25 percent, 5: 13 percent. Project delays: 1: 25 percent, 2: 13 percent, 3: 19 percent, 4: 25 percent, 5: 19 percent. The number of respondents is 16, and the values are accurate.
Figure 45. All Respondents: Expected Impacts of Outcomes in the Maintenance Phase (16 Respondents).

Project Owners

Planning Phase

Project owners estimated slightly lower likelihoods of outcomes when an OOS utility is found in the planning phase of a project than all respondents combined, with one exception (Figure 46). Project owners estimated a slightly higher likelihood of environmental impacts and concerns than all respondents combined.

Similarly, project owners also estimated slightly lower impacts of outcomes when an OOS utility is found in the planning phase of a project than all respondents, with one exception (Figure 47). Project owners again estimated a higher impact of environmental impacts and concerns than all respondents combined.

Design Phase

Project owners estimated slightly higher likelihoods of outcomes when an OOS utility is found in the design phase of a project than all respondents combined (Figure 48). No exceptions were observed in these responses.

Conversely, project owners estimated slightly lower impacts of outcomes when an OOS utility is found in the design phase of a project than all respondents combined (Figure 49). Again, no exceptions were observed in these responses.
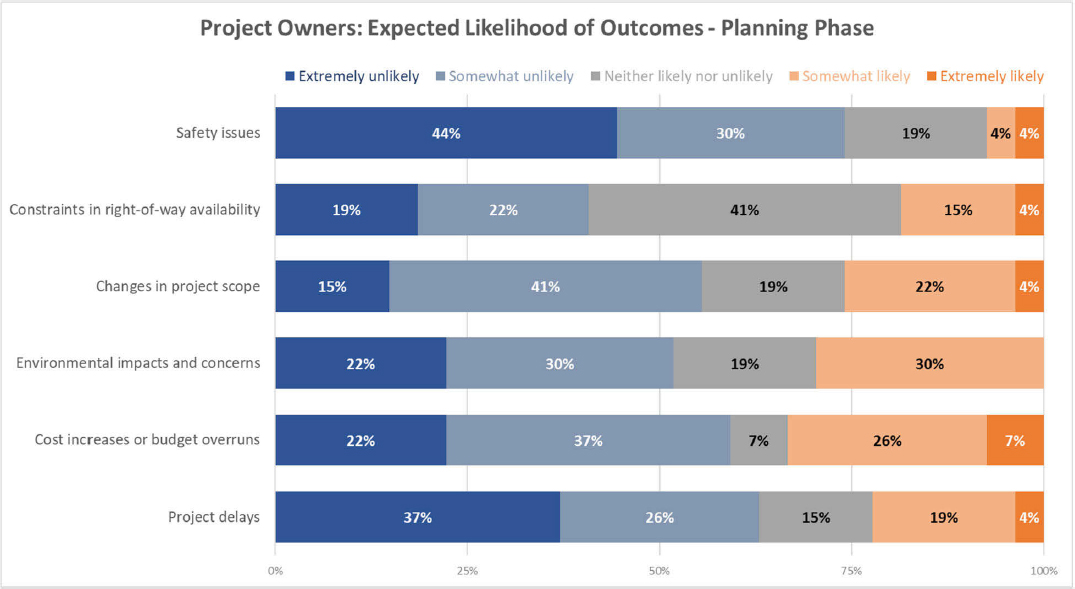
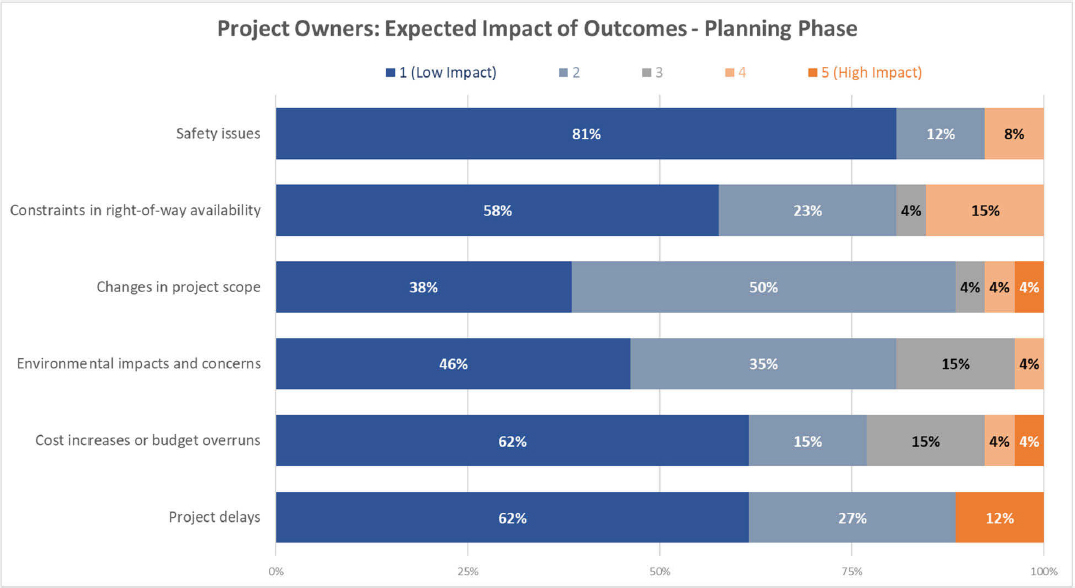
Suggested Citation: "4 Survey Results." National Academies of Sciences, Engineering, and Medicine. 2026. Developing a Guide to Manage Out-of-Service Utility Facilities. Washington, DC: The National Academies Press. doi: 10.17226/29497.
Construction Phase

Project owners estimated slightly lower likelihoods of outcomes when an OOS utility is found in the construction phase of a project than all respondents combined, with one exception (Figure 50). Project owners estimated a slightly higher likelihood of cost increases or budget overruns than all respondents combined.

Project owners also estimated slightly lower impacts of outcomes when an OOS utility is found in the construction phase of a project than all respondents combined (Figure 51). No exceptions were observed in these results.

Maintenance Phase

Project owners estimated slightly lower likelihoods of outcomes when an OOS utility is found in the maintenance phase of a project than all respondents combined, with one exception (Figure 52). Project owners estimated a slightly higher likelihood of safety issues than all respondents combined.

Similarly, project owners estimated slightly lower impacts of outcomes when an OOS utility is found in the maintenance phase of a project than all respondents combined, with two exceptions (Figure 53). Project owners estimated higher impacts of safety issues and constraints in right-of-way availability than all respondents combined.
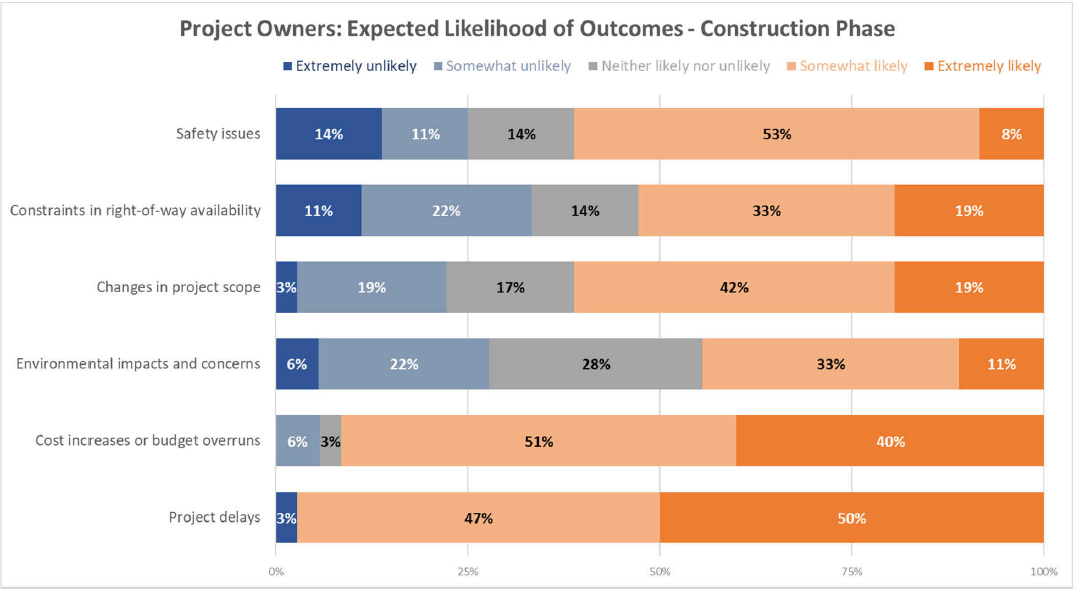
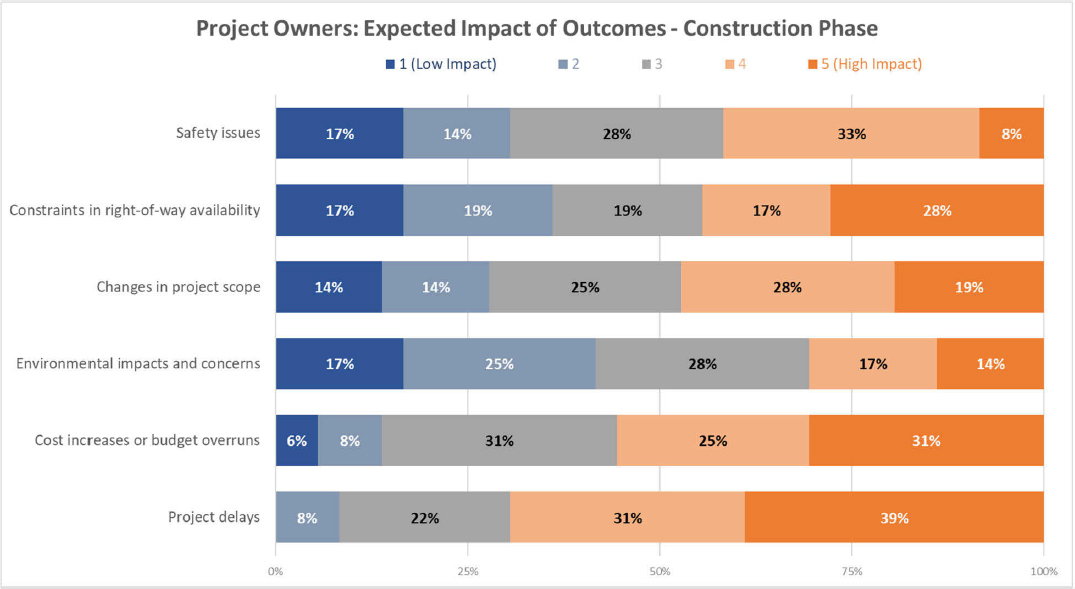
The x-axis shows percentages from 0 percent to 100 percent in increments of 25. The y-axis includes safety issues, constraints in right-of-way availability, changes in project scope, environmental impacts and concerns, cost increases or budget overruns, and project delays. Dark blue indicates extremely unlikely, light blue indicates somewhat unlikely, gray indicates neither likely nor unlikely, light orange indicates somewhat likely, and dark orange indicates extremely likely. The data given in the bar graph are as follows: Safety issues: Extremely unlikely: 14 percent, somewhat unlikely: 11 percent, neither likely nor unlikely: 14 percent, somewhat likely: 53 percent, extremely likely: 8 percent. Constraints in right-of-way availability: Extremely unlikely: 11 percent, somewhat unlikely: 22 percent, neither likely nor unlikely: 14 percent, somewhat likely: 33 percent, extremely likely: 19 percent. Changes in project scope: Extremely unlikely: 3 percent, somewhat unlikely: 19 percent, neither likely nor unlikely: 17 percent, somewhat likely: 42 percent, extremely likely: 19 percent. Environmental impacts and concerns: Extremely unlikely: 6 percent, somewhat unlikely: 22 percent, neither likely nor unlikely: 28 percent, somewhat likely: 33 percent, extremely likely: 11 percent. Cost increases or budget overruns: Somewhat unlikely: 6 percent, neither likely nor unlikely: 3 percent, somewhat likely: 51 percent, extremely likely: 40 percent. Project delays: Extremely unlikely: 3 percent, somewhat likely: 47 percent, extremely likely: 50 percent. The number of respondents is 36, and the values are accurate.
Figure 50. Project Owners: Expected Likelihoods of Outcomes in the Construction Phase (36 Respondents).
Suggested Citation: "4 Survey Results." National Academies of Sciences, Engineering, and Medicine. 2026. Developing a Guide to Manage Out-of-Service Utility Facilities. Washington, DC: The National Academies Press. doi: 10.17226/29497.
The x-axis shows percentages from 0 percent to 100 percent in increments of 25. The y-axis includes safety issues, constraints in right-of-way availability, changes in project scope, environmental impacts and concerns, cost increases or budget overruns, and project delays. Dark blue indicates 1 (low impact), light blue indicates 2, gray indicates 3, light orange indicates 4, and dark orange indicates 5 (high impact). The data given in the bar graph are as follows: Safety issues: 1 (low impact): 10 percent, 3: 20 percent, 4: 40 percent, 5 (high impact): 30 percent. Constraints in right-of-way availability: 1: 10 percent, 2: 10 percent, 3: 30 percent, 4: 20 percent, 5: 30 percent. Changes in project scope: 1: 30 percent, 2: 20 percent, 3: 10 percent, 4: 30 percent, 5: 10 percent. Environmental impacts and concerns: 1: 20 percent, 2: 20 percent, 3: 30 percent, 4: 30 percent. Cost increases or budget overruns: 1: 10 percent, 2: 20 percent, 3: 40 percent, 4: 20 percent, 5: 10 percent. Project delays: 1: 30 percent, 2: 20 percent, 3: 20 percent, 4: 20 percent, 5: 10 percent. The number of respondents is 10, and the values are accurate.
Figure 53. Project Owners: Expected Impacts of Outcomes in the Maintenance Phase (10 Respondents).

Other than Project Owners

Planning Phase

Respondents other than project owners (utility owners, consultants, contractors, and other) estimated higher likelihoods of outcomes when an OOS utility is found in the planning phase of a project than project owners, with one exception (Figure 54). Respondents other than property owners estimated a lower likelihood of environmental impacts and concerns than project owners.

Respondents other than property owners also estimated higher impacts of outcomes when an OOS utility is found in the planning phase of a project than project owners, with one exception (Figure 55). Respondents other than project owners estimated a lower impact of environmental impacts and concerns than project owners.

Design Phase

Respondents other than project owners estimated lower likelihoods of outcomes when an OOS utility is found in the design phase of a project than project owners, with two exceptions (Figure 56). Respondents other than project owners estimated higher likelihoods of project delays and cost increases or budget overruns than project owners.

Conversely, respondents other than project owners estimated higher impacts of outcomes when an OOS utility is found in the design phase of a project than project owners, with one exception (Figure 57). Respondents other than project owners estimated a lower impact of safety issues than project owners.
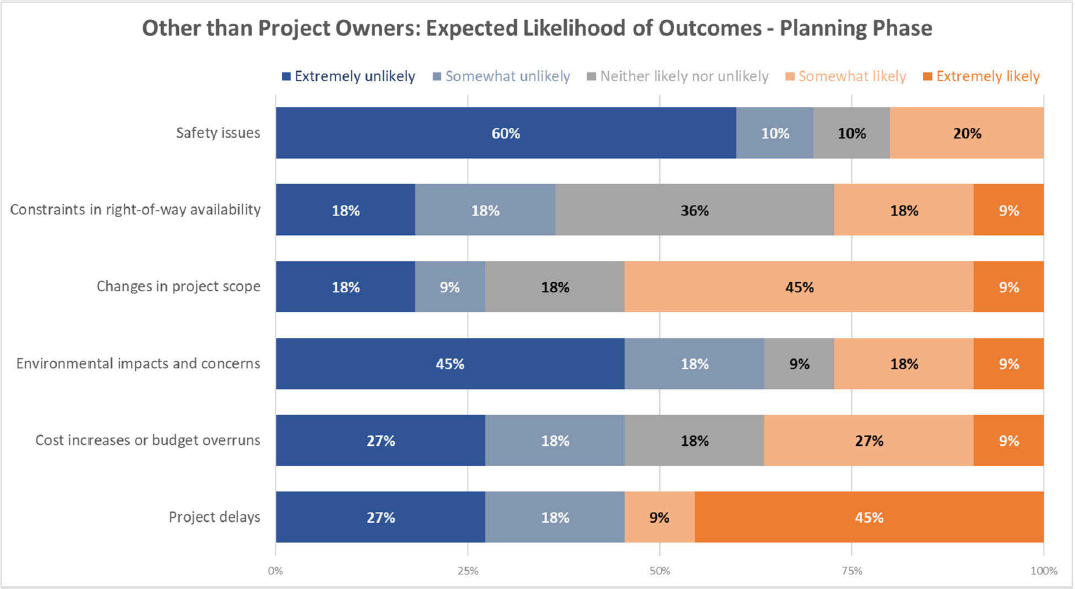
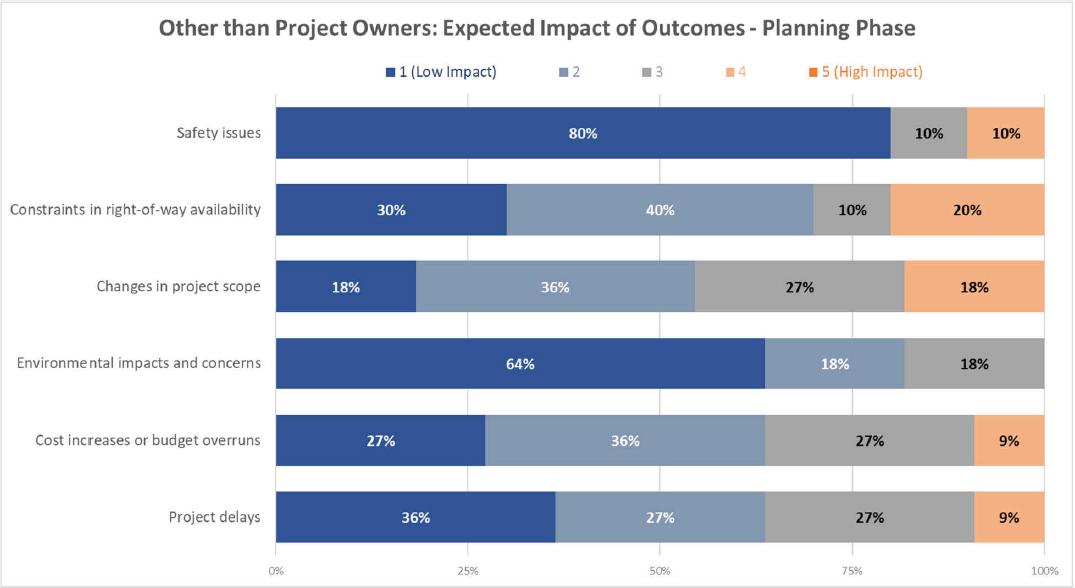
Suggested Citation: "4 Survey Results." National Academies of Sciences, Engineering, and Medicine. 2026. Developing a Guide to Manage Out-of-Service Utility Facilities. Washington, DC: The National Academies Press. doi: 10.17226/29497.
Construction Phase

Respondents other than project owners estimated higher likelihoods of outcomes when an OOS utility is found in the construction phase of a project than project owners, with one exception (Figure 58). Respondents other than project owners estimated a lower likelihood of cost increases or budget overruns than project owners.

Similarly, respondents other than project owners estimated much higher impacts of outcomes when an OOS utility is found in the construction phase of a project than project owners (Figure 59). No exceptions were observed in these results.

Maintenance Phase

Consistent with all other stakeholder types, respondents other than project owners were asked to estimate the likelihoods of outcomes when an OOS utility is found in the maintenance phase of a project and to estimate the related impacts of these outcomes. Despite the research team’s efforts to gather this information, an insufficient number of responses was received, preventing the subsequent analysis and reporting of findings related to likelihoods and impacts of outcomes in the maintenance phase.
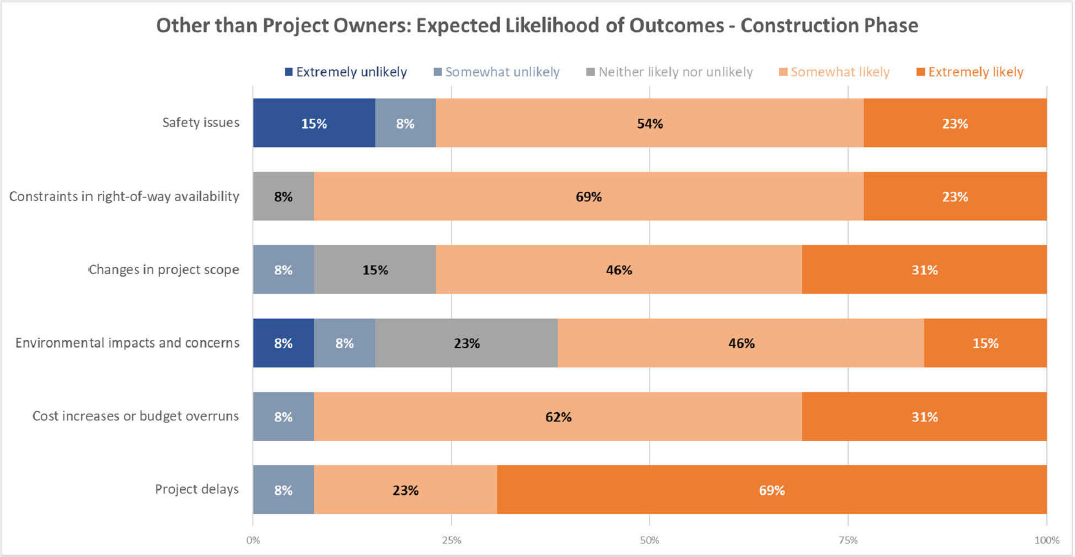
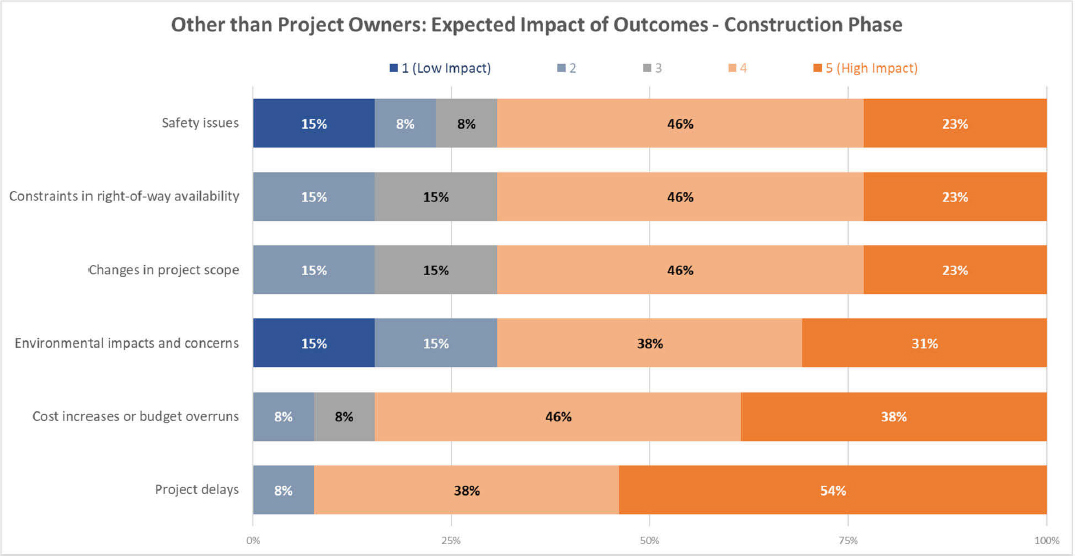
The x-axis shows percentages from 0 percent to 100 percent in increments of 25. The y-axis includes safety issues, constraints in right-of-way availability, changes in project scope, environmental impacts and concerns, cost increases or budget overruns, and project delays. Dark blue indicates extremely unlikely, light blue indicates somewhat unlikely, gray indicates neither likely nor unlikely, light orange indicates somewhat unlikely, and dark orange indicates extremely likely. The data given in the bar graph are as follows: Safety issues: Extremely unlikely: 15 percent, somewhat unlikely: 8 percent, somewhat likely: 54 percent, extremely likely: 23 percent. Constraints in right-of-way availability: Neither likely nor unlikely: 8 percent, somewhat likely: 69 percent, and extremely likely: 23 percent. Changes in project scope: Somewhat unlikely: 8 percent, neither likely nor unlikely: 15 percent, somewhat likely: 46 percent, extremely likely: 31 percent. Environmental impacts and concerns: Extremely unlikely: 8 percent, somewhat unlikely: 8 percent, neither likely nor unlikely: 23 percent, somewhat likely: 46 percent, extremely likely: 15 percent. Cost increases or budget overruns: Somewhat unlikely: 8 percent, somewhat likely: 62 percent, extremely likely: 31 percent. Project delays: Somewhat unlikely: 8 percent, somewhat likely: 23 percent, extremely likely: 69 percent. The number of respondents is 13, and the values are accurate.
Figure 58. Other than Project Owners: Expected Likelihoods of Outcomes in the Construction Phase (13 Respondents).
Suggested Citation: "4 Survey Results." National Academies of Sciences, Engineering, and Medicine. 2026. Developing a Guide to Manage Out-of-Service Utility Facilities. Washington, DC: The National Academies Press. doi: 10.17226/29497.
The x-axis shows percentages from 0 percent to 100 percent in increments of 25. The y-axis includes safety issues, constraints in right-of-way availability, changes in project scope, environmental impacts and concerns, cost increases or budget overruns, and project delays. Dark blue indicates 1 (low impact), light blue indicates 2, gray indicates 3, light orange indicates 4, and dark orange indicates 5 (high impact). The data given in the bar graph are as follows: Safety issues: 1 (low impact): 15 percent, 2: 8 percent, 3: 8 percent, 4: 46 percent, 5 (high impact): 23 percent. Constraints in right-of-way availability: 2: 15 percent, 3: 15 percent, 4: 46 percent, 5: 23 percent. Changes in project scope: 2: 15 percent, 3: 15 percent, 4: 46 percent, 5: 23 percent. Environmental impacts and concerns: 1: 15 percent, 2: 15 percent, 4: 38 percent, 5: 31 percent. Cost increases or budget overruns: 2: 8 percent, 3: 8 percent, 4: 46 percent, 5: 38 percent. Project delays: 2: 8 percent, 4: 38 percent, 5: 54 percent. The number of respondents is 13, and the values are accurate.
Figure 59. Other than Project Owners: Expected Impacts of Outcomes in the Construction Phase (13 Respondents).

Risk Analysis

Based on the responses from the survey participants regarding the expected likelihoods and impacts of outcomes when an OOS utility is found, the research team calculated the risk of each outcome in each project phase using a risk matrix (Figure 60).

The matrix has two columns and one row. The column headers are outcome and expected impact, further divided into five sub-columns. The sub-columns range from 1 to 5, with 1 being low and 5 being high. The row header is expected likelihood, which is also divided into five sub-rows. The sub-rows scale from extremely likely to extremely unlikely. Each cell is color-coded to indicate risk levels: blue indicates low risk, green indicates moderate-low risk, yellow indicates moderate risk, orange indicates moderate-high risk, and dark red indicates high risk. The row-wise data given for each expected impact are as follows: Sub-row 1: Extremely likely: yellow, yellow, orange, dark red, and dark red. Sub-row 2: Somewhat likely: green, yellow, orange, orange, and dark red. Sub-row 3: Neither likely nor unlikely: green, green, yellow, orange, and orange. Sub-row 4: Somewhat unlikely: blue, green, green, yellow, and orange. Sub-row 5: Extremely unlikely: blue, blue, green, yellow, and yellow.
Figure 60. Risk Matrix.
Suggested Citation: "4 Survey Results." National Academies of Sciences, Engineering, and Medicine. 2026. Developing a Guide to Manage Out-of-Service Utility Facilities. Washington, DC: The National Academies Press. doi: 10.17226/29497.

The risk matrix consisted of 25 potential risk options, reflecting a combination of the likelihood and the impact of an outcome as estimated by the survey respondents. The research team assigned a relative project risk for each combination of estimated likelihood and impact, ranging from very low to very high. For example, an outcome estimated as extremely unlikely with an estimated impact of 1 was assigned a very low relative project risk.

To develop the respective risk matrices for each stakeholder type and project phase, the research team calculated each risk option value by multiplying the number of responses for a particular likelihood rating and the number of responses for a particular impact rating and then dividing that number by the sum for all risk options. The development of these risk matrices allowed the research team to map the survey participants’ estimated risk for each potential OOS utility outcome in each project phase. Each risk matrix shows the percentage of respondents that chose one of the 25 risk options. As a result, the higher the percentage value for a risk option, the higher the agreement among survey respondents about the risk of an OOS utility outcome during a project development phase.

For each risk matrix, the research team also calculated an overall risk score by summing the risk option values for each relative project risk rating, multiplying this sum by a risk scaling factor ranging from 1=very low risk to 5=very high risk, summing these products, and dividing this sum by the previous sum of unscaled values. This calculation resulted in an overall risk score ranging from 1.0=very low risk to 5.0=very high risk.

The color scheme used in the risk matrix (Figure 60) was based on the color scheme used in the relative project risk scale (Figure 61). Risk options that have the same color therefore have the same assigned relative project risk.
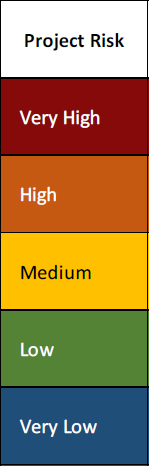
The color scale is arranged vertically with five color-coded cells stacked from top to bottom, each labeled with a risk level. The data given top to bottom are as follows: very high is represented by dark red, high is represented by orange, medium is represented by yellow, low is represented by green, and very low is represented by dark blue.
Figure 61. Project Risk Scale and Color Code.

The remainder of this section first discusses the estimated risks of OOS utility outcomes as estimated by all survey respondents and then contrasts these findings with the estimated risks of OOS utility outcomes as estimated by different stakeholder types (project owners and other than project owners).

Suggested Citation: "4 Survey Results." National Academies of Sciences, Engineering, and Medicine. 2026. Developing a Guide to Manage Out-of-Service Utility Facilities. Washington, DC: The National Academies Press. doi: 10.17226/29497.

All Respondents

Planning Phase

Table 12 shows the calculated risk score for each outcome when an OOS utility is found in the planning phase of a highway construction project, based on responses from all survey participants. Figure 62 through Figure 67 present the risk matrices with calculated risk values for each of these six outcomes, respectively, based again on estimates from all respondents. Consistent with the survey responses for the planning phase, each outcome had a low calculated risk that ranged from 1.5 (safety issues) to 2.2 (changes in project scope).

Table 12. All Respondents: Risk Scores for Outcomes in the Planning Phase.

Outcome Risk Score
Project Delays 2.0
Cost Increases or Budget Overruns 2.1
Environmental Impacts and Concerns 1.9
Changes in Project Scope 2.2
Constraints in Right-of-Way Availability 2.2
Safety Issues 1.5
The chart has two columns and one row. The column headers are Project Delays and Expected Impact, further divided into five subcolumns. The subcolumns range from 1 to 5, with 1 being low and 5 being high. The row header is Expected Likelihood, which is also divided into five sub-rows, which are Extremely likely, Somewhat likely, Neither likely nor unlikely, Somewhat unlikely, and Extremely unlikely. Each cell is color-coded and contains a percentage value. The row-wise data given for each expected impact are as follows: Sub-row 1: Extremely likely: 9 percent, 4 percent, 1 percent, blank (dark red), 1 percent. Sub-row 2: Somewhat likely: 9 percent, 4 percent, 1 percent, blank (orange), 1 percent. Sub-row 3: Neither likely nor unlikely: 6 percent, 3 percent, 1 percent, blank (orange), 1 percent. Sub-row 4: Somewhat unlikely: 13 percent, 6 percent, 2 percent, 1 percent, 2 percent. Sub-row 5: Extremely unlikely: 18 percent, 9 percent, 3 percent, 1 percent, 3 percent. The values are accurate.
Figure 62. All Respondents: Estimated Risks of Project Delays in the Planning Phase.
Suggested Citation: "4 Survey Results." National Academies of Sciences, Engineering, and Medicine. 2026. Developing a Guide to Manage Out-of-Service Utility Facilities. Washington, DC: The National Academies Press. doi: 10.17226/29497.
The chart has two columns and one row. The column headers are Safety and Expected Impact, further divided into five subcolumns. The subcolumns range from 1 to 5, with 1 being low and 5 being high. The row header is Expected Likelihood, which is also divided into five sub-rows, which are Extremely likely, Somewhat likely, Neither likely nor unlikely, Somewhat unlikely, and Extremely unlikely. Each cell is color-coded and contains a percentage value. The row-wise data given for each expected impact: Sub-row 1: Extremely likely: 2 percent, blank (yellow), blank (orange), blank (dark red), blank (dark red). Sub-row 2: Somewhat likely: 7 percent, 1 percent, blank (orange), 1 percent, blank (dark red). Sub-row 3: Neither likely nor unlikely: 13 percent, 1 percent, blank (yellow), 1 percent, blank (orange). Sub-row 4: Somewhat unlikely: 20 percent, 2 percent, 1 percent, 2 percent, blank (orange). Sub-row 5: Extremely unlikely: 38 percent, 4 percent, 1 percent, 4 percent, blank (yellow). The values are accurate.
Figure 67. All Respondents: Estimated Risks of Safety in the Planning Phase.
Design Phase

Table 13 shows the calculated risk score for each outcome when an OOS utility is found in the design phase of a highway construction project, based on responses from all survey participants. Figure 68 through Figure 73 present the risk matrices with calculated risk values for each of these six outcomes, respectively, based again on estimates from all respondents. Consistent with the survey responses for the design phase, each outcome had a relatively low calculated risk, with two exceptions. Cost increases or budget overruns and constraints in right-of-way availability both had medium calculated risks. The risk scores for all outcomes in the design phase were slightly higher than the risk scores in the planning phase.

Table 13. All Respondents: Risk Scores for Outcomes in the Design Phase.

Outcome Risk Score
Project Delays 2.3
Cost Increases or Budget Overruns 2.6
Environmental Impacts and Concerns 2.2
Changes in Project Scope 2.5
Constraints in Right-of-Way Availability 2.8
Safety Issues 1.8
Suggested Citation: "4 Survey Results." National Academies of Sciences, Engineering, and Medicine. 2026. Developing a Guide to Manage Out-of-Service Utility Facilities. Washington, DC: The National Academies Press. doi: 10.17226/29497.
Construction Phase

Table 14 shows the calculated risk score for each outcome when an OOS utility is found in the construction phase of a highway construction project, based on responses from all survey participants. Figure 74 through Figure 79 present the risk matrices with calculated risk values for each of these six outcomes, respectively, based again on estimates from all respondents. Safety issues and environmental impacts and concerns both had medium calculated risks. Cost increases or budget overruns, changes in project scope, and constraints in right-of-way availability all had high calculated risks. The calculated risk for project delays was very high. The risk scores for all outcomes in the construction phase were significantly higher than the risk scores in the design phase.

Table 14. All Respondents: Risk Scores for Outcomes in the Construction Phase.

Outcome Risk Score
Project Delays 4.4
Cost Increases or Budget Overruns 4.2
Environmental Impacts and Concerns 3.2
Changes in Project Scope 3.6
Constraints in Right-of-Way Availability 3.5
Safety Issues 3.4
The chart has two columns and one row. The column headers are Project Delays and Expected Impact, further divided into five subcolumns. The subcolumns range from 1 to 5, with 1 being low and 5 being high. The row header is expected likelihood, which is also divided into five sub-rows, which are Extremely likely, Somewhat likely, Neither likely nor unlikely, Somewhat unlikely, and Extremely unlikely. Each cell is color-coded and contains a percentage value. The row-wise data given for each expected impact are as follows: Sub-row 1: Extremely likely: Blank (yellow), 5 percent, 9 percent, 17 percent, 23 percent. Sub-row 2: Somewhat likely: Blank (green), 4 percent, 7 percent, 12 percent, 17 percent. Sub-row 3: Neither likely nor unlikely: Blank (green), blank (green), blank (yellow), blank (orange), blank (orange). Sub-row 4: Somewhat unlikely: Blank (blue), blank (green), 1 percent, 1 percent, 2 percent. Sub-row 5: Extremely unlikely: Blank (blue), blank (blue), blank (green), 1 percent, 1 percent. The values are accurate.
Figure 74. All Respondents: Estimated Risks of Project Delays in the Construction Phase.
Suggested Citation: "4 Survey Results." National Academies of Sciences, Engineering, and Medicine. 2026. Developing a Guide to Manage Out-of-Service Utility Facilities. Washington, DC: The National Academies Press. doi: 10.17226/29497.
The chart has two columns and one row. The column headers are Safety and Expected Impact, further divided into five subcolumns. The subcolumns range from 1 to 5, with 1 being low and 5 being high. The row header is Expected Likelihood, which is also divided into five sub-rows, which are Extremely likely, Somewhat likely, Neither likely nor unlikely, Somewhat unlikely, and Extremely unlikely. Each cell is color-coded and contains a percentage value. The row-wise data given for each expected impact are as follows: Sub-row 1: Extremely likely: 2 percent, 2 percent, 3 percent, 5 percent, 2 percent. Sub-row 2: Somewhat likely: 8 percent, 6 percent, 12 percent, 18 percent, 7 percent. Sub-row 3: Neither likely nor unlikely: 2 percent, 1 percent, 3 percent, 4 percent, 2 percent. Sub-row 4: Somewhat unlikely: 2 percent, 1 percent, 2 percent, 3 percent, 1 percent. Sub-row 5: Extremely unlikely: 2 percent, 2 percent, 3 percent, 5 percent, 2 percent. The values are accurate.
Figure 79. All Respondents: Estimated Risks of Safety in the Construction Phase.
Maintenance Phase

Table 15 shows the calculated risk score for each outcome when an OOS utility is found in the maintenance phase, based on responses from all survey participants. Figure 80 through Figure 85 present the risk matrices with calculated risk values for each of these six outcomes, based again on estimates from all respondents. Each outcome had a medium calculated risk. The risk scores for all outcomes in the maintenance phase were significantly lower than the risk scores in the construction phase but slightly higher than the risk scores in the design phase.

Table 15. All Respondents: Risk Scores for Outcomes in the Maintenance Phase.

Outcome Risk Score
Project Delays 2.7
Cost Increases or Budget Overruns 2.9
Environmental Impacts and Concerns 2.7
Changes in Project Scope 2.8
Constraints in Right-of-Way Availability 3.2
Safety Issues 3.1
Suggested Citation: "4 Survey Results." National Academies of Sciences, Engineering, and Medicine. 2026. Developing a Guide to Manage Out-of-Service Utility Facilities. Washington, DC: The National Academies Press. doi: 10.17226/29497.

Project Owners

Planning Phase

Table 16 shows the calculated risk score for each outcome when an OOS utility is found in the planning phase of a highway construction project, based on responses from only project owner participants in the survey. Figure 86 through Figure 91 present the risk matrices with calculated risk values for each of these six outcomes, based again on estimates from project owners. Consistent with the survey responses for the planning phase, each outcome had a low calculated risk that ranged from 1.5 (safety issues) to 2.1 (constraints in right-of-way availability). The risk scores based on estimates from project owners were similar or slightly lower than the risk scores based on estimates from all respondents for all outcomes.

Table 16. Project Owners: Risk Scores for Outcomes in the Planning Phase.

Outcome Risk Score
Project Delays 1.8
Cost Increases or Budget Overruns 2.0
Environmental Impacts and Concerns 2.0
Changes in Project Scope 2.0
Constraints in Right-of-Way Availability 2.1
Safety Issues 1.5
The chart has two columns and one row. The column headers are project delays and expected impact, further divided into five sub-columns. The sub-columns range from 1 to 5, with 1 being low and 5 being high. The row header is expected likelihood, which is also divided into five sub-rows. The sub-rows scale from extremely likely to extremely unlikely. Each cell is color-coded and contains percentage values. The row-wise data given for each expected impact are as follows: Sub-row 1: Extremely likely: 2 percent, 1 percent, blank (orange), blank (dark red), blank (dark red). Sub-row 2: Somewhat likely: 11 percent, 5 percent, blank (orange), blank (orange), 2 percent. Sub-row 3: Neither likely nor unlikely: 9 percent, 4 percent, blank (yellow), blank (orange), 2 percent. Sub-row 4: Somewhat unlikely: 16 percent, 7 percent, blank (green), blank (yellow), 3 percent. Sub-row 5: Extremely unlikely: 23 percent, 10 percent, blank (green), blank (yellow), 4 percent (yellow). The values are accurate.
Figure 86. Project Owners: Estimated Risks of Project Delays in the Planning Phase.
Suggested Citation: "4 Survey Results." National Academies of Sciences, Engineering, and Medicine. 2026. Developing a Guide to Manage Out-of-Service Utility Facilities. Washington, DC: The National Academies Press. doi: 10.17226/29497.
The chart has two columns and one row. The column headers are safety and expected impact, further divided into five sub-columns. The sub-columns range from 1 to 5, with 1 being low and 5 being high. The row header is expected likelihood, which is also divided into five sub-rows. The sub-rows scale from extremely likely to extremely unlikely. Each cell is color-coded and contains percentage values. The row-wise data given for each expected impact are as follows: Sub-row 1: Extremely likely: 3 percent, blank (yellow), blank (orange), blank (dark red), blank (dark red). Sub-row 2: Somewhat likely: 3 percent, blank (yellow), blank (orange), blank (orange), blank (dark red). Sub-row 3: Neither likely nor unlikely: 15 percent, 2 percent, blank (yellow), 1 percent, blank (orange). Sub-row 4: Somewhat unlikely: 24 percent, 3 percent, blank (green), 2 percent, blank (orange). Sub-row 5: Extremely unlikely: 36 percent, 5 percent, blank (green), 3 percent, blank (yellow).
Figure 91. Project Owners: Estimated Risks of Safety in the Planning Phase.
Design Phase

Table 17 shows the calculated risk score for each outcome when an OOS utility is found in the design phase of a highway construction project, based on responses from only project owner participants in the survey. Figure 92 through Figure 97 present the risk matrices with calculated risk values for each of these six outcomes, based again on estimates from project owners. Project delays, environmental impacts and concerns, and safety issues all had low calculated risks. Cost increases or budget overruns, changes in project scope, and constraints in right-of-way availability all had medium calculated risks. The risk scores based on project owner responses were slightly higher for environmental impacts and concerns, changes in project scope, and safety issues than the risk scores based on estimates from all respondents. The risk scores for the remaining three outcomes were either lower or similar.

Table 17. Project Owners: Risk Scores for Outcomes in the Design Phase.

Outcome Risk Score
Project Delays 2.1
Cost Increases or Budget Overruns 2.5
Environmental Impacts and Concerns 2.3
Changes in Project Scope 2.6
Constraints in Right-of-Way Availability 2.8
Safety Issues 1.9
Suggested Citation: "4 Survey Results." National Academies of Sciences, Engineering, and Medicine. 2026. Developing a Guide to Manage Out-of-Service Utility Facilities. Washington, DC: The National Academies Press. doi: 10.17226/29497.
Construction Phase

Table 18 shows the calculated risk score for each outcome when an OOS utility is found in the construction phase of a highway construction project, based on responses from only project owner survey participants. Figure 98 through Figure 103 present the risk matrices with calculated risk values for each of these six outcomes, based again on only project owner responses. Cost increases or budget overruns and changes in project scope both had high calculated risks. The calculated risk for project delays was very high. The remaining three outcomes each had a medium calculated risk. The risk scores based on project owner responses were slightly lower for all outcomes than the risk scores based on estimates from all respondents.

Table 18. Project Owners: Risk Scores for Outcomes in the Construction Phase.

Outcome Risk Score
Project Delays 4.4
Cost Increases or Budget Overruns 4.1
Environmental Impacts and Concerns 3.0
Changes in Project Scope 3.5
Constraints in Right-of-Way Availability 3.3
Safety Issues 3.2
The chart has two columns and one row. The column headers are project delays and expected impact, further divided into five sub-columns. The sub-columns range from 1 to 5, with 1 being low and 5 being high. The row header is expected likelihood, which is also divided into five sub-rows. The sub-rows scale from extremely likely to extremely unlikely. Each cell is color-coded and contains percentage values. The row-wise data given for each expected impact are as follows: Sub-row 1: Extremely likely: Blank (yellow), 4 percent, 11 percent, 15 percent, 19 percent. Sub-row 2: Somewhat likely: Blank (green), 4 percent, 10 percent, 14 percent, 18 percent. Sub-row 3: Neither likely nor unlikely: Blank (green), blank (green), blank (yellow), blank (orange), blank (orange). Sub-row 4: Somewhat unlikely: Blank (blue), blank (green), blank (green), blank (yellow), blank (orange). Sub-row 5: Extremely unlikely: Blank (blue), blank (blue), 1 percent, 1 percent, 1 percent. The values are accurate.
Figure 98. Project Owners: Estimated Risks of Project Delays in the Construction Phase.
Suggested Citation: "4 Survey Results." National Academies of Sciences, Engineering, and Medicine. 2026. Developing a Guide to Manage Out-of-Service Utility Facilities. Washington, DC: The National Academies Press. doi: 10.17226/29497.
The chart has two columns and one row. The column headers are safety and expected impact, further divided into five sub-columns. The sub-columns range from 1 to 5, with 1 being low and 5 being high. The row header is expected likelihood, which is also divided into five sub-rows. The sub-rows scale from extremely likely to extremely unlikely. Each cell is color-coded and contains percentage values. The row-wise data given for each expected impact are as follows: Sub-row 1: Extremely likely: 1 percent, 1 percent, 2 percent, 3 percent, 1 percent. Sub-row 2: Somewhat likely: 9 percent, 7 percent, 15 percent, 18 percent, 4 percent. Sub-row 3: Neither likely nor unlikely: 2 percent, 2 percent, 4 percent, 5 percent, 1 percent. Sub-row 4: Somewhat unlikely: 2 percent, 2 percent, 3 percent, 4 percent, 1 percent. Sub-row 5: Extremely unlikely: 2 percent, 2 percent, 4 percent, 5 percent, 1 percent. The values are accurate.
Figure 103. Project Owners: Estimated Risks of Safety in the Construction Phase.
Maintenance Phase

Table 19 shows the calculated risk score for each outcome when an OOS utility is found in the maintenance phase, based on responses from only project owner survey participants. Figure 104 through Figure 109 present the risk matrices with calculated risk values for each of these six outcomes. In the maintenance phase, safety issues had a high calculated risk, while each of the other outcomes had a medium calculated risk. The risk scores based on project owner responses were higher for all outcomes than the risk scores based on estimates from all respondents.

Table 19. Project Owners: Risk Scores for Outcomes in the Maintenance Phase.

Outcome Risk Score
Project Delays 2.8
Cost Increases or Budget Overruns 3.2
Environmental Impacts and Concerns 3.0
Changes in Project Scope 2.8
Constraints in Right-of-Way Availability 3.7
Safety Issues 4.0
Suggested Citation: "4 Survey Results." National Academies of Sciences, Engineering, and Medicine. 2026. Developing a Guide to Manage Out-of-Service Utility Facilities. Washington, DC: The National Academies Press. doi: 10.17226/29497.

Other than Project Owners

Planning Phase

Table 20 shows the calculated risk score for each outcome when an OOS utility is found in the planning phase of a highway construction project, based on responses from other than project owner survey participants (utility owners, contractors, consultants, and other). Figure 110 through Figure 115 present the risk matrices with calculated risk values for each of these six outcomes, based again on other than project owner responses. Environmental impacts and concerns, constraints in right-of-way availability, and safety issues all had low calculated risks. Each of the other outcomes had a medium risk. The risk scores based on other than project owner responses were higher than the risk scores based on project owner responses for all outcomes except environmental impacts and concerns, which was lower.

Table 20. Other than Project Owners: Risk Scores for Outcomes in the Planning Phase.

Outcome Risk Score
Project Delays 2.6
Cost Increases or Budget Overruns 2.3
Environmental Impacts and Concerns 1.7
Changes in Project Scope 2.8
Constraints in Right-of-Way Availability 2.4
Safety Issues 1.6
The chart has two columns and one row. The column headers are project delays and expected impact, further divided into five sub-columns. The sub-columns range from 1 to 5, with 1 being low and 5 being high. The row header is expected likelihood, which is also divided into five sub-rows. The sub-rows are scaled from extremely likely to extremely unlikely. Each cell is color-coded and contains percentage values. The row-wise data given for each expected impact are as follows: Sub-row 1: Extremely likely: 17 percent, 12 percent, 12 percent, 4 percent, blank (dark red). Sub-row 2: Somewhat likely: 3 percent, 2 percent, 2 percent, 1 percent, blank (dark red). Sub-row 3: Neither likely nor unlikely: Blank (green), blank (green), blank (yellow), blank (orange), blank (orange). Sub-row 4: Somewhat unlikely: 7 percent, 5 percent, 5 percent, 2 percent, blank (orange). Sub-row 5: Extremely unlikely: 10 percent, 7 percent, 7 percent, 2 percent, blank (yellow). The values are accurate.
Figure 110. Other than Project Owners: Estimated Risks of Project Delays in the Planning Phase.
Suggested Citation: "4 Survey Results." National Academies of Sciences, Engineering, and Medicine. 2026. Developing a Guide to Manage Out-of-Service Utility Facilities. Washington, DC: The National Academies Press. doi: 10.17226/29497.
The chart has two columns and one row. The column headers are safety and expected impact, further divided into five sub-columns. The sub-columns range from 1 to 5, with 1 being low and 5 being high. The row header is expected likelihood, which is also divided into five sub-rows. The sub-rows are scaled from extremely likely to extremely unlikely. Each cell is color-coded and contains percentage values. The row-wise data given for each expected impact are as follows: Sub-row 1: Extremely likely: Blank (yellow), blank (yellow), blank (orange), blank (dark red), blank (dark red). Sub-row 2: Somewhat likely: 16 percent, blank (yellow), 2 percent, 2 percent, blank (dark red). Sub-row 3: Neither likely nor unlikely: 8 percent, blank (green), 1 percent, 1 percent, blank (orange). Sub-row 4: Somewhat unlikely: 8 percent, blank (green), 1 percent, 1 percent, blank (orange). Sub-row 5: Extremely unlikely: 48 percent, blank (blue), 6 percent, 6 percent, blank (yellow). The values are accurate.
Figure 115. Other than Project Owners: Estimated Risks of Safety in the Planning Phase.
Design Phase

Table 21 shows the calculated risk score for each outcome when an OOS utility is found in the design phase of a highway construction project, based on responses from other than project owner survey participants. Figure 116 through Figure 121 present the risk matrices with calculated risk values for each of these six outcomes, based again on other than project owner responses. Safety issues and environmental impacts and concerns both had low calculated risks. Each of the other outcomes had a medium calculated risk. The risk scores based on other than project owner responses were higher for project delays and cost increases or budget overruns than the risk scores based on project owner responses. For all remaining outcomes, the risk scores based on other than project owner responses were lower than the risk scores based on project owner responses.

Table 21. Other than Project Owners: Risk Scores for Outcomes in the Design Phase.

Outcome Risk Score
Project Delays 2.8
Cost Increases or Budget Overruns 2.8
Environmental Impacts and Concerns 2.1
Changes in Project Scope 2.5
Constraints in Right-of-Way Availability 2.6
Safety Issues 1.5
Suggested Citation: "4 Survey Results." National Academies of Sciences, Engineering, and Medicine. 2026. Developing a Guide to Manage Out-of-Service Utility Facilities. Washington, DC: The National Academies Press. doi: 10.17226/29497.
Construction Phase

Table 22 shows the calculated risk score for each outcome when an OOS utility is found in the construction phase of a highway construction project, based on responses from other than project owner survey participants. Figure 122 through Figure 127 present the risk matrices with calculated risk values for each of these six outcomes. Cost increases or budget overruns and changes in project scope both had high calculated risks. The calculated risk for project delays was very high. The remaining outcomes each had a medium risk. The risk scores based on other than project owner responses were slightly lower than the risk scores based on project owner responses for all outcomes.

Table 22. Other than Project Owners: Risk Scores for Outcomes in the Construction Phase.

Outcome Risk Score
Project Delays 4.7
Cost Increases or Budget Overruns 4.4
Environmental Impacts and Concerns 3.6
Changes in Project Scope 4.0
Constraints in Right-of-Way Availability 4.1
Safety Issues 3.7
The chart has two columns and one row. The column headers are project delays and expected impact, further divided into five sub-columns. The sub-columns range from 1 to 5, with 1 being low and 5 being high. The row header is expected likelihood, which is also divided into five sub-rows. The sub-rows are scaled from extremely likely to extremely unlikely. Each cell is color-coded and contains percentage values. The row-wise data given for each expected impact are as follows: Sub-row 1: Extremely likely: Blank (yellow), 5 percent, blank (orange), 27 percent, 37 percent. Sub-row 2: Somewhat likely: Blank (green), 2 percent, blank (orange), 9 percent, 12 percent. Sub-row 3: Neither likely nor unlikely: Blank (green), blank (green), blank (yellow), blank (orange), blank (orange). Sub-row 4: Somewhat unlikely: Blank (blue), 1 percent, blank (green), 3 percent, 4 percent. Sub-row 5: Extremely unlikely: Blank (blue), blank (blue), blank (green), blank (yellow), blank (yellow). The values are accurate.
Figure 122. Other than Project Owners: Estimated Risks of Project Delays in the Construction Phase.
Suggested Citation: "4 Survey Results." National Academies of Sciences, Engineering, and Medicine. 2026. Developing a Guide to Manage Out-of-Service Utility Facilities. Washington, DC: The National Academies Press. doi: 10.17226/29497.
The chart has two columns and one row. The column headers are safety and expected impact, further divided into five sub-columns. The sub-columns range from 1 to 5, with 1 being low and 5 being high. The row header is expected likelihood, which is also divided into five sub-rows. The sub-rows are scaled from extremely likely to extremely unlikely. Each cell is color-coded and contains percentage values. The row-wise data given for each expected impact are as follows: Sub-row 1: Extremely likely: 4 percent, 2 percent, 2 percent, 11 percent, 5 percent. Sub-row 2: Somewhat likely: 8 percent, 4 percent, 4 percent, 25 percent, 12 percent. Sub-row 3: Neither likely nor unlikely: Blank (green), blank (green), blank (yellow), blank (orange), blank (orange). Sub-row 4: Somewhat unlikely: 1 percent, 1 percent, 1 percent, 4 percent, 2 percent. Sub-row 5: Extremely unlikely: 2 percent, 1 percent, 1 percent, 7 percent, 4 percent. The values are accurate.
Figure 127. Other than Project Owners: Estimated Risks of Safety in the Construction Phase.
Maintenance Phase

As noted previously, an insufficient number of survey responses were received from other than project owner respondents when estimating the likelihoods and impacts of outcomes when an OOS utility is found in the maintenance phase of a project. As such, the research team was unable to perform any risk analyses for this phase and of stakeholder type.

Discussion of Risk Findings

Table 23 provides a summary of the risk scores shown earlier to facilitate comparisons. These risk scores are based on responses from all survey respondents and include three of the four phases of a highway construction project.

Table 23. All Respondents: Risk Scores for Outcomes by Project Phase.

Outcome Risk Score
Planning Design Construction
Project Delays 2.0 2.3 4.4
Cost Increases or Budget Overruns 2.1 2.6 4.2
Environmental Impacts and Concerns 1.9 2.2 3.2
Changes in Project Scope 2.2 2.5 3.6
Constraints in Right-of-Way Availability 2.2 2.8 3.5
Safety Issues 1.5 1.8 3.4

The risk score for each of the potential outcomes increased from the planning phase to the construction phase of a project, indicating that the likelihood and impact of an outcome increase

Suggested Citation: "4 Survey Results." National Academies of Sciences, Engineering, and Medicine. 2026. Developing a Guide to Manage Out-of-Service Utility Facilities. Washington, DC: The National Academies Press. doi: 10.17226/29497.

as the project progresses. Outcomes during the planning and design phases are manageable, based on survey participants’ estimated risks; participants assigned low risks to outcomes in the planning phase and low-to-medium risks in the design phase of a project. Conversely, in the construction phase of a project, participants estimated medium-to-high risks for most outcomes and high-to-very high risks for project delays and cost increases. The finding that perceived project risks due to OOS facilities increase from the planning phase to the construction phase of a project should be further investigated by future research.

The research team used the risk scores calculated for project owners and for other than project owners to compare perceived risks by these stakeholder types by project phase (Figure 128). For example, project owner responses produced a risk score of 1.8 for project delays in the planning phase, while other than project owner responses produced a risk score of 2.6. The 0.8 difference indicates that the other than project owner participants estimated a higher risk than project owners for project delays in the planning phase. Similarly, project owner responses produced a risk score of 1.9 for safety issues during the design phase, while other than project owner responses produced a risk score of 1.5. The −0.4 difference indicates that the other than project owner participants estimated a lower risk than project owners for safety issues during the design phase.
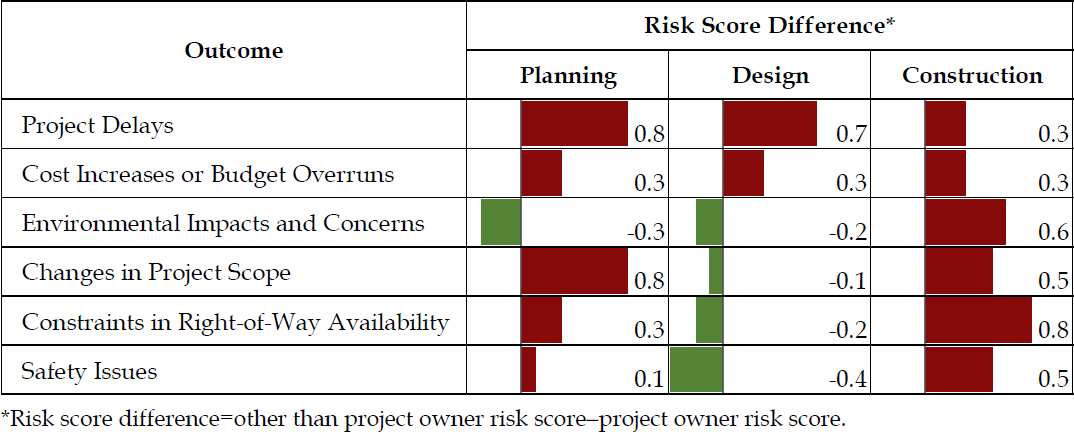
The column headers are Outcome and Risk Score Difference. The risk score difference is defined as equal to the other than project owner risk score minus the project owner risk score. The second column has three subcolumns, and the headers are Planning, Design, and Construction. The row-wise data given are as follows: Row 1: Project delays: 0.8, 0.7, 0.3. Row 2: Cost increases or budget overruns: 0.3, 0.3, 0.3. Row 3: Environmental impacts and concerns: negative 0.3, negative 0.2, 0.6. Row 4: Changes in project scope: 0.8, negative 0.1, 0.5. Row 5: Constraints in right-of-way availability: 0.3, negative 0.2, 0.8. Row 6: Safety issues: 0.1, negative 0.4, 0.5. The values are accurate.
Figure 128. Project Owners Versus Other than Project Owners: Risk Score Differences of Outcomes.

Figure 128 indicates that—based on the survey sample—project owners and other than project owners have different views of the estimated risks of potential outcomes when an OOS utility is found on a project. Other than project owners estimated a higher level of risk for all potential outcomes in the planning phase, except for the outcome related to environmental impacts. In the design phase, other than project owners estimated higher levels of risk for project delays and cost increases but lower levels of risk for all other potential outcomes. Other than project owners estimated higher levels of risk for all potential outcomes during the construction phase.

Suggested Citation: "4 Survey Results." National Academies of Sciences, Engineering, and Medicine. 2026. Developing a Guide to Manage Out-of-Service Utility Facilities. Washington, DC: The National Academies Press. doi: 10.17226/29497.
Page 47
Suggested Citation: "4 Survey Results." National Academies of Sciences, Engineering, and Medicine. 2026. Developing a Guide to Manage Out-of-Service Utility Facilities. Washington, DC: The National Academies Press. doi: 10.17226/29497.
Page 48
Suggested Citation: "4 Survey Results." National Academies of Sciences, Engineering, and Medicine. 2026. Developing a Guide to Manage Out-of-Service Utility Facilities. Washington, DC: The National Academies Press. doi: 10.17226/29497.
Page 49
Suggested Citation: "4 Survey Results." National Academies of Sciences, Engineering, and Medicine. 2026. Developing a Guide to Manage Out-of-Service Utility Facilities. Washington, DC: The National Academies Press. doi: 10.17226/29497.
Page 50
Suggested Citation: "4 Survey Results." National Academies of Sciences, Engineering, and Medicine. 2026. Developing a Guide to Manage Out-of-Service Utility Facilities. Washington, DC: The National Academies Press. doi: 10.17226/29497.
Page 51
Suggested Citation: "4 Survey Results." National Academies of Sciences, Engineering, and Medicine. 2026. Developing a Guide to Manage Out-of-Service Utility Facilities. Washington, DC: The National Academies Press. doi: 10.17226/29497.
Page 52
Suggested Citation: "4 Survey Results." National Academies of Sciences, Engineering, and Medicine. 2026. Developing a Guide to Manage Out-of-Service Utility Facilities. Washington, DC: The National Academies Press. doi: 10.17226/29497.
Page 53
Suggested Citation: "4 Survey Results." National Academies of Sciences, Engineering, and Medicine. 2026. Developing a Guide to Manage Out-of-Service Utility Facilities. Washington, DC: The National Academies Press. doi: 10.17226/29497.
Page 54
Suggested Citation: "4 Survey Results." National Academies of Sciences, Engineering, and Medicine. 2026. Developing a Guide to Manage Out-of-Service Utility Facilities. Washington, DC: The National Academies Press. doi: 10.17226/29497.
Page 55
Suggested Citation: "4 Survey Results." National Academies of Sciences, Engineering, and Medicine. 2026. Developing a Guide to Manage Out-of-Service Utility Facilities. Washington, DC: The National Academies Press. doi: 10.17226/29497.
Page 56
Suggested Citation: "4 Survey Results." National Academies of Sciences, Engineering, and Medicine. 2026. Developing a Guide to Manage Out-of-Service Utility Facilities. Washington, DC: The National Academies Press. doi: 10.17226/29497.
Page 57
Suggested Citation: "4 Survey Results." National Academies of Sciences, Engineering, and Medicine. 2026. Developing a Guide to Manage Out-of-Service Utility Facilities. Washington, DC: The National Academies Press. doi: 10.17226/29497.
Page 58
Suggested Citation: "4 Survey Results." National Academies of Sciences, Engineering, and Medicine. 2026. Developing a Guide to Manage Out-of-Service Utility Facilities. Washington, DC: The National Academies Press. doi: 10.17226/29497.
Page 59
Suggested Citation: "4 Survey Results." National Academies of Sciences, Engineering, and Medicine. 2026. Developing a Guide to Manage Out-of-Service Utility Facilities. Washington, DC: The National Academies Press. doi: 10.17226/29497.
Page 60
Suggested Citation: "4 Survey Results." National Academies of Sciences, Engineering, and Medicine. 2026. Developing a Guide to Manage Out-of-Service Utility Facilities. Washington, DC: The National Academies Press. doi: 10.17226/29497.
Page 61
Suggested Citation: "4 Survey Results." National Academies of Sciences, Engineering, and Medicine. 2026. Developing a Guide to Manage Out-of-Service Utility Facilities. Washington, DC: The National Academies Press. doi: 10.17226/29497.
Page 62
Suggested Citation: "4 Survey Results." National Academies of Sciences, Engineering, and Medicine. 2026. Developing a Guide to Manage Out-of-Service Utility Facilities. Washington, DC: The National Academies Press. doi: 10.17226/29497.
Page 63
Suggested Citation: "4 Survey Results." National Academies of Sciences, Engineering, and Medicine. 2026. Developing a Guide to Manage Out-of-Service Utility Facilities. Washington, DC: The National Academies Press. doi: 10.17226/29497.
Page 64
Suggested Citation: "4 Survey Results." National Academies of Sciences, Engineering, and Medicine. 2026. Developing a Guide to Manage Out-of-Service Utility Facilities. Washington, DC: The National Academies Press. doi: 10.17226/29497.
Page 65
Suggested Citation: "4 Survey Results." National Academies of Sciences, Engineering, and Medicine. 2026. Developing a Guide to Manage Out-of-Service Utility Facilities. Washington, DC: The National Academies Press. doi: 10.17226/29497.
Page 66
Suggested Citation: "4 Survey Results." National Academies of Sciences, Engineering, and Medicine. 2026. Developing a Guide to Manage Out-of-Service Utility Facilities. Washington, DC: The National Academies Press. doi: 10.17226/29497.
Page 67
Suggested Citation: "4 Survey Results." National Academies of Sciences, Engineering, and Medicine. 2026. Developing a Guide to Manage Out-of-Service Utility Facilities. Washington, DC: The National Academies Press. doi: 10.17226/29497.
Page 68
Suggested Citation: "4 Survey Results." National Academies of Sciences, Engineering, and Medicine. 2026. Developing a Guide to Manage Out-of-Service Utility Facilities. Washington, DC: The National Academies Press. doi: 10.17226/29497.
Page 69
Suggested Citation: "4 Survey Results." National Academies of Sciences, Engineering, and Medicine. 2026. Developing a Guide to Manage Out-of-Service Utility Facilities. Washington, DC: The National Academies Press. doi: 10.17226/29497.
Page 70
Suggested Citation: "4 Survey Results." National Academies of Sciences, Engineering, and Medicine. 2026. Developing a Guide to Manage Out-of-Service Utility Facilities. Washington, DC: The National Academies Press. doi: 10.17226/29497.
Page 71
Suggested Citation: "4 Survey Results." National Academies of Sciences, Engineering, and Medicine. 2026. Developing a Guide to Manage Out-of-Service Utility Facilities. Washington, DC: The National Academies Press. doi: 10.17226/29497.
Page 72
Suggested Citation: "4 Survey Results." National Academies of Sciences, Engineering, and Medicine. 2026. Developing a Guide to Manage Out-of-Service Utility Facilities. Washington, DC: The National Academies Press. doi: 10.17226/29497.
Page 73
Suggested Citation: "4 Survey Results." National Academies of Sciences, Engineering, and Medicine. 2026. Developing a Guide to Manage Out-of-Service Utility Facilities. Washington, DC: The National Academies Press. doi: 10.17226/29497.
Page 74
Suggested Citation: "4 Survey Results." National Academies of Sciences, Engineering, and Medicine. 2026. Developing a Guide to Manage Out-of-Service Utility Facilities. Washington, DC: The National Academies Press. doi: 10.17226/29497.
Page 75
Suggested Citation: "4 Survey Results." National Academies of Sciences, Engineering, and Medicine. 2026. Developing a Guide to Manage Out-of-Service Utility Facilities. Washington, DC: The National Academies Press. doi: 10.17226/29497.
Page 76
Suggested Citation: "4 Survey Results." National Academies of Sciences, Engineering, and Medicine. 2026. Developing a Guide to Manage Out-of-Service Utility Facilities. Washington, DC: The National Academies Press. doi: 10.17226/29497.
Page 77
Suggested Citation: "4 Survey Results." National Academies of Sciences, Engineering, and Medicine. 2026. Developing a Guide to Manage Out-of-Service Utility Facilities. Washington, DC: The National Academies Press. doi: 10.17226/29497.
Page 78
Suggested Citation: "4 Survey Results." National Academies of Sciences, Engineering, and Medicine. 2026. Developing a Guide to Manage Out-of-Service Utility Facilities. Washington, DC: The National Academies Press. doi: 10.17226/29497.
Page 79
Suggested Citation: "4 Survey Results." National Academies of Sciences, Engineering, and Medicine. 2026. Developing a Guide to Manage Out-of-Service Utility Facilities. Washington, DC: The National Academies Press. doi: 10.17226/29497.
Page 80
Suggested Citation: "4 Survey Results." National Academies of Sciences, Engineering, and Medicine. 2026. Developing a Guide to Manage Out-of-Service Utility Facilities. Washington, DC: The National Academies Press. doi: 10.17226/29497.
Page 81
Suggested Citation: "4 Survey Results." National Academies of Sciences, Engineering, and Medicine. 2026. Developing a Guide to Manage Out-of-Service Utility Facilities. Washington, DC: The National Academies Press. doi: 10.17226/29497.
Page 82
Suggested Citation: "4 Survey Results." National Academies of Sciences, Engineering, and Medicine. 2026. Developing a Guide to Manage Out-of-Service Utility Facilities. Washington, DC: The National Academies Press. doi: 10.17226/29497.
Page 83
Suggested Citation: "4 Survey Results." National Academies of Sciences, Engineering, and Medicine. 2026. Developing a Guide to Manage Out-of-Service Utility Facilities. Washington, DC: The National Academies Press. doi: 10.17226/29497.
Page 84
Suggested Citation: "4 Survey Results." National Academies of Sciences, Engineering, and Medicine. 2026. Developing a Guide to Manage Out-of-Service Utility Facilities. Washington, DC: The National Academies Press. doi: 10.17226/29497.
Page 85
Suggested Citation: "4 Survey Results." National Academies of Sciences, Engineering, and Medicine. 2026. Developing a Guide to Manage Out-of-Service Utility Facilities. Washington, DC: The National Academies Press. doi: 10.17226/29497.
Page 86
Suggested Citation: "4 Survey Results." National Academies of Sciences, Engineering, and Medicine. 2026. Developing a Guide to Manage Out-of-Service Utility Facilities. Washington, DC: The National Academies Press. doi: 10.17226/29497.
Page 87
Suggested Citation: "4 Survey Results." National Academies of Sciences, Engineering, and Medicine. 2026. Developing a Guide to Manage Out-of-Service Utility Facilities. Washington, DC: The National Academies Press. doi: 10.17226/29497.
Page 88
Suggested Citation: "4 Survey Results." National Academies of Sciences, Engineering, and Medicine. 2026. Developing a Guide to Manage Out-of-Service Utility Facilities. Washington, DC: The National Academies Press. doi: 10.17226/29497.
Page 89
Suggested Citation: "4 Survey Results." National Academies of Sciences, Engineering, and Medicine. 2026. Developing a Guide to Manage Out-of-Service Utility Facilities. Washington, DC: The National Academies Press. doi: 10.17226/29497.
Page 90
Suggested Citation: "4 Survey Results." National Academies of Sciences, Engineering, and Medicine. 2026. Developing a Guide to Manage Out-of-Service Utility Facilities. Washington, DC: The National Academies Press. doi: 10.17226/29497.
Page 91
Suggested Citation: "4 Survey Results." National Academies of Sciences, Engineering, and Medicine. 2026. Developing a Guide to Manage Out-of-Service Utility Facilities. Washington, DC: The National Academies Press. doi: 10.17226/29497.
Page 92
Suggested Citation: "4 Survey Results." National Academies of Sciences, Engineering, and Medicine. 2026. Developing a Guide to Manage Out-of-Service Utility Facilities. Washington, DC: The National Academies Press. doi: 10.17226/29497.
Page 93
Suggested Citation: "4 Survey Results." National Academies of Sciences, Engineering, and Medicine. 2026. Developing a Guide to Manage Out-of-Service Utility Facilities. Washington, DC: The National Academies Press. doi: 10.17226/29497.
Page 94
Suggested Citation: "4 Survey Results." National Academies of Sciences, Engineering, and Medicine. 2026. Developing a Guide to Manage Out-of-Service Utility Facilities. Washington, DC: The National Academies Press. doi: 10.17226/29497.
Page 95
Suggested Citation: "4 Survey Results." National Academies of Sciences, Engineering, and Medicine. 2026. Developing a Guide to Manage Out-of-Service Utility Facilities. Washington, DC: The National Academies Press. doi: 10.17226/29497.
Page 96
Suggested Citation: "4 Survey Results." National Academies of Sciences, Engineering, and Medicine. 2026. Developing a Guide to Manage Out-of-Service Utility Facilities. Washington, DC: The National Academies Press. doi: 10.17226/29497.
Page 97
Suggested Citation: "4 Survey Results." National Academies of Sciences, Engineering, and Medicine. 2026. Developing a Guide to Manage Out-of-Service Utility Facilities. Washington, DC: The National Academies Press. doi: 10.17226/29497.
Page 98
Suggested Citation: "4 Survey Results." National Academies of Sciences, Engineering, and Medicine. 2026. Developing a Guide to Manage Out-of-Service Utility Facilities. Washington, DC: The National Academies Press. doi: 10.17226/29497.
Page 99
Suggested Citation: "4 Survey Results." National Academies of Sciences, Engineering, and Medicine. 2026. Developing a Guide to Manage Out-of-Service Utility Facilities. Washington, DC: The National Academies Press. doi: 10.17226/29497.
Page 100
Suggested Citation: "4 Survey Results." National Academies of Sciences, Engineering, and Medicine. 2026. Developing a Guide to Manage Out-of-Service Utility Facilities. Washington, DC: The National Academies Press. doi: 10.17226/29497.
Page 101
Suggested Citation: "4 Survey Results." National Academies of Sciences, Engineering, and Medicine. 2026. Developing a Guide to Manage Out-of-Service Utility Facilities. Washington, DC: The National Academies Press. doi: 10.17226/29497.
Page 102
Suggested Citation: "4 Survey Results." National Academies of Sciences, Engineering, and Medicine. 2026. Developing a Guide to Manage Out-of-Service Utility Facilities. Washington, DC: The National Academies Press. doi: 10.17226/29497.
Page 103
Suggested Citation: "4 Survey Results." National Academies of Sciences, Engineering, and Medicine. 2026. Developing a Guide to Manage Out-of-Service Utility Facilities. Washington, DC: The National Academies Press. doi: 10.17226/29497.
Page 104
Suggested Citation: "4 Survey Results." National Academies of Sciences, Engineering, and Medicine. 2026. Developing a Guide to Manage Out-of-Service Utility Facilities. Washington, DC: The National Academies Press. doi: 10.17226/29497.
Page 105
Suggested Citation: "4 Survey Results." National Academies of Sciences, Engineering, and Medicine. 2026. Developing a Guide to Manage Out-of-Service Utility Facilities. Washington, DC: The National Academies Press. doi: 10.17226/29497.
Page 106
Suggested Citation: "4 Survey Results." National Academies of Sciences, Engineering, and Medicine. 2026. Developing a Guide to Manage Out-of-Service Utility Facilities. Washington, DC: The National Academies Press. doi: 10.17226/29497.
Page 107
Suggested Citation: "4 Survey Results." National Academies of Sciences, Engineering, and Medicine. 2026. Developing a Guide to Manage Out-of-Service Utility Facilities. Washington, DC: The National Academies Press. doi: 10.17226/29497.
Page 108
Suggested Citation: "4 Survey Results." National Academies of Sciences, Engineering, and Medicine. 2026. Developing a Guide to Manage Out-of-Service Utility Facilities. Washington, DC: The National Academies Press. doi: 10.17226/29497.
Page 109
Suggested Citation: "4 Survey Results." National Academies of Sciences, Engineering, and Medicine. 2026. Developing a Guide to Manage Out-of-Service Utility Facilities. Washington, DC: The National Academies Press. doi: 10.17226/29497.
Page 110
Suggested Citation: "4 Survey Results." National Academies of Sciences, Engineering, and Medicine. 2026. Developing a Guide to Manage Out-of-Service Utility Facilities. Washington, DC: The National Academies Press. doi: 10.17226/29497.
Page 111
Suggested Citation: "4 Survey Results." National Academies of Sciences, Engineering, and Medicine. 2026. Developing a Guide to Manage Out-of-Service Utility Facilities. Washington, DC: The National Academies Press. doi: 10.17226/29497.
Page 112
Suggested Citation: "4 Survey Results." National Academies of Sciences, Engineering, and Medicine. 2026. Developing a Guide to Manage Out-of-Service Utility Facilities. Washington, DC: The National Academies Press. doi: 10.17226/29497.
Page 113
Suggested Citation: "4 Survey Results." National Academies of Sciences, Engineering, and Medicine. 2026. Developing a Guide to Manage Out-of-Service Utility Facilities. Washington, DC: The National Academies Press. doi: 10.17226/29497.
Page 114
Suggested Citation: "4 Survey Results." National Academies of Sciences, Engineering, and Medicine. 2026. Developing a Guide to Manage Out-of-Service Utility Facilities. Washington, DC: The National Academies Press. doi: 10.17226/29497.
Page 115
Suggested Citation: "4 Survey Results." National Academies of Sciences, Engineering, and Medicine. 2026. Developing a Guide to Manage Out-of-Service Utility Facilities. Washington, DC: The National Academies Press. doi: 10.17226/29497.
Page 116
Suggested Citation: "4 Survey Results." National Academies of Sciences, Engineering, and Medicine. 2026. Developing a Guide to Manage Out-of-Service Utility Facilities. Washington, DC: The National Academies Press. doi: 10.17226/29497.
Page 117
Suggested Citation: "4 Survey Results." National Academies of Sciences, Engineering, and Medicine. 2026. Developing a Guide to Manage Out-of-Service Utility Facilities. Washington, DC: The National Academies Press. doi: 10.17226/29497.
Page 118
Suggested Citation: "4 Survey Results." National Academies of Sciences, Engineering, and Medicine. 2026. Developing a Guide to Manage Out-of-Service Utility Facilities. Washington, DC: The National Academies Press. doi: 10.17226/29497.
Page 119
Suggested Citation: "4 Survey Results." National Academies of Sciences, Engineering, and Medicine. 2026. Developing a Guide to Manage Out-of-Service Utility Facilities. Washington, DC: The National Academies Press. doi: 10.17226/29497.
Page 120
Suggested Citation: "4 Survey Results." National Academies of Sciences, Engineering, and Medicine. 2026. Developing a Guide to Manage Out-of-Service Utility Facilities. Washington, DC: The National Academies Press. doi: 10.17226/29497.
Page 121
Suggested Citation: "4 Survey Results." National Academies of Sciences, Engineering, and Medicine. 2026. Developing a Guide to Manage Out-of-Service Utility Facilities. Washington, DC: The National Academies Press. doi: 10.17226/29497.
Page 122
Suggested Citation: "4 Survey Results." National Academies of Sciences, Engineering, and Medicine. 2026. Developing a Guide to Manage Out-of-Service Utility Facilities. Washington, DC: The National Academies Press. doi: 10.17226/29497.
Page 123
Suggested Citation: "4 Survey Results." National Academies of Sciences, Engineering, and Medicine. 2026. Developing a Guide to Manage Out-of-Service Utility Facilities. Washington, DC: The National Academies Press. doi: 10.17226/29497.
Page 124
Suggested Citation: "4 Survey Results." National Academies of Sciences, Engineering, and Medicine. 2026. Developing a Guide to Manage Out-of-Service Utility Facilities. Washington, DC: The National Academies Press. doi: 10.17226/29497.
Page 125
Suggested Citation: "4 Survey Results." National Academies of Sciences, Engineering, and Medicine. 2026. Developing a Guide to Manage Out-of-Service Utility Facilities. Washington, DC: The National Academies Press. doi: 10.17226/29497.
Page 126
Suggested Citation: "4 Survey Results." National Academies of Sciences, Engineering, and Medicine. 2026. Developing a Guide to Manage Out-of-Service Utility Facilities. Washington, DC: The National Academies Press. doi: 10.17226/29497.
Page 127
Suggested Citation: "4 Survey Results." National Academies of Sciences, Engineering, and Medicine. 2026. Developing a Guide to Manage Out-of-Service Utility Facilities. Washington, DC: The National Academies Press. doi: 10.17226/29497.
Page 128
Suggested Citation: "4 Survey Results." National Academies of Sciences, Engineering, and Medicine. 2026. Developing a Guide to Manage Out-of-Service Utility Facilities. Washington, DC: The National Academies Press. doi: 10.17226/29497.
Page 129
Suggested Citation: "4 Survey Results." National Academies of Sciences, Engineering, and Medicine. 2026. Developing a Guide to Manage Out-of-Service Utility Facilities. Washington, DC: The National Academies Press. doi: 10.17226/29497.
Page 130
Suggested Citation: "4 Survey Results." National Academies of Sciences, Engineering, and Medicine. 2026. Developing a Guide to Manage Out-of-Service Utility Facilities. Washington, DC: The National Academies Press. doi: 10.17226/29497.
Page 131
Suggested Citation: "4 Survey Results." National Academies of Sciences, Engineering, and Medicine. 2026. Developing a Guide to Manage Out-of-Service Utility Facilities. Washington, DC: The National Academies Press. doi: 10.17226/29497.
Page 132
Suggested Citation: "4 Survey Results." National Academies of Sciences, Engineering, and Medicine. 2026. Developing a Guide to Manage Out-of-Service Utility Facilities. Washington, DC: The National Academies Press. doi: 10.17226/29497.
Page 133
Suggested Citation: "4 Survey Results." National Academies of Sciences, Engineering, and Medicine. 2026. Developing a Guide to Manage Out-of-Service Utility Facilities. Washington, DC: The National Academies Press. doi: 10.17226/29497.
Page 134
Suggested Citation: "4 Survey Results." National Academies of Sciences, Engineering, and Medicine. 2026. Developing a Guide to Manage Out-of-Service Utility Facilities. Washington, DC: The National Academies Press. doi: 10.17226/29497.
Page 135
Suggested Citation: "4 Survey Results." National Academies of Sciences, Engineering, and Medicine. 2026. Developing a Guide to Manage Out-of-Service Utility Facilities. Washington, DC: The National Academies Press. doi: 10.17226/29497.
Page 136
Suggested Citation: "4 Survey Results." National Academies of Sciences, Engineering, and Medicine. 2026. Developing a Guide to Manage Out-of-Service Utility Facilities. Washington, DC: The National Academies Press. doi: 10.17226/29497.
Page 137
Suggested Citation: "4 Survey Results." National Academies of Sciences, Engineering, and Medicine. 2026. Developing a Guide to Manage Out-of-Service Utility Facilities. Washington, DC: The National Academies Press. doi: 10.17226/29497.
Page 138
Suggested Citation: "4 Survey Results." National Academies of Sciences, Engineering, and Medicine. 2026. Developing a Guide to Manage Out-of-Service Utility Facilities. Washington, DC: The National Academies Press. doi: 10.17226/29497.
Page 139
Next Chapter: 5 Case Study Selection
Subscribe to Emails from the National Academies
Stay up to date on activities, publications, and events by subscribing to email updates.