Exploring Military Exposures and Mental, Behavioral, and Neurologic Health Outcomes Among Post-9/11 Veterans (2025)
Chapter: Appendix F: Comparison of Characteristics of Alternative Study Cohorts
Appendix F
Comparison of Characteristics of Alternative Study Cohorts
This appendix provides descriptive statistics for the study sample and two alternative cohorts. The committee compared characteristics across cohorts to assess how representative its sample is of post-9/11 veterans more generally and of Veterans Health Administration (VHA) users more broadly. Table F-1 describes the inclusion criteria for each cohort. Table F-2 presents the number of the total VHA records that met the inclusion criteria for each cohort. Table F-3 presents frequencies and percentages for covariates used in the case-control matching and Table F-4 presents other covariates. Figure F-1 shows the distribution of distinct exposure groups (e.g., burn pits, exhaust, fuels) among veterans with post-9/11 combat service. Table F-5 lists outcome prevalence by cohort.
TABLE F-1 Alternative Veteran Cohort Inclusion Criteria
| Study Sample | Post-9/11 Combat Service Cohort | Eligible VHA Cohort | |
|---|---|---|---|
| Inclusion Criteria |
|
|
|
NOTES: The study sample was made up of VHA-linked ILER records that had a VHA inpatient or outpatient encounter during 2017–2023. The post-9/11 combat service cohort was made up of VHA records with a post-9/11 service flag (=1) and a combat service flag (=1). The eligible VHA cohort was made up of all VHA records with a diagnosis from an inpatient or outpatient facility during 2017–2023. ILER = Individual Longitudinal Exposure Record; USVETS = United States Veterans Eligibility Trends and Statistics; VHA = Veterans Health Administration.
TABLE F-2 Availability of Records by Alternative Veteran Cohort
| Data Availability | Study Sample n (%) | Post-9/11 Combat Service Cohort n (%) |
Eligible VHA Cohort n (%) |
|---|---|---|---|
| Yes | 1,145,301 (10.4%) | 1,499,461 (13.5%) | 8,853,465 (80.1%) |
| No | 187,638 (1.7%) | 5,902,794 (53.4%) | 2,196,642 (19.9%) |
| Missing | 9,717,168 (87.9%) | 3,647,852 (33.0%) | 0 (0.0%) |
NOTES: The study sample was made up of VHA-linked ILER records that had a VHA inpatient or outpatient encounter during 2017–2023. The post-9/11 combat service cohort was made up of VHA records with a post-9/11 service flag (=1) and a combat service flag (=1). The eligible VHA cohort was made up of all VHA records with a diagnosis from an inpatient or outpatient facility during 2017–2023. VHA = Veterans Health Administration.
TABLE F-3 Matching Characteristics by Veteran Cohort
| Matching Criteria | Value | Study Sample n (%) | Post-9/11 Combat Service Cohort n (%) | Eligible VHA Cohort n (%) |
|---|---|---|---|---|
| Initial Encounter Age | 18–34 years | 469,178 (41.0%) | 520,396 (34.7%) | 1,102,415 (12.5%) |
| 35–44 years | 351,566 (30.7%) | 534,188 (35.6%) | 912,613 (10.3%) | |
| 45–54 years | 219,136 (19.1%) | 303,938 (20.3%) | 1,087,149 (12.3%) | |
| 55–64 years | 87,747 (7.7%) | 121,674 (8.1%) | 1,500,572 (16.9%) | |
| 65+ years | 17,659 (1.5%) | 19,251 (1.3%) | 4,250,596 (48.0%) | |
| Missing | 15 (0.0%) | 14 (0.0%) | 120 (0.0%) | |
| Birth Sex | Female | 152,500 (13.3%) | 193,591 (12.9%) | 819,051 (9.3%) |
| Male | 992,800 (86.7%) | 1,305,870 (87.1%) | 8,034,402 (90.7%) | |
| Missing | <10 (0.0%) | <10 (0.0%) | 12 (0.0%) | |
| Enrollment Year | <2001 | 14,112 (1.2%) | 10,361 (0.7%) | 638,168 (7.2%) |
| 2001–2010 | 238,168 (20.8%) | 406,089 (27.1%) | 2,045,023 (23.1%) | |
| 2010+ | 892,902 (78.0%) | 1,082,862 (72.2%) | 6,168,386 (69.7%) | |
| Missing | 119 (0.0%) | 149 (0.0%) | 1,888 (0.0%) | |
| n | 1,145,301 | 1,499,461 | 8,853,465 |
NOTES: Cell sizes of 10 or less are noted as <10; analyses conducted in VINCI on April 8, 2025. Initial encounter age calculated using valid birth dates between 1900 and 2005. Enrollment year indicates the most recent enrollment year. The study sample was made up of VHA-linked ILER records that had a VHA inpatient or outpatient encounter during 2017–2023. The post-9/11 combat service cohort was made up of VHA records with a post-9/11 service flag (=1) and a combat service flag (=1). The eligible VHA cohort was made up of all VHA records with a diagnosis from an inpatient or outpatient facility during 2017–2023. VHA = Veterans Health Administration.
TABLE F-4 Covariate Characteristics by Veteran Cohort
| Covariate | Value | Study Sample n (%) | Post-9/11 Combat Service Cohort n (%) | Eligible VHA Cohort n (%) |
|---|---|---|---|---|
| Demographics | ||||
| Race | American Indian or Alaska Native | 10,696 (0.9%) | 14,365 (1.0%) | 67,923 (0.8%) |
| Asian | 27,557 (2.4%) | 36,867 (2.5%) | 111,355 (1.3%) | |
| Black or African American | 195,925 (17.1%) | 257,915 (17.2%) | 1,421,955 (16.1%) | |
| Multiple races | 18,746 (1.6%) | 22,291 (1.5%) | 84,214 (1.0%) | |
| Native Hawaiian or other Pacific Islander | 15,027 (1.3%) | 18,617 (1.2%) | 75,515 (0.9%) | |
| White | 732,865 (64.0%) | 972,804 (64.9%) | 6,118,311 (69.1%) | |
| Unknown or declined | 73,454 (6.4%) | 94,730 (6.3%) | 449,888 (5.1%) | |
| Missing | 71,031 (6.2%) | 81,872 (5.5%) | 524,304 (5.9%) | |
| Ethnicity | Hispanic or Latino | 131,664 (11.5%) | 171,839 (11.5%) | 607,180 (6.9%) |
| Not Hispanic or Latino | 910,005 (79.5%) | 1,200,573 (80.1%) | 7,517,019 (84.9%) | |
| Unknown or declined | 55,951 (4.9%) | 71,209 (4.7%) | 383,993 (4.3%) | |
| Missing | 47,681 (4.2%) | 55,840 (3.7%) | 345,273 (3.9%) | |
| Geography | ||||
| Urbanicity | Urban | 167,387 (14.6%) | 220,305 (14.7%) | 1,653,891 (18.7%) |
| Suburban | 466,928 (40.8%) | 572,380 (38.2%) | 3,287,054 (37.1%) | |
| Rural | 500,723 (43.7%) | 691,926 (46.1%) | 3,827,446 (43.2%) | |
| Missing | 10,263 (0.9%) | 14,850 (1.0%) | 85,074 (1.0%) | |
| VA Region (VISN) | Region 1 | 34,966 (3.1%) | 48,681 (3.2%) | 337,131 (3.8%) |
| Region 2 | 37,495 (3.3%) | 53,069 (3.5%) | 378,814 (4.3%) | |
| Region 4 | 34,464 (3.0%) | 48,506 (3.2%) | 386,494 (4.4%) | |
| Region 5 | 38,729 (3.4%) | 55,111 (3.7%) | 284,413 (3.2%) | |
| Region 6 | 81,933 (7.2%) | 109,850 (7.3%) | 547,886 (6.2%) | |
| Region 7 | 97,656 (8.5%) | 115,114 (7.7%) | 620,047 (7.0%) | |
| Region 8 | 79,660 (7.0%) | 112,038 (7.5%) | 787,549 (8.9%) | |
| Region 9 | 48,093 (4.2%) | 61,126 (4.1%) | 370,895 (4.2%) | |
| Region 10 | 64,432 (5.6%) | 85,662 (5.7%) | 663,356 (7.5%) | |
| Region 12 | 39,467 (3.4%) | 50,212 (3.3%) | 384,094 (4.3%) | |
| Region 15 | 44,287 (3.9%) | 54,509 (3.6%) | 337,868 (3.8%) | |
| Region 16 | 76,758 (6.7%) | 101,659 (6.8%) | 587,342 (6.6%) | |
| Region 17 | 120,743 (10.5%) | 143,120 (9.5%) | 609,927 (6.9%) | |
| Region 19 | 79,187 (6.9%) | 92,392 (6.2%) | 455,298 (5.1%) | |
| Region 20 | 63,993 (5.6%) | 81,547 (5.4%) | 437,096 (4.9%) | |
| Region 21 | 59,374 (5.2%) | 80,149 (5.3%) | 490,050 (5.5%) | |
| Region 22 | 96,294 (8.4%) | 145,225 (9.7%) | 744,405 (8.4%) | |
| Region 23 | 47,770 (4.2%) | 61,491 (4.1%) | 430,800 (4.9%) | |
| Missing | 0 (0.0%) | 0 (0.0%) | 0 (0.0%) | |
| Homelessness | Experienced homelessness | 49,558 (4.3%) | 73,241 (4.9%) | 443,083 (5.0%) |
| No indication of homelessness | 1,095,743 (95.7%) | 1,426,220 (95.1%) | 8,410,382 (95.0%) |
| Covariate | Value | Study Sample n (%) | Post-9/11 Combat Service Cohort n (%) | Eligible VHA Cohort n (%) |
|---|---|---|---|---|
| Military Service | ||||
| Last Branch | Army | 664,574 (58.0%) | 794,015 (53.0%) | 3,875,832 (43.8%) |
| Air Force | 221,811 (19.4%) | 229,792 (15.3%) | 1,245,340 (14.1%) | |
| Coast Guard | 1,072 (0.1%) | 2,735 (0.2%) | 76,481 (0.9%) | |
| Marines | 111,866 (9.8%) | 207,911 (13.9%) | 834,015 (9.4%) | |
| Navy | 66,186 (5.8%) | 244,384 (16.3%) | 1,493,230 (16.9%) | |
| Others | 322 (0.0%) | 443 (0.0%) | 5,329 (0.1%) | |
| Unknown | 16,331 (1.4%) | 20,181 (1.3%) | 1,102,686 (12.5%) | |
| Missing | 63,139 (5.5%) | 0 (0.0%) | 220,552 (2.5%) | |
| Last Component | Active Duty | 728,456 (63.6%) | 1,048,274 (69.9%) | 5,912,710 (66.8%) |
| Guard | 163,256 (14.3%) | 204,813 (13.7%) | 269,362 (3.0%) | |
| Reserve | 122,595 (10.7%) | 163,846 (10.9%) | 288,939 (3.3%) | |
| Unknown | 67,855 (5.9%) | 82,528 (5.5%) | 2,161,902 (24.4%) | |
| Missing | 63,139 (5.5%) | 0 (0.0%) | 220,552 (2.5%) | |
| Last Rank | Enlisted | 903,934 (78.9%) | 1,264,614 (84.3%) | 6,206,805 (70.1%) |
| Officer | 94,741 (8.3%) | 129,645 (8.6%) | 400,853 (4.5%) | |
| Unknown | 65,139 (5.7%) | 82,668 (5.5%) | 1,984,061 (22.4%) | |
| Missing | 81,487 (7.1%) | 22,534 (1.5%) | 261,746 (3.0%) | |
| VA and Insurance-Related Characteristics | ||||
| Military Sexual Trauma | Screened reports MST | 69,643 (6.1%) | 88,902 (5.9%) | 425,394 (4.8%) |
| Screened does not report MST | 986,684 (86.2%) | 1,304,888 (87.0%) | 7,759,450 (87.6%) | |
| Unknown or declined | 1,647 (0.1%) | 1,682 (0.1%) | 15,355 (0.2%) | |
| Missing | 87,327 (7.6%) | 103,989 (6.9%) | 653,266 (7.4%) | |
| VA Enrollment Priority Group | No group (-1) | 11,360 (1.0%) | 8,504 (0.6%) | 78,166 (0.9%) |
| Group 1 | 629,815 (55.0%) | 824,939 (55.0%) | 2,960,452 (33.4%) | |
| Group 2 | 100,533 (8.8%) | 142,045 (9.5%) | 688,572 (7.8%) | |
| Group 3 | 110,057 (9.6%) | 145,045 (9.7%) | 1,190,945 (13.5%) | |
| Group 4 | 182 (0.0%) | 347 (0.0%) | 127,542 (1.4%) | |
| Group 5 | 95,525 (8.3%) | 120,698 (8.0%) | 1,825,623 (20.6%) | |
| Group 6 | 96,006 (8.4%) | 114,871 (7.7%) | 471,764 (5.3%) | |
| Group 7 | 13,797 (1.2%) | 19,900 (1.3%) | 325,442 (3.7%) | |
| Group 8 | 87,912 (7.7%) | 122,972 (8.2%) | 1,183,186 (13.4%) | |
| Missing | 114 (0.0%) | 140 (0.0%) | 1,773 (0.0%) | |
| Covariate | Value | Study Sample n (%) | Post-9/11 Combat Service Cohort n (%) | Eligible VHA Cohort n (%) |
|---|---|---|---|---|
| VA Disability Rating | 0% | 59,591 (5.2%) | 85,767 (5.7%) | 546,965 (6.2%) |
| 10% | 139,835 (12.2%) | 200,156 (13.3%) | 1,301,688 (14.7%) | |
| 20% | 72,005 (6.3%) | 101,129 (6.7%) | 560,799 (6.3%) | |
| 30% | 74,830 (6.5%) | 104,660 (7.0%) | 490,403 (5.5%) | |
| 40% | 47,565 (4.2%) | 64,618 (4.3%) | 301,420 (3.4%) | |
| 50% | 81,990 (7.2%) | 112,826 (7.5%) | 384,958 (4.3%) | |
| 60% | 48,676 (4.3%) | 64,360 (4.3%) | 293,304 (3.3%) | |
| 70% | 91,621 (8.0%) | 127,841 (8.5%) | 423,070 (4.8%) | |
| 80% | 43,608 (3.8%) | 56,651 (3.8%) | 176,741 (2.0%) | |
| 90% | 32,534 (2.8%) | 39,956 (2.7%) | 119,680 (1.4%) | |
| 100% | 332,661 (29.0%) | 374,522 (25.0%) | 1,223,437 (13.8%) | |
| Missing | 120,385 (10.5%) | 166,975 (11.1%) | 3,031,000 (34.2%) | |
| Average Annual VA Outpatient Health Care Utilization | <1 encounter | 150,079 (13.1%) | 179,989 (12.0%) | 993,264 (11.2%) |
| 1 encounter | 169,630 (14.8%) | 195,772 (13.1%) | 1,112,759 (12.6%) | |
| 2–9 encounters | 594,249 (51.9%) | 783,341 (52.2%) | 4,167,812 (47.1%) | |
| >10 encounters | 228,678 (20.0%) | 337,057 (22.5%) | 2,545,436 (28.8%) |
| Supplementary Insurance (Lifetime) | Any supplementary | 526,129 (45.9%) | 708,268 (47.2%) | 4,749,073 (53.6%) |
| VHA coverage | 600,629 (52.4%) | 769,598 (51.3%) | 4,012,980 (45.3%) | |
| Unknown | 15,029 (1.3%) | 18,296 (1.2%) | 73,644 (0.8%) | |
| Missing | 3,514 (0.3%) | 3,299 (0.2%) | 17,768 (0.2%) | |
| Assigned a Primary Care Provider | Yes | 1,023,533 (89.4%) | 1,348,434 (89.9%) | 7,987,078 (90.2%) |
| No | 121,768 (10.6%) | 151,027 (10.1%) | 866,387 (9.8%) |
NOTES: Race, ethnicity, urbanicity, VA region (VISN), VA enrollment priority group, and VA disability rating were determined as the value closest to the first health encounter from 2017 to 2023 that was not unknown, declined, or missing. Urbanicity was determined from the National Center for Health Statistics’ Urban-Rural Classification Scheme for counties, 2013; locations outside of the continental United States were considered missing. Homelessness was determined by the presence or absence of International Classification of Diseases, Tenth Revision, codes for homelessness (Z59.00, Z59.01, Z59.02). VISN: VA’s health care services across the United States are divided into 18 regionally based systems of care called Veterans Integrated Service Networks, or VISNs. VA Priority Groups: Veterans who access VHA care are assigned by VA a priority group (numbered 1–8) based on factors such as service history, disability rating, income, and eligibility for other programs. Assigned a primary care provider indicates a primary care provider assigned for any length of time during the study period (2017–2023). Analyses conducted in VINCI on April 8, 2025, except for homelessness and primary care provider assignment variables, which were conducted on April 25, 2025 and May 13, 2025, respectively. The study sample was made up of VHA-linked ILER records that had a VHA inpatient or outpatient encounter during 2017–2023. The post-9/11 combat service cohort was made up of VHA records with a post-9/11 service flag (=1) and a combat service flag (=1). The eligible VHA cohort was made up of all VHA records with a diagnosis from an inpatient or outpatient facility during 2017–2023. MST = military sexual trauma; VA = Department of Veterans Affairs; VHA = Veterans Health Administration
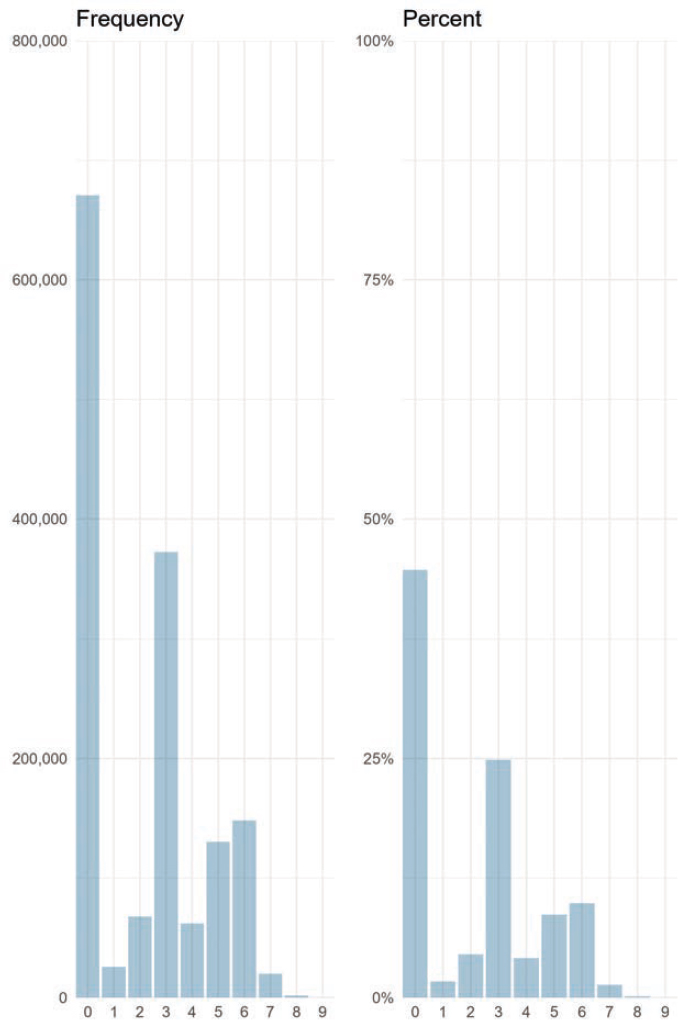
TABLE F-5 Outcome Prevalence by Veteran Cohort Eligibility Criteria
| Outcome | Study Sample n (%) | Post-9/11 Combat Service Cohort n (%) | Eligible VHA Cohort n (%) |
|---|---|---|---|
| Mental and Behavioral Health Outcomes | |||
| Adjustment Disorders | 423,877 (37.0%) | 556,152 (37.1%) | 2,142,136 (24.2%) |
| Attention Disorders | 70,310 (6.1%) | 92,202 (6.1%) | 220,627 (2.5%) |
| Anxiety Disorders | 199,477 (17.4%) | 256,464 (17.1%) | 1,044,532 (11.8%) |
| Depression | 473,754 (41.4%) | 630,965 (42.1%) | 2,705,892 (30.6%) |
| PTSD | 514,125 (44.9%) | 687,664 (45.9%) | 1,960,733 (22.1%) |
| Serious Mental Illness | |||
| Psychosis/Schizophrenia | 29,097 (2.5%) | 42,731 (2.8%) | 282,925 (3.2%) |
| Bipolar Disorder | 40,498 (3.5%) | 58,341 (3.9%) | 284,577 (3.2%) |
| Sleep Disorders | 572,012 (49.9%) | 756,901 (50.5%) | 3,347,097 (37.8%) |
| SUD | 311,996 (27.2%) | 436,961 (29.1%) | 2,166,493 (24.5%) |
| Nonfatal Suicide Attempts and Intentional Self-Harm | 12,603 (1.1%) | 17,041 (1.1%) | 58,868 (0.7%) |
| Neurologic Outcomes | |||
| ALS | 296 (0.0%) | 455 (0.0%) | 11,113 (0.1%) |
| Dementia | 3,890 (0.3%) | 5,530 (0.4%) | 501,030 (5.7%) |
| MS | 3,208 (0.3%) | 4,629 (0.3%) | 33,777 (0.4%) |
| Parkinson’s Disease | 1,155 (0.1%) | 1,666 (0.1%) | 136,054 (1.5%) |
| Outcome | Study Sample n (%) | Post-9/11 Combat Service Cohort n (%) | Eligible VHA Cohort n (%) |
|---|---|---|---|
| Chronic Multisymptom Illness | |||
| CMI | 105,125 (9.2%) | 145,567 (9.7%) | 721,943 (8.2%) |
| Traumatic Brain Injury | |||
| TBI | 137,051 (12.0%) | 177,379 (11.8%) | 384,259 (4.3%) |
| n | 1,145,301 | 1,499,461 | 8,853,465 |
NOTES: The study sample was made up of VHA-linked ILER records that had a VHA inpatient or outpatient encounter during 2017–2023. The post-9/11 combat service cohort was made up of VHA records with a post-9/11 service flag (=1) and a combat service flag (=1). The eligible VHA cohort was made up of all VHA records with a diagnosis from an inpatient or outpatient facility during 2017–2023. ALS = amyotrophic lateral sclerosis; CMI = chronic multisymptom illness; MS = multiple sclerosis; PTSD = posttraumatic stress disorder; SUD = substance use disorders; TBI = traumatic brain injury; VHA = Veterans Health Administration.


