Exploring Military Exposures and Mental, Behavioral, and Neurologic Health Outcomes Among Post-9/11 Veterans (2025)
Chapter: 5 Description of the Study Sample
5
Description of the Study Sample
This chapter describes the sample used for analyses of the possible relationships between exposures experienced during military service and the committee’s outcomes of interest. The exposures of interest are detailed in Chapter 3 and the outcomes and results are in Chapters 6–8. As described in more detail in Chapter 4, outcome and exposure data from the Veterans Health Administration (VHA) and Department of Defense (DoD), respectively, were made available to Westat, the committee’s subcontractor, for the case-control studies. The linked dataset comprises veterans who served after September 11, 2001 (hereafter, post-9/11), enrolled in Department of Veterans Affairs (VA) health care, received a diagnosis at a VA facility between 2017 and 2023, and had a record of specific environmental or occupational exposures in the Individual Longitudinal Exposure Record (ILER).
SAMPLE CONSTRUCTION
To construct the pool of eligible veterans for the case-control studies, the committee applied its inclusion criteria to the total records received from ILER and VHA. Per the study directive, the cohort was restricted to post-9/11 veterans. Because ILER data collection was only available to those who served in the post-9/11 era, having an ILER record provides an indicator of post-9/11 status. As described in Chapter 4, analysis was restricted to veterans with a VHA encounter during 2017–2023. Veterans must also have a record of an exposure (burn pits, dust and particulate matter [PM], exhaust, fuels, incinerator emissions, metals, mold, radiation,
solvents, or foodborne illness1) from the exposure pathway data in ILER and any diagnosis during an outpatient or inpatient visit in the VHA data.
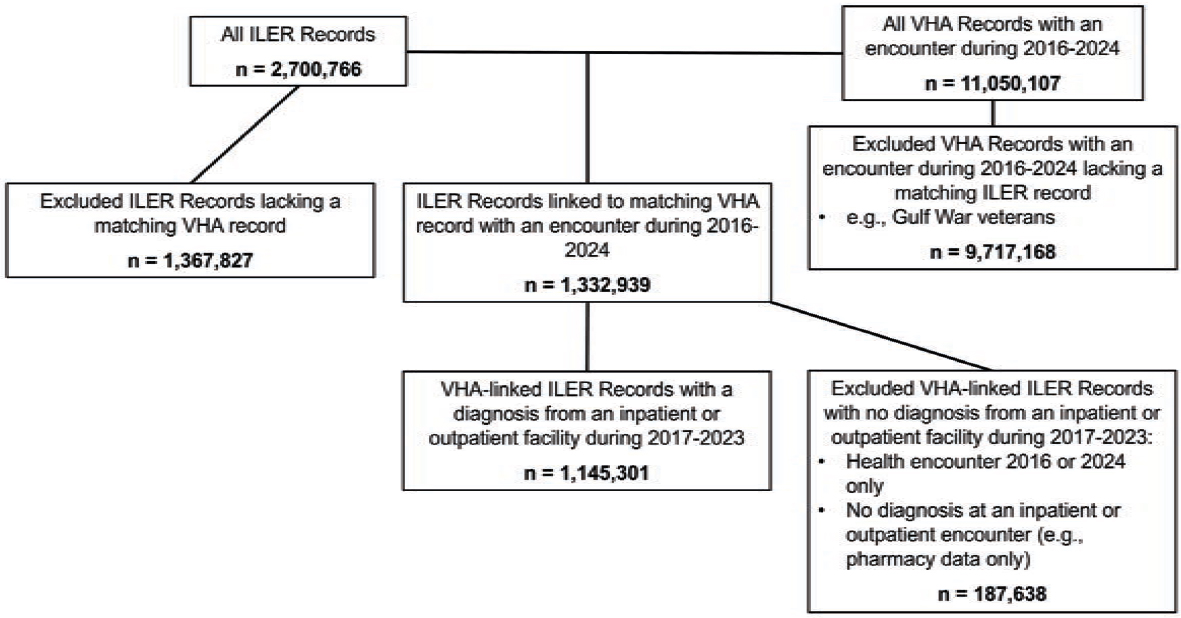
VHA recorded 11,050,107 unique patients between 2016 and 2024. Of the 2,700,766 ILER personnel records, 1,332,939 were linked to a matching VHA record. 1,367,827 ILER records lacked a matching VA record. After excluding those without a valid diagnosis of any health outcome during an outpatient or inpatient visit between 2017 and 2023 in the VHA data, 1,145,301 veterans comprised the final VHA-linked ILER dataset, which served as the pool for potential case and control sampling. Samples for each of the 135 case-control studies for each exposure–outcome pair depended on the identified cases of the outcome and up to four matched controls. Figure 5-1 illustrates how the study inclusion criteria were applied to develop the pool of eligible participants for each of the case-control studies.
DESCRIPTIVE STATISTICS
Table 5-1 presents variables used to match controls to cases: initial encounter age, birth sex, and VHA enrollment year (see also Chapter 4). Most were under age 45 at the time of their initial encounter (71.7%), male (86.7%), and enrolled after 2010 (78.0%).
The committee also examined variables used as covariates but not in the case-control matching (see Table 5-2). The majority of the sample were White (64.0%) and not Hispanic or Latino (79.5%). Most resided in rural (43.7%) or suburban (40.8%) areas; 4.3% experienced homelessness. The last branch for most of the sample was the Army (58.0%), followed by the Air Force (19.4%), Marines (9.8%), Navy (5.8%), and Coast Guard (0.1%). More than three-quarters (78.9%) were enlisted; 8.3% were officers. Overall, the sample had relatively high disability, as reflected by more than half being in Priority Group 1 (55.0%) and 29.0% with 100% disability rating, and 6.1% screened positive for military sexual trauma. Most of the sample (51.9%) had an average of two to nine health annual outpatient encounters, while one-fifth (20.0%) had 10 or more encounters; 89.4% were assigned a primary care provider.
___________________
1 The committee requested exposure to foodborne illness for use in sensitivity analyses but chose not to conduct these analyses because they would not produce meaningful estimates given the limitations of the data.
NOTE: ILER = Individual Longitudinal Exposure Record; VHA = Veterans Health Administration.
TABLE 5-1 Descriptive Statistics of Matching Characteristics
| Matching Criteria | Value | Veterans with ILER Data & Health Encounter n = 1,145,301 n (%) |
|---|---|---|
| Initial Encounter Age | 18–34 years | 469,178 (41.0%) |
| 35–44 years | 351,566 (30.7%) | |
| 45–54 years | 219,136 (19.1%) | |
| 55–64 years | 87,747 (7.7%) | |
| 65+ years | 17,659 (1.5%) | |
| Missing | 15 (0.0%) | |
| Birth Sex | Female | 152,500 (13.3%) |
| Male | 992,800 (86.7%) | |
| Missing | <10 (0.0%) | |
| Enrollment Year | <2001 | 14,112 (1.2%) |
| 2001–2010 | 238,168 (20.8%) | |
| 2010+ | 892,902 (78.0%) | |
| Missing | 119 (0.0%) |
NOTES: Cell sizes of 10 or less are noted as <10; analyses conducted in VINCI on April 8, 2025. Initial encounter age calculated using valid birth dates between 1900 and 2005. Enrollment year indicates the most recent enrollment year. ILER = Individual Longitudinal Exposure Record.
TABLE 5-2 Descriptive Statistics of Covariate Characteristics
| Covariate | Value | Veterans with ILER Data & Health Encounter n = 1,145,301 n (%) |
|---|---|---|
| Demographics | ||
| Race | American Indian or Alaska Native | 10,696 (0.9%) |
| Asian | 27,557 (2.4%) | |
| Black or African American | 195,925 (17.1%) | |
| Multiple races | 18,746 (1.6%) | |
| Native Hawaiian or other Pacific Islander | 15,027 (1.3%) | |
| White | 732,865 (64.0%) | |
| Unknown or declined | 73,454 (6.4%) | |
| Missing | 71,031 (6.2%) | |
| Covariate | Value | Veterans with ILER Data & Health Encounter n = 1,145,301 n (%) |
|---|---|---|
| Ethnicity | Hispanic or Latino | 131,664 (11.5%) |
| Not Hispanic or Latino | 910,005 (79.5%) | |
| Unknown or declined | 55,951 (4.9%) | |
| Missing | 47,681 (4.2%) | |
| Geography | ||
| Urbanicity | Urban | 167,387 (14.6%) |
| Suburban | 466,928 (40.8%) | |
| Rural | 500,723 (43.7%) | |
| Missing | 10,263 (0.9%) | |
| VA Region (VISN) | Region 1 | 34,966 (3.1%) |
| Region 2 | 37,495 (3.3%) | |
| Region 4 | 34,464 (3.0%) | |
| Region 5 | 38,729 (3.4%) | |
| Region 6 | 81,933 (7.2%) | |
| Region 7 | 97,656 (8.5%) | |
| Region 8 | 79,660 (7.0%) | |
| Region 9 | 48,093 (4.2%) | |
| Region 10 | 64,432 (5.6%) | |
| Region 12 | 39,467 (3.4%) | |
| Region 15 | 44,287 (3.9%) | |
| Region 16 | 76,758 (6.7%) | |
| Region 17 | 120,743 (10.5%) | |
| Region 19 | 79,187 (6.9%) | |
| Region 20 | 63,993 (5.6%) | |
| Region 21 | 59,374 (5.2%) | |
| Region 22 | 96,294 (8.4%) | |
| Region 23 | 47,770 (4.2%) | |
| Missing | 0 (0.0%) | |
| Homelessness | Experienced homelessness | 49,558 (4.3%) |
| No indication of homelessness | 1,095,743 (95.7%) | |
| Covariate | Value | Veterans with ILER Data & Health Encounter n = 1,145,301 n (%) |
|---|---|---|
| Military Service | ||
| Last Branch | Army | 664,574 (58.0%) |
| Air Force | 221,811 (19.4%) | |
| Coast Guard | 1,072 (0.1%) | |
| Marines | 111,866 (9.8%) | |
| Navy | 66,186 (5.8%) | |
| Others | 322 (0.0%) | |
| Unknown | 16,331 (1.4%) | |
| Missing | 63,139 (5.5%) | |
| Last Component | Active duty | 728,456 (63.6%) |
| Guard | 163,256 (14.3%) | |
| Reserve | 122,595 (10.7%) | |
| Unknown | 67,855 (5.9%) | |
| Missing | 63,139 (5.5%) | |
| Last Rank | Enlisted | 903,934 (78.9%) |
| Officer | 94,741 (8.3%) | |
| Unknown | 65,139 (5.7%) | |
| Missing | 81,487 (7.1%) | |
| VA and Insurance-Related Characteristics | ||
| Military Sexual Trauma | Screened reports MST | 69,643 (6.1%) |
| Screened does not report MST | 986,684 (86.2%) | |
| Unknown or declined | 1,647 (0.1%) | |
| Missing | 87,327 (7.6%) | |
| Covariate | Value | Veterans with ILER Data & Health Encounter n = 1,145,301 n (%) |
|---|---|---|
| VA Enrollment Priority Group | No group (-1) | 11,360 (1.0%) |
| Group 1 | 629,815 (55.0%) | |
| Group 2 | 100,533 (8.8%) | |
| Group 3 | 110,057 (9.6%) | |
| Group 4 | 182 (0.0%) | |
| Group 5 | 95,525 (8.3%) | |
| Group 6 | 96,006 (8.4%) | |
| Group 7 | 13,797 (1.2%) | |
| Group 8 | 87,912 (7.7%) | |
| Missing | 114 (0.0%) | |
| VA Disability Rating | 0% | 59,591 (5.2%) |
| 10% | 139,835 (12.2%) | |
| 20% | 72,005 (6.3%) | |
| 30% | 74,830 (6.5%) | |
| 40% | 47,565 (4.2%) | |
| 50% | 81,990 (7.2%) | |
| 60% | 48,676 (4.3%) | |
| 70% | 91,621 (8.0%) | |
| 80% | 43,608 (3.8%) | |
| 90% | 32,534 (2.8%) | |
| 100% | 332,661 (29.0%) | |
| Missing | 120,385 (10.5%) | |
| Average Annual VA Outpatient Health Care Utilization | <1 encounter | 150,079 (13.1%) |
| 1 encounter | 169,630 (14.8%) | |
| 2 – 9 encounters | 594,249 (51.9%) | |
| ≥10 encounters | 228,678 (20.0%) |
| Covariate | Value | Veterans with ILER Data & Health Encounter n = 1,145,301 n (%) |
|---|---|---|
| Supplementary Insurance (Lifetime) | Any supplementary | 526,129 (45.9%) |
| VHA coverage | 600,629 (52.4%) | |
| Unknown | 15,029 (1.3%) | |
| Missing | 3,514 (0.3%) | |
| Assigned a Primary Care Provider | Yes | 1,023,533 (89.4%) |
| No | 121,768 (10.6%) |
NOTES: Cell sizes of 10 or less are noted as <10. Race, ethnicity, urbanicity, VA region (VISN), VA enrollment priority group, and VA disability rating were determined as the value closest to the first health encounter from 2017 to 2023 that was not unknown, declined, or missing. Urbanicity was determined from the National Center for Health Statistics’ Urban-Rural Classification Scheme for counties, 2013; locations outside of the continental United States were considered missing. Homelessness was determined by the presence or absence of ICD-10 codes for homelessness (Z59.00, Z59.01, Z59.02). VISN: VA’s health care services across the United States are divided into 18 regionally based systems of care called Veterans Integrated Service Networks, or VISNs. VA Priority Groups: Veterans who access VHA care are assigned a group (numbered 1–8) based on factors such as service history, disability rating, income, and eligibility for other programs. Assigned a primary care provider indicates a primary care provider assigned for any length of time during the study period (2017–2023). Analyses conducted in VINCI on April 8, 2025, except for homelessness and primary care provider assignment variables, which were conducted on April 25, 2025 and May 13, 2025, respectively. ILER = Individual Longitudinal Exposure Record; MST = military sexual trauma; VA = Department of Veterans Affairs; VHA = Veterans Health Administration.
TABLE 5-3 ILER Exposure Pathway Counts of Individuals with at Least One Exposure
| Exposure | n (%) |
|---|---|
| Burn Pits | 72,500 (7.6%) |
| Dust and PM | 908,540 (94.6%) |
| Exhaust | 868,914 (90.5%) |
| Fuel | 442,824 (46.1%) |
| Incinerator Emissions | 732,551 (76.3%) |
| Metal | 224,863 (23.4%) |
| Mold | 87,834 (9.1%) |
| Radiation | 19,693 (2.1%) |
| Solvents | 316,434 (33.0%) |
NOTES: n = 960,128. ILER = Individual Longitudinal Exposure Record; PM = particulate matter.
EXPOSURES
Table 5-3 summarizes the number of veterans in the sample with at least one of the committee’s exposures of interest: burn pits, dust and PM, exhaust, fuels, incinerator emissions, metals, mold, radiation, and solvents. Dust and PM and exhaust were the most commonly recorded exposures, with 908,540 (94.6%) and 868,914 (90.5%) veterans, respectively, and just under half of the sample (46.1%, n = 442,824) were exposed to fuel. About three-quarters (76.3%, n = 732,551) were exposed to incinerator emissions, one-third to solvents (n = 316,434), and about one-quarter (23.4%, n = 224,863) to metals. Mold, burn pits, and radiation were the least common, with less than 10% of the sample exposed to each of these (mold: 9.1%, n = 87,834; burn pits: 7.6%, n = 72,500; and radiation: 2.1%, n = 19,693).
Figures 5-2 and 5-3 show overlapping exposures in the sample. Darker colors indicate higher percentages (Figure 5-2) and more individuals (Figure 5-3) with two overlapping exposures. For example, 22.6% of those exposed to burn pits were also exposed to dust and PM. As shown, the most overlap was among dust and PM, incinerator emissions, and exhaust, with about one-quarter to one-third of those with each also exposed to the other two. Figure 5-4 shows the distribution of distinct exposure groups, ranging from none to all nine. The majority of those with ILER data had three distinct exposures.
OUTCOMES
Table 5-4 summarizes diagnosed outcome prevalence in the sample. Nearly half had posttraumatic stress disorder (PTSD) (44.9%) or sleep disorders (49.9%). Approximately two in five had depression (41.4%) or adjustment disorder (37.0%). Roughly one-quarter had substance use disorders (SUD) (27.2%), and 6.1% had attention disorders. Rates of serious mental illness were low (3.5% for bipolar disorder and 2.5% for a composite of psychosis and schizophrenia). The four neurologic conditions (amyotrophic lateral sclerosis [ALS], dementia, multiple sclerosis, and Parkinson’s disease) were rare: less than 0.5% of the sample. Nearly one in 10 veterans had chronic multisymptom illness (CMI) (n = 105,125; 9.2%).
ASSESSMENT OF REPRESENTATIVENESS
Because a large share of records did not meet the inclusion criteria, the committee compared characteristics of the study sample to two veteran cohorts to understand its representativeness. First, to assess the validity of the ILER record as an indicator of post-9/11 status, the committee compared its sample to a cohort of VHA users identified as serving post-9/11 using an alternate indicator of post-9/11 status: having
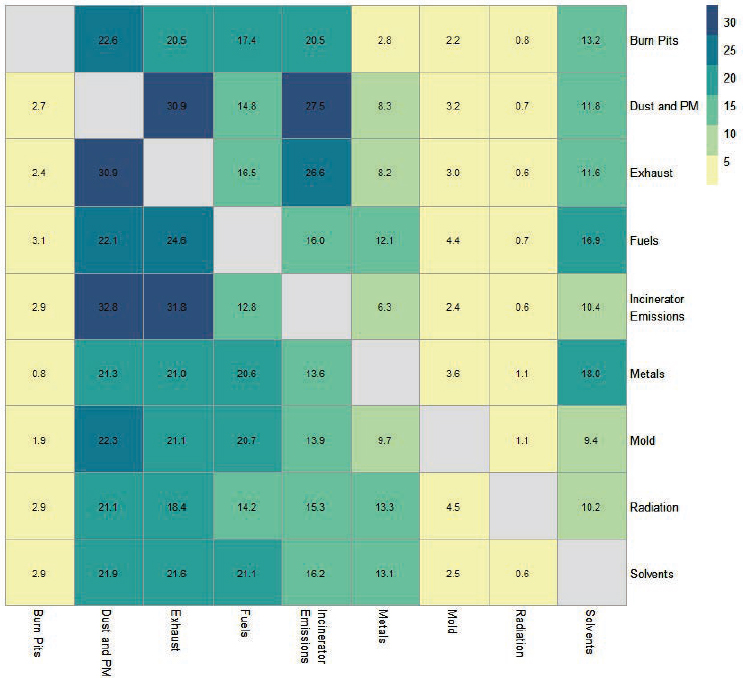
NOTE: PM = particulate matter.
a record of serving post-9/11 in United States Veterans Eligibility Trends and Statistics and a record of combat service in the VHA data, including those with and without matching ILER records. To assess representativeness compared to VHA users more broadly, the committee also compared its sample to all veterans with a diagnosis from an inpatient or outpatient visit during 2017 to 2023 (with and without matching ILER records) in the VHA data.
Overall, the study cohort was similar to the post-9/11 combat service cohort and more different from VHA users broadly. The study cohort and the post-9/11 combat service cohort are generally comparable, but the study sample tended to be younger (ages 18–34) and enroll in VHA later than those with combat service post-9/11 without ILER data. Compared to VHA users overall, the subset with matching ILER records was younger
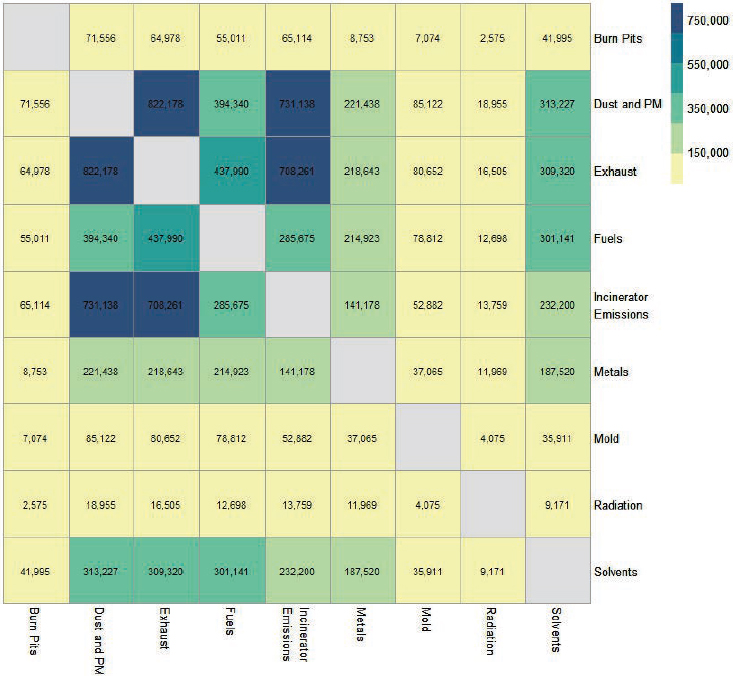
NOTES: n = 1,145,301. PM = particulate matter.
and more racially and ethnically diverse, included more female veterans, enrolled in VHA more recently, and had higher rates of disability. In addition, rates of mental health diagnoses are appreciably higher in the study sample and the post-9/11 combat service cohort than in the broader VHA cohort. By contrast, rates of neurologic health outcomes are lower, as expected, since the broader population of VHA users includes many older veterans with service before 9/11. Rates of CMI were comparable across the three cohorts. Appendix F presents comprehensive descriptive statistics for exposures, outcomes, and covariates for the three cohorts. As described in Chapter 4, these systematic differences suggest that the study sample may not be representative of all post-9/11 service members and veterans, all VHA users, and service members and veterans generally.

NOTE: ILER = Individual Longitudinal Exposure Record.
TABLE 5-4 Outcome Prevalence in the Study Sample
| Outcome | Study Sample n (%) |
|---|---|
| Mental and Behavioral Health Outcomes | |
| Adjustment Disorders | 423,877 (37.0%) |
| Attention Disorders | 70,310 (6.1%) |
| Anxiety Disorders | 199,477 (17.4%) |
| Depression | 473,754 (41.4%) |
| PTSD | 514,125 (44.9%) |
| Serious Mental Illness | |
| Psychosis/Schizophrenia | 29,097 (2.5%) |
| Bipolar Disorder | 40,498 (3.5%) |
| Sleep Disorders | 572,012 (49.9%) |
| SUD | 311,996 (27.2%) |
| Nonfatal Suicide Attempts and Intentional Self-Harm | 12,603 (1.1%) |
| Neurologic Outcomes | |
| ALS | 296 (0.0%) |
| Dementia | 3,890 (0.3%) |
| MS | 3,208 (0.3%) |
| Parkinson’s Disease | 1,155 (0.1%) |
| Chronic Multisymptom Illness | |
| CMI | 105,125 (9.2%) |
| Traumatic Brain Injury | |
| TBI | 137,051 (12.0%) |
| n | 1,145,301 |
NOTES: Health encounter indicates Veterans Health Administration health encounters 2017–2023. ALS = amyotrophic lateral sclerosis; CMI = chronic multisymptom illness; ILER = Individual Longitudinal Exposure Record; MS = multiple sclerosis; PTSD = posttraumatic stress disorder; SUD = substance use disorders; TBI = traumatic brain injury.
SUMMARY
For its analyses of the possible relationships between exposures experienced during deployment to Southwest Asia and Afghanistan and its outcomes of interest in post-9/11 veterans, the committee used linked outcome and exposure data from VHA and DoD for case-control studies. Its dataset included post-9/11 veterans who enrolled in VA health care, received a diagnosis at a VA facility between 2017 and 2023, and had a record of specific environmental or occupational exposures in ILER. Veterans in the study sample were mostly young, male, and non-Hispanic White; resided in rural or suburban areas; were Army veterans who enlisted; and had high rates of disability.
The committee’s exposures of interest were burn pits, dust and PM, exhaust, fuels, incinerator emissions, metals, mold, radiation, and solvents. Of these, the most common in the sample population were dust and PM, exhaust, and incinerator emissions, with common co-occurrence among those three (dust and PM and exhaust, dust and PM and incinerator emissions, and exhaust and incinerator emissions). The outcomes of interest were adjustment disorders, attention disorders, anxiety disorders, depression, PTSD, psychosis and schizophrenia, bipolar disorder, sleep disorders, SUD, nonfatal suicide attempts and intentional self-harm, ALS, dementia, MS, Parkinson’s disease, CMI, and traumatic brain injury. Sleep disorders, PTSD, and depression were the most common individual outcomes and most frequently co-occurring outcomes in the sample population.
Chapters 6, 7, and 8 present the committee’s results on possible relationships between the exposures and mental, behavioral, and neurologic health outcomes and CMI, respectively.


