Inclusive Virtual Public Involvement for Public Transit (2023)
Chapter: Appendix B - Survey Results

APPENDIX B
Survey Results
Task 2 of this research study was collecting data and information from public transit agencies to assess their VPI practice. The survey instrument consisted of the following components:
- Consent form
- Online survey questionnaire
Both the consent form and online survey questionnaire were reviewed and approved by the Institutional Review Board (IRB) at Rutgers University. The online survey was reviewed by the project panel in April 2022 before the kickoff meeting April 21. Comments from the panel were incorporated into the survey prior to testing. The online survey was programmed using Qualtrics and rigorously tested by Rutgers POET, selected Rutgers Bloustein and Voorhees Transportation Center staff and graduate students, and FHI (subconsultant) staff to ensure the questions were straightforward, easy to follow, ethical, and efficient. Comments and suggestions from the testers were incorporated into the survey before launch on May 6, 2022.
The survey was distributed electronically, leveraging contact information and suggested responders from the study team’s research efforts and professional knowledge, members of the project panel, and others. The survey was open for 8 weeks from May 6, 2022, through July 5, 2022. The research team undertook extensive follow-up by phone and email to ensure the appropriate person(s) completed the survey, remind them of the deadline, and assist with any questions or comments about the survey.
Overview
The research team developed a survey adapted from NCHRP Project 08-142, “Virtual Public Involvement: A Manual for Effective, Equitable, and Efficient Public Involvement,” to capture transit agencies’ experiences and practices for engaging with the public amid the restrictions during the pandemic. The purpose of the survey was to gather feedback on relevant VPI procedures deployed during the federal restrictions on public gathering, as well as the challenges transit agencies faced in successfully reaching out to communities, including vulnerable populations such as older adults, low-income communities, people with limited English proficiency, and people with disabilities. In this report, we present an analysis and discussion of survey responses.
The survey was developed using the online survey platform Qualtrics. The survey targeted transit agencies nationwide with a goal of having at least one significant response from each of the ten FTA regions. Survey respondents were leaders drawn from a wide range of departments within transit agencies including chiefs of engagement and external affairs, Title VI managers, equal employment opportunity (EEO) and diversity officers and diversity officers, managers of marketing and communications, planning directors, general managers, and executive directors.
Respondents were selected through a convenience sampling approach. Respondents represented organizations including public transit agencies, government entities, and transit consultants (Figure 3). The survey consisted of 33 questions, including four questions for general contact information, 25 multiple-choice questions, and four open-ended questions. The survey explored the level of VPI before COVID-19, platforms used by agencies, tools used during the restrictions for public gatherings, and the practices agencies will continue to implement moving forward. The survey was open for approximately 60 days. During this period, the team followed up via email and phone calls with representatives to encourage participation. The results and analysis of the survey indicate different experiences across transit agencies, yielding insights on a variety of approaches and implementation strategies. The responses also show transit agencies learning and adapting their public involvement using tools to reach both represented and underrepresented communities. As respondents indicate they are likely to continue to use VPI going forward, the findings of this research, including successes, challenges, and VPI tools to implement, are significant for transit agencies at different geographic locations and scales.
Survey Key Findings
- Prepandemic, only 6% of respondent agencies engaged in VPI strategies; during COVID-19 safety precautions all respondents indicated use of VPI.
- 92% of survey respondents felt that it is likely or highly likely they will keep using VPI tools, and almost 95% of the survey respondents seem to think it very likely that the public will continue to expect the use of VPI tools for outreach.
- To better prepare for that future, respondents shared what types of assistance would be most helpful, which included: peer exchange workshops, hands-on and online training, technical assistance, state of VPI practice resources and demonstrations, and the development of internal VPI policies.
- The number of participants, and the relevance and quantity of input were the primary metrics used to gauge VPI effectiveness. Most agencies do not use the built-in analytical tools within their selected software platforms for evaluation.
- Fewer than a third of respondents reported deploying hybrid meetings, in part due to technology challenges.
Using VPI During the Pandemic
- Virtual outreach methods and VPI tools were used primarily to provide general public information, conduct public hearings, post service notices, receive customer feedback, planning projects, and reach underserved groups.
- 50% of respondents planned and implemented VPI strategies using only internal staff and 42% used both staff and consultants. Agencies looked to internal staff, peer agencies, consultants, community partners, and government entities for resources to help develop and implement VPI tools.
- The most popular social media platforms respondents used were Facebook, Twitter, Instagram, and YouTube. In addition to virtual public meetings, respondents used dedicated websites, electronic surveys, and email blasts. Other tools included ArcGIS Story Maps, transit apps, and Mentimeter.
- Of the 68% of respondents that mentioned virtual public meetings, the most frequent platforms included Zoom, Webex, Microsoft Teams, and Google Meet. Respondents indicated that virtual meetings were helpful for gathering feedback from nonriders, people with disabilities, and people from distant communities.
- Benefits of VPI: 81% of respondents indicated that virtual tools were more convenient for the public, providing an option for people who have difficulty attending events in-person due to
- Challenges of VPI: VPI participants’ lack of computer or technology skills was the main external challenge for agencies, along with lack of access to internet service and technological devices. A lack of staff training and not having policies or guidance were significant internal challenges.
distance or schedule constraints. Respondents reported that this convenience translated into significant increases in participation, with less staff time and organizational cost.
Reaching Underserved Groups
- The underserved groups agencies tried to reach most often using VPI tools include minority communities, individuals with disabilities, and low-income communities.
- Language and income were identified as the most common barriers to securing participation. Respondents also perceived access to technology, and technical difficulties in using the platforms, and online access as challenges, as well.
- 50% of respondents indicated that the digital divide is a substantial or very substantial barrier to engaging with underserved groups.
- When respondents were asked what they did to facilitate public participation among underserved populations during the pandemic, the most frequent strategies included:
- Using social media advertising, e.g., Facebook
- Conducting in-person outreach at public transit stations, stops, etc.
- Partnering with the local community, civic, and religious leaders
- Strategies that help make information convenient to participants, like recorded meetings and translated materials
- Respondents perceive sending a hard copy of materials by mail, promoting events via traditional methods, holding virtual staff office hours, and extending public comment periods, as less effective strategies for reaching underserved groups.
- Transit agencies collaborated most often with government agencies (local, county, regional, or state), advocacy groups, and local/regional nonprofits in their VPI efforts. Respondents also cited local food banks, independent senior apartment buildings, and houses of worship as partners.
- 59% of respondents indicated they agreed or strongly agreed that VPI tools had contributed to increased engagement among underserved populations during the pandemic.
Survey Respondent Characteristics
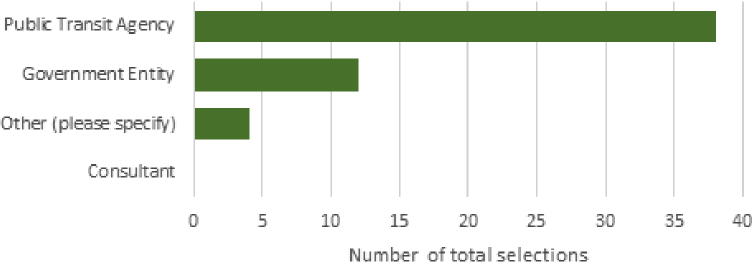
The research team received 69 responses, of which 49 provided information for analysis. There were respondents from each of the 10 FTA regions and agencies from 24 states. Figure B-1 shows the distribution of the types of organizations that participated in the survey. Of the responses, 38 (70%) are from public transit agencies, 12 (22%) are from government entities providing transportation, and four (7%) are from other types of organizations, including nonprofit
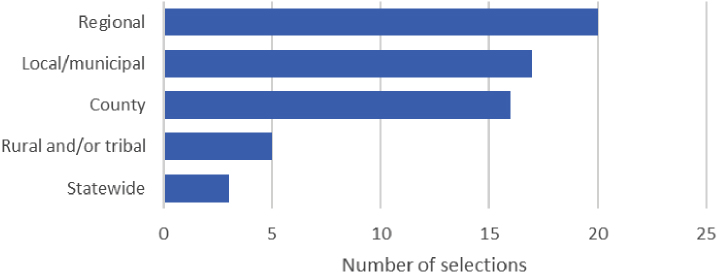
transportation providers and metropolitan planning organizations. Figure B-2 shows the type of geographic area served by the respondent organizations.
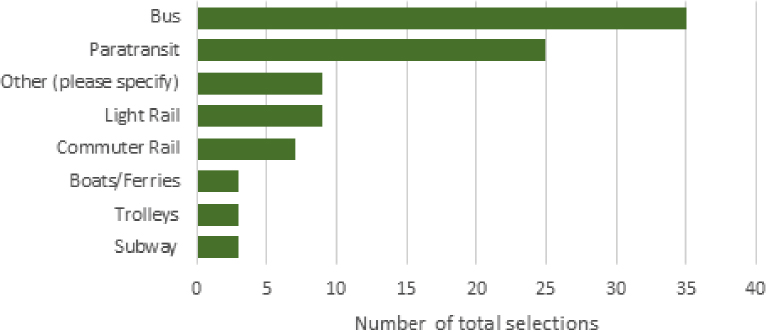
The research team asked respondents about the characteristics of the transportation services they provide. Among the respondents, 71% provide services that operate buses and paratransit. In addition to the provided options, respondents who selected “other” mentioned streetcars, bus rapid transit, heavy rail, and vanpools. Figure B-3 provides details of the services distribution of the respondents.
Outreach before COVID-19 Restrictions
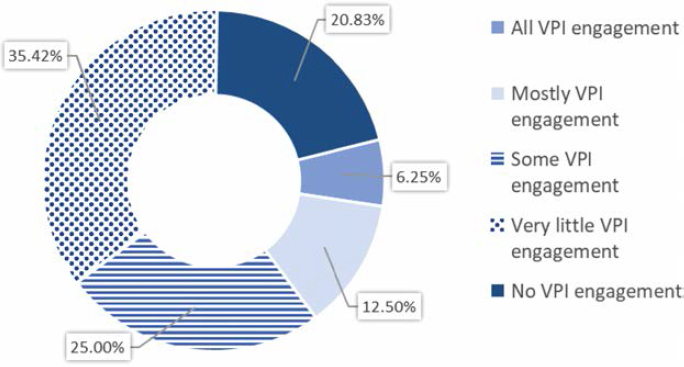
To consider the use of VPI tools before the COVID-19 pandemic restrictions, the survey asked respondents to estimate how much of their transit agency’s public outreach and engagement was conducted using virtual approaches. As shown in Figure B-4, while 25% of respondents used some VPI engagement tools prior to restrictions, 56% used few to no VPI tools before the restrictions. Only 6% of the respondents indicated that all their engagement was conducted using VPI tools before restrictions were put in place. The responses show that prior to restrictions, most agencies’ public involvement was conducted through in-person events, even with VPI as an option for engagement.
Outreach during COVID-19 Restrictions
In this section, the researchers asked respondents to explore what VPI tools were used during the height of the COVID-19 pandemic, specifically during a time of lockdowns and restrictions
for in-person gatherings, and some of the challenges they experienced. First, the researchers compared the percentage of agencies transitioning to a wholly virtual approach once the COVID-19 pandemic hit and restrictions on public gatherings were mandated. Figure B-5 shows that once these restrictions were put in place, all the agencies transitioned their public engagement into a virtual platform at some level, compared to just 6% of public involvement prepandemic.
Once transit agencies transitioned their engagement efforts and activities to virtual platforms, they primarily used these platforms to provide general public information, public hearings, service notices, and customer feedback (Figure B-6). Nevertheless, all service options were selected by respondents, meaning that agencies had a broad scope for using virtual tools in all services and projects.
Training and Implementation of VPI tools
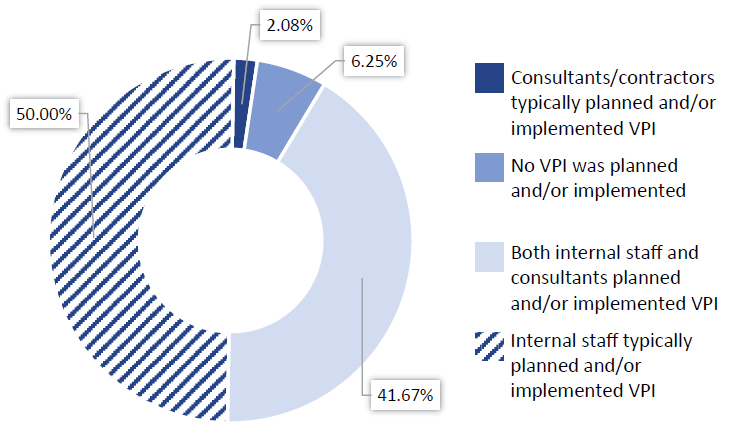
Agencies were asked about the strategies they used to implement VPI tools. Figure B-7 shows 50% of agencies relied on their staff to plan and implement VPI strategies, while almost 42%


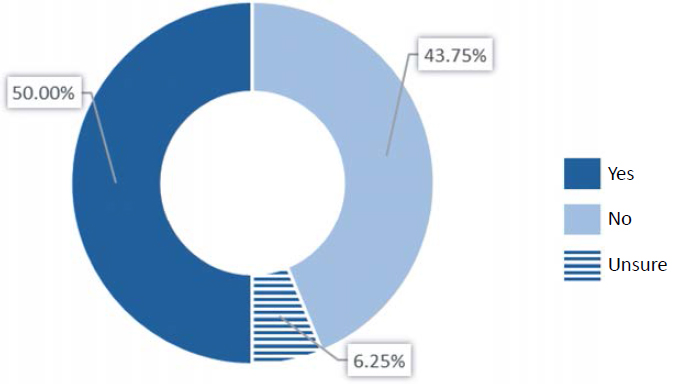
relied on external consultancy and internal strategies to plan and implement VPI strategies. Only 6% of the agencies said they did not have a plan to implement VPI strategies. In addition to having a plan for implementing VPI, some agencies received training or technical support either from within or outside their organization. Figure B-8 shows that 50% of the agencies received training or technical support, while almost 44% expressed that they did not receive training or technical support.
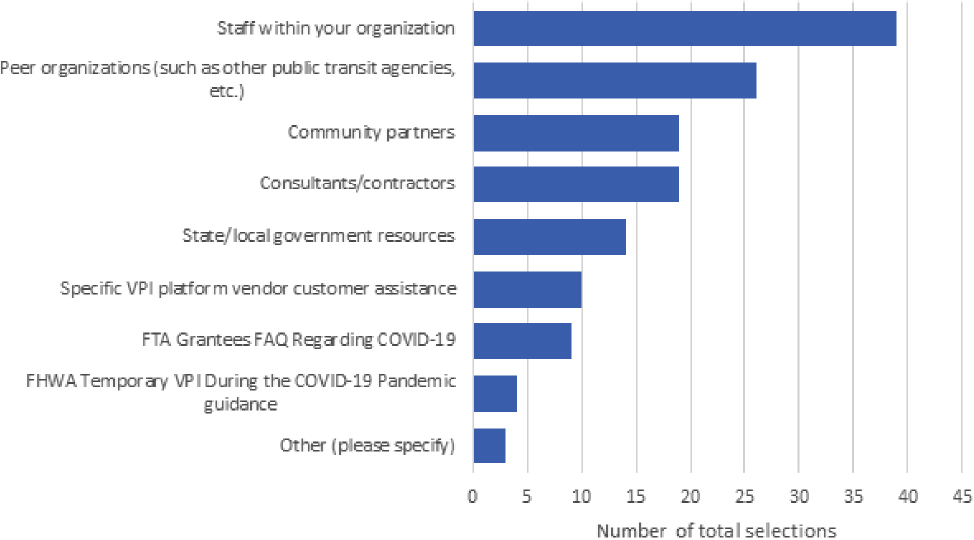
Figure B-9 shows that agencies used various available options to support their strategies and find better practices for their needs. A majority of respondents (39 out of 47) relied on their staff to implement VPI tools. In addition, more than half (26 out of 47), indicated that relying on the experiences of peer organizations was an important support to implementing VPI tools and practices.
VPI Tools Used by Agencies during the COVID-19 Pandemic
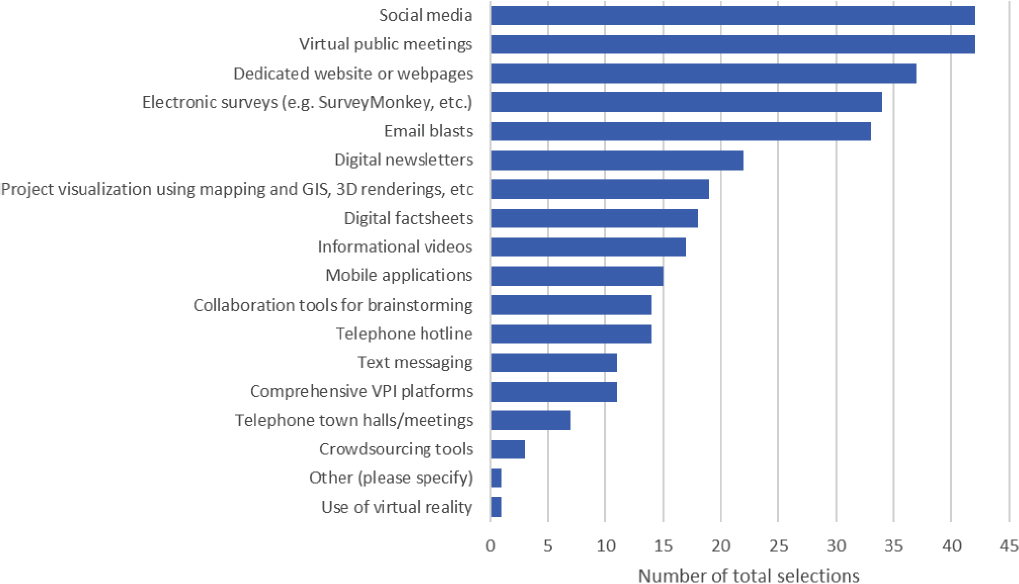
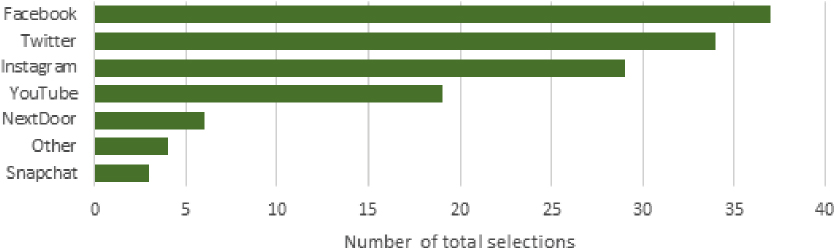
Agencies were asked to select the VPI tools they used during the COVID-19 federal restrictions and social distancing mandates, shown in Figure B-10. Social media and virtual public meetings were the tools most used by agencies. Of social media, the most popular platform was Facebook, followed by Twitter, Instagram, and YouTube, as shown in Figure B-11. In addition to social media and virtual public meetings, respondents commonly used dedicated websites, electronic surveys, and email blasts.
Agencies were asked their opinion about the online platform that they found most helpful. Zoom was mentioned in 46% of the comments, highlighting its accessibility, simplicity for hosts and users, and capacity to provide recording, closed captioning, and simultaneous interpretation.
Conducting virtual public meetings was a common use for virtual platforms, and 68% of the respondents mentioned virtual public meetings regardless of the platform of their preference (Zoom, Webex, Microsoft Teams, Google Meets). Agencies mentioned that virtual meetings were helpful for gathering feedback from nonriders, people with disabilities, and people from distant communities.
In addition to Zoom, respondents also mentioned using other virtual platforms for different types of engagement, including:
- ArcGIS StoryMaps, which allows for geographic and specific feedback
- Mentimeter as a complement to virtual meetings, a tool that can facilitate interaction and provide categorical feedback around the needs of the community
- Using the transit agencies’ app and popups (when riders access on-vehicle Wi-Fi) to provide links to upcoming outreach efforts for projects and plans
- Social media as an effective way to access and provide information to the general public
Selecting VPI Tools
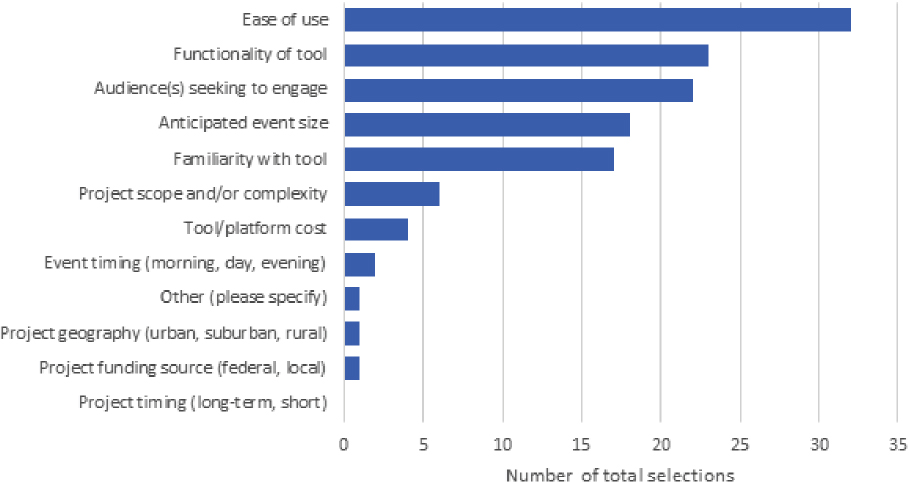
The survey asked respondents to indicate factors that influenced their selection of VPI tools. Figure B-12 shows transit agencies prioritize simplicity, functionality, event size, and the project’s specific need to reach its target audience. Among other options mentioned was the tool’s versatility to allow breakout rooms, simultaneous translation, and collaboration among respondents.
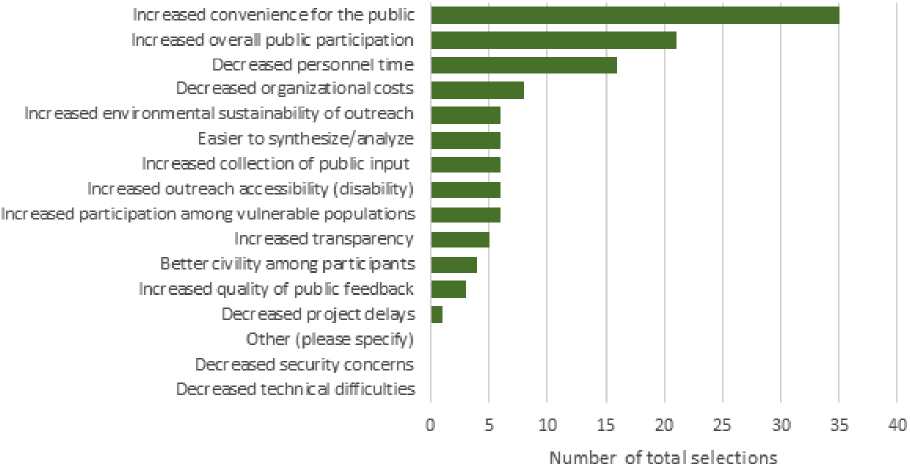
Agencies were asked to identify the benefits they have seen while using VPI during the COVID-19 restrictions. Most respondents (81%) indicated that virtual tools were more convenient for the public, providing an option for people who have difficulty attending events in-person due to distance or schedule constraints. According to respondents, this convenience also translated into major increases in participation. Other benefits are the decrease in the agencies’ personnel time dedicated to public involvement events, such as traveling and organizing events, as well as a reduction in organizational costs. Figure B-13 shows the distribution of benefits selected by agencies in greater detail.
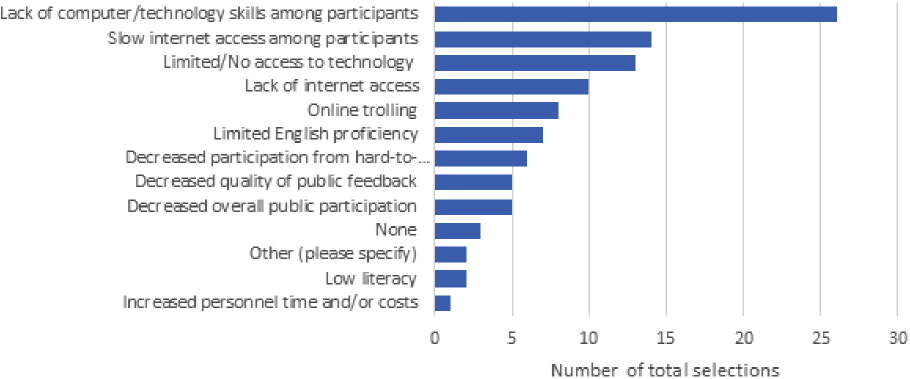
Respondents were asked about the external challenges they experienced using VPI during the COVID-19 pandemic restrictions. Figure B-14 shows potential VPI participants’ lack of computer or technology skills as the main challenge agencies needed to tackle. The lack of access to internet service and technological devices also represented a significant challenge. Even when the technology allows agencies for greater outreach, these results show there is a barrier to accessing virtual services. In offering more information about challenges, one respondent acknowledged the additional efforts needed to reach out to underserved communities, especially through in-person field work.
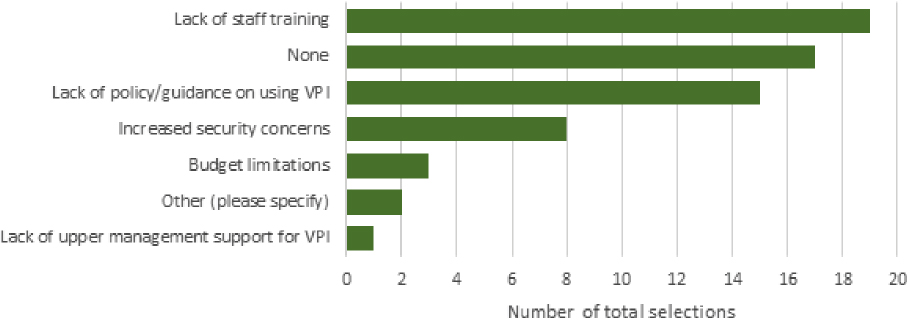
Internal challenges agencies encountered when of implementing VPI tools were the lack of staff training and not having policies or guidance, as shown in Figure B-15.
Regarding the strategies implemented to promote and spread the word about upcoming VPI events, respondents were asked to identify the most effective resource they have used (Figure B-16). Effective resources for promoting events included email blasts, dedicated project websites, and ads on local public transit vehicles, stations, or stops. Traditional methods like
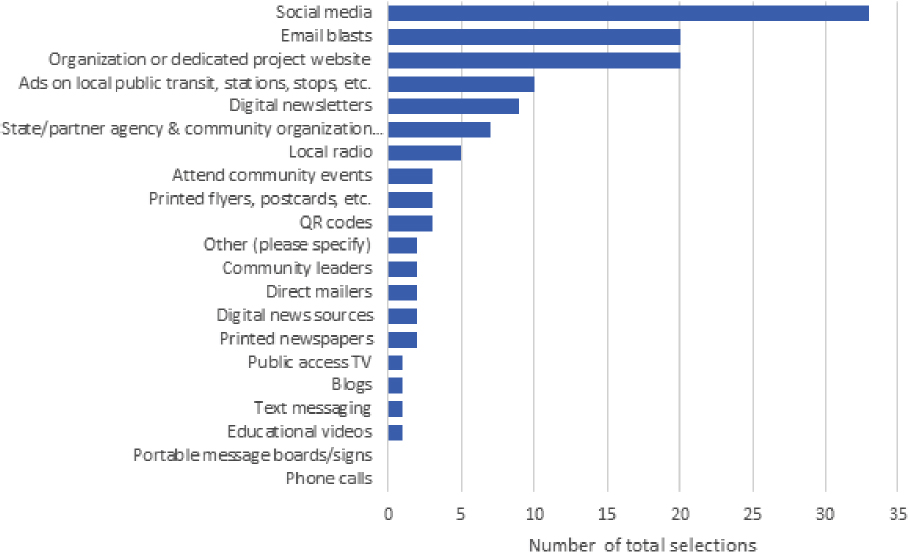
announcements on local radio, printed flyers, newspapers, and public access TV were not used frequently, as agencies relied more on digital media. Of the social media platforms, Facebook and Twitter were among the most used.
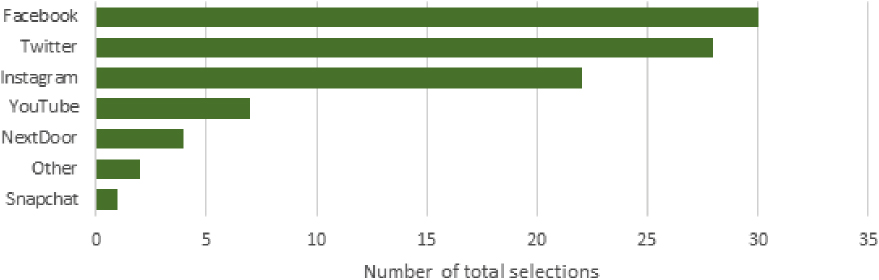
Agencies relied on social media to maintain interactions and announcements with current and potential riders; respondents identified diverse social media platforms as practical resources for promoting upcoming VPI events (Figure B-17). Once again, Facebook and Twitter were among the most commonly used social media platforms.
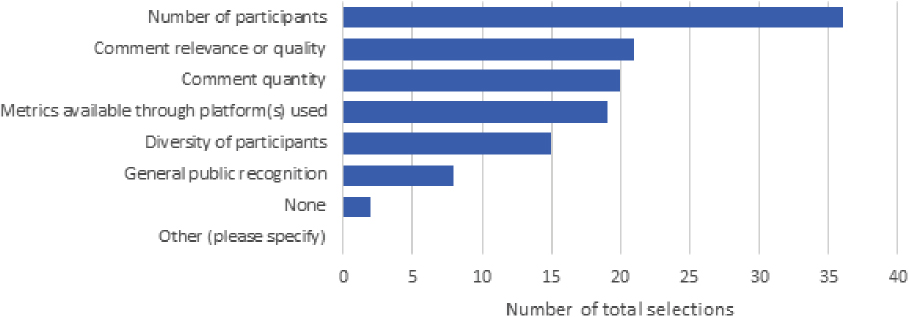
Figure B-18 shows number of VPI participants was the primary metric agencies used to evaluate the effectiveness of VPI tools used in events (36 out of 43, or 84%). Agencies also highly value the relevance or quality and quantity of the comments received. It is also important to note that less than half the respondents used the metrics available through their selected platforms, indicating an opportunity to train staff about strategic deployment of VPI analysis tools.
Hybrid Meetings
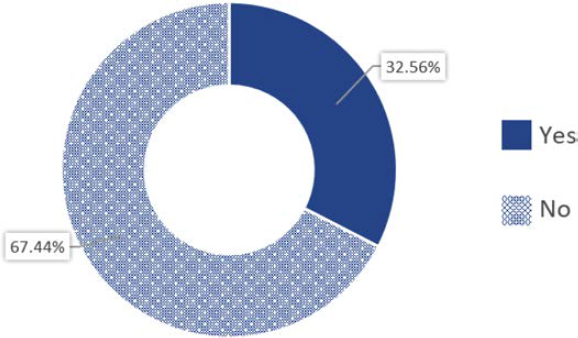
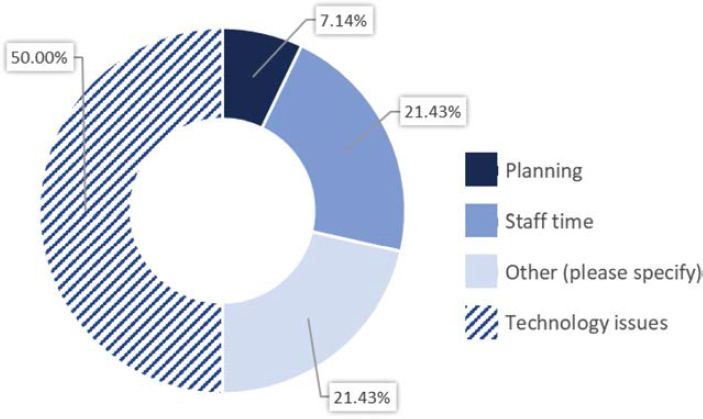
Regarding hybrid public outreach events, Figure B-19 shows that 67% of the agencies did not hold hybrid (simultaneous in-person and virtual) events during the pandemic. The 33% that did identified technology issues as the most significant challenge when implementing a hybrid outreach event (Figure B-20). The time staff spent organizing hybrid events was also considered a top challenge. Among the challenges identified as “other,” respondents mentioned finding an appropriate venue and being compliant with the Brown Act (which traditionally allowed a local transit agency to use teleconferencing for meetings or proceedings, subject to specific agenda posting, physical access, and quorum requirements), local public health rules, and other requirements as considerations.
Engaging with Specific and Vulnerable Groups
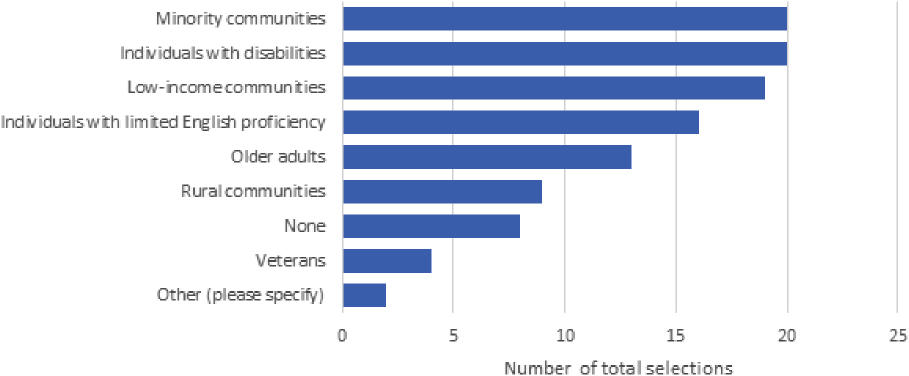
Besides the efforts transit agencies implemented to reach out to the general public, they also maintained efforts to reach out to target and underserved groups. Figure B-21 shows that minority communities and individuals with disabilities were identified as the main groups agencies tried to reach using VPI tools for outreach and engagement. It is notable that eight respondents did not identify any target groups for their VPI efforts, suggesting there is still some work to help agencies better prepare strategies and policies to reach underserved communities with VPI tools.
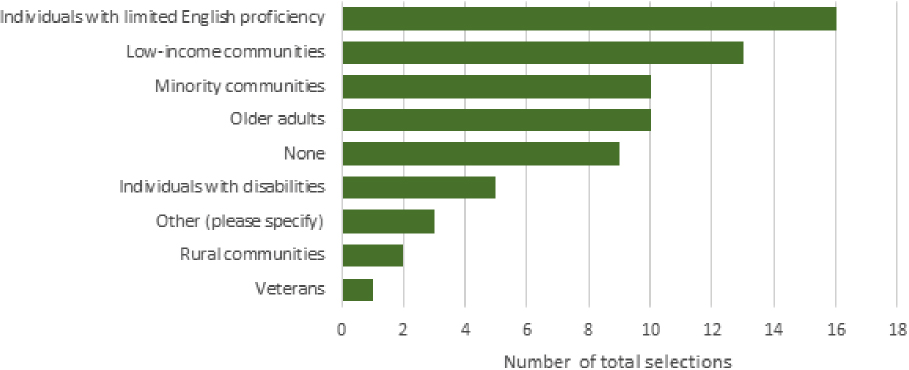
Closely related to agencies’ efforts to reach out to underserved groups are efforts to secure their participation. As shown in Figure B-21, agencies practiced VPI efforts to reach out to minority communities and individuals with disabilities more often than other groups. However, Figure B-22 indicates that the groups with language barriers and lower incomes are the most challenging to engage with and to secure participation from. In addition, those who selected the “other” option indicated that they may not have the analytics to know the potential participants’ demographics.
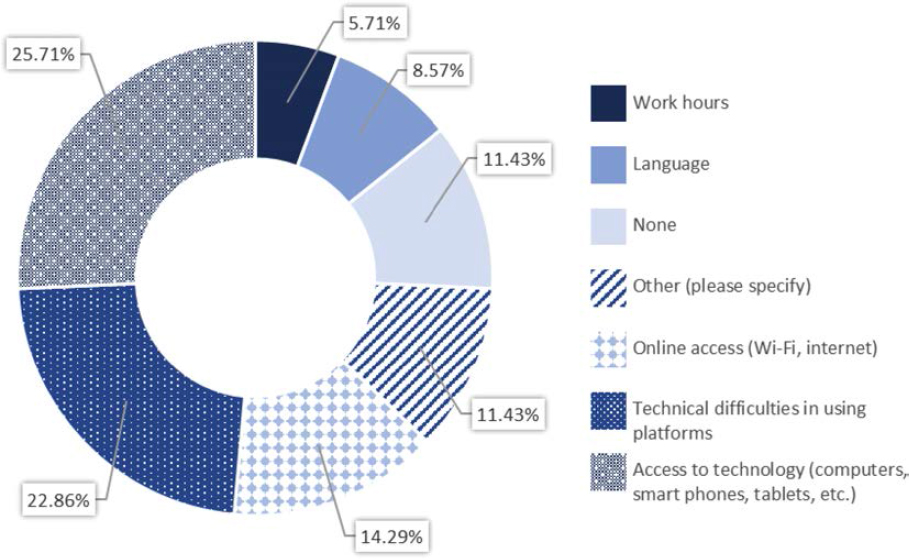
Respondents were asked to identify what they believed was the most common barrier to participation for vulnerable groups. Figure B-23 shows respondents perceived access to technology and technical difficulties in using the platforms as the most common barriers. This suggests vulnerable groups lack access to platforms or technology devices. Moreover, some respondents expressed their incapacity to identify these barriers by writing comments about not knowing the reasons and the need to learn about them.
Another barrier to participation was online access. Question 24 defines the term “digital divide” as “uneven access to the internet” and asks agencies to determine the magnitude of this barrier
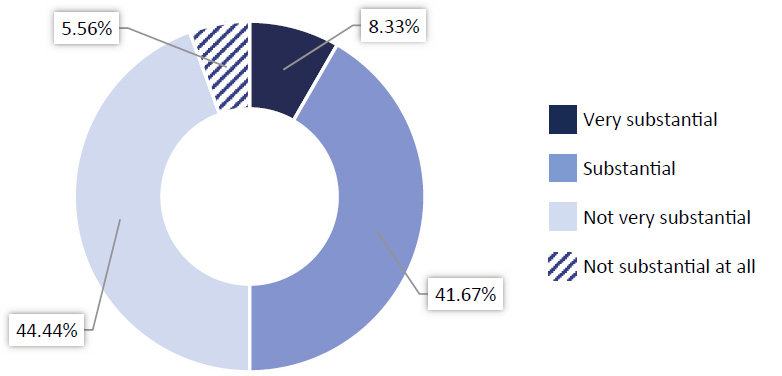
to engaging vulnerable populations with their projects during the pandemic. In Figure B-23, “access to technology” and “online access” were identified as the main barriers to participation for vulnerable groups; Figure B-24 shows that half the respondents found this digital divide a substantial or very substantial barrier to engaging with vulnerable groups.
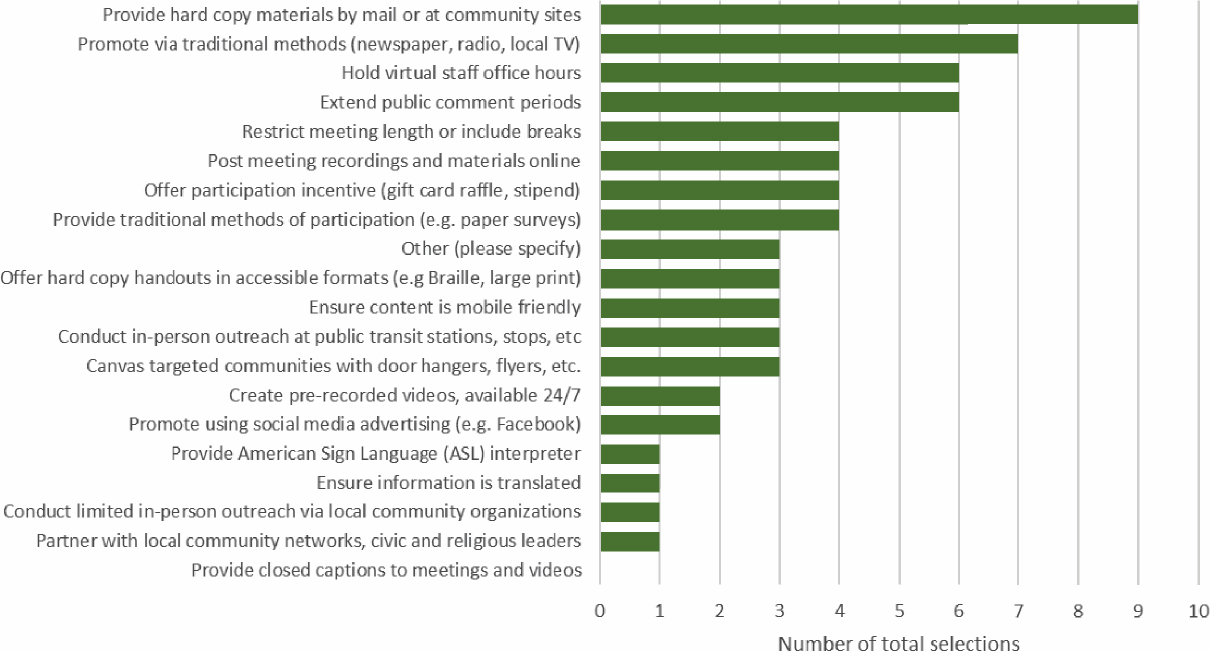
Respondents were asked what strategies they used to facilitate public participation among vulnerable/underrepresented populations during the pandemic and were provided a list of 20 options. Figure B-25 shows the three most selected strategies (selected by over 40% of the respondents) were:
- Using social media advertising, like Facebook
- Conducting in-person outreach at public transit stations, stops, etc.
- Partnering with the local community, civic, and religious leaders

In addition, respondents selected strategies that help make information more convenient to potential VPI participants, like recorded meetings and translated materials.
In contrast to the previous question, agencies were asked to identify the three least effective strategies to facilitate access to vulnerable groups. From the list of twenty options, Figure B-26 shows that providing a hard copy of materials by mail does not effectively encourage participation among vulnerable groups. Other ineffective options were promoting events via traditional methods like mail, newspaper, radio, or TV; holding virtual staff office hours; and extending public comment periods.
In question 28, respondents also were asked to share some of the positive experiences they have had using VPI tools, platforms, or approaches to reach vulnerable groups. Some of the strategies that were mentioned as good examples are summarized here.
- Hosting virtual meetings with call-in access specific to a neighborhood with an older population
- Working with community-based organizations (CBOs) to reach out to low-income non-English-speaking communities and facilitate meetings and events in their language
- Hosting live discussion events on platforms like Facebook
- Keeping the information simple and available on the web page with their proper translation
- Setting up in-person efforts at local public spaces that people frequented, like grocery stores, and having people there who speak their language
- Working with local advocates has shown to be very beneficial in reaching specific communities like unhoused communities
- MoCollab as a public involvement tool to educate and gather feedback, not identified as an option by the research team
- Diversifying the options available that users can contact the agencies, like providing emails and numbers through text blasts to registered users
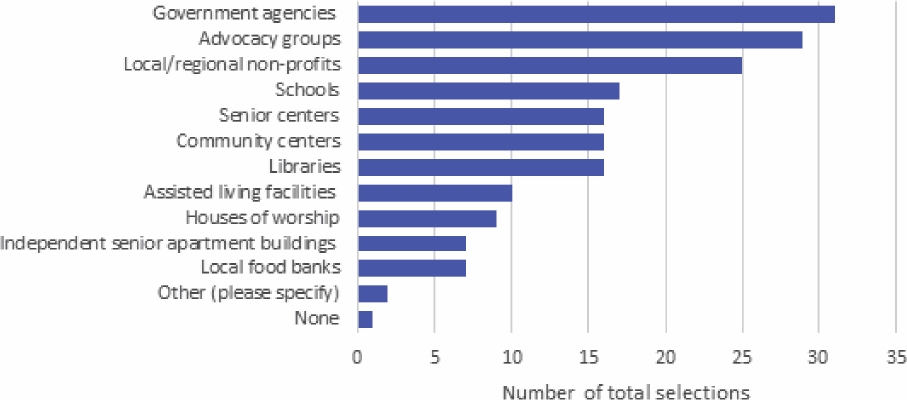
When asked about the types of community organizations their agencies collaborated with during COVID-19 to promote VPI efforts, the top answer was government agencies (local, county, regional, or state), with 86% of the respondents choosing it, followed by advocacy groups with 81%, and local/regional nonprofits with 69%, as shown in Figure B-27. Less frequent responses included local food banks, independent senior apartment buildings, and houses of worship. Among the “other” open-ended responses mentioned were CBOs and neighborhood associations.
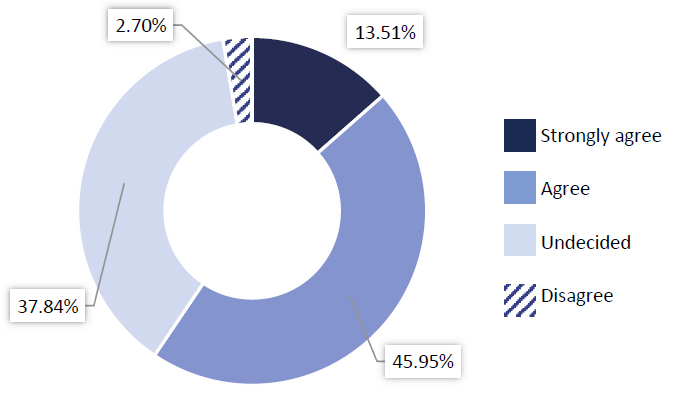
Lastly, respondents were asked whether they thought VPI tools had contributed to engagement from vulnerable populations during the pandemic. Figure B-28 shows that the majority of respondents (59%) agreed or strongly agreed with this statement, while 38% felt unsure about the VPI tools’ impact. Just 2.7% did not feel VPI efforts contributed to increasing engagement with these populations.
Moving Forward
In the final section of the survey, respondents were asked about their plans to keep implementing VPI tools moving forward for their outreach post-peak COVID-19 pandemic. As mentioned in the previous sections, the convenience of using VPI tools should encourage transit agencies to further explore more their potential for connecting with vulnerable populations. Moreover, using the data analytics built into some of the tools can further illustrate their impact and benefit, something that is currently underutilized.
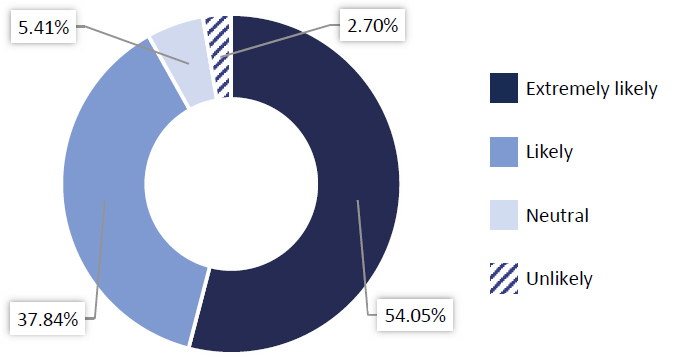
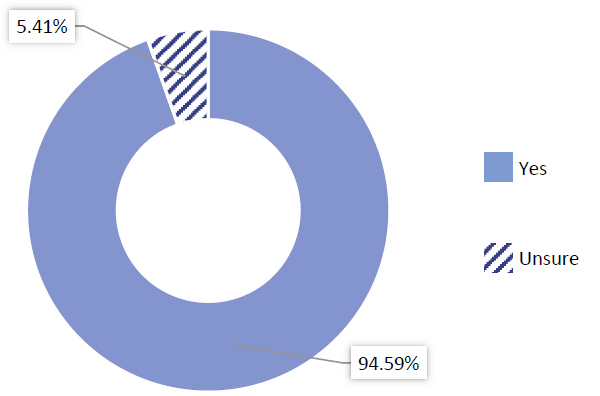
As shown in Figure B-29, the majority of respondents (92%) felt that it was likely or highly likely they would keep using VPI tools, while 8.11% of respondents felt neutral or that it was unlikely they would use them in the future. And as seen in Figure B-30, almost 95% of survey respondents thought it very likely the public would continue to expect the use of VPI tools for outreach.
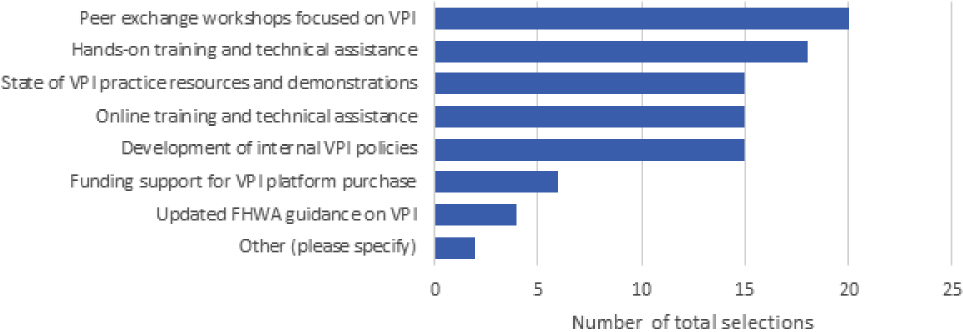
Respondents were also asked what types of assistance would be most helpful to their organization in improving or expanding its use of VPI moving forward. The most popular options identified by agencies were peer exchange workshops, hands-on and online training, technical
assistance, state of VPI practice resources and demonstrations, and the development of internal VPI policies (Figure B-31). Learning best practices from peer experiences and training is a priority for agencies, especially to reach out to vulnerable communities. For example, in one response, the survey respondent challenged the language used to describe these populations, saying “hard-to-reach” or “vulnerable communities” as a negative frame, and rather, to use the language “priority communities.”
Open-Ended Questions
The final section of the survey provided open-ended questions (questions 33 and 34) to get more detailed insights into the agencies’ experiences with VPI during the pandemic. This section asked respondents about new VPI tools or platforms they would like to see their agencies use moving forward. The section also provided an opportunity for additional comments on VPI use.
VPI Successes
- The implementation of VPI tools has helped agencies internally by reducing travel costs and times their staff need to organize the events.
- For the public, VPI tools have facilitated participation, providing more options for reviewing the materials and being involved, although it is not the same story for all demographic groups.
Moving Forward
- Respondents indicated that regardless of the platform or tool, they would like to keep providing virtual or hybrid meetings and distribute information and materials on demand to help the people who cannot attend sessions physically.
- Efforts to promote and educate elderly and low-income people to learn how to use the different platforms and tools are necessary to improve their much-needed participation in the processes and projects.
- The incorporation of a third-party organization to train the staff, develop VPI policies, and better implement VPI tools for outreach and participation. Hiring a third party was more efficient than relying on the IT department, which would have added an additional task to an area that is not their expertise.
Challenges
- Across agencies, VPI tools still need to be explored and studied to implement better outreach to vulnerable and underrepresented communities, and to better analyze participation, demographics, and detailed data the tools can provide.
- Understanding the tools can help agencies improve the feedback obtained, better understand the community needs, and better focus their efforts and limited resources.
Tools and Strategies
- Tools mentioned in this section included virtual whiteboards, Google Jamboard, Mural, and online surveys. These tools help provide live interaction within the platform and encourage interaction between facilitators and respondents. Agencies also showed interest in more sophisticated tools like Virtual Reality or GIS collaboration on maps, which could help respondents to better understand the dimensions of the project and gather specific feedback about a geographical area.
- A strategy mentioned was to improve the transit agency’s website and apps to track data about the projects and improve the services they provide, which could result in more efficient actions. One transit agency is exploring improving its page to make scheduling or canceling paratransit services more accessible and efficient.
Conclusion
Through the survey, transit agencies share their differing experiences, yielding insights on a variety of approaches and implementation strategies. There are both successful outcomes, such as reducing travel costs and time and facilitating participation. There are also remaining challenges and questions to explore, including better outreach and engagement with vulnerable and underrepresented communities. The responses also show transit agencies learning and adapting their public involvement using tools to reach both represented and underrepresented communities.
The findings will allow setting the next steps in the research and provide an important baseline for a better understanding the use and experience of VPI during the COVID-19 pandemic and its potential for the future.


