Assessing the 2020 Census: Final Report (2023)
Chapter: Appendix F: Additional Detail and Reference on Data Products and Disclosure Avoidance
– F –
Additional Detail and Reference on Data Products and Disclosure Avoidance
F.1 EXPLANATION OF DIFFERENTIAL PRIVACY
Two formulations of differential privacy (DP), pure/approximate DP (the original approach) and zero-concentrated DP (zCDP), are outlined with sufficient mathematical formalism to communicate the concepts and identify control parameters. For additional details and application to the 2020 Census, see Abowd and Hawes (2023), Gong et al. (2022), and Special Issue 2 of the Harvard Data Science Review (2022). See also Shlomo (2023).
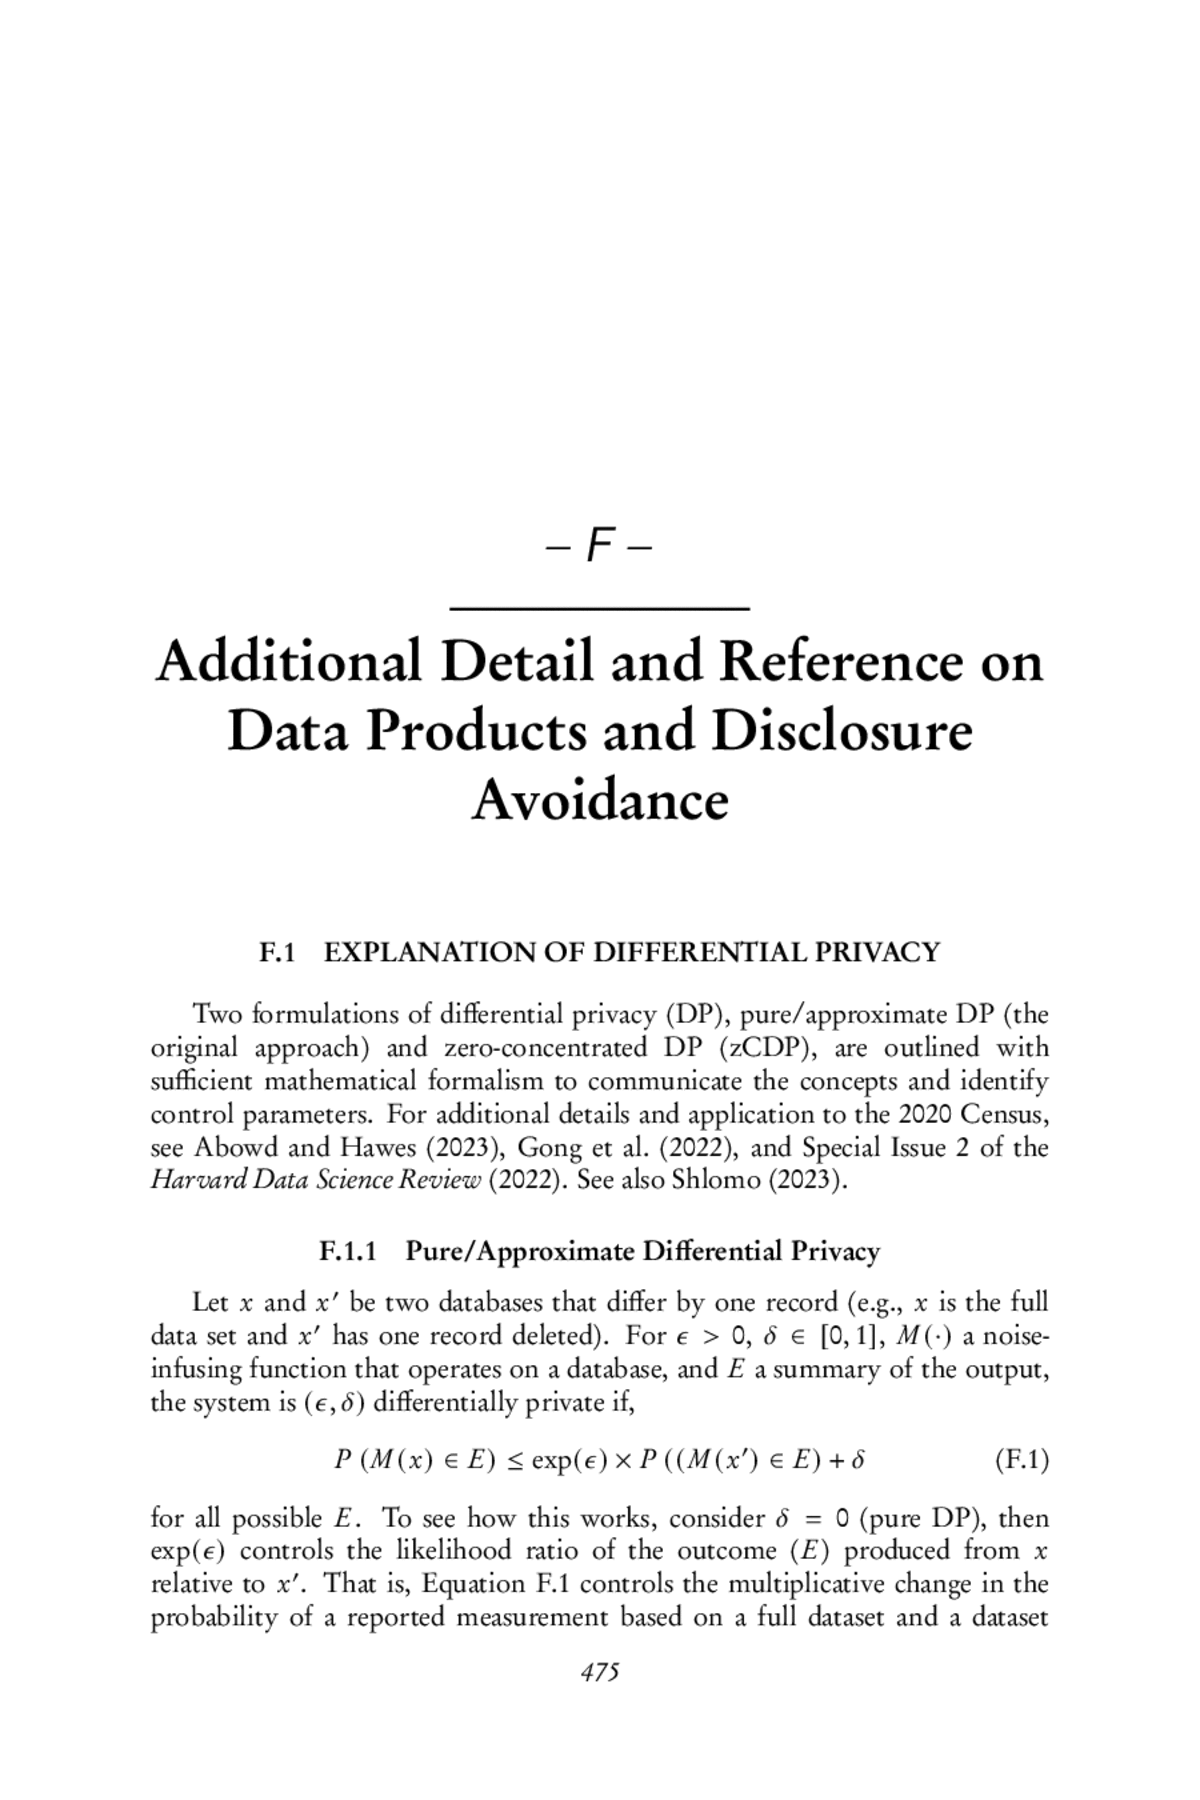
F.1.1 Pure/Approximate Differential Privacy
Let x and x' be two databases that differ by one record (e.g., x is the full data set and x' has one record deleted). For ∊ > 0, δ ∈ [0, 1], M (·) a noise-infusing function that operates on a database, and E a summary of the output, the system is (∊, δ) differentially private if,
| P (M(x) ∈ E) ≤ exp(∊) × P ((M(x') ∈ E) + δ | (F.1) |
for all possible E. To see how this works, consider δ = 0 (pure DP), then exp(∊) controls the likelihood ratio of the outcome (E) produced from x relative to x'. That is, Equation F.1 controls the multiplicative change in the probability of a reported measurement based on a full dataset and a dataset
with one respondent removed, and the probability of identification/disclosure is larger for a larger likelihood ratio. The protection guarantee is probabilistic and relative/comparative, not absolute. The parameter ∊ is the “privacy loss budget.” Setting ∊ = 0 constrains the likelihood ratio to equal 1.0 (no transmitted information, but complete protection). Increasing ∊ without bound allows communication of full information with no protection.
The approach provides global protection for all possible outcomes E without regard to the consequences of disclosure or the particular information available to potential intruders. Setting δ > 0 (approximate DP) introduces the possibility of violating the pure DP likelihood ratio bound, exp(∊), to accommodate low-prevalence Es. The U.S. Census Bureau adopted ∊ = 19.61 for the 2020 Redistricting File, 17.14 for the person tables and 2.47 for the housing unit tables.1 The amount of disclosure protection actually realized with such high parameter values is harder to know.
If k multiple, independent queries are posed to the posted data, the overall privacy loss budget equals ∊ 1 + · · · + ∊ k, the sum of the individual privacy loss budgets. So, maintaining an overall privacy loss budget of ∊ * requires individual budgets that average ∊ ∗/k, which can be very small, allowing very little information to “leak through.”
The approach is similar in spirit to a minimax statistical procedure, one that bounds the maximum risk for all states of nature. Minimax “pays” for this protection by reducing the benefit, sometimes considerably, for what might be the most important and likely underlying states of nature.
F.1.2 Zero-Concentrated Differential Privacy
For details, see Abowd et al. (2022). For ρ ≥ 0 and α > 1, a randomized mechanism satisfies ρ-zero-concentrated differential privacy ((α, ρ)-zCDP) if
| Dα {M(x) ∣∣ M(x')} ≤ ρ α, for all α > 1, | (F.2) |
where Dα is the Renyi divergence of order α (a measure of distance between two probability distributions). Here, rather than controlling disclosure for all output subsets (E), the criterion is to ensure that the full distributions of output data for the two datasets are “close.” As for the pure/approximate approach in Equation F.1, control is global with no particular attention to important aspects of the difference in distributions, and the privacy loss budget, controlled by (α, ρ), increases with the number of queries.2
___________________
1 This text was revised after release of the prepublication version of the report to cite Census Bureau press release language (https://www.census.gov/newsroom/press-releases/2021/2020-census-key-parameters.html) and to strike a previous assertion to implications for the likelihood ratio associated with confidential information disclosure.
2 Enhancements reduce k · ∊ to
F.1.3 Census Bureau Adaptations of Differential Privacy to the 2020 Census Context
Differential privacy is at the core of the Census Bureau’s 2020 Disclosure Avoidance System (DAS).3 However, the Census Bureau needed to adapt the mathematically posed DP approaches to the realities of the 2020 Census. Realities include a wide variety of geographic and demographic domains that require different protection versus information trade-offs, a very large and to a degree unknowable set of future queries on the posted data, and face-validity constraints. The Census Bureau’s approach for the 2020 Redistricting and Demographic and Housing Characteristics (DHC) Files was to create a “spine” to which most (not all) of these domains attached and use a TopDown Algorithm (TDA) to infuse noise with varying disclosure budgets for different domains (on-spine, off-spine, American Indian or Alaska Native spine).4 Since the privacy loss budget increases with the number of queries, domain-specific budgets, indexed by (∊, δ) or (α, ρ), need to be very small to bound overall disclosure risk. However, a small budget produces low information in posted data, especially for small-population domains.
To the Census Bureau’s credit, it held workshops (see National Academies of Sciences, Engineering, and Medicine, 2020, 2023) and in other ways solicited user feedback and from these inputs increased the privacy loss budget for some domains. The increases improved the usefulness of posted data with a consequent increase in identification risk. It remains to be seen whether these increased budgets have unacceptably increased exposure risk.
In one modification of generic DP, the Census Bureau defined several “invariants,” for example, that a state total in posted data match the underlying, collected total. Invariants are important for face validity and some legal requirements, but they increase disclosure risk. In a similar vein, posted counts need to be non-negative, and noise infusion for a small count can produce a negative value. So, a non-negative constraint, implemented by multipass least squares to minimize discrepancies, was applied to all counts. Negative counts were transformed to non-negative values and to honor invariants, noise-infused positive counts were reduced. These adjustments induce positive bias for small population domains and some negative bias for larger population domains.
While the mathematics underlying DP are transparent to the mathematically inclined, modifications such as the spine, invariants, and the non-negativity constraint make the full process translucent at best, possibly bordering on
___________________
3 See Abowd (2021b); Abowd et al. (2022); Abowd and Hawes (2023); Gong et al. (2022); U.S. Census Bureau (2021e); and Harvard Data Science Review: Special Issue on Data Privacy and the 2020 Census.
4 Different algorithms are being developed for the DDHC and S-DHC files, but their properties are not yet well documented. A March 14, 2022, white paper by Tumult Labs describes the SafeTab-P algorithm for DDHC-A (available at https://www2.census.gov/about/partners/cac/sac/meetings/2022-03/dhc-attachment-1-safetab-dp-algorithms.pdf.
opaque. It is attractive to use an algorithm because it provides unambiguous documentation of the process, and is reproducible in that posted data are reproduced if the same random number seeds are used followed by the same post-DP processing. Reproducibility is important but does not imply that DP is the best approach to protect confidentiality and communicate useful information from a census or survey. It may well be that use of DP is the best strategic approach, but the case for it has not been made.
F.2 REFERENCE TABLES ON 2020 CENSUS DATA PRODUCTS AND 2010 DEMONSTRATION DATA PRODUCTS
This appendix contains two tables with details of the 2020 Census data products and implementation of the 2020 Disclosure Avoidance System (DAS) to protect the confidentiality of the data. Table F.1 provides details of the content, geographies, and timing for 2010 and 2020 Census data products, including the Redistricting File, Summary File 1/DHC File, Summary File 2/Detailed Demographic and Housing Characteristics (DDHC) Files A and B, Demographic Profile, and Public Use Microdata Sample. Table F.2 contains information on “demonstration” product releases (2010 products to which 2020 DAS specifications were applied) and other events in the implementation of the 2020 DAS during 2019–2023.
F.3 SELECTED CENSUS DATA USES
In addition to the headline uses for the U.S. decennial census, including congressional reapportionment, legislative redistricting, enforcement of the Voting Rights Act, and federal fund allocations, there are many long-standing uses by federal, state, and local agencies that merit respect. The business sector, academia, the media, and the general public also use census data. The data benchmark the Census Bureau’s annual population estimates for the nation, states, counties, minor civil divisions, and incorporated places, which have their own myriad uses. In this section, we highlight selected uses of the 2020 Redistricting File and DHC File, chosen to convey the range of users and uses, and the implications of the new 2020 Disclosure Avoidance System (DAS) for those uses.5 Uses discussed include: the housing unit-based method for state and local population estimates, public health estimates, small populations (rural America), special areas for local planning, state funding allocations to local governments, and tenure as a socioeconomic indicator.
___________________
5 The 2020 DAS for the Redistricting and DHC Files used a TopDown Algorithm (TDA, see Chapter 11), which eliminated negative numbers from the controlled injection of random noise (based on the concept of differential privacy) and made totals consistent as blocks are added up to block groups to census tracts and so on. Effects of the TDA are based on “demonstration” files of 2010 data products to which the TDA is applied.
Table F.1 Census Data Products, Content, Geographies, and Release Schedule, 2010–2020
| Data Product | 2010 Census | 2020 Census |
|---|---|---|
| Public Law 94-171 (P.L. 94-171) Redistricting File | ||
| Content | 5 tables—Total population by race (up to 6 or more races); Hispanic population and non-Hispanic population by race; same two tables for population ages 18 and older; housing units by occupancy status | 6 tables—Same as 2010 with the addition of GQ population by major type (nursing home, dormitory, etc.) |
| Geographies | Nation, states, counties, all governmental units, all statistical units down to the block (smallest level of census geography) | Same as 2010 |
| Release Schedule | 12 months after Census Day (April 1), released February–March 2011 | Delayed to August 12, 2021, due to COVID-19 pandemic effects on data collection |
| 2010—Summary File 1 (SF1); 2020—Demographic and Housing Characteristics (DHC) File | ||
| Content | Tables (including those in the Redistricting File) for persons, households, families, housing units by age, race, ethnicity, sex, household relationship, household type, housing occupancy/tenure, GQ, item imputation; cross-tabulations, including sex by age, average household size by age; iterations of selected tables by race/ethnicity of person or household/family head | Similar content to 2010 Block-level: Substantial deletions/moves to higher-level geography (e.g., 11 imputation rate tables deleted; 6 household/family tables deleted; 6 household/family tables moved to census tracts [often without race/ethnicity iterations]; 8 household/family/occupied housing join tables moved to S-DHC [6 for census tracts, 2 for block groups without iteration]) Census tract-level: Additions from block level, deletions (e.g., 11 detailed race/ethnicity tables deleted, overlapped with DDHC-A) |
| Data Product | 2010 Census | 2020 Census |
|---|---|---|
| 2010—Summary File 1 (SF1); 2020—Demographic and Housing Characteristics (DHC) File (cont.) | ||
| Geographies | Block as lowest level: 73 total tables = 24 person (7 iterated by race/ethnicity), 2 GQ, 13 household (3 iterated), 4 family (3 iterated), 8 person item nonresponse indicators (e.g., percent race imputed), 15 occupied units (4 iterated), 4 total or vacant housing, 3 housing item nonresponse indicators Census tract as lowest level: 28 total tables = 17 person (3 iterated), 3 household (1 iterated), 1 nonfamily household, 3 GQ (2 iterated), 4 occupied units County as lowest level: 10 total tables (GQ population) | Block as lowest level: 36 total tables = 15 person (2 iterated by race/ethnicity), 1 GQ, 5 household (1 iterated), 11 occupied units (2 iterated), 4 total or vacant housing Census tract as lowest level: 19 total tables = 5 person (4 iterated), 7 household (1 iterated), 1 family (iterated), 1 nonfamily household, 2 GQ (1 iterated), 3 occupied units County as lowest level: 10 total tables (GQ population) Note: Race/ethnicity iterations in some cases have more categories than 2010 |
| Release Schedule | June–August 2011 | May 25, 2023 |
| Household/Family (Join) Tables: 2010—Part of SF1; 2020—Supplemental DHC (S-DHC) File | ||
| Content | See SF1 above | 8 total join tables = 3 household/3 family/2 occupied units tables (6 iterated by race/ethnicity) (e.g., average household size by age, tenure) |
| Geographies | Block as lowest level | State as lowest level (a major change announced May 31, 2023—original plans were to provide some tables for block groups, census tracts, places, and AIANNH areas) |
| Release Schedule | June–August 2011 (part of SF1) | Scheduled for September 2024 |
| Data Product | 2010 Census | 2020 Census |
|---|---|---|
| 2010—Summary File 2 (SF2) and AIAN Summary File; 2020—Detailed Demographic and Housing Characteristics (DDHC) File | ||
| Content | Same tables as DDHC-A, B, plus cross-tabulations of households/families/occupied units by type/tenure by various characteristics of members (e.g., presence of children or nonrelatives); GQ population by type/sex/age; item imputation rates SF2—Tables iterated for 331 population groups with 100+ people in an area: total population provided for 75 race groups, 114 AIAN groups, 47 Asian groups, 43 NHOPI groups, 51 Hispanic/non-Hispanic groups AIAN File—Tables iterated for ≈ 1, 600 tribes with 100+ people in an area | DDHC-A—2 tables (no tabulations for groups with < 22 people in an area): (1) total population; (2) sex by selected age categories (0, 4, 9, or 23 age categories, depending on 2020 population size) (no sex by age data for detailed groups with < 50 people nationally in 2010). Tables iterated for 300 detailed race/ethnicity groups and 1,187 AIAN tribes/villages (there are also [larger] regional groups with their own thresholds for age detail). DDHC-B—2 tables: (1) household type (depending on 2020 household estimate, total households, 2, 6, or 8 household types, depending on 2020 household estimate); (2) tenure. Tables repeated for around 300 detailed race/ethnicity groups and around 1,200 AIANNH tribes/villages |
| Geographies | Census tract as lowest level: 61 total tables = 47 person tables, 14 housing tables County as lowest level: 10 total tables (GQ) | DDHC-A and DDHC-B—Census tract, plus place, county, state, AIANNH areas, nation; 4 total tables |
| Release Schedule | SF2: December 2011–April 2012 AIANSF: December 2012 | DDHC-A—September 21, 2023 DDHC-B—Scheduled for September 2024 |
| Data Product | 2010 Census | 2020 Census |
|---|---|---|
| Demographic Profile | ||
22 person and housing indicators (e.g., median age by sex); Census tract as lowest level; Released May 2011 | 18 indicators (missing are household-size variables, to be included in S-DHC); Census tract as lowest level; Released with DHC in May 2023 | |
| Public Use Microdata Sample (PUMS) File | ||
Hierarchical household-person file containing all variables in the census for geographies of about 100,000 people (public use microdata areas, or PUMAs) for 10% of the population Released near end of 2014 | Plans announced March 27, 2023, to produce separate privacy-protected microdata files for 100% of persons and housing units with the Redistricting and DHC variables for blocks; release date not yet scheduled | |
NOTES: AIAN, American Indian or Alaska Native; AIANNH, American Indian/Alaska Native/Native Hawaiian; GQ, group quarters; NHOPI, Native Hawaiian or Other Pacific Islander. For “Block (or census tract) as lowest level,” all higher-level geographies are included (e.g., block group, census tract, incorporated place, minor civil division, school district, county, AIANNH area, state).
SOURCES: U.S. Census Bureau (2012a,b, 2022a, 2023a,b); Devine et al. (2023).
| Test/Event/Date | Description | Comments |
|---|---|---|
| Spring 2019: End-to-End Census Test Redistricting File Prototype | First use of differential privacy-based TopDown Algorithm (TDA) to protect redistricting data from 2018 Rhode Island census test; invariants—county population, block level total/occupied housing units, group quarters facilities by type; ∊ = 0.25 | Census Bureau informed users that the product was to test systems and code; very low ∊ meant data were not useful (Fontenot, 2019) |
| Spring 2019: 1940 Census Redistricting Data Comparison | TDA used for redistricting data from the 1940 Census, using enumeration districts as the lowest geographic level; ∊ ranging from 0.25–8 (actual 1940 data are public) | See Asquith et al. (2019) and Brummet et al. (2019) for evaluations of the utility and privacy protection of the 1940 data |
| October 2019: 2010 Demonstration Product Baseline (detailed summary metrics released March 2020) | TDA used for redistricting and selected DHC tables using 2010 data as demonstration; ∊ = 4 (person tables), ∊ = 2 (housing tables) | Basis for CNSTAT December 2019 Workshop; see U.S. Census Bureau (2019) and associated summary metrics under “2010 Demonstration Data Products Baseline 2019-10-29” at https://www.census.gov/programs-surveys/decennial-census/decade/2020/planning-management/process/disclosure-avoidance/2020-das-development.html |
| December 2019: CNSTAT Workshop on 2010 Demonstration Baseline | Proceedings: National Academies of Sciences, Engineering, and Medicine (2020); presentations and video at: https://www.nationalacademies.org/event/12-11-2019/workshop-on-2020-census-data-products-data-needs-and-privacy-considerations | Presentations by many users revealed substantial inaccuracies for small off-spine geographies and small population groups |
| Test/Event/Date | Description | Comments |
|---|---|---|
| May 2020: Demonstration Product Update #1 (summary metrics released with this and later updates) | TDA used for redistricting and DHC tables; ∊ = 4 (person tables) and ∊ = 2 (housing tables) but update file did not include housing tables due to time constraints; improvement: optimize the post-processing steps | Fact sheet and associated summary metrics available under 2020-05-27 run at https://www.census.gov/programssurveys/decennial-census/decade/2020/planningmanagement/process/disclosure-avoidance/2020-das-development.html |
| September 2020: 2010 Demonstration Product Update #2; November 2020: File Correction | TDA used for redistricting tables only; ∊ = 4 (person tables); ∊ = 0.5 (housing table); improvements: put AIAN tribal areas in their own geographic hierarchy within each state; add state-level population invariant for total AIAN population | Fact sheet and associated summary metrics available under 2020-09-17 run at https://www.census.gov/programssurveys/decennial-census/decade/2020/planningmanagement/process/disclosure-avoidance/2020-das-development.html |
| April 2021: 2010 Demonstration Product Update #3 | TDA used for redistricting tables; two sets of files and metrics, one with same ∊ as Update #2, other with ∊ = 10 (person tables), ∊ = 2 (housing table); improvements: replace discrete Laplace noise infusion with zero-concentrated differential privacy (zCDP) discrete Gaussian mechanism to reduce outliers; use accuracy target for largest racial-ethnic group in any geography < 500 people of ±5 percentage points of enumerated value 95% of the time; optimize to bring off-spine geographies closer to the spine; separate post-processing for group quarters at the block group level | In zCDP, ρ and δ replace (and can be converted to) ∊ as the privacy-accuracy parameters; fact sheet and associated summary metrics available under 2021-04-28 run at https://www.census.gov/programs-surveys/decennialcensus/decade/2020/planning-management/process/disclosure-avoidance/2020-das-development.html |
| June 2021: 2010 Demonstration Product Update #4/Redistricting File Production Settings | TDA used for redistricting tables; ∊ = 17 (person tables), ∊ = 2.5 (housing tables); improvement: allocate more PLB to total population and race/ethnicity for block groups and above | Fact sheet and associated summary metrics available under 2021-06-08 run and 2021-08-12 production of Redistricting File at https://www.census.gov/programs-surveys/decennial-census/decade/2020/planning-management/process/disclosure-avoidance/2020-das-development.html |
| Test/Event/Date | Description | Comments |
|---|---|---|
| March 2022: Demonstration Product Update #5 for DHC File | TDA used for DHC tables (person tables released ahead of housing tables); for consistency, DHC inherited person/housing redistricting PLB (∊ = 19.61) and added PLB for combined DHC ∊ (person and housing) of 39.91; improvement: incorporate building block geographies for population estimates into spine | Fact sheet and associated summary metrics available under 2022-03-16 run at https://www.census.gov/programssurveys/decennial-census/decade/2020/planningmanagement/process/disclosure-avoidance/2020-das-development.html |
| June 2022: CNSTAT Workshop on DHC Demonstration Product Update #5 | National Academies of Sciences, Engineering, and Medicine (2023); presentations and video at: https://www.nationalacademies.org/event/06-21-2022/2020-census-data-products-workshop-on-the-demographic-and-housing-characteristics-files | Presentations identified usable data but also population groups/areas with less accuracy in DHC demo product (e.g., AIAN population, Liebler; renters, Reynolds and Vink; rural population, Mueller; denominators for local age-adjusted death/disease rates, Werner; small Traffic Analysis Zones, Kaneff) |
| August 2022: 2010 Demonstration Product Update #6/DHC Production Settings | TDA used for DHC tables; combined DHC ∊ = 46; improvements: changed lowest level of geography for some tables from state/county to census tract; iterated tables for sex by single year of age at census tract level; greater accuracy for some tables but not group quarters people by age; limited reduction in person-housing unit inconsistencies | See https://www2.census.gov/programs-surveys/decennial/2020/program-management/data-product-planning/2010demonstration-data-products/02-Demographic_and_Housing_Characteristics/2022-08-25_Summary_File/2022-08-25_Factsheet.pdf; Census Data Stewardship Executive Policy Committee decided final PLB parameters for DHC, November 2022 (made public in April 2023; see below); DHC released May 25, 2023 |
| January 2023: 2010 “Proof of Concept” Product for DDHC-A Filea | SafeTab-P algorithm used for DDHC-A tables; consistency not promised internally or with other products; negatives possible; all margins of error determined in advance and met 95% of the time; adaptive design using thresholds to determine age detail; no data published for negatives or “alone or in combination”; detailed race/ethnicity groups < 22 people at substate level | See https://www2.census.gov/programs-surveys/decennial/2020/program-management/data-product-planning/2010demonstration-data-products/03-Detailed_DHC-A/202301-31/FAQs-Detailed_DHC-A.pdf; “Proof of Concept” includes summary metrics of accuracy and not tables or microdata; users cautioned against custom aggregations; DDHC-A released September 21, 2023 |
| Test/Event/Date | Description | Comments |
|---|---|---|
| April 2023: 2010 Demonstration Data Products Suite—Redistricting and DHC | TDA used for 2010 Demonstration PPMF combining the differentially privately protected redistricting and DHC variables with final 2020 production ∊ values (combined person and housing, redistricting, and DHC, ∊ = 53); plus separate “noisy measurement files,” with noise infused but before running the TDA for consistency and non-negativity;b plus summary metrics, which show accuracy improvements for householder race, presence/age of own children, relationship to householder; same-sex married and unmarried partners; single years of age for children for counties and school districts; age for persons in group quarters; same-sex married and unmarried partners; accuracy decreased for 5-year age groups. | See https://www.census.gov/data/academy/webinars/2023/2010-demonstration-data-products-suite.html; release responds to researcher requests to see the separate effects of noise infusion and the TDA on differences between the 2010 data protected with the 2020 DAS and the original 2010 data (e.g. Groshen and Goroff, 2022). Note: 2010 Demonstration PPMF variables, reflecting 2020 definitions, not always consistent with 2010 Summary File 1 variables |
a 2010 “Proof of Concept” product for DDHC-B File scheduled for release January 2024; no Proof-of-Concept product planned for Supplemental-DHC.
b Noisy Measurement Files released for the 2020 Redistricting and DHC Files in June 2023.
NOTES: TDA, Top Down Algorithm; DHC, Demographic and Housing Characteristics (File); DDHC, Detailed DHC; CNSTAT, Committee on National Statistics of the National Academies of Sciences, Engineering, and Medicine; PLB: privacy loss budget; Updates #2–4 released as privacy protected microdata files (PPMFs); updates #5–6 released as tables; IPUMS processed both PPMFs and tables to be usable by others: Van Riper et al. (2023).
SOURCES: See table entries.
F.3.1 Housing Unit-Based Method for State and Local Population Estimates
Many states produce their own postcensal population estimates, often using a housing unit-based method. This method starts with census data on housing, occupied housing, and persons per household, applied to local data on building permits. In turn, local population estimates are used for myriad purposes. For 2020, however, estimates of occupied housing and household size derived from the Redistricting File are highly variable, particularly for small geographies. The reason is that the TopDown Algorithm (TDA) processes people and housing units separately.
Hardcastle (2019) described a Nevada revenue-sharing program, begun in 1987, which currently allocates about $79 million among 82 governmental units using state-generated population estimates, which average a housing unit-based estimate and a regression-based estimate. About 20% of the Nevada governmental units that are eligible for state revenue sharing had fewer than about 400 people in 20206 and thus would likely have highly variable population estimates from the housing unit-based method using data from the 2020 Redistricting File. More accurate estimates of persons per occupied housing units are now available in the DHC File released in May 2023.7
F.3.2 Public Health Estimates
Public health analysts require small-area census data for planning, implementation, and evaluation of public health practices. Commonly needed rates include: (1) crude rates of the overall average rate of a disease, such as the total number of cancer cases divided by the total population; (2) age- or sex-specific rates, such as the number of cases for an age group (e.g., 25–34-year-olds) divided by the population of the age group; and (3) age-standardized rates, which allow for comparing health outcomes among population groups with differing age distributions—these rates apply a standard age distribution to the populations being compared.
Werner (2022) described typical public health applications of census data and the effects that the TDA could have on them by comparing the 2010 DHC Demonstration File (March 2022 version) to the original 2010 Summary File 1 (SF1). For age-adjusted estimates of COVID-19 rates by county and race, there were substantial percentage differences in rates for groups other than White people, particularly in nonmetropolitan counties. Such differences
___________________
6 From the 2020 Redistricting File—see the state tables at https://mdi.georgetown.edu/censusgeographies-project/.
7 The DHC File has more accurate estimates because a person per occupied unit recode for each household head was added to the tables to which controlled random noise and the TDA were applied, whereas all person and housing variables were processed separately in the Redistricting File.
could mean that interventions or scarce medical resources would be targeted incorrectly. Overall age-standardized county-level heart disease death rates were reasonably comparable between the two data sets, but rates for age and sex groups often showed substantial differences for smaller populations and areas (under 10,000 people). For age-adjusted estimates of hospitalizations and emergency department visits for asthma, county data were reasonably comparable between the 2010 DHC Demonstration File and the original 2010 SF1, but much less so for census tracts. Block data by race, ethnicity, age, and sex to assess populations living near environmental hazards proved problematic for characterizing risks accurately and targeting populations at higher risk. Similar analyses of the 2010 DHC Demonstration File (August 2022 version) compared with the original 2010 SF1 found only “minimal improvements.”8
F.3.3 Small Populations—Rural America
Mueller (2022) discussed the implications of the TDA for rural areas. He said that rural America lost population on net for the first time between 2010 and 2020 and is prone to high rates of poverty and poor health. He said these trends are well known but hard to document because many datasets have much-too-high variance in estimates for rural areas (e.g., estimates for census tracts from the American Community Survey are unusable for rural areas). The census has long been the gold standard for rural demography, but even then, demographers use the county as the unit of analysis.
Mueller analyzed population and median age by race and ethnicity for counties classified by Rural Urban Continuum Code from code 1 (metropolitan county of 1 million or more people) to code 9 (county not adjacent to a metropolitan area with fewer than 2,500 people). Comparing the 2010 DHC Demonstration File (March 2022) and the original 2010 SF1, Mueller found large percentages of highly rural counties (codes 7–9) with differences of 10% or more in total population for non-Hispanic Black people, Hispanic people, and non-Hispanic American Indian and Alaska Native (AIAN) people.9 He concluded:
It is not clear to the rural demography community how differential privacy makes sense when accuracy for small groups is important. . . . Prior methods seemingly did a much better job of preserving headcount totals. Small groups and places have just as much of a right to accuracy and representation as the large groups and places. I know many have
___________________
8 Document sent from B. Moyer, National Center for Health Statistics, to R. Jarmin, U.S. Census Bureau, attaching the updated U.S. Centers for Disease Control and Prevention response; provided by A. Werner to K. Stone, September 29, 2022.
9 Total population in the DHC File is the same as in the Redistricting File, so the fact that the DHC Demonstration File that Mueller used for his analysis does not reflect the final production values for epsilon is not relevant.
concerns about reidentification, but if our 2020 data is released with these discrepancies, I am not sure I will be able to use it or recommend others use it. Sadly, we don’t have an alternative source of data for rural areas in the United States.
F.3.4 Special Areas for Local Planning
State and local governments and regional planning organizations often aggregate census blocks, block groups, or census tracts to form their own areas for planning purposes. Kaneff (2022) described the myriad uses of data for traffic analysis zones (TAZs), built up from blocks, by the Northern Virginia Regional Commission and the local governments in the region—for example, siting fire stations, schools, parks, and other local facilities; transportation planning, including projections; emergency planning; and other uses. Of 1,415 TAZs, 503 had fewer than 450 people—household size data for these areas from the 2020 Redistricting File were not fit for use in the Commission’s judgment. Data for TAZs with 450–1,000 people were better, and data for TAZs with 1,000 or more people were reliable, based on the 2010 demonstration data comparisons.
Alvarez and Maurer (2022) described the demographic uses of New York City’s approximately 200 Neighborhood Tabulation Areas (NTAs). Their analysis found that the March 2022 version of the 2010 DHC Demonstration File, compared with the original 2010 SF1, was fit for use for examining 5-year age distributions for NTAs. This finding is not surprising in that each NTA on average consists of about 10 census tracts totaling about 40,000 people.
F.3.5 State Funding Allocations to Local Governments
Many states allocate their own funds to their local governments. For example, Craigle (2022) identified several state programs in Montana that allocate funding to counties. Hardcastle (2019) described a long-standing Nevada state revenue-sharing program for local governments. Nagle and Kuhn (2019) provided an example of a specific Tennessee statute (Title 67) that allocates funds to incorporated places. The statute reads:
(3)(A) Four and six thousand thirty ten-thousandths percent (4.6030%) [of state sales and uses taxes] shall be appropriated to the several incorporated municipalities within the state of Tennessee to be allocated and distributed to them monthly by the commissioner of finance and administration, in the proportion as the population of each municipality bears to the aggregate population of all municipalities within the state, according to the latest federal census and other censuses authorized by law.
Continuing with the Tennessee example, as of 2020, the state had 344 functioning incorporated places, ranging in population size from 66–633,000
people, with a median size of about 2,000 people.10 Twenty percent of Tennessee incorporated places had fewer than 550 people. Each person represented about $115 in allocated funds from Tennessee state sales and use tax revenue. Population totals in the Redistricting File, based on 2010 demonstration data, are quite accurate overall. About 5% of incorporated places with 500 or fewer people in the nation, however, have errors of 5% or more (25 people or more) and 11% have errors of 2–5% (10–25 people), comparing the privacy-protected 2010 Redistricting File with the publicly released 2010 Redistricting File.11 Consequently, among Tennessee’s about 70 incorporated places with fewer than 500 people, assuming the national error rates apply, 4 places could lose and 4 could gain 25 or more people due to noise infusion, and another 8 places could lose and 8 could gain, say, 20 people. In dollar terms, the losses (gains) would be about $2,000–3,000 or more. These are not large differences, but they could matter for the budget of a small incorporated place. Nagle and Kuhn (2019), based on their analysis, assert:
Protecting characteristics is admirable, but the number of people in a place has never been assumed private. State constitutions assume that Census population counts for municipalities are accurate. The starting point for DP [differential privacy] should have been change in log probability conditional on population count being public information.
F.3.6 Tenure as a Socioeconomic Indicator
Tenure—whether a household owns or rents its residence—is the one socioeconomic variable collected in the census. Homeownership rates are an important indicator of wealth inequity among areas and among race and ethnic groups. It is a variable of interest for government policy and for research, including analysis of racial disparities and geographic segregation. Reynolds and Vink (2022) compared the March 2022 version of the 2010 DHC Demonstration File with the original 2010 SF1 and found that the two data sets differed more for households in rental-majority areas (census tracts) compared with owner-majority areas and that the differences were particularly pronounced for households with children and large households in rental-majority areas. Differences were also large for aggregations of census tracts to substate levels.
Replicating the analysis with the August 2022 version of the 2010 DHC Demonstration File, Reynolds and Vink (2023) found some improvements but also that differences between majority owner and renter areas remained. Average homeownership rates by race and ethnicity varied significantly between
___________________
10 From the 2020 Census Redistricting File—see the state tables at https://mdi.georgetown.edu/census-geographies-project/.
11 See https://www2.census.gov/programs-surveys/decennial/2020/program-management/data-product-planning/2010-demonstration-data-products/.
the demonstration and original datasets for most race and ethnic groups, with the exceptions of Asian people and people who were not Hispanic.
This page intentionally left blank.