Assessing the 2020 Census: Final Report (2023)
Chapter: 5 Master Address File
– 5 –
Master Address File
The quality of any sample survey is dependent upon the quality, completeness, and appropriateness of the underlying frame from which the sample is drawn. Over its entire existence, the fundamental concept of the U.S. census has been to count each person in the right place—at their location of usual residence. Accordingly, it follows that the quality of the decennial census as a 100 percent sample of the population is inextricably linked to the quality of the U.S. Census Bureau’s geographic resources and, in particular, the address list used to mount census data-collection efforts. Prior to the 2000 Census, the address list used as the operational frame to conduct and monitor progress in the decennial census was constructed anew each decade, prior to and during the census. The 2000 Census began the practice of maintaining an ongoing Master Address File (MAF) to support the Census Bureau’s household survey programs as well as the decennial count, with MAF entries geocoded (matched to their geographic locations in a census block) using the Topologically Integrated Geographic Encoding and Referencing (TIGER) map database. Since 2000, the MAF has evolved into a fluid, ongoing, regularly updated repository of addresses encountered by the Census Bureau, and the broader MAF is filtered to define operational extracts of MAF units that are potentially “good” or workable for a particular census or survey purpose.
Maintenance and updating of the MAF/TIGER databases has evolved into a high-stakes and critically important enterprise before, during, and after the census. The MAF is updated through a series of suboperations prior to and during each decennial census, including a comprehensive address list check prior to the census, a suite of address-building operations (e.g., Local
Update of Census Addresses [LUCA] and New Construction [NC] programs1) drawing input from census users and stakeholders, and census component operations that can alter MAF entries. Between decennial censuses, the primary update sources of the MAF are twice-yearly “refreshes” of addresses from the U.S. Postal Service’s (USPS) Delivery Sequence File (DSF), which is USPS’s inventory of residential and nonresidential addresses for mail delivery carrier routes. Information garnered from ongoing fieldwork surrounding Census Bureau surveys (e.g., the American Community Survey) may contribute additional changes to the MAF. An important pillar in the general plan for the 2020 Census was fundamentally retooling the precensus address list review activity, Address Canvassing (AdCan), which had developed into a field-heavy, walk-every-block activity in the 2000 and 2010 Censuses. Instead, a clerical In-Office Address Canvassing (IOAC) component was implemented to bear much of the load of identifying stable, unchanging blocks, in an attempt to limit the traditional In-Field Address Canvassing (IFAC) fieldwork to blocks that could not be resolved by IOAC.
In this chapter, we begin our broader examination of 2020 Census data quality by delving into the mechanics of the 2020 Census MAF. The panel’s data analysis subgroup was permitted unprecedented access to a set of operational metadata for every record on the MAF as of the end of the 2020 Census—more than 212 million entries. These data do not include actual addresses; instead, we have Basic Collection Unit (BCU) and census tract identifiers for each record in the dataset. Importantly, the metadata include both the Census Bureau’s indication of the address record’s provenance—the specific census or update mechanism by which the address was first observed/experienced in the MAF—and an indicator of the record’s final status in the 2020 Census (i.e., whether it resulted in an enumeration). We derived a categorization of MAF records to better understand the composition of the 2020 Census MAF, look for patterns by county and tract, and further examine the origin of addresses added or “touched” by the individual address-building operations of the 2020 Census.
Before delving into the composition of the MAF, it is important to recognize that the MAF is intended to be a repository for all living quarters in the United States, including not only housing units but group quarters (GQs) (such as college/university housing, health care/nursing facilities, and correctional facilities) and transitory locations (TLs) (such as marinas, recreational vehicles, and hotels/motels). As we discuss in more detail in Chapter 9, both GQs and TLs have historically been subject to separate frame-building work; in the 2020 Census, both involved “Advance Contact” operations that could impact the ultimate address list for those sites. That said, the available metadata show the
___________________
1 The LUCA Program was created by the Address List Improvement Act of 1994. See: https://www.census.gov/programs-surveys/decennial-census/about/luca/act-1994.html. For information on the NC Program, see: https://www.census.gov/programs-surveys/decennial-census/about/new-construction.html. Also, see: https://www.census.gov/history/pdf/Census2000v2.pdf.
classification of MAF entries as housing units, GQs, TLs, or nonresidential as of the end of the 2020 Census, but do not provide a good indication of what the addresses were believed to be at prior times. So, while the case could be made for omitting GQs and TLs from the analysis, we do not believe that the data at hand provided a reliable means for doing so. Hence, we retained all address types in our analysis of the MAF (at the expense of some noise in a pure-housing-unit picture), and hence our analyses contain potential discrepancies, specifically in terms of the GQ population.
5.1 OVERVIEW OF MASTER ADDRESS FILE DEVELOPMENT AND THE DATASET
The MAF is a fluid, ongoing, longitudinal database of address information—a record of how addresses for living quarters in the United States (housing units and now including GQ locations) have been represented over time in the Census Bureau’s address listings. Addresses are assigned a unique identifier (MAFID) for tracking. Curating an address database is vastly more difficult than it might appear at first glance, particularly given the diversity of sources from which MAF data are drawn. Apartments in small, multifamily dwellings without standard apartment numbers may be represented differently at different times and in different sources (e.g., as Apartment 2, Apartment B, “back,” or “basement”); units within large, multiunit structures may be redesignated or renumbered. In rural areas where mail is not delivered to individual homes, standardization and conversion of physical location addresses (as for systems for emergency response and fielding 911 calls) are ongoing processes and can change over time, meaning that different labels might apply to the same physical “house on Lake Bliss” in separate data series. Accordingly, it is sensible that the primary update source for the MAF between censuses is a twice-yearly extract from the USPS DSF for mail carrier routes—not only because of the USPS’s daily experience and interaction with mail delivery addresses but also due to its own keen, vested interest in address standardization and general hygiene of address databases.
To conduct the census—or to conduct one of the Census Bureau’s other household surveys—a set of filters is applied to the MAF to derive an extract appropriate to the task. In the census context, it is logical that the filters would be made to err on the side of inclusion, to limit the risk of omitting units that should be included and thus maximizing participation in the census. By comparison, a new sampling frame for a particular survey program might purposefully exclude addresses contacted in the past months/years, to avoid burdening survey respondents. However, every address that is included in the working frame for the census necessarily incurs some cost—minimal for mailing but greater when many enumerator/interviewer contact attempts are needed—-
so including too many questionable addresses on the initial list for census enumeration runs the risk of overwhelming operations and compromising the effectiveness of data collection. Accordingly, to best use its resources, the Census Bureau must try to create a balance between these competing costs and benefits.
To study the MAF development process, the panel’s data analysis subgroup was given access to what we refer to as the MAF Development Dataset, consisting of a metadata extract on the 212.3 million addresses (MAF units) that existed in the MAF at the end of 2020 Census data collection (i.e., on October 15, 2020). The dataset contains information on the provenance of the address (the census operation, dating back to the 2000 Census, in which the address was first added to the MAF), the status of the address on the USPS DSF in fall 2017 and spring 2020, and whether action was taken on the address in any of the 15 address-building suboperations of the 2020 Census. For each address, the dataset provides the BCU code which, akin to census blocks, is the smallest unit of collection geography used in the 2020 Census, as well as the census tract codes for 2020 Census tabulation and the older-vintage tracts that prevailed during data collection (as derived from the 2019-vintage BCU code). The dataset also provides important context for our analyses by indicating the type of enumeration area associated with a particular MAF entry’s BCU, which designates the 2020 Census’ approach to respondent contact and data collection for a particular BCU (see Box 2.2).
For our purposes, the dataset is a rich trove of information because it indicates the outcome of filters run to assess workable addresses at several points: before the beginning of IFAC (run in April 2019), in defining the original collection universe for the 2020 Census (run in November 2019), and in defining the supplemental Nonresponse Followup (NRFU) workload (run in March 2020).2 The dataset includes the final status3 of the MAF unit in the 2020 Census—whether it was enumerated as a housing unit by self-response questionnaire or enumerator form, whether it was enumerated as a GQ, whether it was not enumerated (as either a housing unit or GQ), or whether it had no defined status at the end of the census—as well as an associated population count. The final status and population count variables in this dataset are the operational feedback provided to the Census Bureau’s Geography Division, and so do not necessarily comport with the final editing,
___________________
2 The supplemental NRFU workload included new addresses added to the NRFU workload that were not in the workload during the initial cut in late 2019/early 2020, such as NC, successfully appealed LUCA addresses, and a late refresh of the USPS DSF. Relevant to the analysis in this chapter, a late change to the NRFU operation in 2020 was an expansion of the supplemental NRFU workload to include units marked “Delete” in Address Canvassing as well as all regular housing units that had been encountered in the initial Advance Visit operations for GQ and TL enumeration (Fontenot, 2021d).
3 The dataset includes the same final status code for the MAF unit from the 2010 Census.
imputation, and processing of 2020 Census data. We treat the data items accordingly—not delving too deeply into the status codes beyond “Pass” and “Fail” (enumerated/in the census or not) and distinguishing between occupied, zero-population, and null/missing counts.
5.2 MAF1 AND MAF2, PRECENSUS AND POSTCENSUS PIVOT POINTS IN THE MASTER ADDRESS FILE
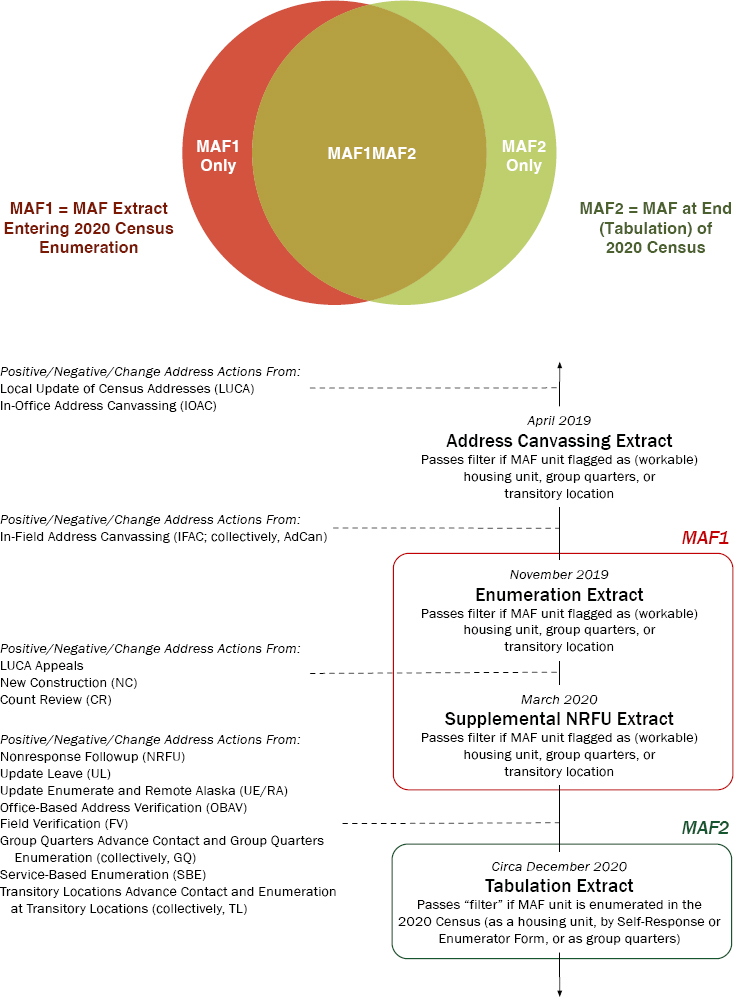
To understand the dynamics in the development of the MAF, our starting point was to echo and extend the work of our panel’s predecessors on these lines, who performed data analysis (Biemer et al., 2021) for the American Statistical Association’s (ASA) 2020 Census Quality Indicators Task Force (2020, 2021). We focused on two key pivot points in the development of the MAF for the 2020 Census. In this framework, MAF1 is the MAF extract constructed at the beginning of 2020 Census data-collection operations (i.e., as of March 2020) and MAF2 is the operational address frame at the end of 2020 Census data collection (i.e., as of October 15, 2020). Figure 5.1 includes both a simple Venn diagram of these two pivot points and a schematic of how they are operationalized in the MAF Development Dataset: MAF1 as the set of addresses passing the filter and deemed workable addresses in either the initial 2020 Census frame created in November 2019 or the supplemental workload created in March 2020;4 and MAF2 derived from the variable (CENSTAT2020) on the dataset indicating whether the MAF unit yielded a housing unit or GQ enumeration in the 2020 Census.
The general MAF1 and MAF2 framework is sound, with before-2020collection and after-2020-collection being critically important pivot points for the MAF. However, while the ASA team considered a simple “MAF Revisions” statistic as a measure of churn in the MAF—the proportion of all addresses in the combined MAF1 and MAF2 sets that are not listed on both MAF1 and MAF2, or the sum of MAF1 Only and MAF2 Only in the Figure 5.1 Venn diagram—we concluded that the approach required additional finesse. The set of addresses that are in the MAF1 Only set arguably represent bad outcomes: addresses deemed workable just before the census but that did not yield a successful enumeration, thus representing an investigative dead-end and some squandering of resources. But the set of addresses that are MAF2 Only—successfully enumerated in the census, but not in the initial census workload—are not only good outcomes but very much expected and desired
___________________
4 The two filter variables, coded as ENUMUNV and SUPNRFUUNV in the dataset, are properly thought of as a two-part filter, with the supplemental universe purposefully emphasizing inputs from new-since-late-2019 address sources such as LUCA and the most recent DSF refresh in spring 2020. That is, the two variables are not meant to replicate each other—an address passing the first cut but not passing the supplemental cut is not inherently problematic—and so MAF1 is deemed a “Pass” if the MAF unit passes either ENUMUNV or SUPNRFUUNV.
| MAF1 (Enter Enumeration) | MAF2 (Enumerated in 2020 Census) | Total | ||
|---|---|---|---|---|
| Pass | Fail | Unknown | ||
| Pass | 140,100,000 | 11,460,000 | 747,000 | 152,300,000 |
| Fail | 742,000 | 72,500 | 57,300,000 | 58,110,000 |
| Unknown | 1,474,000 | 328,000 | 84,000 | 1,886,000 |
| Total | 142,300,000 | 11,860,000 | 58,130,000 | 212,300,000 |
SOURCE: MAF Development Dataset. See Disclosure Review Statement; CBDRB-FY23-0215.
outcomes. In the non-Self-Response Update Leave and Update Enumerate areas of the nation, and in other areas where user/stakeholder input through address update operations contributed good, new addresses, the discovery of heretofore unknown-to-the-MAF addresses during the census itself is beneficial. Hence, simply adding the MAF1 Only and MAF2 Only slivers to form a single statistic is misleading.
In arriving at a partition of addresses, there is an important subtlety: each of the MAF1 and MAF2 pivot points has three basic outcomes, not just two as represented in the Venn diagram. In the case of MAF1, an address can pass the filter and be deemed workable (Pass), explicitly fail the filter and be excluded from initial workloads (Fail), or have null status because the address does not exist or is not yet on the MAF (Unknown). Likewise, the MAF2 filter that corresponds to final status in the 2020 Census can be simplified to a “pass” or enumeration in the census (Pass) or a “fail” indicating failure to be enumerated in the census (Fail), but may also have no status or unknown/null status at the end of the census (Unknown). The full set of addresses in the dataset is distributed across the nine possible cells, as shown in Table 5.1.
The largest single bloc of addresses in the table is the MAF1–MAF2 intersection event (140.1 million), and the MAF1 Only and MAF2 Only slivers are the remnants of the MAF1 “Pass” row and MAF2 “Pass” column, respectively. It is more difficult to attach meaning to the collection of addresses that are designated “Fail” or “Unknown” in both the MAF 1 and MAF2 filters. There is a temptation to consider these addresses as “dead weight” on the MAF, but that may be an overly hasty conclusion; those addresses are arguably benign if the filtering process works and there is no real investment of time or resources in trying to enumerate them (i.e., if they are truly held out of the census collection process). Accordingly, we turn to another variable coded in the dataset to split the (MAF1 and MAF2 both in {Fail, Unknown} into two pieces:
- Roughly 431,000 addresses for which COLLUNV = Y meaning that some 2020 Census collection effort was made, a group that we label “Remnant in Collection;” and
- About 57,350,000 MAF entries for which COLLUNV = N, which we label as “Extraneous” to the 2020 Census collection universe.5
This Extraneous category contains most, but not all, of roughly 12.2 million addresses flagged in the MAF Development Dataset as known duplicate entries; it should also be noted that there are almost certainly more duplicate entries in the MAF than the 12.2 million already identified by the Census Bureau, but we have no way of ascertaining those.
The Extraneous category may require some reflection because it represents potential “dead weight” or drag on the MAF, and arguments can be made for either retaining or culling a large chunk of these addresses. However, in the remainder of this report, we set the Extraneous addresses aside and work with the remaining 154.9 million addresses in the effective 2020 Census data-collection universe.
5.3 PROVENANCE OF ADDRESSES IN THE 2020 CENSUS MASTER ADDRESS FILE AND RELATION TO ADDRESS-BUILDING OPERATIONS
The SRCCAT variable in the MAF Development Dataset is the Census Bureau’s assessment of the provenance of each MAF entry—the single operation through which the address was first added to the MAF. These data include codes for 26 provenance categories, which we have condensed to 3 broad categories and 16 subcategories:
- Legacy Censuses, including subcategories for the 2000 Census MAF, the 2010 Census MAF, and census research activities (2018 End-to-End Test, MAF Coverage Study, and other recurring or single-occurrence operations) predating the 2020 Census;
- Legacy DSF, leaving the uniquely important immediate-precensus spring 2020 refresh from the DSF as its own subcategory but consolidating source categories from seven earlier DSF refreshes into a single group; and
- 2020 Census Address-Building Operations, with subcategories for each of 11 suboperations of the 2020 Census that had the capability for adding or revising addresses.
___________________
5 This calculation involves correcting for some inconsistencies—notably, a reasonably small group of addresses simultaneously coded as COLLUNV = N (no enumeration attempted) and as a MAF2 pass (successful enumeration in the census), in which we take the latter condition to override the former. As with other analyses we have performed, sums may differ between and within tables due to the rounding and disclosure avoidance required by the Census Bureau.
Under the 2020 Census Address-Building Operations heading, “adds” to the MAF can come from 11 distinct operations:
- Address Canvassing (AdCan), combining separate origin codes for IOAC and IFAC;6
- The three principal operations through which user/stakeholder input is brought to bear on MAF content—LUCA, Count Review (CR), and NC;
- Office-Based Address Validation (OBAV), new to the 2020 Census, which extended IOAC methodologies to try to resolve addresses from Non-ID Processing that did not automatically match to the MAF;
- Field Verification (FV), or field work on addresses from Self-Response and other operations that could not be resolved in-office (in the 2020 Census, FV additions to the MAF were exclusively made in Puerto Rico);
- NRFU, the core field follow-up operation of the census, in which enumerators could add an address observed during their work;
- The two non-Self-Response enumeration strategies, Update Leave (UL) and Update Enumerate/Remote Alaska (UE/RA),7 in which the “Update” part is particularly important because these areas were excluded from IFAC ahead of the census; and
- Special enumeration operations for GQ and TL, both of which included advance-visit suboperations that could determine new addresses as well as broker arrangements for the eventual enumeration.
Cross-tabulating our working MAF composition variable with the SRCCAT address provenance variable yields Table 5.2, the most striking observation from which is arguably the sheer magnitude of addresses originating in the 2000 Census and in pre-2020 iterations of the DSF. The 2000 Census MAF alone accounts for the origin of 57.2% (88.6 million) of the addresses in the 2020 Census data-collection universe; the pre-2020 DSF adds another 32.6% (50.5 million) and the 2010 Census contributes 5.1% (7.9 million). The result is understandable given the semipermanent nature of housing stock, yet it can still be surprising to realize that less than 5% of the addresses in the 2020 Census data-collection universe were uniquely added by 2020 Census operations. This is decidedly not meant to suggest that those 2020 Census address-building operations are unimportant—they definitely are important to the quality of the count—but just meant as calibration, to better understand continuity in the MAF.
Comparing the first two columns of Table 5.2, MAF1MAF2 and MAF1 Only, suggests a fundamental difference between the various address provenance
___________________
6 These are almost exclusively addresses impacted by IFAC, because the Active Block Resolution component of IOAC that would have permitted additions/revisions in the in-office phase was suspended early for budgetary reasons.
7 Update Enumerate and Remote Alaska are coded as separate variables in the dataset, but they are combined because of their similar methodology.
| Address Origin | MAF1MAF2 | MAF1 Only | MAF2 Only | Remnant in Collection | Total |
|---|---|---|---|---|---|
| Legacy Censuses | |||||
| 2000 Census | 84,580,000 | 3,816,000 | 186,000 | 21,000 | 88,600,000 |
| 2010 Census | 5,715,000 | 2,067,000 | 63,500 | 10,000 | 7,856,000 |
| Other Pre2020 | 697,000 | 239,000 | 7,100 | 1,000 | 944,000 |
| Legacy DSF | |||||
| Pre2020 | 46,850,000 | 3,139,000 | 462,000 | 45,000 | 50,500,000 |
| Spring 2020 | 146,000 | 74,500 | 22,000 | 3,900 | 246,000 |
| 2020 Census Operations | |||||
| LUCA | 1,216,000 | 2,020,000 | 1,400 | 250 | 3,238,000 |
| CR | 40,500 | 67,500 | 100 | 20 | 108,000 |
| NC | 192,000 | 306,000 | 60 | 0 | 497,000 |
| AdCan | 633,000 | 482,000 | 80 | 20 | 1,115,000 |
| OBAV | 0 | 0 | 721,000 | 75,000 | 795,000 |
| FV | 0 | 0 | 6,400 | 0 | 6,400 |
| NRFU | N < 15 | 50 | 174,000 | 25,000 | 199,000 |
| UL | 0 | 0 | 401,000 | 136,000 | 538,000 |
| UE/RA | 0 | 0 | 7,300 | 40 | 7,400 |
| GQ | 0 | 0 | 64,500 | 37,500 | 102,000 |
| TL | 0 | 0 | 98,500 | 76,000 | 174,000 |
| Total | 140,100,000 | 12,210,000 | 2,216,000 | 431,000 | 154,900,000 |
NOTES: DSF, Delivery Sequence File; LUCA, Local Update of Census Addresses; CR, Count Review; NC, New Construction; AdCan, Address Canvassing; OBAV, Office-Based Address Verification; FV, Field Verification; NRFU, Nonresponse Followup; UL, Update Leave; UE/RA, Update Enumerate/Remote Alaska; GQ, Group Quarters; TL, Transitory Locations.
SOURCE: MAF Development Dataset. See Disclosure Review Statement; CBDRB-FY23-0215.
categories. Recall that MAF1 means passing the filter to be deemed workable at the start of the 2020 Census, so MAF1MAF2 connotes those “good” precensus addresses that resulted in successful enumeration, and MAF1 Only denotes those that did not result in enumeration—those addresses that did not pan out and might be considered fruitless investigative leads. By large margins, the share of older-source addresses in MAF1MAF2 (deemed workable and successfully enumerated) dwarfs that in MAF1 Only (deemed workable but not enumerated). This suggests that the filters worked reasonably well for these older-address categories, with addresses identified as workable generally resulting in enumerations. However, of the 2020 Census suboperations, only Address Canvassing worked in that same way with good/enumerated addresses outweighing fruitless leads—and then only by a slight margin. Addresses provided by the three user-input operations (LUCA, CR, and NC) showed
different enumeration outcomes compared with the other sources. Nearly twice as many new addresses added by LUCA failed enumeration, and majorities of the CR and NC additions likewise failed. Thus, it appears as if the Census Bureau opted to place new, locally provided addresses into the census operational workload and let fieldwork sort out the results. This is neither meant as undue praise of the MAF1 filter nor as undue criticism of the user-input programs—9.3 million fruitless older-source leads and 1.5 million good adds from user-input 2020 Census operations are both sizable blocs, after all—but just an illustration of the trade-offs at play.
The entries in the MAF2 Only column mainly behave as expected. As addresses that were not in the MAF1 filter (initial 2020 Census universe) but did result in successful enumerations, the MAF2 Only category is mainly comprised of addresses coming in through the 2020 Census address-building operations. OBAV was a particularly strong contributor of new-to-MAF and successfully enumerated addresses, at about 721,000; large shares also came in through UL and NRFU. But, again, it is the long-lived nature of the MAF that draws the eye in this category: about one-third of the addresses in the MAF2 Only category originated in previous censuses or DSFs. Logically, this means that the addresses had to: (1) have been added by an older operation; (2) become dormant at some point in terms of being deemed workable and failed the initial filter; and (3) become “reactivated” somehow—making it into the 2020 Census by some means—and resulting in a successful enumeration. Below, we will consider whether we can recover any information about how this reactivation came about.
To sharpen the contrasts somewhat, we developed a final typology in Table 5.3, combining elements of Table 5.2 differently to try to form more meaningful groups. The rows of Table 5.3 mirror those in Table 5.2, but the columns differ:
- Bad 2020 Adds: These entries were added to the MAF by a particular 2020 Census address-building operation but were not successfully enumerated.
- Bad Legacy: These entries were added to the MAF by a legacy operation, including the 2000 and 2010 Censuses or various DSFs, but were not successfully enumerated.
- Good 2020 Adds: These entries were added to the MAF by a particular 2020 Census address-building operation and were successfully enumerated.
- Good Legacy Census: These entries were added to the MAF during the 2000 or 2010 Censuses or pre-2020 Census work and were successfully enumerated.
- Good Legacy DSF: These entries were added to the MAF from various versions of the DSF and were successfully enumerated.
- Good Reactivations: These entries were added to the MAF by a legacy operation, including the 2000 and 2010 Censuses or various DSFs. They did not pass the original enumeration universe filter(s), but they were reactivated by a 2020 Census address-building operation (e.g., LUCA, AdCan, NRFU, etc.) and resulted in a successful enumeration.
The Legacy Census and DSF sources contributed 138 million MAF entries that were successfully enumerated, with 2020 Census address-building operations contributing 3.5 million successful enumerations. If we compare the outcomes for MAF entries added by 2020 address-building operations, just over half resulted in an enumeration. While a large fraction of adds from 2020 address-building operations was not enumerated, the number of Legacy MAF entries that were not enumerated was three times as large (9.4 million vs. 3.2 million). While most legacy entries resulted in successful enumerations (e.g., 84.6 of 88.6 million addresses from the 2000 Census), the number of legacy entries not enumerated is still large and provides support for continued research into optimizing the filters used to create the initial enumeration and the supplemental NRFU universes.
Examination of the good and bad outcomes for 2020 Census address-building operation additions may lead to the conclusion that such operations are inefficient because just over 50% of the records yield no enumeration. There are two important observations to make about addresses that were the result of census operations. As was evident in Table 5.2, it bears repeating that the balance of successful to unsuccessful enumerations was very different for addresses that came in via user programs versus those that came in via census address-building operations, with the latter having a much better success rate. Second, the values in the Good Reactivations column provide further evidence of the utility of the 2020 Census address-building operations. MAF entries in the Good Reactivation category were not originally included in the 2020 enumeration universe (i.e., they were not in MAF1), but they were “found” by a 2020 Census address-building operation and successfully enumerated. We discuss the operational “touches” of 2020 address-building operations in more detail in Section 5.5, but it is useful to note that over 80% of the 742,000 MAF units in the Good Reactivations category were touched by only one 2020 Census address-building operation; hence, it is easy to surmise that this single operation is the one that “found” the address. Of those single-touch reactivation cases, over 60% were touched solely by the OBAV operation and over 20% were touched solely by NRFU.8 Without these operations—OBAV verifying Non-ID addresses and NRFU doing limited investigation of addresses at the same time as garnering responses, even amidst a compressed timeframe—the census would have missed those units, which again argues for increased attention to
___________________
8 Of those Good Reactivation cases touched by only two 2020 operations, the majority were touched by OBAV in combination with either Address Canvassing, NRFU, or LUCA.
| Address Origin | Bad 2020 Adds | Bad Legacy | Good 2020 Adds | Good Legacy Census | Good Legacy DSF | Good Reactivations | Total |
|---|---|---|---|---|---|---|---|
| Legacy Censuses | |||||||
| 2000 Census | — | 3,837,000 | — | 84,580,000 | — | 186,000 | 88,600,000 |
| 2010 Census | — | 2,077,000 | — | 5,715,000 | — | 63,500 | 7,856,000 |
| Other Pre2020 | — | 240,000 | — | 697,000 | — | 7,100 | 944,000 |
| Legacy DSF | |||||||
| Pre2020 | — | 3,185,000 | — | — | 46,850,000 | 462,000 | 50,500,000 |
| Spring 2020 | — | 78,500 | — | — | 146,000 | 22,000 | 246,000 |
| 2020 Census Operations | |||||||
| LUCA | 2,020,000 | — | 1,218,000 | — | — | — | 3,238,000 |
| CR | 67,500 | — | 40,500 | — | — | — | 108,000 |
| NC | 306,000 | — | 192,000 | — | — | — | 497,000 |
| AdCan | 482,000 | — | 633,000 | — | — | — | 1,115,000 |
| OBAV | 75,000 | — | 721,000 | — | — | — | 795,000 |
| FV | 0 | — | 6,400 | — | — | — | 6,400 |
| NRFU | 25,000 | — | 174,000 | — | — | — | 199,000 |
| UL | 136,000 | — | 401,000 | — | — | — | 538,000 |
| UE/RA | 40 | — | 7,300 | — | — | — | 7,400 |
| GQ | 37,500 | — | 64,500 | — | — | — | 102,000 |
| TL | 76,000 | — | 98,500 | — | — | — | 174,000 |
| Total | 3,225,000 | 9,416,000 | 3,556,000 | 90,990,000 | 47,000,000 | 742,000 | 154,900,000 |
NOTES: DSF, Delivery Sequence File; LUCA, Local Update of Census Addresses; CR, Count Review; NC, New Construction; AdCan, Address Canvassing; OBAV, Office-Based Address Verification; FV, Field Verification; NRFU, Nonresponse Followup; UL, Update Leave; UE/RA, Update Enumerate/Remote Alaska; GQ, Group Quarters; TL, Transitory Locations.
SOURCE: MAF Development Dataset. See Disclosure Review Statement; CBDRB-FY23-0215.
and further refinement of addresses at the MAF1 stage of the census address-selection process.
5.4 SPATIAL VARIATION IN MASTER ADDRESS FILE UNIT CATEGORIES
Table 5.3 provides a national overview of the contribution of various sources to successful and unsuccessful enumerations, but it necessarily obscures spatial variation in the various categories. While some categories of addresses in Table 5.3 may seem small relative to the overall number of addresses in the census, they may nonetheless be important because of differential impacts due to spatial clustering. To examine this spatial variation, we created a series of maps by county and census tract.
5.4.1 Legacy Sources
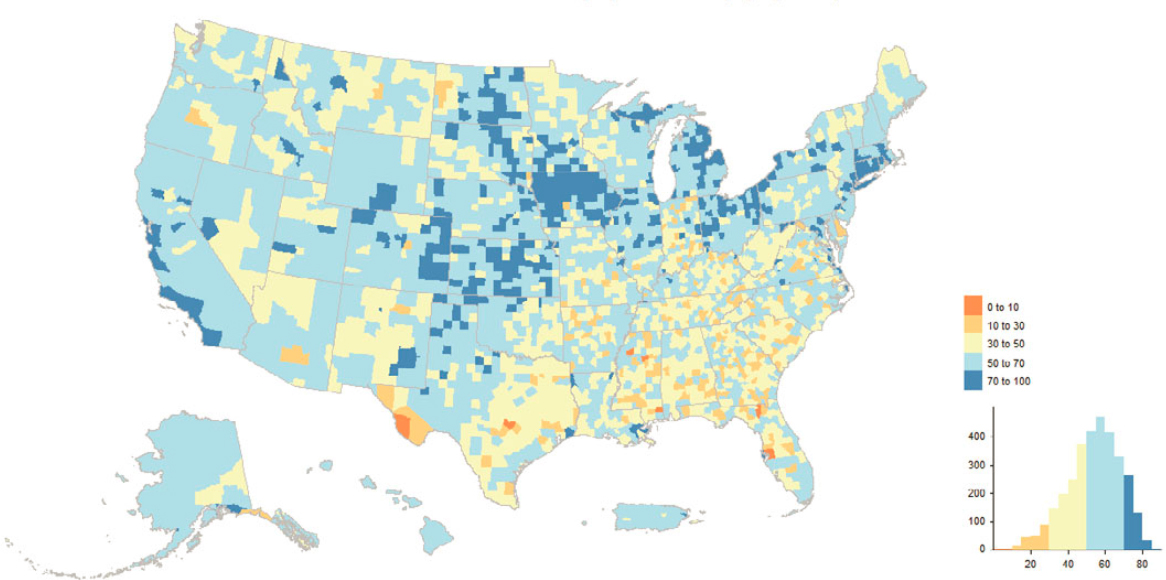
Figure 5.2 shows the percent of MAF units in the Good Legacy Census category (MAF units from the 2010 and 2000 Censuses or pre-2020 Census operations) by county. In many U.S. counties, more than 50% of their MAF units derive from legacy censuses. Rust Belt and Great Plains counties frequently derive more than 70% of their MAF units from legacy censuses. In the Southeast, it is much more common for counties to have less than 50% of MAF units originating from legacy censuses.
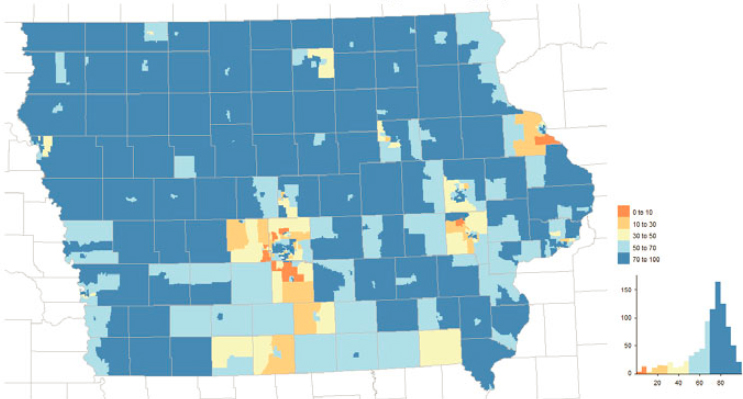
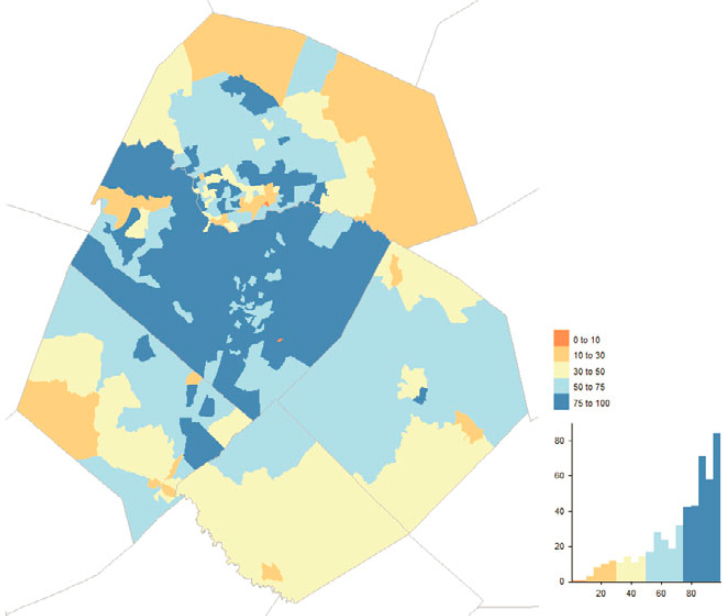
The census tract level provides more fine-grained spatial variation (Figure 5.3). Legacy censuses account for large fractions of MAF units in rural and central city parts of Iowa. In the suburbs around Iowa’s larger cities, legacy censuses were the source of a smaller fraction of MAF units. Suburban areas may have been developed after the 2010 Census; therefore, they would not have MAF units from legacy censuses.
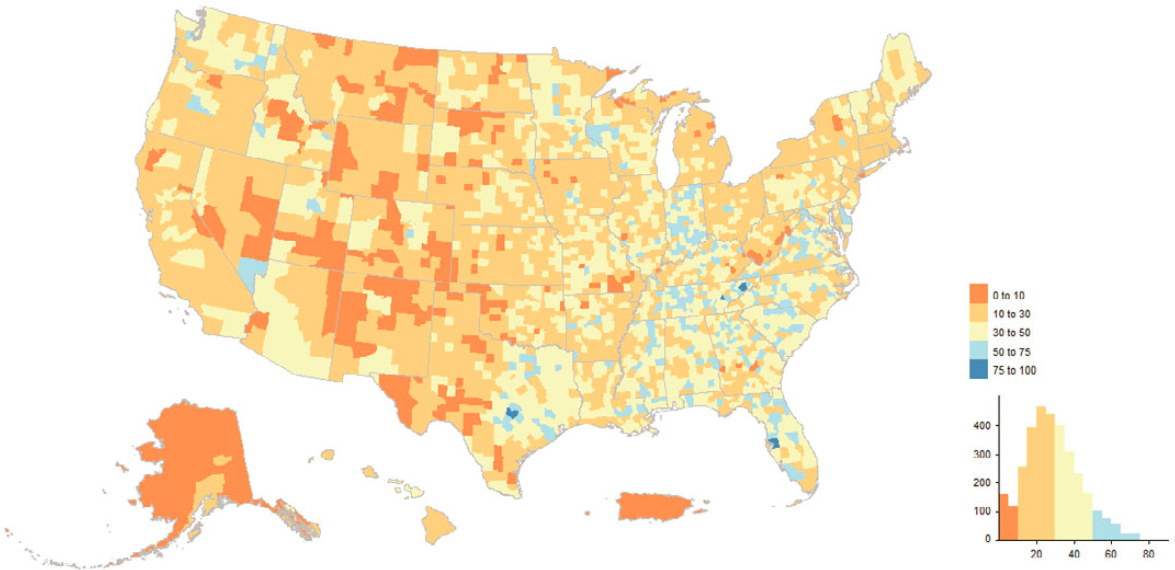
Figure 5.4 shows the percent of MAF units in the Good Legacy DSF category by county. This map somewhat mirrors the Good Legacy Census map (Figure 5.2). In many U.S. counties, the DSF provided less than 50% of a county’s MAF units. The DSF was an important source of MAF units in the Southeast. Drilling down to the census tract level in the Austin, Texas metropolitan area (Figure 5.5), we observe many census tracts with more than 75% of MAF units originating from the DSF.
Taken together, these four maps highlight the contributions of legacy censuses and the DSF to the MAF. Legacy censuses provide a bulk of the MAF entries that were successfully enumerated in the 2020 Census, and the DSF is a key source of MAF entries in particular areas of the United States. However, the maps show variation by area of the nation, with the south and especially the southeast having smaller shares of their MAF units from legacy sources,
SOURCE: MAF Development Dataset. See Disclosure Review Statement; CBDRB-FY23-0197.
SOURCE: MAF Development Dataset. See Disclosure Review Statement; CBDRB-FY23-0197.
which translates into a higher share of MAF units from census address-building operations.
It is interesting to see the contrast between the Good Legacy maps and the map of concentration of Bad Legacy addresses shown in Figure 5.6. Pockets of high concentration of Bad Legacy addresses are relatively few and widely scattered, and examination of finer-grained maps (not printed here) point to several reasons why segments of “old,” long-known addresses could suddenly fail to show up as 2020 Census enumerations—for instance, areas impacted by natural disasters or likely conversions (or changes in designation) between housing units and GQ locations. At the national/county level, the banding of low concentrations of these Bad Legacy cases in the Rust Belt, Mid-Atlantic, and California and Florida coasts is striking.
5.4.2 Good Reactivations
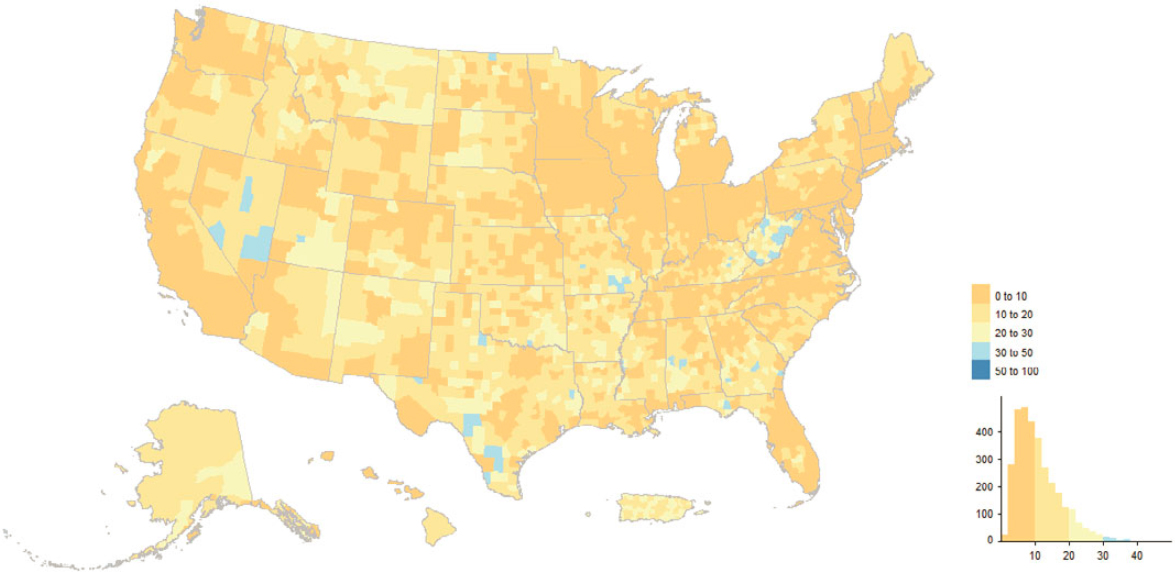
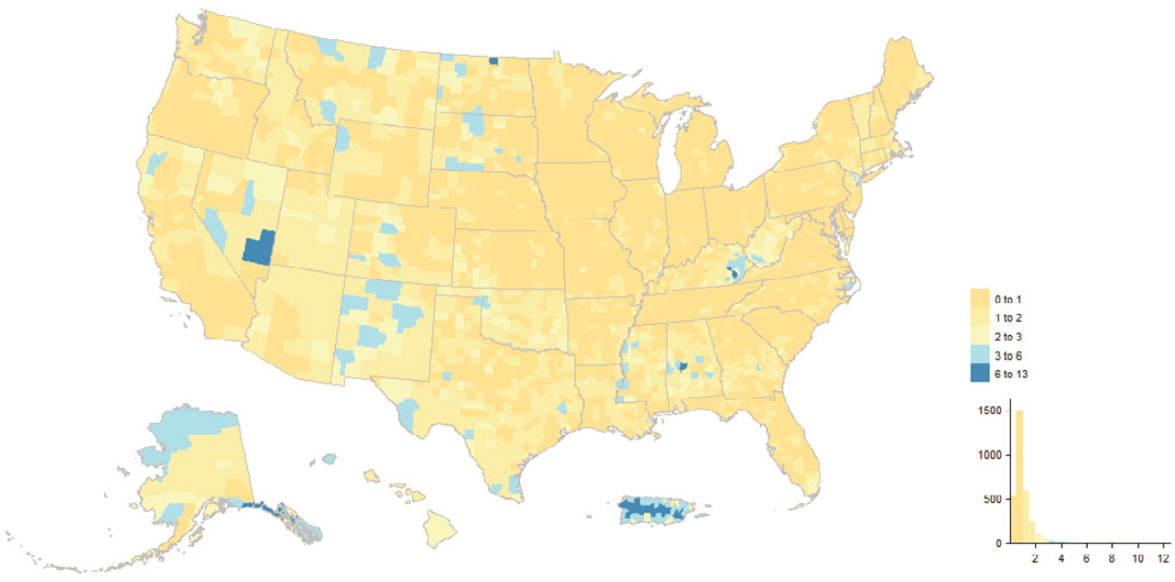
When we consider the spatial distribution of MAF units that were “reactivated” by a 2020 Census address-building operation and then successfully enumerated, we observe a few counties with more than 4% of their MAF units reactivated (Figure 5.7). This is not a huge surprise given the relatively small number of records in this category. At the local scale, however, we do observe multiple census tracts in the Dallas-Fort Worth metropolitan area with greater
SOURCE: MAF Development Dataset. See Disclosure Review Statement; CBDRB-FY23-0197.
SOURCE: MAF Development Dataset. See Disclosure Review Statement; CBDRB-FY23-0197.
than 20% of their MAF units classified as reactivated (Figure 5.8). These are areas that may have been undercounted had census address-building operations not successfully identified and enumerated MAF units excluded from the initial enumeration universe.
5.4.3 Unique Adds from 2020 Census Address-Building Operations
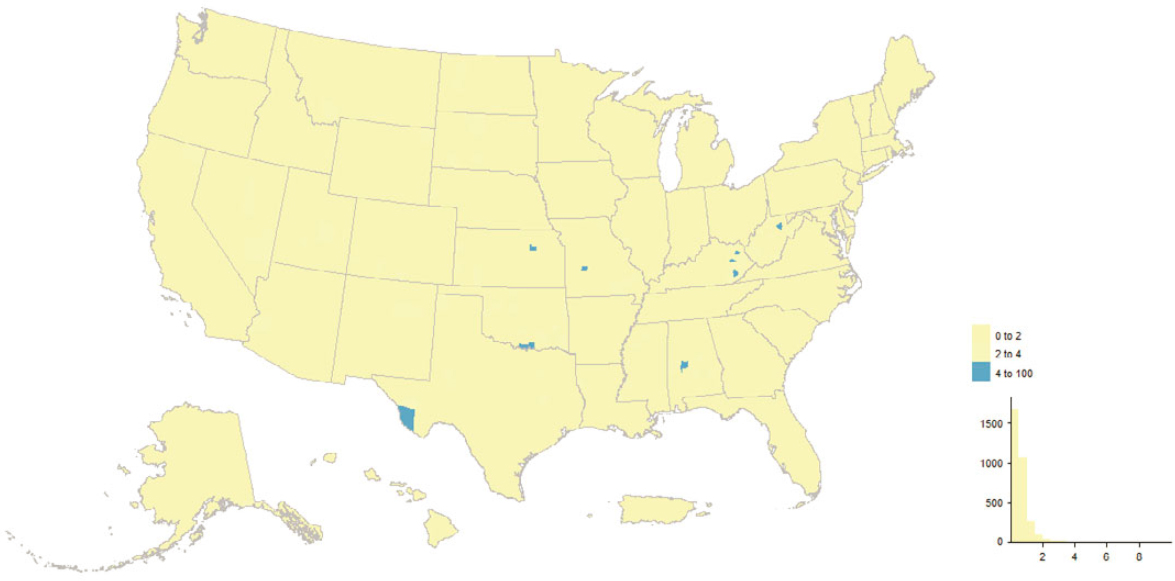
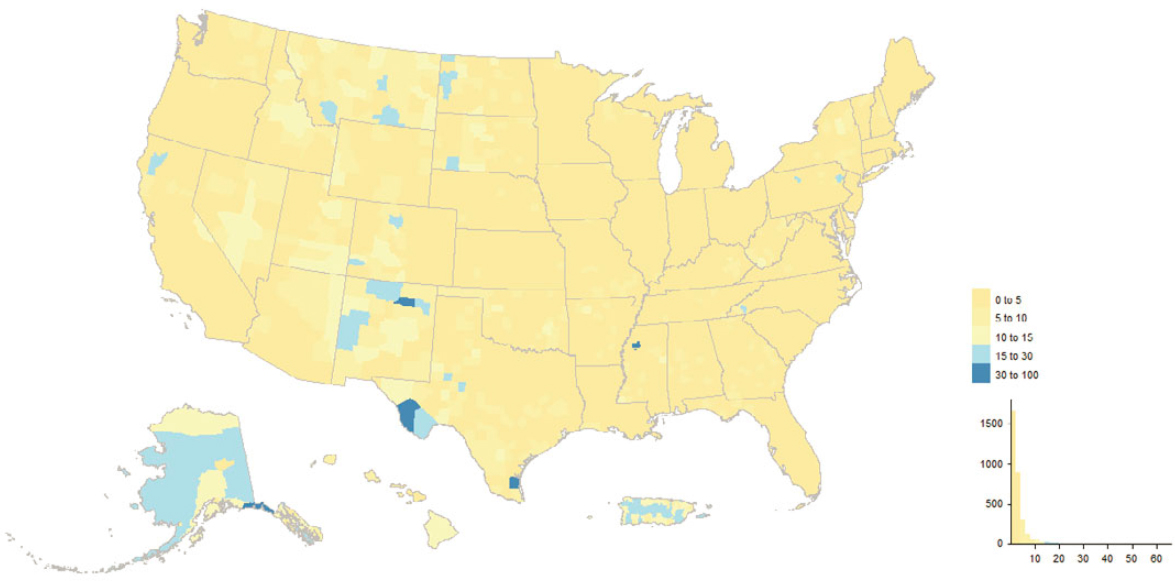
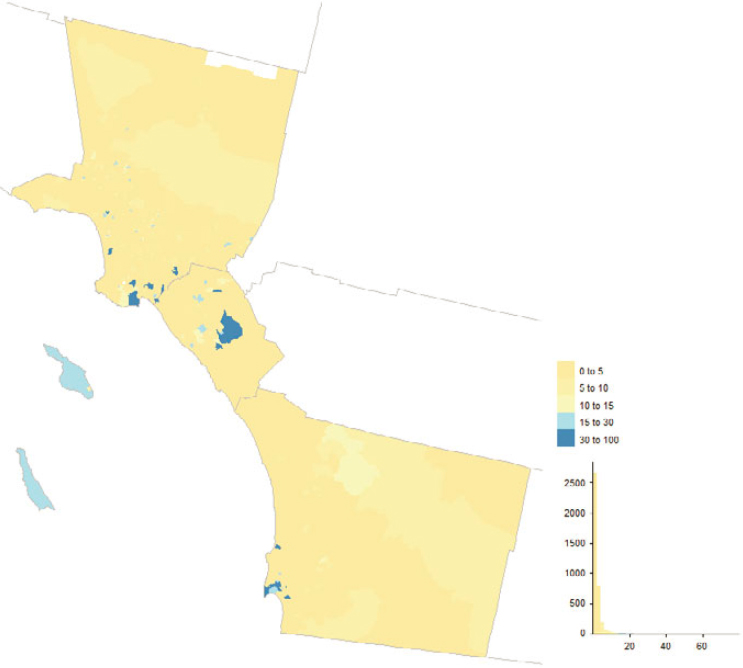
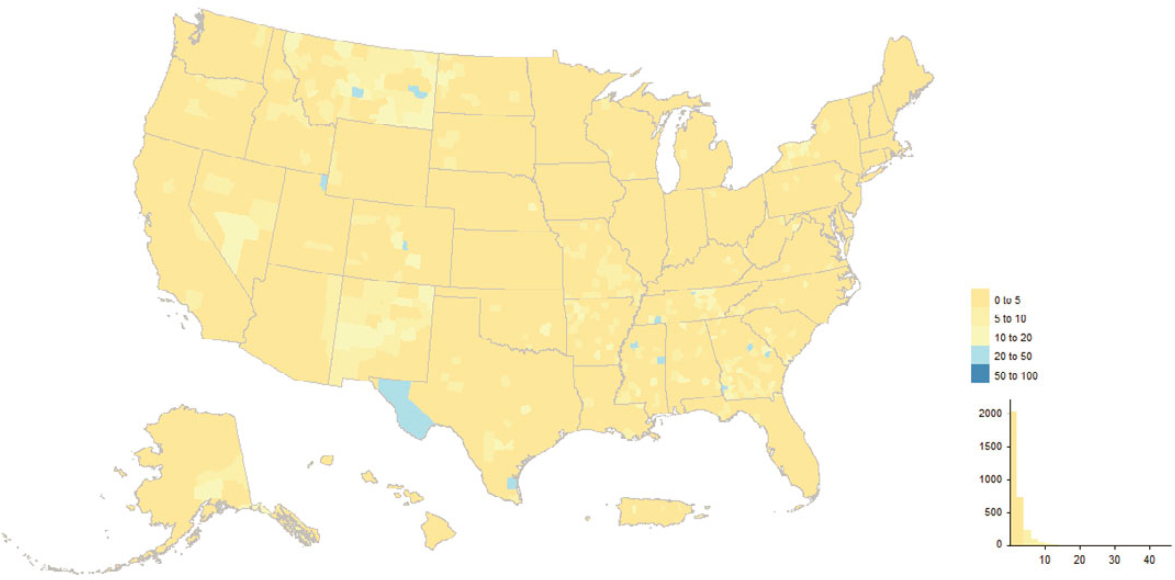
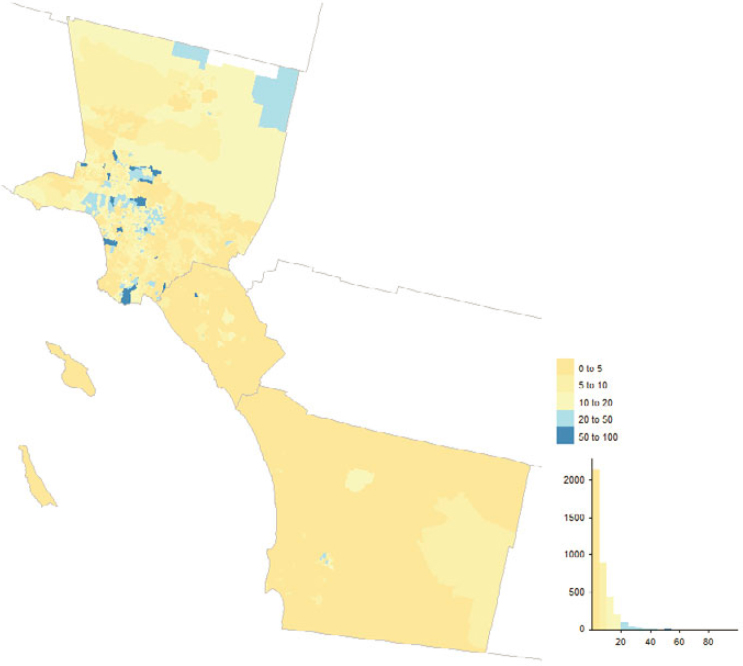
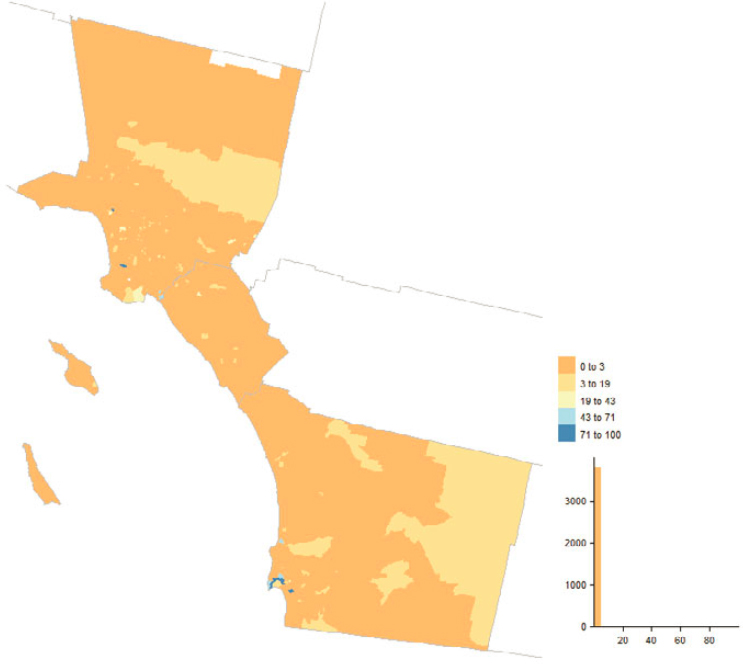
Figure 5.9 depicts county-level concentrations of “good” (enumerated in 2020) MAF units uniquely sourced on the MAF to a 2020 Census address-building operation, and Figure 5.11 does the same for “bad” (not enumerated in 2020) 2020 adds; Figures 5.10 and 5.12 show tract-level concentrations for the same section of southern California, spanning Los Angeles, Orange, and
SOURCE: MAF Development Dataset. See Disclosure Review Statement; CBDRB-FY23-0197.
SOURCE: MAF Development Dataset. See Disclosure Review Statement; CBDRB-FY23-0197.
SOURCE: MAF Development Dataset. See Disclosure Review Statement; CBDRB-FY23-0197.
San Diego Counties. The interesting picture is how few and localized the high concentrations are. The 2020 Census address-building operations vary in terms of participation and coverage, and the results defy easy summarization. For instance, it is an eclectic mix of tracts comprising current and former military facilities, colleges and universities, parks, and airports that show up as high concentrations in both the “good” and “bad” 2020 adds maps for southern California, but with unique subsets between the two maps.
5.5 IMPACT OF 2020 CENSUS ADDRESS-BUILDING OPERATIONS
The prior discussion focused on the origin of MAF entries and their final disposition during the 2020 Census. We highlighted the fact that contributions from user-input address-building operations (LUCA, NC, and CR) and other 2020 Census address-building operations (e.g., AdCan, NRFU, UL) compose a small portion of the final 2020 enumeration. Additionally, with few exceptions (e.g., AdCan, OBAV, NRFU, UL), MAF entries contributed by these operations were more likely than not to fail enumeration.
SOURCE: MAF Development Dataset. See Disclosure Review Statement; CBDRB-FY23-0197.
SOURCE: MAF Development Dataset. See Disclosure Review Statement; CBDRB-FY23-0197.
SOURCE: MAF Development Dataset. See Disclosure Review Statement; CBDRB-FY23-0197.
SOURCE: MAF Development Dataset. See Disclosure Review Statement; CBDRB-FY23-0197.
These operations, though, interacted with the MAF more deeply than is indicated by Tables 5.2 and 5.3. The MAF Development Dataset provides indicators for whether particular 2020 Census address-building operations took an action on a MAF entry, as well as the origin of the address. Thus, we can determine whether a particular address-building operation (1) added an address to the MAF entry or (2) took an action (or “touched”) a MAF entry.9 Tabulating adds or actions by address origin provides us with Table 5.4, which is segmented by major category of 2020 Census address-building operations:
- User Input Operations—LUCA, NC and CR;
- Field/Clerical Operations—AdCan, OBAV, FV, and NRFU; and
- Enumeration Operations—UL, UE/RA, GQ, TL, and Service-Based Enumeration.10
All told, 2020 Census suboperations added or touched 83.9 million MAF entries.
5.5.1 Address List Input from User Programs
While LUCA, NC, and CR had mixed results in terms of successful enumerations, some areas of the nation had large fractions of their addresses affected or “touched” in some way by these user-input programs. LUCA was the most influential of these programs. There were 16.5 million MAF units submitted by LUCA participants, 12 million of which had origins in previous censuses and pre-2020 DSF updates, meaning that just 3.2 million originated uniquely from the 2020 Census LUCA program.
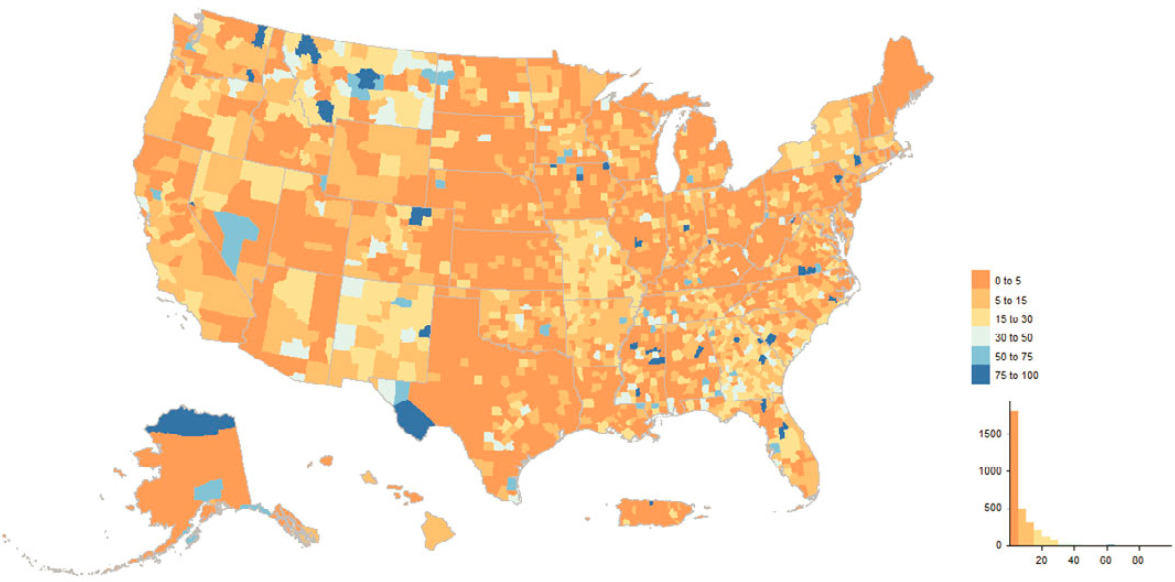
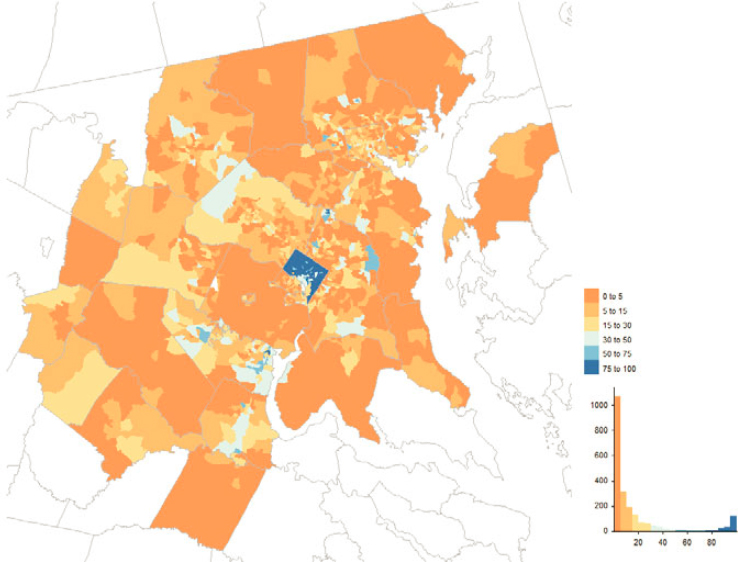
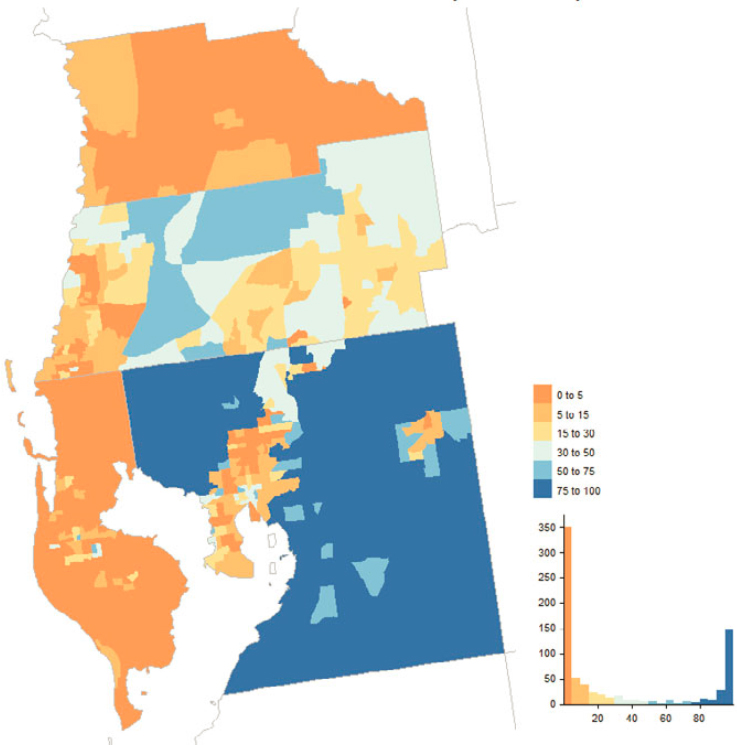
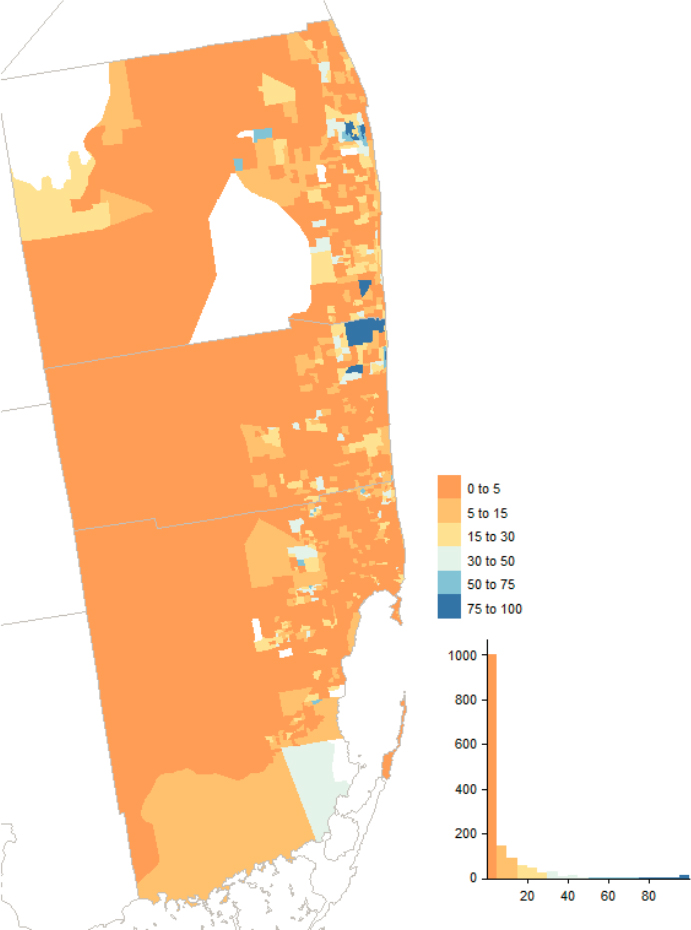
In parts of Montana, Nevada, Colorado, New Mexico, and Texas as well as clusters in the Midwest, Northeast, and South, 30% or more of all MAF units were touched in some way by user-input programs (Figure 5.13). Perhaps the greatest concentration in the nation can be found in the District of Columbia where the large majority of addresses were touched by LUCA actions (Figure 5.14). Other examples of marked local concentrations of addresses affected by LUCA can be found in Florida, in the Tampa-St. Petersburg and Miami-Dade County metropolitan areas (Figures 5.15 and 5.16).
___________________
9 The flags in the dataset indicate whether the action taken was “positive,” “negative,” or “change,” but we chose not to distinguish between the types. The principal reason for doing so was to avoid the near-automatic association between “positive” action and “add” and between “negative” action and “delete,” when neither of those associations is exactly apt. For example, the neutral action of simple verification of the existence of an address could be counted as a positive action in the data; likewise, a negative action in one address-building operation does not necessarily mean automatic deletion.
10 Service-Based Enumeration is the sole 2020 Census address-building operation for which the MAF Development Dataset provides an action flag but that does not appear as a separate entry in the address origin (SRCCAT) variable.
Table 5.4 Addresses Added or Touched by 2020 Census Address-Building Operations, by Address Origin
| Address Origin | 2020 Census User-Input Operation | ||
|---|---|---|---|
| LUCA | CR | NC | |
| Legacy Censuses | |||
| 2000 Census | 5,501,000 | 23,500 | 173,000 |
| 2010 Census | 865,000 | 14,500 | 37,500 |
| Other Pre2020 | 83,000 | 300 | 4,600 |
| Legacy DSF | |||
| Pre2020 | 6,856,000 | 93,500 | 779,000 |
| Spring 2020 | 0 | 0 | 0 |
| 2020 Census Operation | |||
| LUCA | 3,238,000 | 100 | 65,500 |
| CR | 0 | 108,000 | 4,300 |
| NC | 0 | 0 | 497,000 |
| AdCan | 400 | 0 | 36,500 |
| OBAV | 0 | 0 | 0 |
| FV | 0 | 0 | 0 |
| NRFU | 0 | 0 | 0 |
| UL | 0 | 0 | 0 |
| UE/RA | 0 | 0 | 0 |
| GQ | 0 | 0 | 0 |
| TL | 0 | 0 | 0 |
| Total | 16,540,000 | 240,000 | 1,599,000 |
| Address Origin | 2020 Census Field/Clerical Operation | |||
|---|---|---|---|---|
| AdCan | OBAV | FV | NRFU | |
| Legacy Censuses | ||||
| 2000 Census | 21,880,000 | 295,000 | 12,500 | 1,778,000 |
| 2010 Census | 2,834,000 | 66,500 | 2,100 | 838,000 |
| Other Pre2020 | 286,000 | 6,700 | 300 | 76,000 |
| Legacy DSF | ||||
| Pre2020 | 22,320,000 | 390,000 | 10,500 | 1,852,000 |
| Spring 2020 | 0 | 13,000 | 350 | 64,500 |
| 2020 Census Operation | ||||
| LUCA | 1,325,000 | 4,000 | 400 | 687,000 |
| CR | 0 | 350 | N < 15 | 35,000 |
| NC | 0 | 2,500 | 50 | 153,000 |
| AdCan | 1,115,000 | 1,000 | 80 | 239,000 |
| OBAV | 0 | 795,000 | 94,000 | 3,000 |
| FV | 0 | 6,400 | 6,400 | N < 15 |
| NRFU | 0 | 1,200 | 200 | 199,000 |
| UL | 0 | 8,600 | 4,000 | 53,500 |
| UE/RA | 0 | 20 | N < 15 | N < 15 |
| GQ | 0 | N < 15 | N < 15 | 0 |
| TL | 0 | N < 15 | N < 15 | N < 15 |
| Total | 49,760,000 | 1,590,000 | 131,000 | 5,977,000 |
SOURCE: MAF Development Dataset. See Disclosure Review Statement; CBDRB-FY23-0197.
| Address Origin | 2020 Census Enumeration Operation | Total (all operations) | ||||
|---|---|---|---|---|---|---|
| UL | UE/RA | GQ | TL | SBE | ||
| Legacy Censuses | ||||||
| 2000 Census | 3,097,000 | 21,500 | 82,500 | 44,500 | 300 | 32,910,000 |
| 2010 Census | 2,089,000 | 6,000 | 58,000 | 52,000 | 1,000 | 6,863,000 |
| Other Pre2020 | 452,000 | 4,100 | 6,400 | 9,800 | 50 | 930,000 |
| Legacy DSF | ||||||
| Pre2020 | 906,000 | 200 | 43,000 | 32,500 | 250 | 33,280,000 |
| Spring 2020 | 3,900 | 0 | 100 | 40 | 0 | 81,500 |
| 2020 Census Operation | ||||||
| LUCA | 283,000 | 2,100 | 20,500 | 14,500 | 60 | 5,641,000 |
| CR | 1,100 | N < 15 | 0 | 0 | 0 | 149,000 |
| NC | 450 | 0 | 0 | 0 | 0 | 654,000 |
| AdCan | 1,700 | N < 15 | 10,000 | 14,000 | 50 | 1,418,000 |
| OBAV | 0 | 0 | 0 | 0 | 0 | 892,000 |
| FV | 0 | 0 | 0 | 0 | 0 | 13,000 |
| NRFU | 0 | 0 | 0 | 0 | 0 | 200,000 |
| UL | 538,000 | 0 | 1,600 | 11,000 | N < 15 | 616,000 |
| UE/RA | 0 | 7,400 | 0 | 0 | 0 | 7,400 |
| GQ | 0 | 0 | 102,000 | 60 | 4,900 | 107,000 |
| TL | 0 | 0 | N < 15 | 174,000 | N < 15 | 174,000 |
| Total | 7,372,000 | 41,500 | 324,000 | 353,000 | 6,600 | 83,930,000 |
NOTES: DSF, Delivery Sequence File; LUCA, Local Update of Census Addresses; CR, Count Review; NC, New Construction; AdCan, Address Canvassing; OBAV, Office-Based Address Verification; FV, Field Verification; NRFU, Nonresponse Followup; UL, Update Leave; UE/RA, Update Enumerate/Remote Alaska; GQ, Group Quarters; TL, Transitory Locations; SBE, Service-Based Enumeration.
SOURCE: MAF Development Dataset. See Disclosure Review Statement; CBDRB-FY23-0215.
5.5.2 Field/Clerical Operations
The four field/clerical operations added or touched over 50 million addresses, with the bulk of those coming from Address Canvassing. In the map analysis, we focus on the major address-building operations of OBAV and NRFU.
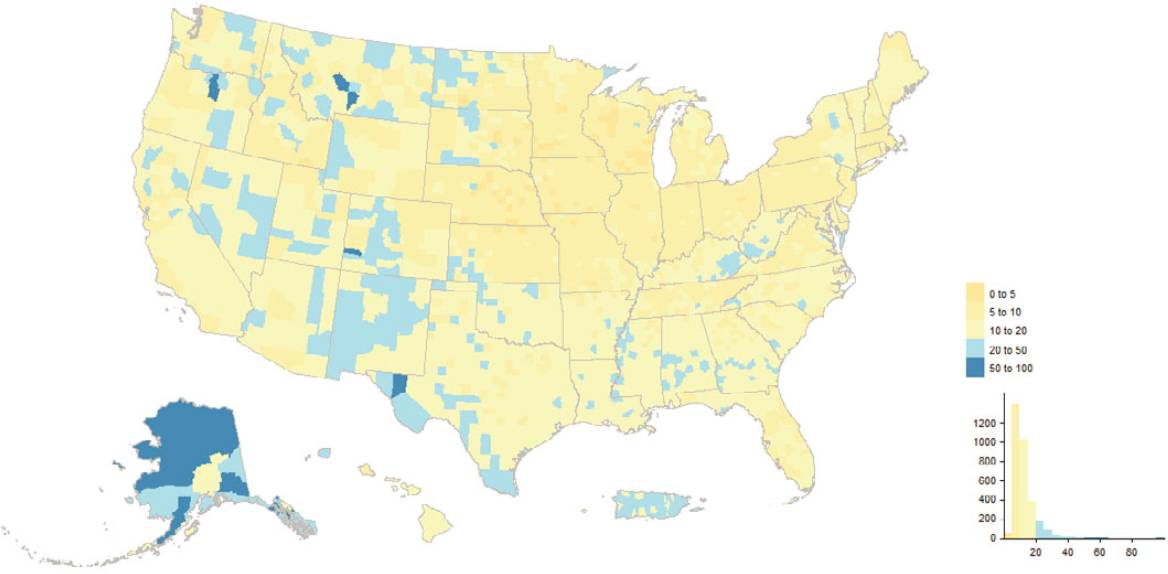
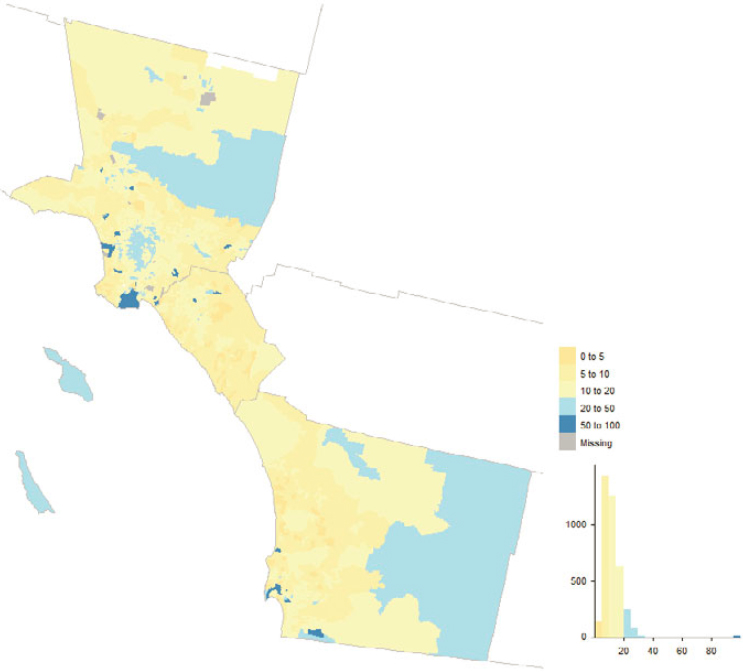
OBAV played an important role in the 2020 Census, adding almost 800,000 addresses alone and touching addresses from a variety of other sources. Figure 5.17 shows the geographic distribution by county while Figure 5.18 shows the distribution across tracts in Los Angeles, Orange, and San Diego Counties, California. Counties in eastern Kentucky, southern West Virginia, parts of the West, and municipios in Puerto Rico had decent fractions of their MAF units added or touched by OBAV. By design, OBAV followed up on
addresses received from Non-ID Processing (i.e., Self-Response questionnaires without reference to a printed identification number from paper materials) that were not immediately matchable to the MAF. Hence, it is important to consider concentrations of OBAV returns in the context of concentrations of Non-ID Processing returns, which we derived from the dataset underlying the Census Bureau’s Operational Quality Metrics releases and illustrate in Figures 5.19 and 5.20.
SOURCE: MAF Development Dataset. See Disclosure Review Statement; CBDRB-FY23-0197.
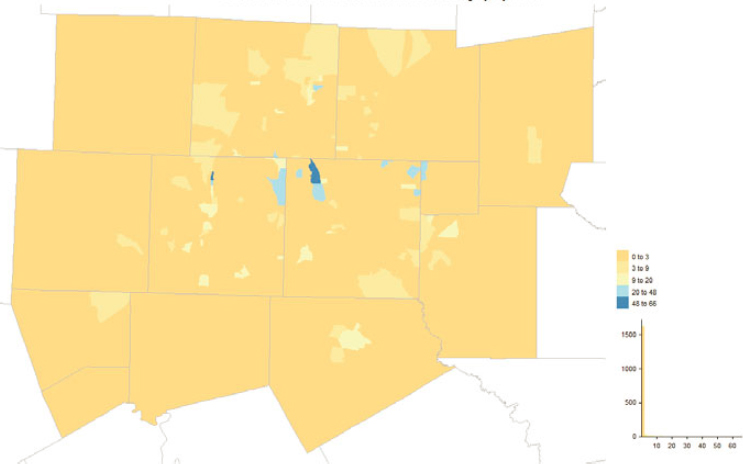
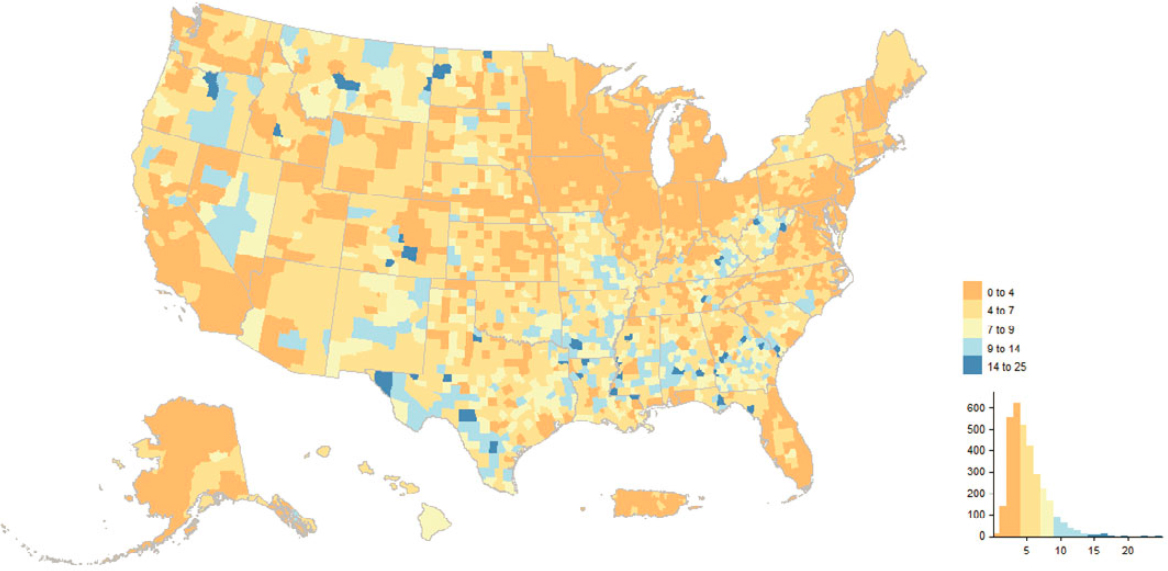
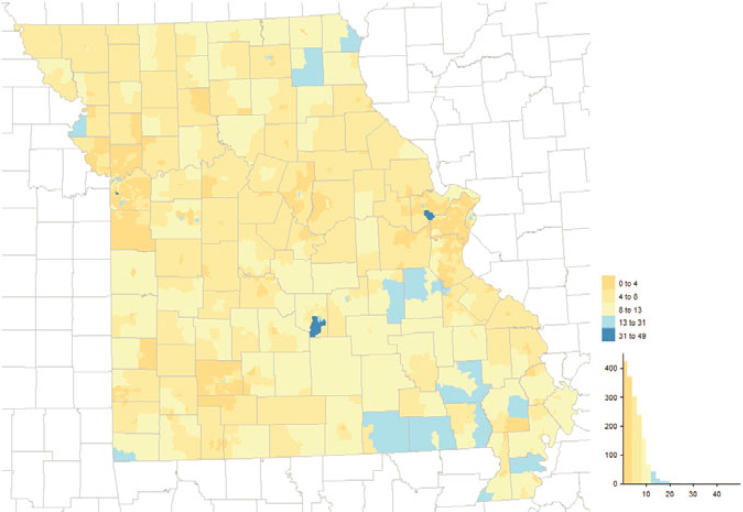
Similarly, NRFU interacted with addresses from almost all MAF source categories; see Figures 5.21 and 5.22 for the distribution by county and an illustration of tract-level variation in the state of Missouri. From a spatial perspective, counties in a belt stretching across the South from east Texas to South Carolina, along with counties in eastern Kentucky and southern West Virginia, had at least 9% of their MAF units added or touched by NRFU. There
SOURCE: MAF Development Dataset. See Disclosure Review Statement; CBDRB-FY23-0197.
SOURCE: MAF Development Dataset. See Disclosure Review Statement; CBDRB-FY23-0197.
5.5.3 Census Enumeration Operations
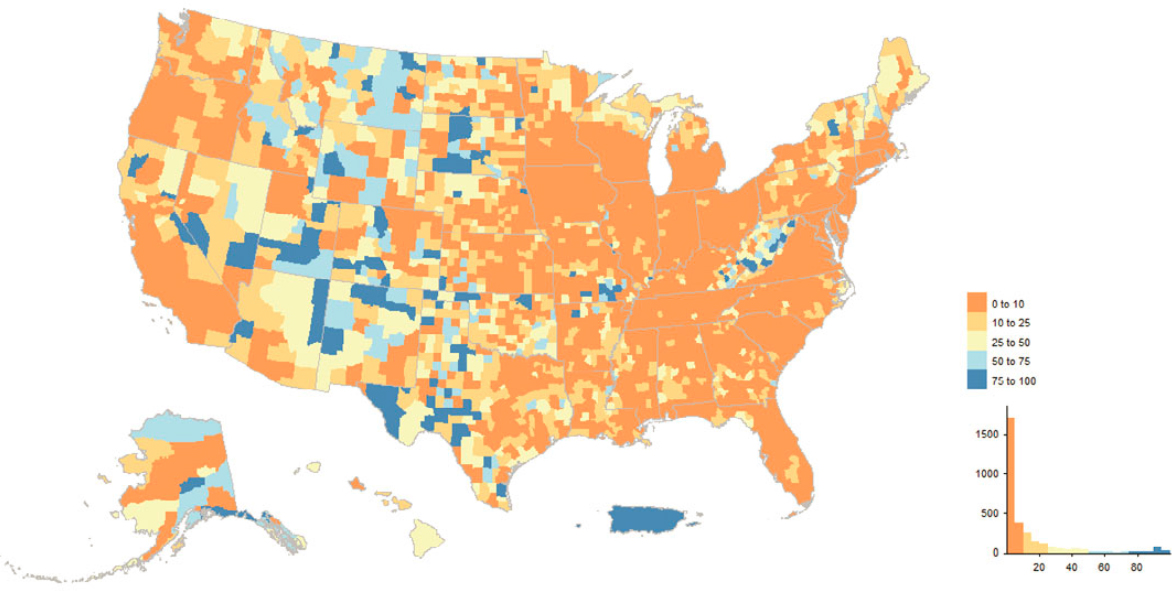
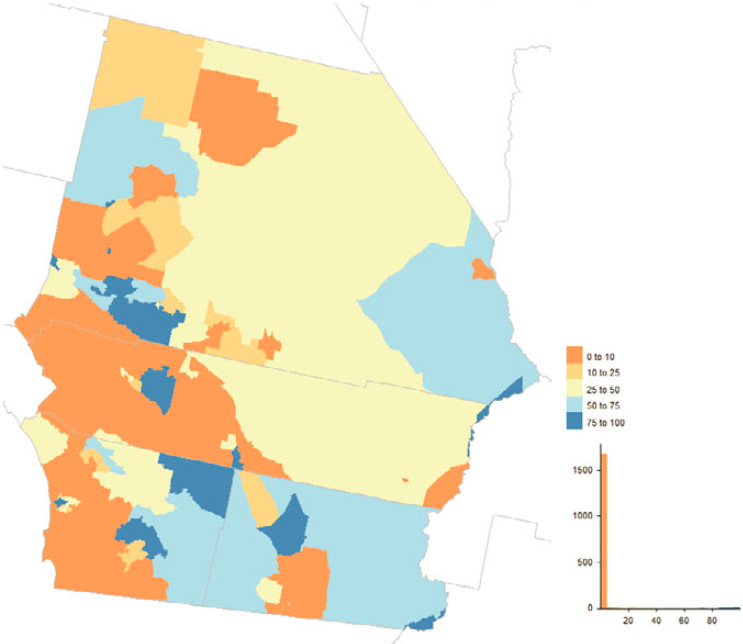
The five census enumeration operations added or touched approximately 8 million addresses, with the overwhelming majority (7.4 million) coming from UL. The other four operations targeted specific types of MAF entries (e.g., GQ or TL). UL areas were selected prior to the start of 2020 enumeration operations. West Virginia, southeastern Missouri, and counties stretching from west Texas up through Montana and Idaho had more than 50% of their MAF entries added or touched by UL (Figure 5.23). Even in heavily populated metropolitan areas such as San Bernardino-Riverside-Imperial, California, specific census tracts have a large fraction of addresses added or touched by UL (Figure 5.24).
Given the general prohibition on physical contact with households because of the COVID-19 pandemic, there were substantial delays in the execution of UL operations in areas designated for this method of enumeration. At the same time, the Census Bureau and its local partners encouraged households to self-respond, in the absence of a mail request and accompanying Census ID. While it is impossible to make any definitive connection, a comparison of Figures 5.23 (UL as a share of total MAF units) and 5.19 (Non-ID as a percent of Self-Response addresses) suggests that Non-ID was more common in UL areas. In both maps, concentrations appear in West Virginia into Kentucky, parts of the Great Plains, and a number of counties in western and southwestern states.
5.6 CONCLUSIONS
The most striking impression from analysis of MAF metadata is also the least surprising: the MAF is largely composed of addresses that have been on the rolls for many years, and continuity and sameness in the MAF over time necessarily dominates change and churn. This observation is decidedly not meant to diminish the importance of seeking new and updated address information; it actually serves to heighten the importance of both maintaining the existing MAF and finding ways to more efficiently update the list. Our analysis suggests the general findings that the Census Bureau’s strategies for filtering the MAF were effective at identifying address records that were likely to be enumerable, and that the 2020 Census address-building operations made useful contributions, even though user-input operations like LUCA were not very efficient at producing unique information (yielding address records that did not result in enumeration in the 2020 Census or that were duplicative of already-known MAF entries). One particularly important 2020 Census operation that contributed to the MAF was OBAV, which primarily served to resolve addresses
is also a belt of counties running from west Texas up to North Dakota and Montana where NRFU added or touched a sizable fraction of addresses.
SOURCE: MAF Development Dataset. See Disclosure Review Statement; CBDRB-FY23-0197.
SOURCE: MAF Development Dataset. See Disclosure Review Statement; CBDRB-FY23-0197.
SOURCE: Calculated from tract-level data underlying public 2020 Census Operational Quality Metric releases. See Disclosure Review Statement; CBDRB-FY23-0197.
SOURCE: Calculated from tract-level data underlying public 2020 Census Operational Quality Metric releases. See Disclosure Review Statement; CBDRB-FY23-0197.
SOURCE: MAF Development Dataset. See Disclosure Review Statement; CBDRB-FY23-0197.
SOURCE: MAF Development Dataset. See Disclosure Review Statement; CBDRB-FY23-0197.
from Non-ID Processing (census returns without a preprinted MAFID code) that were not automatically matched to the MAF. In trying to resolve address information without field visits, and instead using other data and imagery resources, OBAV functioned much as a fully realized IOAC would have (with Active Block Resolution preserved as a component). The OBAV operation uniquely added roughly 750,000 new addresses to the MAF and appears to have been a major factor in “reactivating” many others (i.e., confirming that a respondent-supplied address matched an address already on the MAF but that had failed the filter to enter the starting base for the 2020 Census).
Conclusion 5.1: The U.S. Census Bureau’s approach of retaining a fluid Master Address File database and filtering operational extracts from that database is a sound one, provided that the filters are continually studied and updated to improve their efficacy.
Conclusion 5.2: The U.S. Census Bureau’s reliance on the U.S. Postal Service’s Delivery Sequence File as a primary update source between
SOURCE: MAF Development Dataset. See Disclosure Review Statement; CBDRB-FY23-0197.
SOURCE: MAF Development Dataset. See Disclosure Review Statement; CBDRB-FY23-0197.
censuses is a good one, though it necessitates a reliable update source in areas without mail delivery.
Conclusion 5.3: With respect to the user-input address-building operations of Local Update of Census Addresses, Count Review, and New Construction, both participant governments and the U.S. Census Bureau erred on the side of inclusion—with local authorities submitting many more addresses for review than were actually in the operation’s scope and the Census Bureau injecting many of those submitted addresses into the enumeration process to let fieldwork determine their accuracy. Consequently, these user-input operations appear to have added more bad (unenumerated) addresses to the 2020 Census than good (enumerated) addresses.
Conclusion 5.4: The Office-Based Address Verification operation for resolving respondent-supplied addresses from Non-ID Processing was an effective innovation in the 2020 Census, both in terms of its potential for resolving address listing issues with limited field work and for informing revisions to Master Address File filters.
Recommendation 5.1: The U.S. Census Bureau should continue to research and refine the filters it applies to the Master Address File to derive functional operational extracts, with the intent to reduce the number of addresses cancelled during collection (i.e., flagged as deletes in Nonresponse Followup and other field operations). Along those lines, the Census Bureau should continue to study ways to partner with and more fully utilize U.S. Postal Service data (including the Delivery Sequence File) and potential sources for address addition and revision information between censuses, such as address data recoverable from administrative records extracts, with particular eye toward more regular updating in areas without mail delivery.
Recommendation 5.2: The rules and scope of participant-input address-building operations of the census require clarification, including the Local Update of Census Addresses, New Construction, and Count Review. The U.S. Census Bureau should continue to improve ways to work with user-supplied input or data resources, and make it easier for state, local, and tribal authorities to supply input in usable form, while more clearly laying out the expectations for those address-building operations.
Recommendation 5.3: The U.S. Census Bureau should extend and improve during-the-decade programs, akin to the Geo
graphic Support Systems Initiative of the 2010s, with the goal of continuous address- and map-database refinement. Such efforts should include engagement with state, local, and tribal partners, including on the question of whether some addresses can safely be removed from the Master Address File.
Recommendation 5.4: Lessons learned from the Office-Based Address Verification operation should be documented and incorporated into the tools and techniques for ongoing, continuous address and map data refinement (e.g., continuous In-Office Address Canvassing) as well as revisions of the Non-ID Processing operation.
Recommendation 5.5: The U.S. Census Bureau should research and test approaches to increase the proportion of dwellings that can be mailed to while still being associated with a physical geographical location. This would reduce the proportion of addresses in Update Leave and expand the use of approaches yielding higher Self-Response for more dwellings in the 2030 Census.


