Assessing the 2020 Census: Final Report (2023)
Chapter: 3 Age Heaping as an Indicator of Data Quality
– 3 –
Age Heaping as an Indicator of Data Quality
This chapter presents our assessment of a classic measure of quality for the data collected in the 2020 Census—namely, the accuracy of data on age. Such accuracy may be analyzed by examining the census counts only or by comparing census age data with age data from Demographic Analysis (DA), which is based largely on vital statistics. We pay special attention to how the accuracy of age data varies by response mode. This chapter serves as a foundation for subsequent chapters that dig deeper into details for specific census operations and how they affected data accuracy, in terms of such measures as population coverage and missing responses. Chapter 11 examines the quality of the released data products and specifically the impact of the new Disclosure Avoidance System (DAS) on accuracy, timeliness, coherence, and comparability of those products.
3.1 AGE HEAPING AS A QUALITY INDICATOR FOR THE 2020 CENSUS
Examining age data is a classic method for evaluating the quality of a census (Hobbs, 2004; Jensen et al., 2023). In common with most censuses today, the 2020 Census asked for both household members’ ages in completed years and for date of birth. This double approach to age measurement is helpful in editing—for example, for people with birthdays near the census date or who complete the Post-Enumeration Survey (PES).
Age heaping refers to the population reporting certain ages at the expense of other ages, and it is common in both censuses and surveys (Pullum, 2006). In the United States, the preference is for ages ending in 0 or 5. (In other countries, different digits may be preferred; see Poston and Bouvier, 2017:290). Higher levels of age heaping indicate inaccuracy in reporting, and, for this reason, age heaping is a commonly used measure of data quality (Pardeshi, 2010; Pullum, 2006). Age heaping has been well documented, especially in developing countries, in which some respondents may be unsure of their own exact ages (see, e.g., Lyons-Amos and Stones, 2017).1 Evidence of age heaping in the U.S. census goes back more than 150 years, although not to the degree seen in developing countries and generally diminishing over time (Author unknown, 2015; Zelnik, 1961).
Age heaping is important for two reasons. First, some uses of census data call for detailed age distributions at the state and local level that are not available from DA (which, as shown below, exhibits minimal age heaping). Also, age heaping may be an indicator of other data-quality problems in the census, affecting both coverage and other characteristics.
A March 2022 post on the U.S. Census Bureau web site reported “significant age heaping . . . in the 2020 Census results” (Jensen and Kennel, 2022). The post presented a graph of net census coverage by single years of age—essentially the 2020 line in Figure 3.1. That line shows clear evidence of heaping at multiples of 5, ranging from 20–80 years of age. The net count at each of those ages is higher than the counts for the four surrounding ages. Moreover, the extent of age heaping appears markedly more pronounced in the 2020 Census than in 2010. Similarly, West et al. (2005) document age heaping in the 2000 Census that is comparable in magnitude to 2010 and much less pronounced than in 2020.
Although graphs illustrating age heaping, such as Figure 3.1, are visually compelling, it is hard to characterize the amount of heaping from such graphs, especially at ages for which net coverage is rising or falling quickly, for example, for children under the age of 10. Also, analysis of counts for the full census is not informative about sources of age heaping. Using additional information provided by the Census Bureau, this chapter analyzes age counts in 2010 and 2020 by the type of age data reported (e.g., age only or both age and date of birth) and the mode of data collection (e.g., internet, proxy respondent).
We conclude the chapter with comments on the evidence of widespread data-quality problems (including but not limited to age heaping) in Nonresponse Followup (NRFU), particularly in proxy responses. Given that self-response rates and therefore NRFU rates are not uniformly distributed geographically or demographically, this finding has implications for equitable coverage of population groups and geographic areas.
___________________
1 For a recent analysis in India, see https://pgbhat.wordpress.com/2020/10/31/1767/.
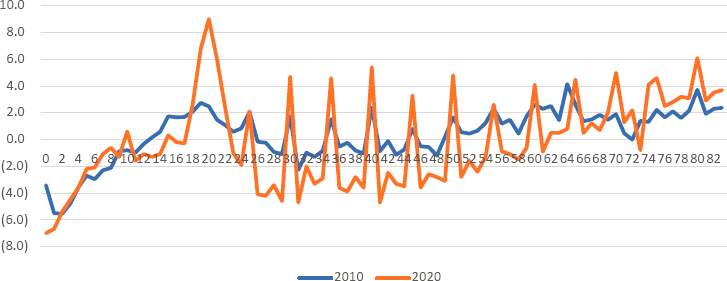
SOURCE: 2020, middle series from Table 1—Demographic Analysis Net Coverage Error Estimates by Single Year of Age, Sex, and Series: April 1, 2020 at https://www.census.gov/data/tables/2020/demo/popest/2020-demographic-analysis-tables.html. 2010, calculated from revised middle series in Total Resident Population by Age and Race table at https://www.census.gov/data/tables/2012/demo/popest/revised-2010-demographic-analysis-estimates.html.
3.2 ANALYSIS OF AGE REPORTING IN THE CENSUS
To conduct a more thorough analysis of age heaping, we requested (and the Census Bureau provided) national-level counts by single years of age from 0–84 for the full 2010 and 2020 Censuses and for various subsets defined by the way age was reported or derived and by response mode. The Census Bureau applied privacy protection to these data by rounding (for 2010) or addition of discrete Gaussian noise (for 2020). The added noise was small compared to the magnitude of the census numbers at the national level. The source file for the data was the Census Edited File, which includes imputations for nonresponse.
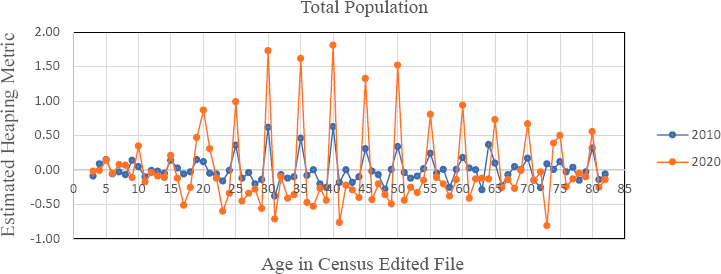
Our analysis uses an age heaping metric that focuses on the counts near multiples of 5 years. It also adjusts for known patterns in the true age distribution on Census Day using the Census Bureau’s DA estimates, by single years of age, for the total population for 2010 and 2020 (U.S. Census Bureau, 2012c, 2022d). The panel’s metric, ĥa, for values of a that are multiples of 5 can be interpreted as the percentage of true ages a − 1, a − 2, a + 1, and a + 2 that get rounded to a when reported (see Box 3.1 for technical details). While ĥa loses this interpretation for values of a that are not multiples of 5, one can still compute ĥa for all values of a to create the line graphs that follow. This metric can be erratic in an age range, for reasons unrelated to age heaping, if the profile
SOURCE: Calculations by the panel from Census Bureau tabulations from the 2020 Census Edited File. See Disclosure Review Statement; CBDRB-FY23-0180.
of true ages for the group under study differs too much from the pattern of DA estimates for that range (see Box 3.1, Step 6). This behavior can be observed around ages 17–18 when enumeration methods abruptly shift for many young adults who attend college and around the age corresponding to the beginning of the baby boom era (73–74 in 2020).
Figure 3.2 graphs ĥa for a = 3, . . . , 82 for the full census population in 2010 and 2020. For 2020, the most prominent feature is consistent peaks at every multiple of 5 years, with the highest peaks in the age range 30–50, declining gradually for ages above 60. There is much weaker age heaping for children. Apart from the clear evidence of heaping at multiples of 5, the most prominent feature for 2020 is a sharp rise between ages 73 and 74. The other main phenomenon is a wide peak for the range 19–21 years that seems to reflect an overcount of the college-age population on top of any heaping at age 20.
The large overcounts shown for the college-age population likely resulted from duplicate enumerations due to colleges sending students home at the start of the COVID-19 emergency declaration, just at the time when follow-up with college students was scheduled to begin. Many students were likely enumerated both at their college residence, where the Census Bureau endeavored to count them according to census residence rules at a later stage of the enumeration (see Chapter 9), and as household members reported by their parents.
The line for 2010 is similar to that for 2020 with two noteworthy distinctions. First, an atypical rise from ages 63–64 in 2010 reemerges as a more dramatic rise from ages 73–74 in 2020 (see discussion below). Of more
importance, heights of the peaks are consistently higher in 2020 than in 2010, typically by a factor of at least 3.0.
In its Demographic Yearbook 1955, the United Nations chose Whipple’s index to evaluate the quality of age data (United Nations, 2007:5), and it is widely used (Spoorenberg, 2009). Whipple’s index of age heaping is the simplest measure of age data quality because it is based only on the enumerated age distribution. The original Whipple’s index is obtained by summing the number of persons in the age range between 23–62, and calculating the ratio of reported ages ending in 0 or 5 within that age range to one-fifth of the total sample.2 This result is then multiplied by 100 to convert to a percentage. Without age heaping, this index takes the value 100. Deviation from this number indicates some degree of inaccuracy.
We use a modified Whipple’s index (MWI), which subtracts 100 from the original index and divides the result by 4. Consequently, MWI = 0 indicates no heaping and MWI = x corresponds to x percent of ages being rounded to the nearest multiple of 5.3 This property gives MWI the same interpretation as the heaping metric ĥa but applied to the age range 23–62.
Table 3.1 shows MWI values for 2010 and 2020, broken down by sex and racial-ethnic group. Computed MWI values for 2010 and 2020 are 0.56 and 1.48, respectively.4 Their ratio suggests that there was roughly 2.6 times as much age heaping in 2020 as in 2010. Using the same data, Velkoff and Jensen (2022:7) concluded “age heaping in the 2020 Census is more pronounced than in 2010.”
However, MWI does not account for the possibility that the proportion of true ages in the population that are multiples of five differs from one-fifth. Indeed, when MWI is computed for the DA estimates of the age distribution, it yields values of 0.17 for 2010 and 0.14 for 2020. Consequently, substantial parts of the 0.56 and 1.48 might be due to “heaping” in the population’s true ages rather than heaping by respondents. If so, that would suggest an even higher ratio going from 2010 to 2020.
Table 3.1 shows that the amount of age heaping varied by race-ethnicity and sex in both the 2010 and 2020 Censuses. Estimates of age heaping were roughly 50% higher for Hispanic and Black people than for White non-Hispanic people in both years. Notably, estimated age heaping for Asian people was the highest
___________________
2 Using Whipple’s age range of 23–62 rather than expanding it has advantages for analysis of age heaping in the 2010 and 2020 Censuses. Starting at age 23 works well because it avoids problems for the index from the apparent overcount of college students in the 2020 Census. For the upper end of the age range, Whipple likely stopped at age 62 because of lower life expectancy 100 years ago in developing countries. For recent U.S. censuses, one could easily raise the upper limit to age 72 or 82. Stopping with age 62, however, avoids the problems for the index of including pre-baby boomers in the 2010 and 2020 analyses.
3 To convert back to the original Whipple’s index, use the formula 100 + 4(MWI).
4 A comparable value for ages 23–62 in the 2000 Census is 0.50 (calculated from West et al., 2005:3661). The unmodified Whipple’s index in West et al. (2005) is 102, which converts to 0.50 after subtracting 100 and dividing by 4.
| 2010 | 2020 | |||||
|---|---|---|---|---|---|---|
| Male | Female | Total | Male | Female | Total | |
| Census Total | 0.63 | 0.49 | 0.56 | 1.64 | 1.32 | 1.48 |
| Racial-Ethnic Group | ||||||
| White Alone, Non-Hispanic | 0.54 | 0.43 | 0.48 | 1.38 | 1.15 | 1.27 |
| Hispanic or Latino | 0.84 | 0.58 | 0.71 | 2.31 | 1.70 | 2.00 |
| Black Alone | 0.80 | 0.64 | 0.72 | 1.99 | 1.66 | 1.81 |
| Asian Alone | 0.82 | 0.71 | 0.76 | 1.62 | 1.29 | 1.44 |
| AIAN Alone | 0.60 | 0.49 | 0.54 | 1.50 | 1.39 | 1.44 |
NOTE: AIAN, American Indian or Alaska Native.
SOURCE: Calculations by the panel from tables available at data.census.gov for 2010 and 2020: Tables PCT12 (Census Total), PCT12I (White Alone, Non-Hispanic), PCT12H (Hispanic), PCT12B (Black Alone), PCT12D (Asian Alone), and PCT13C (AIAN Alone).
of any group in 2010, but a bit below average in 2020. MWI values were higher for males than for females, typically by 20–30%, for each combination of year and race.
3.3 SOURCES OF AGE HEAPING—TYPE OF RESPONSE
The 2010 and 2020 Census forms asked for each resident’s age and date of birth (DOB). Not everyone answered these questions fully or consistently. The possible response categories are listed in Box 3.2.
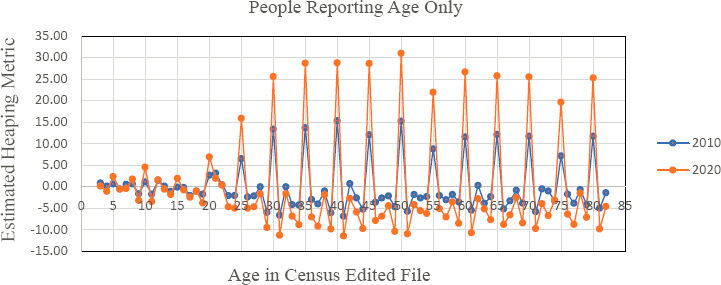
Table 3.2 presents MWI values for 2010 and 2020, broken out by whether age or DOB or both were reported and, if not, by how age was imputed. The story is very simple for 2020, when age heaping was essentially a result of age-only responses. The MWI for age-only responses, 25.75, is 100 times the MWI of 0.23 for all other responses. Despite constituting less than 5% of the full census, data not shown indicate that age-only responses contributed an estimated 85% of the heaped ages in the 23–62 year age range in 2020. Results are similar for 2010 except that the MWI for age-only responses is 12.20, a bit less than half the value in 2020, and age-only responses contributed only an estimated 57% of the heaped ages in the 23–62 year range.
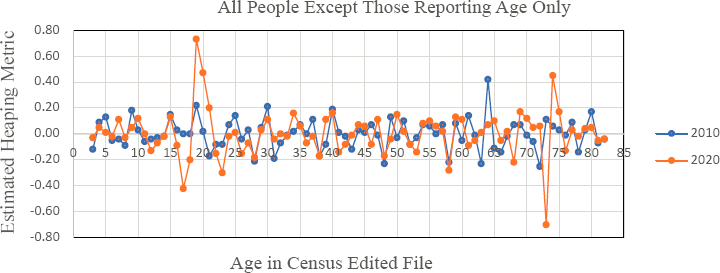
Figures 3.3 and 3.4 show age heaping for people providing age only and everyone else. (Note the vastly different scales in Figures 3.3 (−15 to +35) and 3.4 (−0.80 to +0.80).) The age profiles for the age-only responses (Figure 3.3) are remarkably similar for the two censuses—modest heaping through age 15, a quick increase in heaping from ages 20–30, maximum heaping through age 50,
| Census/Response Category | 2010 | 2020 | ||||
|---|---|---|---|---|---|---|
| Population | MWI | Population | MWI | |||
| Millions | Percent | Millions | Percent | |||
Census Total | 308.7 | 100.0 | 0.56 | 331.4 | 100.0 | 1.48 |
Age Only | 7.7 | 2.5 | 12.20 | 14.8 | 4.5 | 25.75 |
All Except Age Only | 301.0 | 97.5 | 0.25 | 316.7 | 95.5 | 0.23 |
Age and DOB, Consistent | 275.5 | 89.2 | 0.24 | 272.8 | 82.3 | 0.23 |
Age and DOB, Inconsistent | 4.5 | 1.5 | −0.30 | 0.9 | 0.3 | 1.16 |
DOB Only | 4.2 | 1.4 | −0.66 | 1.5 | 0.5 | −0.73 |
Administrative Records Assigned/Enumerated | N.A. | N.A. | N.A. | 10.7 | 3.2 | 0.19 |
Item Imputation (Hot Deck) | 11.0 | 3.6 | 0.36 | 21.9 | 6.6 | 0.17 |
Whole-Household Imputation | 5.8 | 1.9 | 1.27 | 8.8 | 2.7 | 0.33 |
NOTES: See Box 3.2 for definition of response categories. MWI, modified Whipple index; N.A., not applicable. Population values include all ages; MWI values use data for reported ages 23–62 only; negative MWI index values are not readily interpretable but only appear for small subsets of the population (those reporting DOB only in 2020 and 2010, and those reporting an inconsistent DOB and age in 2010).
SOURCE: Calculations by the panel from Census Bureau tabulations from the 2020 Census Edited File. See Disclosure Review Statement; CBDRB-FY23-0180.
SOURCE: Calculations by the panel from Census Bureau tabulations from the 2020 Census Edited File. See Disclosure Review Statement; CBDRB-FY23-0180.
and slightly less heaping for ages 55 and above. At each age, the heaping metric for 2020 is roughly twice that for 2010.
In contrast, there is very little heaping displayed in Figure 3.4 for the cases that exclude age-only reporting. Except for the peak at age 20 in 2020, none of the values at multiples of 5 years exceed 0.25. Focusing on this sample, in which heaping is minimal, highlights positive outliers at age 64 for the 2010 Census and age 74 for the 2020 Census. This 10-year pattern of related outliers corresponds to people born between April 2, 1945, and April 1, 1946—roughly the last 12 months before the start of the baby boom era—though it is unclear why the DA estimates and census results fail to match better for this age.
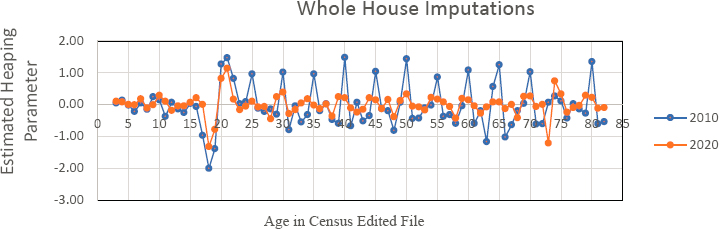
Figure 3.5 is an age heaping graph for whole-household imputations in 2010 and 2020. The blue line illustrates consistent heaping in 2010 for all multiples of 5, from age 25 through age 70. In contrast, there is scant evidence of heaping in 2020, perhaps because of using a donor pool for the imputations that was chosen to mirror the age distribution without heaping, although the actual reason is unknown.
3.4 AGE HEAPING BY RESPONSE MODE
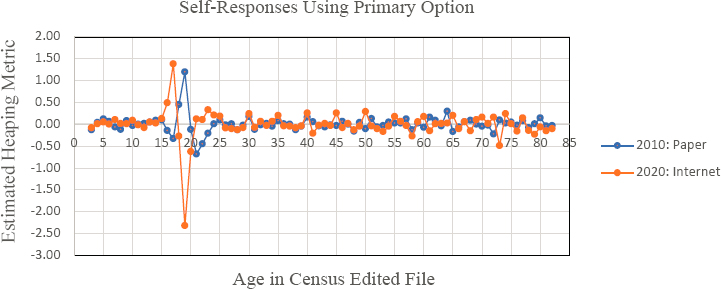
Table 3.3 presents MWI values for 2010 and 2020, broken out by response mode. Self-responses in both censuses exhibited modest amounts of age heaping. For example, Figure 3.6 shows results for the primary Self-Response options, paper in 2010 and internet in 2020, using the ĥa metric. While there are
SOURCE: Calculations by the panel from Census Bureau tabulations from the 2020 Census Edited File. See Disclosure Review Statement; CBDRB-FY23-0180.
SOURCE: Calculations by the panel from Census Bureau tabulations from the 2020 Census Edited File. See Disclosure Review Statement; CBDRB-FY23-0180.
| Census/Response Mode | 2010 | 2020 | ||||
|---|---|---|---|---|---|---|
| Population | MWI | Population | MWI | |||
| Millions | Percent | Millions | Percent | |||
| Census Total | 308.7 | 100.0 | 0.56 | 331.4 | 100.0 | 1.48 |
| Self-Response | ||||||
| Internet | N.A. | N.A. | N.A. | 201.6 | 60.8 | 0.36 |
| Paper | 214.2 | 69.4 | 0.21 | 39.2 | 11.8 | 0.28 |
| Telephone | 17.5 | 5.7 | 0.29 | 9.2 | 2.8 | 0.57 |
| Nonresponse Followup | ||||||
| Household Respondent | 59.7 | 19.3 | 0.77 | 38.9 | 11.7 | 3.16 |
| Proxy Respondent | 11.9 | 3.9 | 5.52 | 14.1 | 4.3 | 17.44 |
| Administrative Recordsa | N.A. | N.A. | N.A. | 10.1 | 3.0 | 0.22 |
| Other Enumeration | 5.3 | 1.7 | 0.86 | 18.4 | 5.6 | 0.16 |
a The 2020 row entries for administrative records are smaller than those in Table 3.2 because this table includes administrative records enumerations only, whereas Table 3.2 includes administrative records enumerations plus other types of enumerations in which administrative records were used to assign age (see Box 3.2).
NOTES: MWI, modified Whipple’s index; N.A., not applicable. Population values include all ages. MWI values use data for reported ages 23–62 only. The “Other Enumeration” category is a catch-all category, which is not comparable across censuses. Major operations in this category include Group Quarters Enumeration, Military Enumeration, Remote Alaska Enumeration, and Enumeration of Transitory Locations (e.g., camps for people experiencing homelessness).
SOURCE: Calculations by the panel from Census Bureau tabulations from the 2020 Census Edited File. See Disclosure Review Statement; CBDRB-FY23-0180.
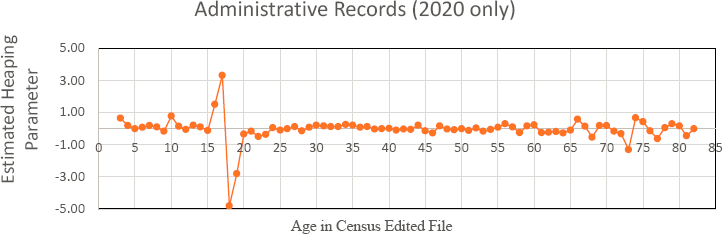
consistent peaks at all multiples of 5 from 25–70 years of age for 2020 and from 25–40 years of age for 2010, none of the estimated heaping metrics exceed 0.25.5 The large swing between ages 17 and 18 for 2020 is due to an abrupt drop going from age 17–18 in the number of enumerations by self-response. Similarly, the age heaping graph for administrative records in 2020 (Figure 3.7) exhibits virtually no evidence of age heaping.
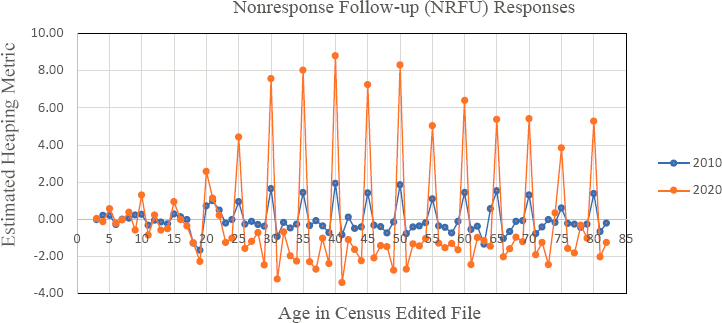
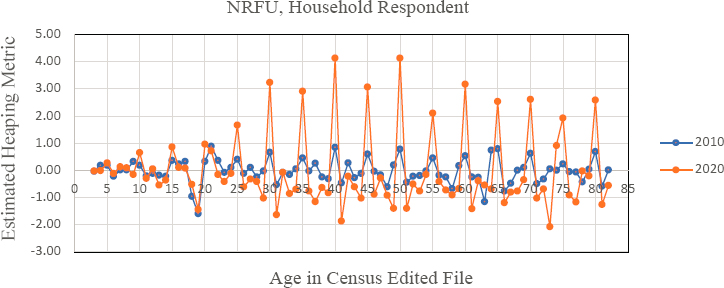
In contrast, there is strong evidence of heaping for responses obtained from NRFU (Figure 3.8). While there are peaks at almost every multiple of five in each census, the 2020 peaks tower over those for 2010, often by a factor of about three-to-one. As might be expected, there are big differences between the results for household and proxy respondents during NRFU. Comparison of the relevant rows of Table 3.3 as well as Figures 3.9 (household member NRFU
___________________
5 Data on self-response by paper in 2020 (not shown) follow the same pattern as self-response by internet—that is, consistent peaks at all multiples of 5 from ages 25–70 and low values of the ĥa metric.
SOURCE: Calculations by the panel from Census Bureau tabulations from the 2020 Census Edited File. See Disclosure Review Statement; CBDRB-FY23-0180.
SOURCE: Calculations by the panel from Census Bureau tabulations from the 2020 Census Edited File. See Disclosure Review Statement; CBDRB-FY23-0180.
SOURCE: Calculations by the panel from Census Bureau tabulations from the 2020 Census Edited File. See Disclosure Review Statement; CBDRB-FY23-0180.
respondents) and 3.10 (proxy NRFU respondents) indicate that there is at least five times the rate of heaping by proxy respondents as by household members during NRFU.6 Note, however, the different scales in the various figures: Figure 3.6 (−3 to +2), 3.7 (−5 to +5), 3.8 (−4 to +10), 3.9 (−3 to +5), and 3.10 (−10 to +25).
3.5 AGE HEAPING—CONCLUSION
Conclusion 3.1: Age heaping (excess responses of ages ending in 0 or 5) is a well-recognized indicator of data quality in censuses. Age heaping was much more prevalent in the 2020 Census than in 2010, by an estimated factor of at least 2.5 for ages between 23 and 62 years, for which heaping is most common. This increase was almost completely due to increases in the rate of heaping during Nonresponse Followup (NRFU)—especially from proxy respondents but also from NRFU household respondents. Age heaping was rare in both censuses for self-responses, whether by paper or internet (in 2020 only), and there was no evidence of age heaping associated with administrative records.
___________________
6 Despite constituting only 4% of the full census, data not shown indicate that NRFU proxy responses contributed an estimated 55% of the heaped ages in the 23–62 year range in 2020, while household member NRFU responses contributed another 26%.
SOURCE: Calculations by the panel from Census Bureau tabulations from the 2020 Census Edited File. See Disclosure Review Statement; CBDRB-FY23-0180.
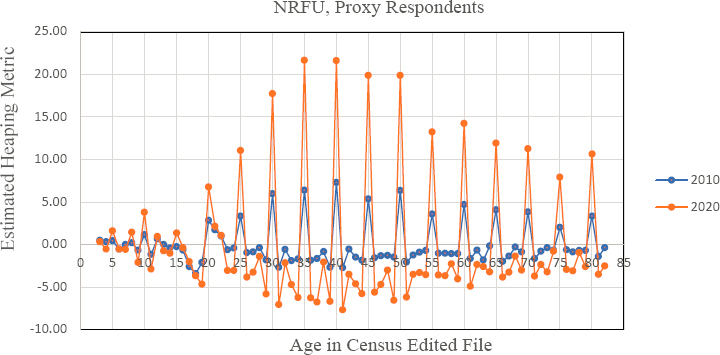
SOURCE: Calculations by the panel from Census Bureau tabulations from the 2020 Census Edited File. See Disclosure Review Statement; CBDRB-FY23-0180.
The increase in age heaping raises concerns about the accuracy of age data collected in 2020. Some analyses, notably projections of pre-K–12 school enrollment, require accuracy for single-year-of-age distributions for the relevant age range. Other analyses require accuracy for specific ages—for example, numbers of people reaching or projected to reach key retirement ages, such as age 62 for early Social Security benefits or age 65 for Medicare eligibility. Age heaping could bias such analyses substantially.
In our view, data users should be aware of the increased heaping in the 2020 Census and consider either smoothing reported distributions or analyzing data for 5-year bins, for example. Age heaping appears to be rare for children, so it should not greatly affect planning for public schools or calculation of disease and mortality rates for this population. However, other errors may be consequential for these uses, including the large net undercount for young children ages 0–4 (see Figure 4.1 in Chapter 4), high imputation rates for age and date of birth for enumerations obtained in NRFU (see Figure 3.11), and error introduced by the new disclosure avoidance methods for the 2020 Census (see Chapter 11). Analysis by the Census Bureau of the likely combined errors for young children ages 0–4 and older children ages 5–9 and 10–17 would be helpful for important uses of the data.
Looking toward 2030, it would be imprudent to assume that the excessive age heaping in the 2020 NRFU operation, particularly in proxy responses, was due solely to the COVID-19 pandemic and not also to such factors as distrust of government, which may persist or grow worse over time.7 To better understand and prepare for possible age heaping in the 2030 Census, it would be useful for the Census Bureau to extend the analysis in this chapter. For example, the Census Bureau could calculate age heaping metrics for cross-classifications of age reporting (see Table 3.2) and response mode (see Table 3.3) for substate geographic areas and race and ethnic groups. Similarly, the Census Bureau could stratify the populations in Table 3.4 by the degree of enumeration difficulty (e.g., the Low Response Score in the Planning Database).8
___________________
7 According to Pew Research Center (2022), the American public’s trust in “the government to do what is right just about always/most of the time” has averaged around 20% since the beginning of the Obama administration (dropping from a prior high of about 45% at the start of the George W. Bush administration). The 2020 Census Barriers, Attitudes, and Motivators survey and focus groups, conducted in 2018, found the chief barrier to census participation was lack of understanding of its purpose which, in turn, was associated with apathy, privacy concerns, fear of repercussions, and general distrust of government. Low levels of education, being young, and being a person of color related to low levels of intent to self-respond. See McGeeney et al. (2019).
8 See https://www.census.gov/topics/research/guidance/planning-databases.html; the Planning Database is a Census Bureau product that, in previous years, conveniently combines census tract- and block group-level variables from the decennial census (including operational data such as Self-Response rates) as well as deriving some new metrics such as a Low Response Score (previously, a Hard-to-Count Score). The 2021 and 2022 vintages of the Planning Database have not yet included information from the 2020 Census because of the delays in generating 2020 data products.
3.6 DATA QUALITY IN THE NONRESPONSE FOLLOWUP OPERATION
Perhaps of more importance than the effects of the increase in age heaping on uses of age data from the 2020 Census is what age heaping suggests about the quality of census data for other characteristics and on census coverage itself. Age heaping occurs when a respondent either does not know a subject’s exact age or decides it is quicker or easier to give an approximate age. If the reason for age heaping were ignorance of age information, it seems likely that respondent knowledge would also be lacking about other characteristics, including Census Day residence; when age heaping results from a drive to complete the interview as quickly as possible, that could negatively affect all the information collected. It is easy to imagine fraught-with-tension interviewing amidst the COVID-19 pandemic resulting in responses that were as curt and quick as possible.
The evidence indicates that NRFU responses, particularly from proxies, are of poorer quality than self-responses and that their quality was generally worse in 2020 than in 2010. Age heaping, item nonresponse and imputation, and coverage errors tell a similar story. Evidence presented above shows that age heaping is concentrated in NRFU and particularly in proxy responses, and that the extent of age heaping in 2020 was several times that of 2010 and 2000.
Regarding coverage, following a recommendation from the National Research Council (2004a:8–9), the 2010 PES looked at components of coverage error for census operations to help uncover operational factors that might contribute to overcount or undercount of areas and population groups. The 2020 PES followed suit. Table 3.4 shows percentages of correct enumerations, duplicates, other erroneous enumerations, and whole-person imputations for various operations accounting for over 99% of the 2020 Census count. Note that correct enumerations include cases that matched the PES and cases that did not match but were determined to be correct in the census. Also shown is the percentage of total household enumerations contributed by each operation. No estimates are provided for people included in the PES who were omitted from the census, although estimates could be developed for omissions in census households in which at least one person matched a person in a PES household (see Section 4.3).
Table 3.4 shows that NRFU responses obtained from a household member not the head or from a proxy respondent had fewer correct enumerations and more whole-person imputations than all other enumeration modes, including NRFU enumerations from the household head. In fact, NRFU enumerations from the household head were more complete than internet and telephone responses from people who did not have the ID provided to them in Census Bureau mailings.
Regarding item nonresponse, evidence in operational metrics released by the Census Bureau for the nation as a whole and for individual states shows that
| Coverage Error Component/Census Operation | % Operation of Enumerations in Households | Four columns add across to 100% of each operation | |||
|---|---|---|---|---|---|
| Correct Enumerations | Duplicate Enumerations | Other Erroneous Enumerations | Whole-Person Imputations | ||
| Census Total | 100.0 | 94.4 | 1.6 | 0.6 | 3.4 |
| Self-Response | |||||
| Internet and Telephone ID Response | 55.6 | 96.9 | 0.9 | 0.4 | 3.4 |
| Internet and Telephone Non-ID Response | 9.4 | 91.6 | 2.3 | 0.6 | 5.6 |
| Paper-based Response | 11.6 | 97.1 | 1.3 | 0.6 | 1.6 |
| Nonresponse Followup (NRFU) | |||||
| NRFU Head of Household | 9.7 | 94.0 | 3.3 | 0.8 | 1.8 |
| NRFU Other Household Member | 2.9 | 76.6 | 2.2 | 0.5 | 22.7 |
| NRFU Proxy | 4.7 | 87.4 | 3.7 | 1.8 | 7.0 |
| Administrative Records | 3.1 | 94.5 | 4.3 | 1.3 | — |
| Update Leave/Update Enumerate | 2.0 | 91.7 | 4.0 | 0.6 | 3.6 |
| Count Imputations | 0.6 | — | — | — | 100.0 |
NOTES: The estimates in this table are drawn from various tables in the source document; the categories are not necessarily exhaustive or mutually exclusive. In particular, the Update Leave/Update Enumerate category estimates represent those types of enumeration areas—the Update Leave responses consequently overlap with internet, paper, and NRFU responses. All estimates are statistically significantly different from 0 at the 10% level. (Whole-person imputations are a census count and do not have associated sampling error.)
SOURCE: Hill et al. (2022:Appendix Tables 7, 9, 10).
NOTES: DOB, date of birth; NRFU, Nonresponse Followup. Item nonresponse rates refer to missing responses; item imputation rates (see, e.g., Table 10.5) are usually higher because they include cases in which responses had to be blanked and imputed; denominators for percentages are people in occupied units providing the designated type of response (e.g., self-response).
SOURCE: Plotted from 2020 Census Operational Quality Metrics Release 3, Table 2 (U.S. Census Bureau, 2021c).
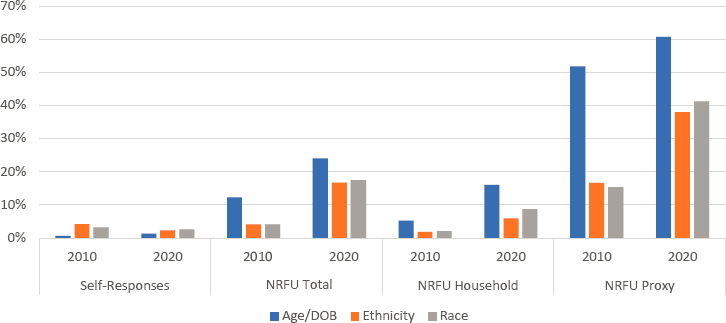
item nonresponse rates are higher in NRFU, particularly in proxy responses, and that the extent of item nonresponse was higher in 2020 than in 2010 (see Figure 3.11, which shows item nonresponse rates for age/DOB, race, and ethnicity).9
Conclusion 3.2: Findings about age heaping raise concerns about the overall quality of data collected during 2020 Nonresponse Followup (NRFU), especially from proxy respondents but even from some household members. Other quality indicators, including item nonresponse rates, numbers of people requiring imputation of all characteristics, and coverage errors, reinforce the difficulties of obtaining accurate data in NRFU and indicate that the difficulties increased in 2020 compared with 2010. The greater extent of quality problems in NRFU in 2020 compared with 2010 may be attributable to the COVID-19 pandemic (including the resulting delay in the NRFU schedule), but other factors
___________________
9 Administrative records used in nonresponse enumeration in 2020 had missing data rates of 3.5% for age/DOB, 28.3% for ethnicity, and 18.1% for race.
might also be involved, which would need to be addressed in 2030 Census planning.
This page intentionally left blank.


