Potential Hydrodynamic Impacts of Offshore Wind Energy on Nantucket Shoals Regional Ecology: An Evaluation from Wind to Whales (2024)
Chapter: 2 Oceanography in Nantucket Shoals
2
Oceanography in Nantucket Shoals
GENERAL DESCRIPTION
The area identified by the Bureau of Ocean Energy Management (BOEM) as the Nantucket Shoals region is coterminous with the Massachusetts and Rhode Island wind energy areas (WEAs) (Figure 1.1). Strictly speaking, none of the WEAs overlap the actual Nantucket Shoals, but the Massachusetts WEA is referred to as the WEA southwest of Nantucket Shoals and the Rhode Island WEA is referred to as the Cox’s Ledge WEA.
The combined WEA begins roughly 20 km south of Martha’s Vineyard and 24 km southwest of Nantucket. From its northern boundary, the area extends 133 km southward to approximately the 60-m depth contour and has an east–west extent of approximately 106 km. The WEA is approximately 3,673 km2 (907,728 acres) and contains nine wind farm projects (Table 2.1; Figure 1.1). The Massachusetts WEA is located within 40- to 60-m depths southwest of Nantucket Shoals, while the Rhode Island WEA is generally located in 20- to 60-m depths surrounding Cox’s Ledge (Figure 1.1).
Physical characteristics of the turbines to be constructed for each project are variable (Table 2.2). Overall, a maximum of 700 turbines are planned for the seven projects in active development. Turbine spacing in the project area will be an approximately 1-NM (1.85-km) grid with turbine hub heights between 101 and 214 m, and rotor diameters between 150 and 300 m.
Two projects are currently in the construction phase in U.S. federal waters. Vineyard Wind 1 (OCS-A-0501) was the first offshore wind farm to be approved for construction (July 15, 2021). The project will consist of 62 turbines (800 MW). Energy will be transported via an export cable running through the Muskeget Channel (Figure 1.1) and Nantucket Sound, which will connect to the Massachusetts shore at Covell’s Beach. Construction of the project began in June 2023 and is expected to be fully operational in summer–fall 2024.
TABLE 2.1 Descriptive Characteristics of the Rhode Island and Massachusetts Wind Energy Areas
| Characteristic | RI WEAa | MA WEAa |
|---|---|---|
| Distance from coast | 9.5 NM south of Newport, RI; 12.5 NM east of Block Island, RI; 10.5 NM southwest of Martha’s Vineyard, MA | 12 NM south of Martha’s Vineyard, MA; 12.5 NM southwest of Nantucket, MA; 24 NM southeast of Block Island, RI |
| Total geographic area (acres; km2) | 164,750; 667 | 742,978; 3,007 |
| Depth range (m) | 31–51 | 30–64 |
| Bottom type | Sand 35% | Sand 90% |
| Gravel 60% | Gravel 5% | |
| Sand/silt/clay 5% | Sand/silt/clay 5% | |
| Bathymetric features | Cox’s Ledge and RI Sound | Southwest of Nantucket Shoals |
| Projects in construction | South Fork, OCS-A-0517 | Vineyard Wind I, OCS-A-0501 |
| Projects in review | Revolution Wind, OCS-A-0486 | South Coast Wind, OCS-A-0521 |
| Sunrise Wind, OCS-A-0487 | Park City Wind/Vineyard Wind South, OCS-A-0534 | |
| Beacon Wind, OCS-A-0500 | ||
| Projects in early stages of development | Bay State Wind, OCS-A-0520 | |
| Vineyard Northeast, OCS-A-0522 | ||
NOTE: MA= Massachusetts; NM = nautical mile; RI = Rhode Island WEA = wind energy area.
a Projects have undergone name changes during development; the project name is given with the BOEM lease area designation, showen in Figure 1.1, are given.
A second project, South Fork Wind (OCS-A-0517), was approved for construction on November 1, 2021, which will include 12 turbines (132 MW) exporting energy to East Hampton, New York. Construction of the project began in June 2023 and is expected to be operational by summer 2024.
In 2021, BOEM submitted four notices of intent to prepare environmental impact statements for the following projects: Revolution Wind (OCS-A-0486), Park City Wind/Vineyard Wind South (OCS-A-0534), Sunrise Wind (OCS-A-0487), and South Coast Wind/Mayflower Wind (OCS-A-0521). Two additional projects, Beacon Wind (OCS-A-0502) and Bay State Wind (OCS-A-0500), have received site assessment plan approval for site characterization; however, little activity has occurred.
PHYSICAL OCEANOGRAPHY
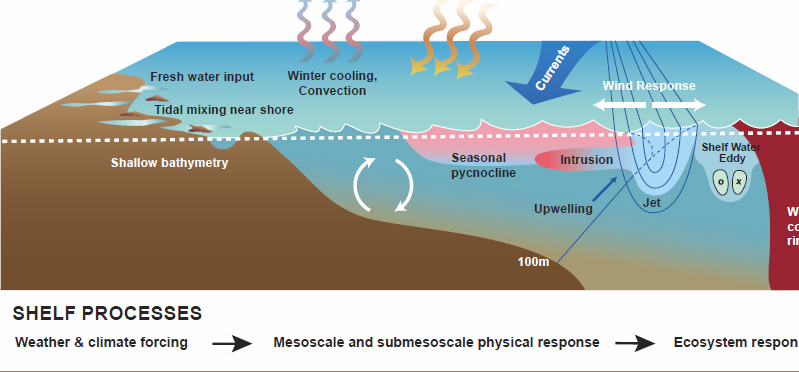
The physical oceanography of the Nantucket Shoals region is influenced by a variety of shelf processes, including winds, waves, currents, tides, temperature, and stratification (Figure 2.1). The oceanography of the Nantucket Shoals region has also
TABLE 2.2 Physical Characteristics of Wind Farm Projects in the Rhode Island and Massachusetts Wind Farm Areas
| Project Name and BOEM Lease Number | Turbines (number) | Hub Height (m) | Rotor Diameter (m) | Tower design: Type, Blade Diameter (m), Array Spacing (NM) |
|---|---|---|---|---|
| Vineyard Wind I OCS-A-0501 | 62, actual | 109-144 | 163-222 | Monopile, 10, 1 |
| South Fork Wind OCS-A-0517 | 12, actual | 101–144 | 150–224 | Monopile, 11, 1 |
| Revolution Wind OCS-A-0486 | ≤100 | 115–156 | 164–200 | Monopile,12, UA |
| Park City Wind/Vineyard Wind South OCS-A-0534 | ≤130 | 214 | 285 | Monopile or piled jacket, 12, 1 |
| Sunrise Wind OCS-A-0487 | ≤94 | 140 | 200 | Monopile, 12, 1 |
| South Coast Wind/Mayflower Wind OCS-A-0521 | ≤149 | 128–184 | 220–280 | Piled jackets, suction bucket jackets, monopiles, 12, 1 |
| Beacon Wind OCS-A-0502 | ≤155 | 180 | 300 | Piled jackets, suction bucket jackets, monopiles, 13, 1 |
| Vineyard Northeast OCS-A-0522 | UA | UA | UA | UA |
| Bay State Wind OCS-A-0500 | UA | UA | UA | UA |
NOTES: All statistics are from the Construction and Operations Plan for a given project, except for those indicated as “actual.” Projects have undergone name changes during their development; the project name and BOEM lease area, shown in Figure 1.1, are given. UA = unavailable at this time because the project is in early development.
NOTES: All statistics are from the Construction and Operations Plan for a given project, except for those indicated as “actual.” Projects have undergone name changes during their development; the project name and BOEM lease area, shown in Figure 1.1, are given. UA = unavailable at this time because the project is in early development.
undergone significant changes that have been documented since about 2000, particularly since 2010-2011 when both surface and bottom temperatures increased significantly.
Winds
The wind pattern over the Mid-Atlantic Bight1 (MAB) is characterized by a spatially varying mean northwest wind with significant temporal variability that in the Nantucket Shoals region is larger than the mean (Roarty et al., 2020). Scales of variability range
___________________
1 The Mid-Atlantic Bight (MAB) is a coastal region extending from Cape Hatteras to the south and Cape Cod to the north. Southern New England is a subregion at the northern end of the MAB from the eastern end of Long Island to Georges Bank. Nantucket Shoals is at the extreme northern end of the MAB and SNE.
from longer seasonal scales to individual storm events. During summer months, there are predominantly alongshore southwesterly winds, which change to cross-shelf winds from the northwest during winter. During the fall and spring transition seasons, alongshore winds are from the northeast and the southwest.
The alongshore summer winds are correlated with cross-shelf transport over most of the mid to outer MAB shelf. In winter, the correlation between the northeast alongshore winds and the cross-shore currents is small, with the dominant correlation of cross-shore currents being with cross-shore winds. Alongshore currents over the inner portion of the MAB shelf are correlated with alongshore winds, and this correlation extends over much of the shelf during the fall and spring transitions (Schofield et al., 2008).
The seasonal wind patterns over the Nantucket Shoals region are similar. Northwesterly winds dominate during the winter months and shift from northwest winds to southwest winds in March. Winds from the southwest are frequent from April through September, with transition to northwesterly winds in October and November (Wood et al., 2014).
Monthly mean surface wind speeds in the region range from 4.1 m/s (8.0 kts) in July to about 8.7 m/s (16.9 kts) in January, reflecting the increase to stronger winter winds. Higher winds speeds are associated with storms and extreme events, such as the 64-m/s (124-kts) winds associated with Hurricane Gloria in 1979 (NOAA NDBC, 2017; Epsilon Associates, 2019, 2020).
Currents
The physical oceanography characteristics of the Nantucket Shoals region are representative of tidal and subtidal flows associated with an inner- to middle-shelf domain. There is a general pattern of stronger tidal velocities over Nantucket Shoals that decrease
to the west with shelf flows of 20 cm/s that increase to 100 cm/s near inlets (Stevenson et al., 2004). There are likely to be differences in the monthly bottom stress along the southern New England inner shelf as the tidal currents decrease substantially from east to west (Moody et al., 1984; Shearman and Lentz, 2004). He and Wilkin (2006) used data assimilative models to spatially map tides across the Nantucket Shoals region and surrounding areas and identified regions with a higher occurrence of tidal mixed fronts, driven by underlying bathymetry and tidal current magnitude. Ullman and Cornillon (1999) used satellite sea surface temperature data to map the thermal signature of these fronts that separate colder water inshore of the front from warmer surface waters offshore. Their frontal climatology in the Nantucket Shoals region identified tidal mixed fronts that occur ~10–20 km inshore of the 50-m isobath in the summer stratified season.
Coastal radar measurements of surface currents and high-resolution numerical models indicate that these tidal currents likely contribute to subtidal variability in the along-shelf currents and dynamics (Ganju et al., 2011; Kirincich et al., 2013).
The subtidal currents in the Nantucket Shoals region are broadly influenced by a cold current flowing from Gulf of Maine southwestward along the coast (Figure 2.2), generally following the bathymetry at speeds of 5–10 cm/s at the surface and less than 2 cm/s near the seafloor (Shearman and Lentz, 2003). This slow southwestward flow through the middle shelf is interrupted by warm core rings or meanders from the Gulf
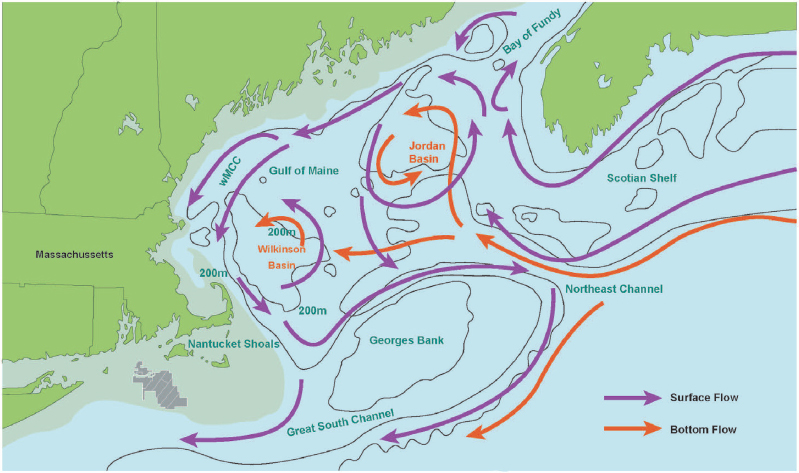
Stream and onshore deflections of the shelf-break front. Most of the variance in the depth average of the along-shelf current, including the annual cycle and at least one-half of the month-to-month and year-to-year variability about the annual cycle, can be attributed to the along-shelf wind stress (Lentz, 2022). Fluctuations in the along-shelf wind stress relative to local tides accounts for most of the variance (Kirincich et al., 2013; Lentz, 2022). Monthly to annual variations of this mean flow range from approximately 2 cm/s to 7 cm/s without a significant trend or obvious multiyear variability. Interrupting these mostly along-shelf flows are storm-driven wind events and shelf-break exchange processes that can cause significant variations in flow, such as the eddy off the southern coast of Martha’s Vineyard (Kirincich et al., 2013) and another counterclockwise gyre farther to the west of Nantucket Shoals located to the southeast of Martha’s Vineyard (Ganju et al., 2011).
Hydrography
The hydrography of the Nantucket Shoals region is primarily influenced by the cooler and fresher source waters north of the region and the warmer and saltier waters sourced offshore from Gulf Stream warm core rings, and slope seawaters beyond the shelf-break jet (Figure 2.1). Sea surface temperatures (SSTs) in the Nantucket Shoals region vary widely between seasons, ranging from a minimum of 0°C to 3°C during February–March and a maximum of 20°C to 22°C during August–September (Fewings and Lentz, 2011). Much of the SST variability results from the intrusion of the colder waters from the northeast balanced by seasonal warming. During the winter months (especially February through March), the temperature over the shelf in the Nantucket Shoals region becomes nearly uniform, seemingly due to enhanced vertical mixing caused by storm-induced turbulence and convective overturning at the surface. As summer progresses (August–September), the thermocline deepens to almost 40 m, and the waters with temperatures lower than 10°C significantly decrease in size. During June–July, the cold pool stretches from the southern flank of Georges Bank southwest to the MAB (Beardsley and Flagg, 1976; Houghton et al., 1982). As defined by the 10°C isotherm, the cold pool extends over the MAB shelf to the 90-m isobath underlying warmer surface waters, but generally does not reach the Nantucket Shoals region. Analysis of 11 years (2003–2013) of repeat temperature and salinity sections during early summer (June–July) from across the New England shelf break (inshore of the 100-m isobath) south of Cape Cod found that surface waters are warming by 0.26°C/yr (Harden et al., 2020). In addition to the general freshening of surface salinity in the region, the frequency and complexity of mid-water salt intrusions from the shelf break north across the shelf have increased (Gawarkiewicz et al., 2022). Moored and vessel-based observations show an increase in the northward extent of these intrusions across the shelf as evidenced by vertical profiles that show multiple occurrences of intrusions relative to a salinity climatology for the region (Lentz, 2003). The extension of these intrusions into shallower water and the increase in the number of intrusions contribute to the complexity of the vertical structure of seasonal stratification in the region between the surface mixed layer and the cold pool. The mixed-layer depth (MLD) reaches a
minimum in July or August (7.9 ± 2.7 m). Convective overturning in late fall (October–November) restores the shelf waters to a vertically well-mixed state (38.3 ± 9.5 m; Cai et al., 2021). From 1993 to 2018 the MLD has shown a significant increase in both winter (+0.46 m/yr) and summer (+0.11 m/yr) (Cai et al., 2021).
Waves
Wave conditions in the Nantucket Shoals region can be described as persistent southeasterly swell from the North Atlantic Ocean combined with local multidirectional wind-driven waves. The mean significant wave height at the Nantucket Shoals weather monitoring buoy ranged from about 1.0 m in July to 2.4 m during December–January. Extreme wave conditions are associated with extreme storms such as the passage of hurricanes and nor’easters. A maximum significant wave height of up to 11.5 m was measured during the passage of Hurricane Floyd in September 1999, while the maximum wave period of 15.9 seconds occurred in February 2004 (NOAA NDBC, 2017; Epsilon Associates, 2019, 2020).
Tides
Tidal currents contribute to variability of continental-shelf circulation and mixing of shelf waters. Along the MAB, the New England shelf is relatively minimum in tidal amplitude. However, observations show that the barotropic and baroclinic tidal variability of this shelf region is complex, with the barotropic semidiurnal (M2) tide accounting for most of the current variability (Shearman and Lentz, 2004). The M2 tidal elevations decrease toward the northeast to a minimum of about 34 cm over Nantucket Shoals (Shearman and Lentz, 2004). The amplitudes of the barotropic tidal current increase toward the northeast, reaching a maximum of about 35 cm/s over Nantucket Shoals (Shearman and Lentz, 2004). The complex bathymetry of Nantucket Shoals may result in some influence on tidal variability on the New England shelf through the development of an along-isobath M2 pressure gradient (Shearman and Lentz, 2004). Kirincich et al. (2013), using a high-resolution, high-frequency coastal radar system combined with SST and in situ observations, found maximum M2 tidal velocities that increased from 5 to 35 cm/s across the inner shelf south of Martha’s Vineyard. Analysis of the observations showed that tidal stresses were the dominant control in determining the spatial variability of the along- and across-shelf flows.
A modeling study of tides on the New England shelf showed that the tidal amplitude decreased from 0.4 m offshore of Martha’s Vineyard to about 0.1 m over Nantucket Shoals, rapidly increasing to about 1 m northward toward the Gulf of Maine (He and Wilkin, 2006). This change in tidal amplitude, indicative of a significant along-isobath pressure gradient, is consistent with observations (He and Wilkin, 2006). The modeling study reproduced the observed tidal elevation minimum on Nantucket Shoals and noted that this is a transition region between the MAB to the west and the semidiurnally amplified Gulf of Maine to the northeast (He and Wilkin, 2006). The strongest M2 tidal currents of 1.5 m/s were found in Muskeget Channel and southeast of Nantucket Island, with a rapid
decrease in tidal speed west of Nantucket Shoals (He and Wilkin, 2006). Tidal mixing was strongest over Nantucket Shoals, suggesting that tidally induced mixing is important in the formation of property fronts in this region (He and Wilkin, 2006). A subsequent combined model–data analysis showed that tidal rectification is the dominant formation mechanism for the summer circulation south of Martha’s Vineyard and identified the importance of the inner-shelf bathymetry for the tidal circulation (Ganju et al., 2011).
Regime Shifts and Extreme Events
The oceanography of the Nantucket Shoals region has undergone significant changes that have been documented since about 2000. Between 2004 and 2012 the cold pool exhibited a warming trend with temperatures more than 2°C warmer in 2012 than in 2004 (Harden et al., 2020). A significant warming event occurred in 2012 and after that, the bottom water remained warmer. Following 2012, the mean SST was about 1.0°C higher than the climatological SST mean averaged over 1982–2011 (Chen et al., 2021b), suggesting that a warming regime shift occurred. A result of this warming is increased buoyancy of surface water. There is also evidence of a transition during 2010–2011 when both surface and bottom temperatures increased significantly (Chen et al., 2014a; Friedland et al., 2020). This was followed by distinct ocean heat waves in 2012 and 2017 that have been attributed to atmospheric forcing and Gulf Stream warm core rings, respectively (Chen et al., 2014b; Gawarkiewicz et al., 2019). Gulf Stream meanders have moved progressively westward toward the MAB shelf, resulting in increasing frequency of the intrusion of warm core rings onto the shelf. These intrusions have moved farther inshore into the tidal mixed area (Gawarkiewicz et al., 2022). Up to 50 percent of the profiles now show intrusions in summer, and 70 percent of the intrusions occurred in proximity to warm core rings (Silver et al., 2023). As a result, the shelf-break front is moving farther inshore. Seasonal stratification is thus changing and extending further into the fall. Effects on the spring season are unclear.
Summary of Physical Oceanography
The nine wind farm projects planned for the Nantucket Shoals region are in an inner- to mid-shelf region that has historically been characterized by significant southwestward currents and strong seasonal stratification of the water column from June through September with waters well mixed the remainder of the year. This stratification is moderated by significant tidal mixing around the actual Nantucket Shoals and south of Martha’s Vineyard with tidal effects declining to the west. Advection is driven by the westward coastal currents along the shelf with transport from both the Gulf of Maine through the Great South Channel and over Nantucket Shoals, and over the mid-shelf by transport from Georges Bank. The mean bottom flow is offshore.
Major oceanographic changes have occurred in the region since 2000, including warming of surface and bottom temperatures and increased frequency of intrusion of Gulf Stream warm core rings inshore into the tidal mixed area. Temperature warming has implications for the onset, decay, and intensity of seasonal stratification. Gulf
Stream warm core ring intrusions affect the location of the shelf-break front, which appears to be moving inshore. These changes are affecting the oceanography of the region, but the long-term trends and consequences remain to be determined.
BIOLOGICAL OCEANOGRAPHY
Primary Production
Spatial time series from the MAB have documented cross-shore transport of large winter phytoplankton blooms driven by northwest winds, with the offshore extent of these blooms occurring inshore of the 100-m isobath. In the spring, the onset of stratification supports phytoplankton blooms in the deeper waters of the MAB continental shelf that are then advected alongshore by alongshore winds. During the summer months, when the shelf is highly stratified, primary production is low except in nearshore waters, where coastal upwelling occurs. The autumn seasonal productivity largely reflects the timing of shelf stratification breakdown (Schofield et al., 2008).
The effect of ocean warming on trends in phytoplankton productivity from 1997 to 2020 in the Gulf of Maine, Georges Bank, and the MAB was analyzed by Friedland et al. (2023). This analysis showed little phenological shift associated with spring thermal conditions in any of the regions. The autumn–winter bloom was the dominant seasonal bloom and was detected in 16 of 23 years, but no trend was found in bloom start date or duration. The bloom start date and duration also showed no trend over the 23 years, except for the Georges Bank region which showed significant changes in the onset of the autumn bloom (33 days later) and bloom duration (2.5 weeks shorter).
Secondary Production
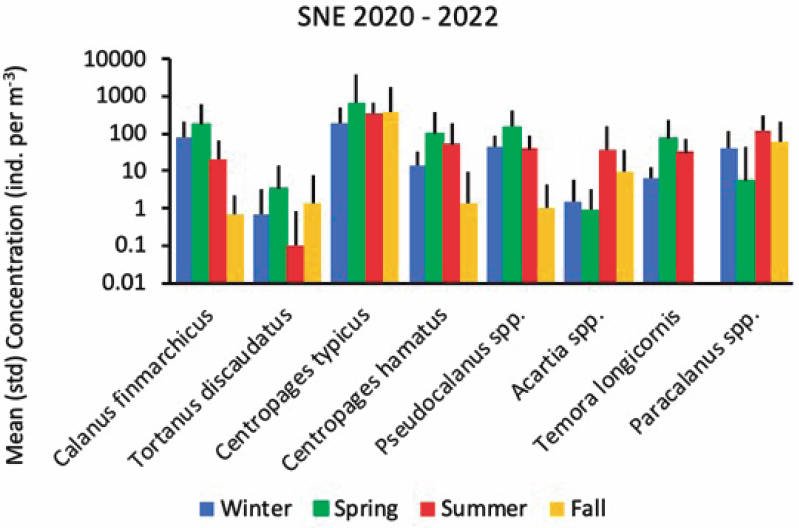
The zooplankton community in the Nantucket Shoals region is not well characterized, particularly compared to the communities associated with the Gulf of Maine and Georges Bank. The series of focused studies by National Oceanic and Atmospheric Administration’s (NOAA’s) Northeast Fisheries Science Center (NEFSC) since 2020 provide limited information on the distribution and abundance of zooplankton in the Nantucket Shoals region. Sampling during 2020–2021 identified eight copepod species that were primarily found in the Nantucket Shoals region (Figure 2.3). The highest concentrations of copepods during winter–spring were Centropages spp., Pseudocalanus spp., and Calanus finmarchicus, and during summer–fall were Centropages spp., and Paraocalanus spp. Oithona similis was also collected. These results align with long-term NEFSC surveys in the Nantucket Shoals region that suggest increasing zooplankton diversity that has been attributed to increased abundance of several taxa and stable or declining dominance of other taxa (NMFS, 2023).
A May-June 2021 survey in the Nantucket Shoals region that used surface tows (focused in upper 1 m) found Oithona similis to be the most abundant copepod in the region (Turner and Weig, 2023). Few C. finmarchicus copepodites and no adults were found, possibly because the C5-C6 C. finmarchicus were deeper at this time.
The spatial distribution of zooplankton throughout the Nantucket Shoals region is variable. Tidal mixing over the Nantucket Shoals region, described above, would likely moderate the formation of persistent vertical layers of zooplankton that have been observed in areas such as Cape Cod Bay. However, interannual and seasonal variation in sightings of foraging right whales south of Martha’s Vineyard have been observed by Leiter et al. (2017) and a wintertime “hotspot” was identified within the western area of the Nantucket Shoals region where a counterclockwise gyre or tidal mixing front is located off the southeastern shore (e.g., Ganju et al., 2011; Brink, 2016; Brink and Seo, 2016). This suggests that the abundance of Calanus (especially C5) may be high outside of the eastern areas of the Nantucket Shoals region.
Seasonal variation in abundance and energy content is associated with zooplankton development and life cycle (Miller et al., 2000; Michaud and Taggart, 2007; Plourde et al., 2019; Lehoux et al., 2020). The life cycle of Calanus spp. is a progression from an egg stage through six naupliar and finally to six copepodite stages (Figure 2.4), each of which is characterized by variability in abundance and energy content. The older copepodites (e.g., C5) may enter diapause and descend to depth as an overwintering strategy. Copepodites, in their active phase, feed on phytoplankton and microzooplankton (Ohman and Runge, 1994) to accumulate energy needed during and immediately after diapause (Hirche, 1996). Diapause (e.g., stage C5 Calanus) is associated with the storage of lipids required to meet energy demands and subsequent
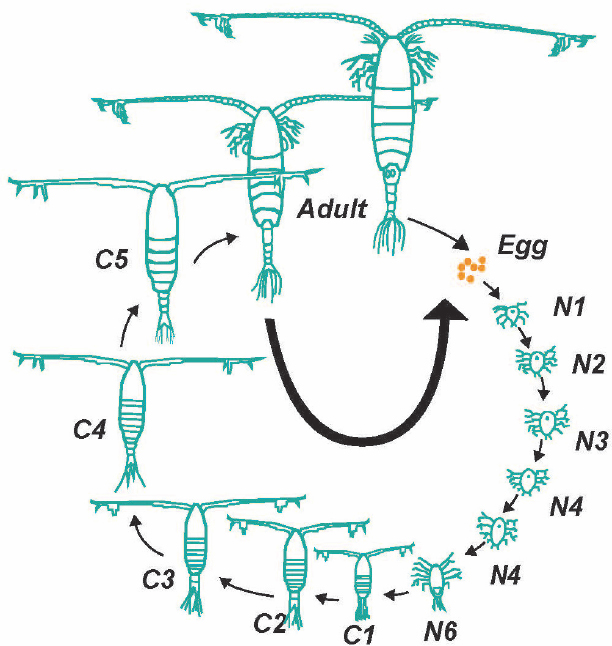
migration to deep water, with the maximum depth of C5 and adult stages generally restricted by the depth of the continental shelf (Krumhansl et al., 2018).
Higher Trophic Levels
Higher-trophic-level species reliant on zooplankton for food, such as right whales, may also be affected by the presence of wind farms. Right whale–focused surveys conducted during 2011–2019 have consistently found right whales from Nantucket Shoals westward through the Massachusetts and Rhode Island WEAs. Their presence has increased in all seasons (Quintana-Rizzo et al., 2021). Southern New England is not a new habitat for right whales; this reflects a return to historically important areas in southern New England shelf waters known to have been a whaling ground (O’Brien et al., 2022). This increased presence relates to the region as an important foraging area for right whales either in response to a decline in prey in abandoned feeding areas or as
a result of the abundance of prey increasing within the Nantucket Shoals region. The Nantucket Shoals region is also part of the right whales’ migratory corridor between summer feeding grounds in the north and calving areas in southern U.S. waters.
North Atlantic right whales feed exclusively on small, energy-rich zooplankton, and in particular, copepods, such as C. finmarchicus, in New England waters. Successful foraging depends on copepods being found in sufficient densities and at appropriate depths, and as such right whales will be sensitive to disturbances of their prey in the water column (Gavrilchuk et al., 2021; Sorochan et al., 2021).
Although C. finmarchicus is traditionally considered the primary prey of right whales, these whales may be supplementing their diet during winter–spring with other zooplankton (e.g., Centropages spp.) found in greater concentrations. This may account for the great numbers of right whales observed feeding in the Nantucket Shoals region.
Though the focus of this study is on the right whale, other higher trophic species may also be sensitive to hydrodynamic changes caused by offshore wind development in this region. The environmental assessments for the Massachusetts/Rhode Island WEAs (BOEM, 2012, 2014) and environmental impact statements for Vineyard Wind (BOEM, 2018) and South Coast/Mayflower Wind (BOEM, 2023) provide extensive detail on distributions, abundance, and exposure risk of higher-trophic-level species. Summaries of potentially affected fish, invertebrate, seabird, sea turtle, and marine mammal species are included in Appendixes C–E. Suggested impacts, other than hydrological effects, during construction and/or installation, operations and/or maintenance, and decommissioning of offshore wind developments could include those caused by habitat disturbance through the presence of structures and cables, noise, vessel traffic, and potential associated discharges and debris. Benefits of the projects may accrue from increased biological productivity after turbines are installed owing to reef effects and fish aggregation around the towers (BOEM, 2018, 2023).
Summary of Biological Oceanography
In the spring, phytoplankton blooms occur in the deeper waters of the continental shelf of the MAB due to the onset of stratification. During the summer months, primary productivity is low, and the shelf is strongly stratified. The productivity of the autumn bloom largely reflects the timing of the breakdown of shelf stratification. The autumn–winter bloom is the dominant seasonal bloom.
Zooplankton forage on the phytoplankton produced in these seasonal blooms. Recent surveys in the Nantucket Shoals region suggest that there are significant seasonal shifts in the abundance and composition of the zooplankton community. The highest concentrations of copepods during winter–spring are of Centropages typicus, Pseudoccalanus spp., and C. finmarchicus, and during summer–fall are C. typicus and Paracalanus spp. The sources of these copepods include advection from the east and local production.
Most higher-trophic-level species associated with the Nantucket Shoals region feed either directly or indirectly (i.e., by preying on species that feed on the zooplankton) on zooplankton found in the region. Large cetaceans and seabirds are particularly
associated with dense concentrations of zooplankton. C. finmarchicus is a primary prey of North Atlantic right whales, and these concentrations of Calanus as well as other zooplankton species during winter–spring may account for the great numbers of right whales observed feeding in the Nantucket Shoals region and other areas of high productivity in southern New England. Given the high energetic demands of right whales, dense concentrations of copepods are important for successful foraging.
This page intentionally left blank.


