A Research Agenda Toward Atmospheric Methane Removal (2024)
Chapter: 2 Challenges in Addressing Methane Emissions
2
Challenges in Addressing Methane Emissions
Global surface temperatures have risen by 1.1°C relative to preindustrial times, predominantly due to anthropogenic greenhouse gas (GHG) emissions (IPCC, 2021). Methane (CH4) emissions from human activities have contributed 0.5°C (very likely confidence range of 0.29–0.84°C) to current warming (IPCC, 2021). Methane has a short lifetime in the atmosphere of 9–12 years and is more than 80 times more potent than carbon dioxide (CO2) at trapping heat over a 20-year period (IPCC, 2021). Because more than 90 percent of the methane emitted in a pulse will degrade in the atmosphere to CO2 over 40 years, using the 100-year time horizon typically used for climate assessments and planning (i.e., the 100-year global warming potential [GWP], a metric used to quantify the radiative impact of GHGs relative to CO2) underestimates the climate impact of methane (e.g., Cohen-Shields et al., 2023).
Chapter 1 introduced the importance and urgency of reducing methane emissions in the near term to achieve global goals to limit warming. This chapter provides additional context on the current opportunities and challenges for addressing methane emissions through mitigation actions and current policy to inform the question of why atmospheric methane removal might be needed (see Chapter 3). This chapter first discusses the major sources, sinks, and trends in atmospheric methane; then considers currently available methane emissions mitigation options and interventions available beyond mitigation; and finally concludes by outlining the current landscape of policies that seek to address methane emissions and carbon removals.
METHANE SOURCES, SINKS, AND TRENDS
To better understand the opportunities and challenges for addressing methane emissions through mitigation today, this section provides a brief overview of the major sources of methane emissions; the loss processes, or “sinks,” of methane in the
atmosphere; chemical feedback processes that are relevant to decision making around methane emissions mitigation; and a summary of recent trends in atmospheric methane concentrations. With this context, the following section outlines the current state of methane emissions mitigation.
Methane Sources
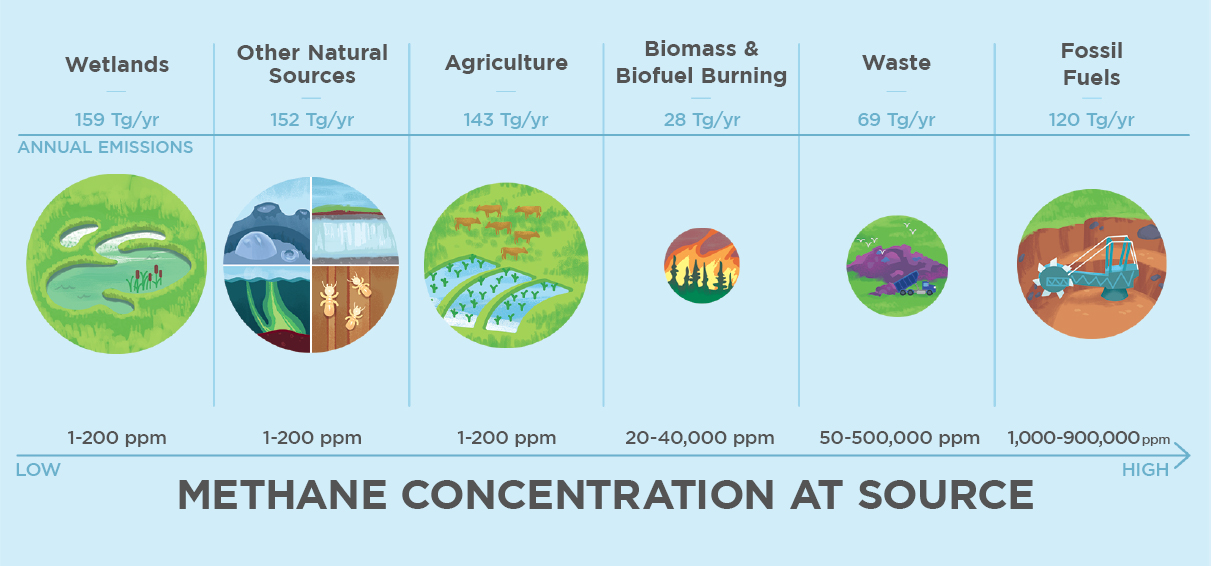
Current atmospheric concentrations of methane have exceeded 1.9 parts per million (ppm) (Lan et al., 2024) (see Box 2-1)—more than 2.5 times preindustrial average concentrations of ~0.75 ppm (IPCC, 2021). According to the latest global methane budget, global methane emissions from 2010 to 2019 are estimated to be 669 (512–849) teragrams (Tg) CH4 yr−1,1 of which approximately 60 percent are from anthropogenic sources (Saunois et al., 2024). The major anthropogenic sources of methane emissions are fossil fuels (from the exploitation, transportation, and usage of coal, oil, and natural gas), agriculture (from livestock and rice cultivation), and waste (from landfills and wastewater), for which emissions mitigation technologies are currently available (see following section). Of the roughly 40 percent of methane emissions that come from natural sources—for which emissions mitigation technologies are not currently available—the largest source is wetlands, with additional natural sources from freshwater systems, wildfire/biomass burning, and geologic sources, among others (see Figure 2-1). The large uncertainties in both the magnitude of these sources and their trends over time have been well documented (e.g., Kirschke et al., 2013; Saunois et al., 2017, 2020, 2024; Turner et al., 2019). Each source category has a wide range of uncertainties due to sparse activity data, limited emissions measurements, and limitations in models (NASEM, 2018); natural emissions—particularly from wetlands and inland freshwaters, which are the largest natural sources—are the most uncertain, compared to anthropogenic sources (Saunois et al., 2024).
Methane Sinks
Once emitted from a source, methane is chemically reactive in the atmosphere and will be transformed via a loss process or “sink.” The primary sink for atmospheric methane is oxidation to CO2 by hydroxyl radicals (OH) in the troposphere (lowest region of the atmosphere, from the surface to 8–14 km in height), accounting for about 90 percent of the sink (Saunois et al., 2024). Other important removal processes are uptake by methanotrophic bacteria in aerated soils, oxidation in the stratosphere by atomic oxygen and chlorine radicals, and oxidation in the marine boundary layer by chlorine (Cl) released from sea salt. The global methane budget for 2010–2019 reported climatological loss rates based on five chemistry climate models of 563 (510–663) Tg CH4 yr-1 from tropospheric OH oxidation (~90% of total sink), 33 (11–43) Tg CH4 yr-1 from stratospheric loss (~5%), 6 (1–13) Tg CH4 yr-1 from tropospheric reaction
___________________
1Parenthetical uncertainties from Saunois et al. (2024) are reported as the (min-max) range of reported studies, calculated while discarding outliers.
BOX 2-1
Methane Concentrations and Metrics
In this report, the concentration of methane in air is described using units of parts per million (ppm) or parts per billion (i.e., the fractional amount of methane in the air multiplied by 106 or 109, respectively). These units typically are associated with mole or mass fractions, whereas concentrations are more typically associated with units of mole per volume. In the context of this report, concentration and mole fraction are used interchangeably, which is appropriate due to the context of the gases (namely, methane and air) considered in the discussion. Specifically, the concentration of methane in the atmosphere is proportional to the mole fraction of methane in the air via the ideal gas law and other thermodynamic assumptions.
For typical atmospheric conditions and for a methane mole fraction in the air of 2 ppm, the concentration of methane in the air is 8.2 × 10⁻⁵ mol m-3. This concentration also provides the upper bound for the amount (e.g., total moles or total mass) of methane that can be removed from 1 m3 volume of air.
When considering methane sources and sinks and atmospheric methane removal technologies, it is also important to consider the rate at which methane is being released into or removed from the atmosphere. For many atmospheric methane removal technologies, the removal is based on the flow of gases. Hence, the appropriate units for such processes are either mass flow rate, m·, with SI units of [kg/s]; mole flow rate, n·, with SI units of [mol/s]; or volumetric flow rate, V·, with SI units of [m3/s]. The rate at which the air is processed to remove methane, the effectiveness of the atmospheric methane removal technology, and the time of operation provide the total amount of methane removed (in units of kg or mol).
with Cl (~1%), and 31 (18–40) Tg CH4 yr-1 from soil uptake (~5%) (Saunois et al., 2024). Uncertainties in the total methane sink are 20–40 percent based on atmospheric chemistry models and 10–20 percent based on atmospheric proxy methods (Saunois et al., 2016). The sections below briefly discuss the major processes comprising the methane sink.
Methane Oxidation in the Troposphere
OH is the primary oxidant in the troposphere and reacts with many volatile organic compounds (VOCs), including methane. Methane is the lowest oxidation state of carbon, and the reaction of OH with methane initiates a cascade of reactions that successively oxidizes carbon from methane to intermediate compounds (such as carbon monoxide [CO]), and ultimately to CO2 (Jacob, 1999). A simplified representation of
this oxidation mechanism originally proposed by Prather (1994) is the CH4-CO-OH system:
| CH4 + OH → multiple steps → CO + products | (1) |
| CO + OH → multiple steps → CO2 + products | (2) |
| OH + X → products | (3) |
where X represents all other compounds that are oxidized by OH. The methane oxidation mechanism is well understood and was recently mapped by the Atmospheric Tomography Mission airborne field campaign (Guo et al., 2023). Observations and modeling studies show that most methane oxidation occurs in the lower troposphere due to the strong temperature dependence of the methane plus OH kinetic reaction rate, limiting where methane oxidation can occur (e.g., Guo et al., 2023; Zhao et al., 2019).
OH is not directly emitted to the atmosphere; rather, it is produced in the atmosphere through the photolysis—breaking chemical bonds using photons—of ozone in the presence of water vapor. Studies characterizing global mean OH (e.g., Holmes et al., 2013; Murray et al., 2014; Turner et al., 2018) relate OH abundance to four major factors: ozone photolysis frequency, specific humidity, sources of reactive nitrogen (i.e., NOx ≡ NO + NO2; nitrogen oxides [NOx], nitric oxide [NO], nitrogen dioxide [NO2]), and sources of reactive carbon (i.e., methane, CO, or VOCs). Increasing the sources of reactive carbon—or hydrogen—results in less OH because OH is consumed as it oxidizes this reactive carbon and hydrogen. In the context of atmospheric methane, an important takeaway from this relationship is that global mean OH burden is inversely related to the magnitude methane emissions (see later section, Methane Chemical Feedback).
All four major factors controlling global mean OH may be influenced by changes in climate or human activities. Stratospheric ozone levels continue to recover due to actions taken by countries under the Montreal Protocol, which will lead to less ozone photolysis and less OH. Climate change will increase humidity because a warmer air-mass holds more water vapor, resulting in more OH. The sources of reactive nitrogen, reactive carbon, and hydrogen—key air pollutants and GHGs—strongly depend on human activities.
Oxidation by Cl in the marine boundary layer also makes a small contribution to the methane sink in the troposphere. The magnitude of this sink, which is currently based on constraints from isotopic observations and modeling studies, is uncertain (e.g., Allan et al., 2007; Gromov et al., 2018; Hossaini et al., 2016; Platt et al., 2004; Wang et al., 2019). The 13C isotopic signature of methane is sensitive to tropospheric Cl (Strode et al., 2020), which is relevant to constraining the methane budget based on isotopic observations and modeling.
Biologic Methane Sink
Methanotrophs are microbes that are widespread in nature and generally found in environments where methane and water are present (e.g., wetlands, lakes, soils).
Methanotrophs metabolize methane as their carbon and energy source and are a sink for atmospheric methane. Methanotrophs in unsaturated oxic soils remove roughly 18–40 Tg CH4 yr-1 (Saunois et al., 2024). The magnitude of the methane sink in soils is affected by soil moisture, soil temperature, pH, and microbial communities, which are also affected negatively by nitrogen deposition (approximately 4% global reduction with nitrogen input) (Murguia-Flores et al., 2018) and nitrogen fertilization (Bodelier, 2011; Mosier et al., 1991, 1997).
In contrast, methanogens are archaea that produce methane as an end product of the degradation of biomass, generally in the absence of oxygen. Methanogens are common in wetlands and the digestive tracts of ruminants—two of the largest methane sources.
In addition to soils, methanogens and methanotrophs are also present in other forest components including tree stems, bark, and foliage (H. Feng et al., 2022; Gauci et al., 2024; Jeffrey et al., 2021; Putkinen et al., 2021) For example, some recent measurements have shown in situ uptake of methane by tree foliage in upland forests (Gauci et al., 2024; Gorgolewski et al., 2023). Previous estimates of methane fluxes from forests may not have captured the heterogeneity between soils and trees, which has obscured estimates of methane uptake on branches and leaves. Measurements of tree surfaces in free-draining upland environments show that methane uptake increases with tree height and could account for a total forest uptake of roughly 24.6–49.9 Tg CH4 yr-1 globally (Gauci et al., 2024), which is on the scale of the total sink from soil uptake (Saunois et al., 2024). Other measurements have shown that some tree types may be sources of methane (Covey et al., 2012; Covey & Megonigal, 2019), indicating large uncertainties in the source-sink dynamics of forests in the methane budget.
Grasslands can also be methane sinks, though fewer measurements of their methane uptake are available. Changes in land management and the cultivation of grasslands can change their ability to uptake methane. For example, nitrogen-fertilized and cultivated grassland conversion to cropland has been shown to decrease methane uptake (Mosier et al., 1991, 1997), although fertilization would also be expected to increase nitrous oxide emissions. The U.S. Department of Agriculture (USDA) Grassland Conservation Reserve Program (CRP)2 incentivizes agricultural producers to conserve grasslands. While CRP lands have been shown to variably outlast the period of incentivized payment (Sullins et al., 2021), conversion of CRP lands to agriculture is predicted to result in carbon deficits (including for methane) (Gelfand et al., 2011).
Methane Chemical Feedback
Methane’s “atmospheric lifetime” refers to how long it takes all sinks to remove a molecule completely from the atmosphere on average. Following this, the lifetime is formally defined as the total atmospheric burden divided by the sum of the removal rates. The methane lifetime (τ) attributable to oxidation by OH can be defined as
___________________
2See https://www.fsa.usda.gov/programs-and-services/conservation-programs/crp-grasslands/index.
| (4) |
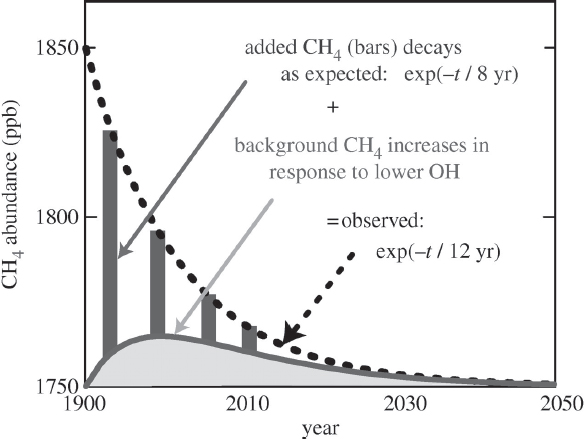
If methane emissions increase, methane will have a longer lifetime in the atmosphere. Conversely, if methane emissions decrease, methane will have a shorter lifetime in the atmosphere. This is because global mean OH concentrations depend on the sources of reactive carbon—including methane—meaning that methane concentrations feed back on methane’s atmospheric lifetime. Prather (1994, 2007) elegantly showed these feedbacks using the simple chemical mechanism (equations (1)–(3)) presented previously. Figure 2-2 summarizes how methane feeds back on its lifetime by destroying OH. If OH levels were invariant to changes in methane, then a perturbation of methane would decay exponentially with an e-folding lifetime of 8–9 years. In practice, we observe that perturbations of methane decay with an e-folding perturbation lifetime of ~12 years due to the OH feedback. From a policy perspective, this makes mitigating methane emissions particularly attractive because reducing methane emissions shortens methane’s lifetime in the atmosphere.
This methane mitigation “bonus” is illustrated in Figure 2-3. Reducing methane emissions from 600 Tg CH4 yr-1 to 400 Tg CH4 yr-1 over a 40-year period results in a rapid reduction in atmospheric methane concentration through the combination of reduced emissions (top panel) and decreased atmospheric lifetime due to an increase in OH availability (middle panel). In this example, reducing total methane emissions by
SOURCE: Prather (2007).
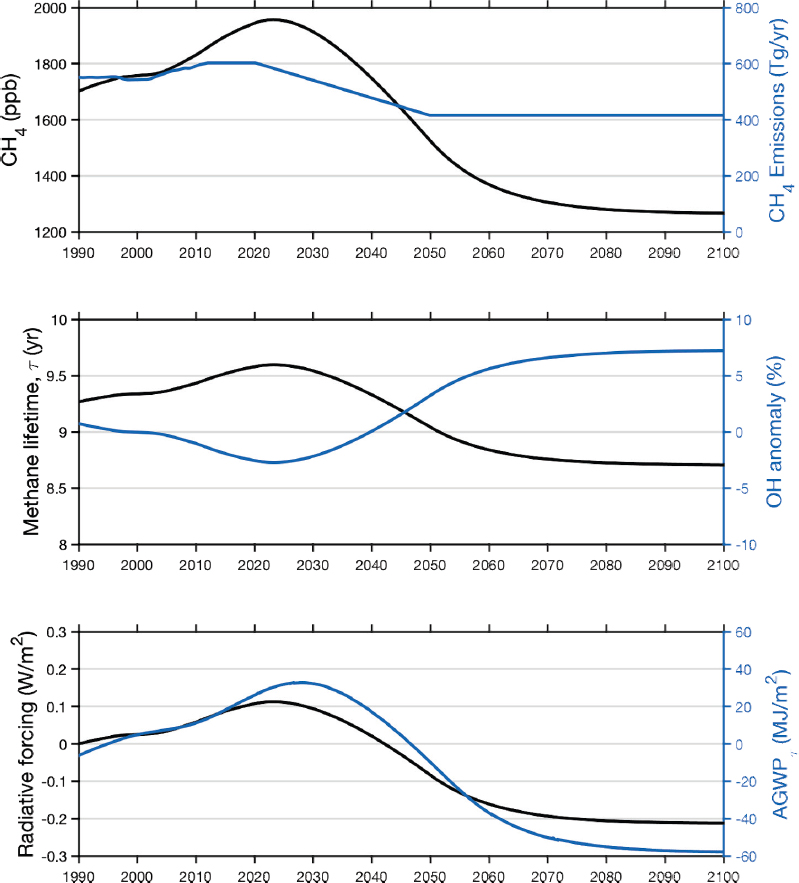
one-third results in shifting from methane emissions contributing to net warming (radiative forcing) to a net cooling effect, relative to 1990, within 20 years (bottom panel). This example illustrates why mitigation of methane emissions is the first, fastest, and largest-scale opportunity to reduce atmospheric methane concentration. Furthermore, methane removal should never be considered as a substitute for methane mitigation as any delay in methane mitigation for later removal would effectively add an indirect penalty through this OH feedback on methane lifetime.
Methane Trends
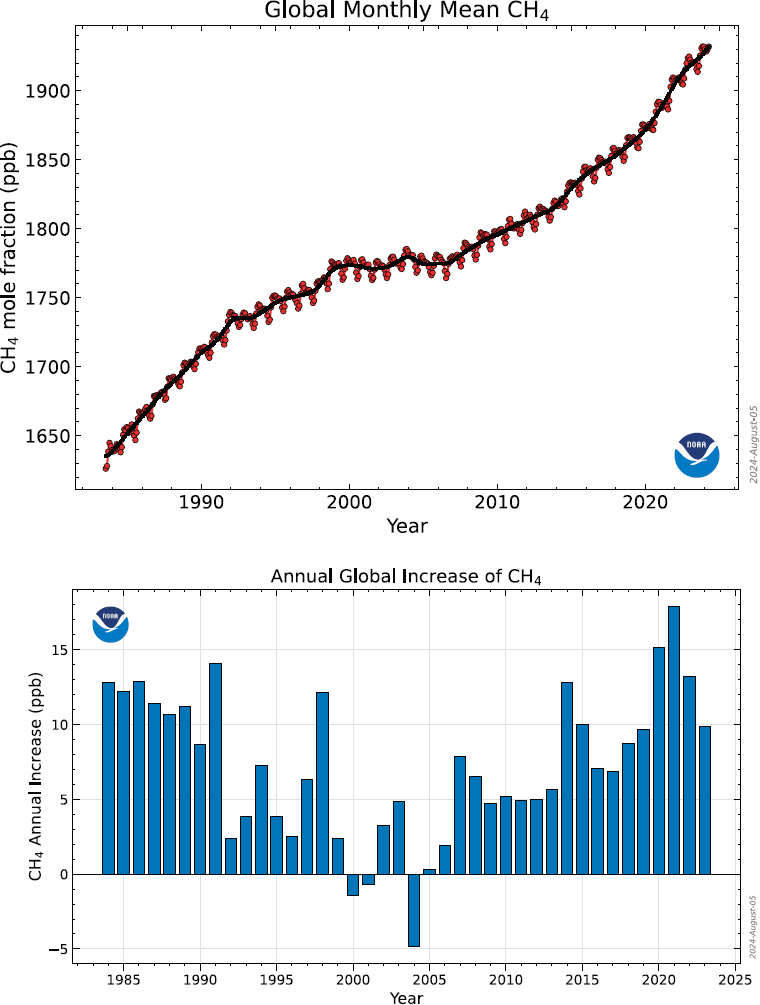
Trends in the abundance of atmospheric methane are driven by an imbalance between the sources and sinks. Historical long-term trends in methane are driven by increasing anthropogenic emissions; however, short-term trends and interannual variability are strongly influenced by biogenic emissions, and the role of changes in the methane sink over different timescales is uncertain (Skeie et al., 2023; Stevenson et al., 2020). Over the past several decades, the annual atmospheric growth rate of methane globally has varied substantially (see Figure 2-4). Methane concentrations rose steadily during the 1980s (when atmospheric measurements began) and 1990s, stabilized from 2000 to 2006, and abruptly renewed growth from 2007 to 2023. Since 2020, the growth rate has accelerated compared with 2007–2019, and isotopic measurements of methane suggest that this accelerated growth may be due primarily to biogenic sources (e.g., wetlands, enteric fermentation) (Jackson et al., 2020; Nisbet et al., 2023; Zhang et al., 2017, 2023). Growth rates of methane also vary year-to-year latitudinally, and while the growth in methane has been global since 2007, the largest growth has been in the tropics and subtropics (Nisbet et al., 2023).
As introduced above, OH is the primary sink for atmospheric methane, making its abundance relevant to understanding observed trends in methane. Trends in OH are relatively uncertain and rely on modeling approaches rather than direct measurements because the lifetime of OH in the atmosphere is on the order of seconds. The most recent global methane budget for 2010–2019 reported the annual methane removal rate of 521 Tg CH4 yr-1 (±2 %) from top-down estimates and 602 Tg CH4 yr-1 (uncertainty of 21 percent) from bottom-up estimates (Saunois et al., 2024). Model intercomparisons and studies of recent OH trends between 2000–2016 and 2010–2018 show no discernable trend, meaning that emissions (rather than the sinks) are responsible for the growth of methane concentrations (Zhang et al., 2021; Zhao et al., 2019). Modeling by Stevenson et al. (2020) showed that OH trends remained stable from 1850 to 1980, with a 9 percent increase in the troposphere in 2014 mainly due to anthropogenic emissions (increases in NOx and decreases in CO). Most models show a decrease in OH in 2005 while Stevenson et al. (2020) show a continued increase, though this increase still falls within the wide uncertainty range estimated by previous models.
Large uncertainties in OH and NOx impact the chemistry-climate models used to derive estimates of methane emissions (model time range from 1850 to 2100) (Murray et al., 2021); for example, uncertainties in the global methane budget are likely underestimated (model time range from 1750 to 2019) (Zhao et al., 2023). Most global models
SOURCE: Lan et al. (2024).
overestimate OH concentrations (e.g., Naik et al., 2013; Nicely et al., 2020; Travis et al., 2020), and observations suggest that ultraviolet absorption of water vapor in the troposphere together with halogen chemistry in models could help reconcile these differences (Prather & Zhu, 2024). Satellite observations of the photochemical drivers of OH can also improve understanding of OH trends (e.g., Duncan et al., 2024; Penn et al., 2024; Souri et al., 2024).
While global methane emissions from agriculture, particularly from enteric fermentation, have increased due to increasing ruminant populations (Ripple et al., 2021), the growth in emissions may not explain the recent surge (Nisbet et al., 2023). Tropical and subtropical wetlands may be responding strongly to climate change, including through changes in meteorology and climate patterns (e.g., El Niño-Southern Oscillation [ENSO], Indian Ocean Dipole [IOD]). Recent measurements of tropical wetlands show large methane fluxes that may be underestimated in methane budgets and models (e.g., France et al., 2022; Shaw et al., 2022).
The largest increase in the methane growth rate occurred in 2021 (18 parts per billion yr-1) (Lan et al., 2024). Some modeling studies suggest a feedback in which COVID-19 lockdowns reduced emissions of air pollutants that decreased OH concentrations, leading to a longer methane lifetime that drove warming and increased methane emissions from wetlands (Laughner et al., 2021; Peng et al., 2022). Additional studies have attributed the growth rate predominantly to increasing methane emissions in the tropics with a smaller contribution from decreases in OH (Feng et al., 2023; Qu et al., 2022). Key knowledge gaps in the wetland-climate feedback remain including its mechanism, spatiotemporal trends from observations, and management options (Poulter, 2023). As temperatures continue to rise, this positive wetland feedback may extend from the tropics to boreal and Arctic regions, where organic carbon stored in permafrost (frozen soils) is vulnerable to thaw (Biskaborn et al., 2019; Smith et al., 2022; see Chapter 3). The persistent high atmospheric growth rate of methane in 2022 and 2023 may indicate a combination of continued growth in anthropogenic emissions together with increased methane emissions from natural sources such as wetlands due to a positive feedback from rising temperatures (Shindell et al., 2024; Zhang et al., 2023).
Climate change is also expected to affect methane sinks. For example, methane oxidation by OH and Cl is sensitive to climate-induced changes to ENSO and IOD (Shaw et al., 2022). OH production and loss will be sensitive to climate change via temperature-dependent chemical reactions, weather-sensitive emissions of carbon and NOx (Fiore et al., 2024), changes in hydrology, and energy transition–driven changes in fossil fuel combustion NOx and hydrogen emissions. For the biological soil sink, the potential exists for negative feedbacks in areas such as wet grasslands and Arctic wetlands, where soils are becoming drier and ecosystem respiration is increasing with climate changes (Rafalska et al., 2023; Voigt et al., 2023).
METHANE EMISSIONS MITIGATION
The current trajectory of increasing global methane emissions is not consistent with policy scenarios that require large reductions in methane emission to limit warm-
ing to 1.5°C or 2°C (e.g., Shindell et al., 2024). The primary lever to address this gap is mitigation of anthropogenic methane emissions at the source (see Table 2-1), which can be more cost-effective than mitigating CO2 emissions (UNEP & CACC, 2021).
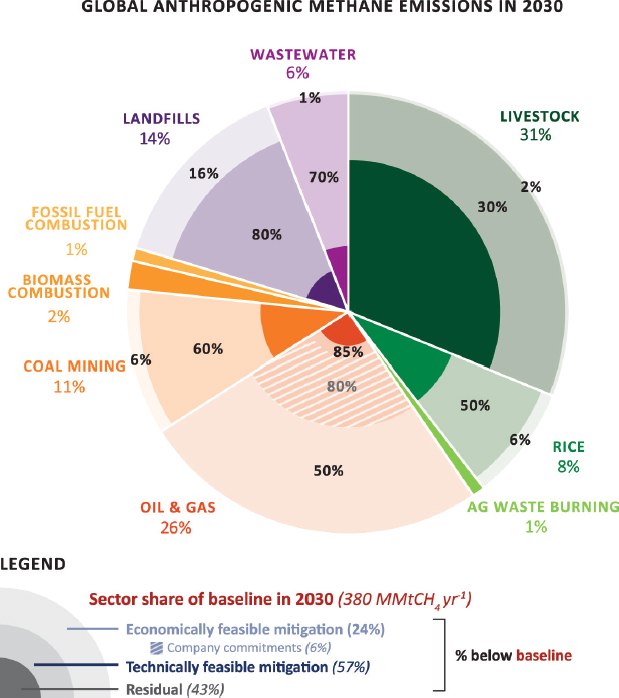
Figure 2-5 shows global anthropogenic methane emissions mitigation potential by 2030. Technically and economically feasible mitigation measures are available to reduce oil and gas, coal mining, and landfill emissions in 2030 by 60–85 percent relative to baseline emissions with no mitigation (Höglund-Isaksson et al., 2020). The Global Methane Assessment finds that by 2030, technically available mitigation measures could reduce methane emissions from the fossil fuel, agriculture, and waste sectors by ~180 Mt yr-1 (UNEP & CACC, 2021). New remote sensing tools are facilitating the detection of methane sources and leaks from fossil fuel point sources (e.g., Chulakadabba et al., 2023; Cusworth et al., 2022; Jacob et al., 2022; NASEM, 2022c; Thorpe et al., 2023). These observations together with advances in data and modeling tools (e.g., U.S. GHG Center,3 the United Nations Environment Programme’s [UNEP’s] International Methane Emissions Observatory [IMEO],4 the International Energy Agency’s Methane Tracker,5 Oil Climate Index,6 and CarbonMapper;7 see also Green et al., 2023; NASEM, 2022c;
TABLE 2-1 Examples of Technically Available Methane Mitigation Measures from Anthropogenic Sources
| Sector | Source Subsector | Mitigation Measure |
|---|---|---|
| Fossil Fuels | Oil and gas | Leak detection and repair |
| Oil and gas | Replacement of existing gas-powered devices with electric or air systems or lower-release versions | |
| Coal mines | Flooding of abandoned mines | |
| All | Fuel switching from fossil fuels to renewable energy | |
| Waste | Municipal solid waste | Energy recovery or collection and flaring or use of landfill gas |
| Industrial and municipal solid waste | Organic waste diversion from landfills | |
| Agriculture | Livestock | Feed changes, supplements, and breeding for improved genetics in ruminants |
| Manure | Treatment in biogas digesters | |
| Rice cultivation | Improved water management or alternate flooding/drainage of wetland rice | |
NOTE: Additional behavioral mitigation measures include changes in diet to reduce consumption of animal products as well as improvements in energy efficiency.
SOURCE: Adapted from UNEP and CACC (2021).
___________________
3See https://earth.gov/ghgcenter/data-catalog/emit-ch4plume-v1.
4See https://methanedata.unep.org/plumemap?mars=false.
5See https://www.iea.org/data-and-statistics/data-tools/methane-tracker-data-explorer.
Omara et al., 2023) have improved estimates of methane emissions from the major anthropogenic sources, which can aid mitigation efforts (see also Monitoring, Reporting, and Verification section). Other sectors, including livestock and rice, are more challenging to mitigate with currently available technologies; these sectors are projected to have residual emissions in 2030 (43 % residual emissions relative to baseline emissions for all sectors) (Ocko et al., 2021). Importantly, mitigation measures for natural methane sources are not currently available (see Chapter 3 use cases).
While many mitigation measures for anthropogenic methane sources are readily available, unlike CO2, anthropogenic methane emissions come mostly from smaller, distributed point sources, making many sectors “hard-to-abate.” For example, certain types of agricultural emissions, including from ruminants and rice paddies, pose challenges for emissions mitigation. The largest anthropogenic methane sources come from ruminants and their waste, which emit 112 (107–118) Tg CH4 yr-1 (Saunois et al., 2024). Abating ruminant emissions requires either using demand-side management (i.e., encouraging plant-focused dietary shifts that reduce global cattle numbers) or treating cattle individually (e.g., using such tools as wearable masks that destroy methane as a ruminant exhales, or feed additives or vaccines that reduce production of microbially derived methane in the rumen; see Roque et al., 2021). Rice paddies are responsible for 32 (25–37) Tg CH4 yr-1 (Saunois et al., 2024). Area-based methane sources (i.e., distributed over large areas) such as rice paddies dilute quickly to background (~2 ppm) methane concentrations, making their emissions challenging to mitigate at the source. For rice cultivation, abatement likely needs to occur through soil additives or changes in flooding practices during cultivation, such as intermittent drying (Jiang et al., 2019; UNEP & CCAC, 2021).
Methane-emitting sectors may also be hard-to-abate, not only because the methane emitted is at relatively low concentrations but also because the flow of methane is low or intermittent. For example, a study of seven coal mines in the Upper Silesian Coal Basin of Poland showed a five-fold variation in methane concentrations over the course of a month (Swolkień et al., 2022). Plans for abating methane emissions via mitigation (or removal) from different sectors therefore rely on the characteristics of both mass flow and methane concentration at a given site. Research is needed to better characterize these sources such that applications of methane mitigation or removal technologies can adequately be designed and implemented and to understand their potential as part of a broader climate response portfolio (see Chapter 6).
The speed at which methane emissions mitigation measures are implemented will be consequential for the global warming trajectory in the near and long terms. Achieving net-zero CO2 emissions is essential to stabilizing climate, but that alone may not be sufficient to limit warming to the Paris Agreement goal of “well under 2°C” with no or limited overshoot. The Intergovernmental Panel on Climate Change (IPCC) identified sustained methane mitigation as a policy that combines near- and short-term benefits to surface temperatures (IPCC, 2021; see also Chapter 1). A recent study assessed the geophysical potential for atmospheric methane removal to limit warming to 1.5°C under three mitigation scenarios, finding that even under the most ambitious mitigation scenarios, median methane removals of 60 Mt CH4 yr-1 could be needed by mid-century
SOURCE: Ocko et al. (2021).
(Smith & Mathison, 2024). Chapter 4 provides preliminary estimates of what it would take for each atmospheric methane removal approach to remove 1 Mt CH4 annually.
Relative to global-mean average warming rates of 0.4°C per decade from 2030 to 2050 in the absence of mitigation action, deployment of technically feasible methane mitigation measures could slow the rate of warming by 26 (24–30) percent, which would avoid 0.25°C (±0.04°C) of warming by 2050 (Ocko et al., 2021). Nzotungicimpaye et al. (2023) explored scenarios that delayed methane mitigation by 10 years and found that every decade of delay results in an additional peak warming of 0.1°C. Furthermore, modeling results showed that early methane mitigation reduces the strength of climate-CO2 feedbacks and has long-lasting climate benefits that extend well beyond the atmospheric lifetime of methane (Nzotungicimpaye et al., 2023).
At the same time, goals to reduce anthropogenic methane emissions face challenges driven by natural methane-climate feedback processes (e.g., amplified emissions from global wetlands, permafrost soils, and natural geologic sources), introduced above. Importantly, modeling of future emissions scenarios (e.g., IPCC and UNEP assessments) does not account for increasing natural methane emissions (Kleinen et al., 2021).
Conclusion 2.1: Together with reduced carbon dioxide emissions, rapid and sustained reductions in anthropogenic methane emissions are critical to limit warming in future decades. Atmospheric methane removal technologies, even if successfully developed, will not replace mitigation on timescales relevant to limiting peak warming this century.
- Atmospheric methane removal is not a substitute for methane mitigation as any delay in methane mitigation for later removal would effectively add an indirect penalty through the feedback of methane mitigation on the methane lifetime.
INTERVENTIONS BEYOND EMISSIONS MITIGATION
Chapter 1 briefly introduced GHG removals and their role in compensating for continued emissions to achieve emissions reduction goals and limit warming. Particularly since the IPCC’s Special Report on Global Warming of 1.5°C in 2018 (IPCC, 2018), commitments to achieve net-zero GHG emissions have proliferated, implying a major reliance on carbon dioxide removal (CDR) to achieve these targets. Figure 2-6 shows the widespread reliance on CDR by countries, localities, and companies in order to achieve their net-zero emission targets.
Under the United Nations Framework Convention on Climate Change (UNFCCC), countries self-report nationally determined contributions (NDCs), which outline how they will reduce their GHG emissions and adapt to the impacts of climate change. Parties will evaluate progress every 5 years through the Global Stocktake, the first of which took place at the 28th Conference of the Parties to the UNFCCC (COP28) in December 2023. The United States already includes CDR, particularly “nature-based solutions,” as part of its NDCs (Gallo et al., 2017; Krug, 2018; Silverman-Roati & Webb, 2024).
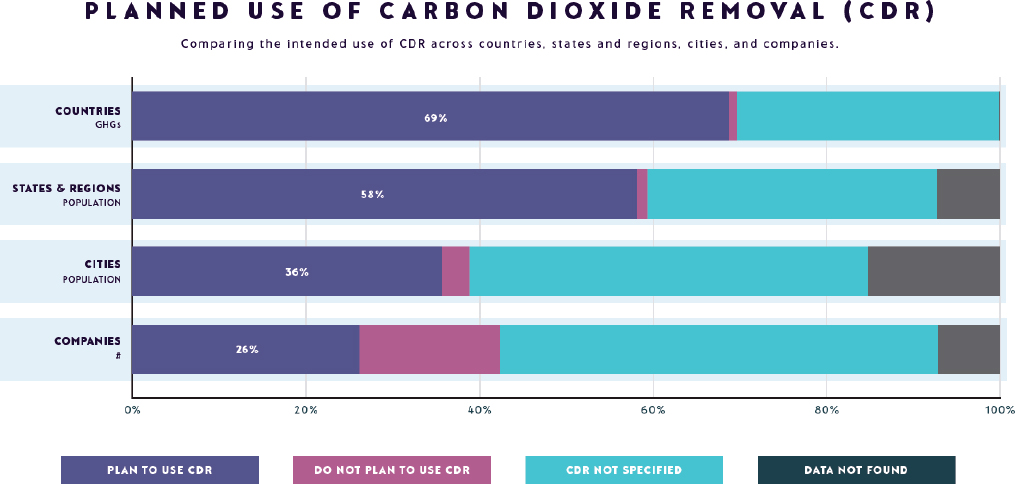
SOURCE: Net Zero Tracker (2023).
At COP28, parties called for “[a]ccelerating zero- and low-emission technologies, including . . . removal technologies.”8 However, recent work has illuminated that reliance on CDR may not be sufficient to address residual emissions (i.e., emissions regarded as hard-to-abate and that need to be compensated for via CDR) (e.g., Buck et al., 2023). Furthermore, Lamb et al. (2024) showed a CDR “gap” between national proposals for CDR and deployment scenarios needed to limit warming to 1.5°C. From an Earth systems point of view, Zickfeld et al. (2023) argue that CO2 emissions and removals are not in fact equivalent due to impermanent storage, land surface modifications, co-emissions of non-CO2 GHGs and other air pollutants, and nonlinear feedbacks.
Beyond GHG removal technologies, additional climate interventions have been considered to avoid the worst consequences of climate change. These interventions include solar geoengineering (also known as solar radiation modification [SRM]), which refers to strategies to moderate warming by increasing the amount of sunlight reflected back to space or reducing the trapping of outgoing thermal radiation (NASEM, 2021b). Importantly, unlike CDR or emissions mitigation, solar geoengineering would not reduce emissions but rather would temporarily mask the impacts of GHG emissions by reducing the amount of incoming sunlight or allowing more longwave radiation to escape the atmosphere through cloud thinning. Research suggests that while solar geoengineering has the potential to reduce surface temperatures and ameliorate some risks from climate, interventions could introduce new risks to the physical climate system and could impact global social and political systems in potentially unknowable ways (NASEM, 2021b).
Similarities and Differences between Greenhouse Gas Removal Approaches
CDR and atmospheric methane removal share some similarities (see Table 2-2), and much can be learned from CDR’s more well-established knowledge base. Both CDR and atmospheric methane removal have potential roles within the climate response portfolio in managing residual emissions and limiting a temperature overshoot. Additionally, both CDR and atmospheric methane removal face concerns regarding mitigation deterrence (see following section), along with the opportunity cost of allocating time and resources to GHG removals. Moreover, both may require substantial resource outlays, such as energy and land, amidst a landscape of competing resource priorities and require consideration of social impacts.
However, several unique attributes of methane, introduced in the sections above, and methane removal technologies (see Chapter 4) make CDR an imperfect analog (see Table 2-2). Research on atmospheric methane removal technologies is at an early stage, and significant research is needed to reduce the technological uncertainties and challenges posed by extremely dilute concentration of methane (~2 ppm) in the atmosphere. Chemically, CO2 is not as reactive as methane, which makes CDR primarily
___________________
8Outcome of the First Global Stocktake, Draft decision -/CMA.5, FCCC/PA/CMA/2023/L.17 (Dec. 13, 2023).
TABLE 2-2 Comparison of Carbon Dioxide Removal (CDR) and Atmospheric Methane Removal
| CDR Only | Atmospheric Methane Removal Only | ||
| Knowledge Base | Relatively well studied over past decades | Nascent field of research | |
| Current Concentration in Atmosphere | 420 parts per million (ppm) | 2 ppm | |
| Chemical Properties | CDR involves physical removal and storage or biologic or geochemical conversion of carbon dioxide (CO2) | Methane is chemically active, and atmospheric methane removal involves either the physical removal and storage of methane or the accelerated conversion of methane to a less radiatively potent form | |
| Storage Requirement | Long-term geologic storage of CO2 required for some approaches | No storage requirement if methane is oxidized to CO2 | |
| Timescale of Climate Impact | For a given level of removal, CDR impacts on climate will be observed over a longer timescale because CO2 is longer-lived in the atmosphere | For a given level of removal, atmospheric methane removal has potential for climate impact on shorter timescales because methane is short-lived in the atmosphere and a more potent greenhouse gas; continuous removal would be needed to maintain an effective temperature reduction | |
| Consequences for Atmospheric Composition | Changing atmospheric concentrations of CO2 will have consequences for the carbon cycle but not for atmospheric chemistry or air quality | Changing atmospheric concentrations of methane will have complex, nonlinear consequences for tropospheric chemistry and air quality; for example, lower methane levels would reduce surface ozone concentrations | |
| Both CDR and Atmospheric Methane Removal | |||
| Technologies | Range of technologies and approaches with varying knowledge bases and technology readiness | ||
| Role in Climate Response Portfolio | Potential role in managing residual emissions and/or limiting temperature overshoot | ||
| Mitigation Deterrence | Concerns about distracting from CO2 and methane emissions mitigation and opportunity cost of dedicating time and resources to greenhouse gas removals | ||
| Resource Requirements | Potentially large resource outlays (e.g., energy, critical minerals) in a landscape of competing resource priorities | ||
| Social Impacts | For example, questions of how harms, benefits, and costs are distributed | ||
involve physical removal and storage or biologic or geochemical conversion, whereas atmospheric methane removal involves either physical removal and storage of methane or the accelerated conversion of methane to CO2. The differences in chemical properties between CO2 and methane mean that it is more challenging for the separations required for atmospheric methane removal to become economically viable.
Furthermore, the amount of air that needs to be handled for atmospheric methane removal most likely will exceed that of CDR to realize equivalent climate benefits (see Chapter 4). Another key difference is the timescale of climate impact; both CDR and atmospheric methane removal effectively shorten the atmospheric lifetime of CO2 and methane, respectively. Given the much longer atmospheric lifetime of CO2, for a given level of removal, CDR impacts on climate will be observed on a longer timescale, whereas atmospheric methane removal has the potential for more immediate climate impact due to methane’s relatively shorter atmospheric lifetime and its relative potency as a GHG. Subsequent chapters of this report elaborate on the unique challenges of atmospheric methane removal.
Mitigation Deterrence and Moral Hazard
The long-standing and central foci of debate surrounding the use of climate intervention technologies are the competing conjectures that these technologies could either undermine or galvanize mitigation efforts (Corner & Pidgeon, 2014; Merk & Wagner, 2024). This debate surrounding mitigation deterrence, also referred to as the moral hazard conjecture, is defined broadly as “the prospect of reduced or delayed mitigation resulting from the introduction or consideration of another climate intervention” (Markusson et al., 2022). Concerns around mitigation deterrence have been raised in the context of CDR and SRM. Specifically, concerns in which CDR or SRM could reduce or delay mitigation include the promise, or imagined idea, that negative emissions, in the case of CDR, or temporarily decreased global temperatures, in the case of SRM, would permit addressing climate change without the need for massive reductions in GHG emissions through disruption to the global energy system (Markusson et al., 2018). The concern is that these technological promises enable “politics of prevarication and inadequate action” by raising the expectation that more effective options will be available in the future, which may be used to justify slower policy action (Carton et al., 2023; McLaren & Markusson, 2020). Early studies on the moral hazard conjecture in the SRM context show some evidence for moral hazard among lay publics (e.g., Burns et al., 2016; Corner & Pidgeon, 2014; Wibek et al., 2015).
Others argue that CDR and SRM could enhance mitigation by, for example, signaling norm-enhancing commitment (Carrico et al., 2015; Truelove et al., 2014), creating political and economic benefits (Reynolds, 2015), or increasing our technological ability to mitigate emissions. Recent controlled experiments have tested the moral hazard conjecture empirically within stylized games and found more, rather than less, investment in mitigation when in the presence of a risky technological solution (Cherry et al., 2023).
Recently, scholarship has underscored the nuanced nature of mitigation deterrence and moral hazard, underscoring, for example, that framing around CDR and SRM is
central in understanding public response to SRM and CDR (Merk & Wagner, 2024) and that even if moral hazard does not undermine mitigation among publics, policymakers’ anticipation of it may well do so (Andrews et al., 2022). Some scholars have further suggested that policies that aim to incentivize GHG removals can limit the risks of mitigation deterrence by formulating separate targets for emissions reductions and removals (Grant et al., 2021; McLaren et al., 2019). Additional research is needed to better understand mitigation deterrence and moral hazard in the context of atmospheric methane removal and climate intervention technologies more broadly.
POLICIES ADVANCING METHANE MITIGATION AND CARBON REMOVALS
Global and domestic attention on reducing methane emissions is growing, particularly since 2020. However, compared to CO2 emissions, policies that target methane emissions are generally under-addressed; only about 13 percent of methane emissions are covered by methane mitigation policies (Olczak et al., 2023).
The following section considers recent developments at the international and domestic levels, organized by policy type or outcome: international agreements and pledges; domestic regulations; incentives; monitoring, reporting, and verification (MRV); and research and development investments. Analysis of U.S. policies toward decarbonization are detailed in two recent National Academies of Sciences, Engineering, and Medicine reports, Accelerating Decarbonization of the U.S. Energy System (NASEM, 2021a) and Accelerating Decarbonization in the United States: Technology, Policy, and Societal Dimensions (NASEM, 2023). This section instead focuses on policies targeting methane emissions mitigation as well as carbon removals, which are most pertinent to this report.
International Agreements and Pledges
The following section provides context for policy drivers for reducing methane emissions and potentially facilitating methane removals. The Paris Agreement includes an emissions goal of balancing sources and sinks for all GHGs (Article 4.1). As noted above, the conventional wisdom is to use CDR to offset residual emissions including methane. The Committee considered this policy context when developing a research agenda for atmospheric methane removal.
Global Methane Pledge
The Global Methane Pledge, which launched in November 2021 at the 26th Conference of the Parties to the UNFCCC, led by the United States and the European Union, aims to reduce global anthropogenic methane emissions at least 30 percent from 2020 levels by 2030. As of July 2024, 157 countries are participants in this global aggregate (not country-based) emissions reduction goal (The White House, 2024a); these countries collectively account for roughly half of global methane emissions. While the pledge is
voluntary and nonbinding, more than 86 countries are developing methane action plans, some for the first time. Successful implementation of the pledge would reduce warming by at least 0.2°C by 2050 (UNEP & CCAC, 2021). As of October 2023, approximately 90 percent of countries include methane emission as part of their NDCs in the scope of their target (U.S. Department of State, 2023a). However, large emitters such as China, Russia, and India are not part of the pledge. China and Russia are the top two emitters of methane from fossil fuels and together accounted for one-third of global methane emissions from fossil fuels in 2022 (IEA, 2023b). In November 2023, China released its Methane Emission Control Action Plan that highlights priorities including for methane emissions control action in the energy, agriculture, and waste sectors, as well as improvement of measurement and MRV systems (X. Sun et al., 2024). The United States and China also agreed “to develop their respective methane reduction actions/targets for inclusion in their 2035 NDCs” (U.S. Department of State, 2023a).
Methane was on the agenda at COP28, which was held in the United Arab Emirates in December 2023. The COP28 decision “recognize[d] the need for deep, rapid, and sustained reductions in greenhouse gas emissions in line with 1.5oC pathways” and, in particular, called for “[a]ccelerating or substantially reducing non-carbon-dioxide emissions, globally, including in particular methane emissions by 2030.”9 New commitments to advance the Global Methane Pledge were also announced, including 50 companies representing 40 percent of global oil production who signed on to the Oil and Gas Decarbonization Charter, which commits them to net-zero operations by 2050 and the end of routine flaring by 2030 (UNFCCC, 2023). Many individual countries also announced new commitments to reduce methane emissions from the fossil fuel sector (CCAC, 2023). Much of the attention toward the Global Methane Pledge has focused on limiting emissions from the fossil fuel sector, but relatively few commitments target emissions from agriculture and waste. Two initiatives targeting agriculture and waste emissions announced at COP28 include the Enteric Fermentation R&D Accelerator, which provides $200 million for research and development to reduce livestock emissions (Global Methane Hub, 2023), and the Lowering Organic Waste Methane initiative, which aims to deliver at least 1 million metric tons of annual methane reductions from the waste sector (U.S. Department of State, 2023b).
Financing for global methane mitigation is also a critical component for achieving goals of the Global Methane Pledge. At COP28, governments and private partners announced more than $1 billion in new grant funding (since the 27th Conference of the Parties to the UNFCCC), which includes funds devoted to relaunch the World Bank Global Flaring and Methane Reduction Partnership10 and to launch the Enteric Fermentation Accelerator. However, a report by the Climate Policy Initiative that assessed the landscape of global methane mitigating financing found that while 2020–2021 annual investments of $13.7 billion were the highest level yet, finance is far below the global estimated needs of $48 billion annually by 2030 and $119 billion annually by 2050,
___________________
9Outcome of the First Global Stocktake, Draft decision -/CMA.5, FCCC/PA/CMA/2023/L.17 (Dec. 13, 2023).
10See https://www.worldbank.org/en/programs/gasflaringreduction.
indicating that current methane mitigation measures across sectors are not receiving adequate financing (CPI et al., 2023).
Greenhouse Gas Removals and Emissions Targets
Under the UNFCCC and Paris Agreement, parties agreed to mitigate climate change by reducing GHG emissions and enhancing “removals by sinks.”11 In addition to mitigation measures, GHG removals can also be part of countries’ strategies to achieve their near- and long-term climate change commitments. Per the UNFCCC, removals are not defined as only naturally occurring and could include a wide range of CDR activities (Brent et al., 2019; Craik & Burns, 2016; Honegger et al., 2021; Horton et al., 2016). Several countries, including the United States, already include some CDR activities in the reporting of their NDCs (Silverman-Roati & Webb, 2024), and reliance on and treatment of GHG removals will depend on the rules for carbon markets under development as part of Article 6 of the Paris Agreement. While most countries include methane mitigation in their NDCs (see section above), countries have not yet included atmospheric methane removal.
Domestic Regulations
Federal Policy on Methane Mitigation
Methane emissions accounted for 11.1 percent of total gross U.S. GHG emissions in 2022 (U.S. EPA, 2024b), based on 100-year GWPs. To achieve the nation’s commitment to reduce GHG emissions by 50–52 percent from 2005 levels in 2030 (The United States of America, 2021) and reach net-zero GHG emissions by 2050 (The White House, 2021a), the United States has enacted a number of recent policies and programs that target methane emissions. In 2021, the United States released its Methane Emissions Reduction Action Plan (The White House, 2021b), a whole-of-government initiative and model for taking a sectoral approach to reducing methane emissions using existing authorities. The White House released an update in December 2023 documenting progress toward the goals laid out in the Action Plan (The White House, 2023a) and provided additional domestic policy initiatives in July 2024 (The White House, 2024a). Regulatory mitigation actions include the U.S. Environmental Protection Agency’s (EPA’s) final rule to limit GHG and air pollution emissions for new and existing oil and natural gas operations nationwide (U.S. EPA, 2024c) and the U.S. Department of Transportation’s proposed rule to improve the detection and repairs of leaks from natural gas pipelines (PHMSA & DOT, 2023).
___________________
11UNFCCC, Art. 3; Paris Agreement, Art. 4.
Legal Frameworks for Removals and Climate Interventions
While legal and regulatory frameworks for GHG removals are nascent, existing federal law likely will be implicated as CDR projects are beginning to be demonstrated and deployed. Silverman-Roati and Webb (2024) outline various crosscutting domestic requirements relevant to the research, development, and deployment of GHG removals and climate interventions, including federal and state environmental review requirements, species protection restrictions, and authorization for land acquisition and use. Studies have highlighted challenges for CDR developers to obtain land use authorizations (Eisenson & Webb, 2023; Hester, 2018; Webb, 2020) as well as opportunities to streamline environmental reviews for research and development projects for negative emissions technologies (e.g., Hester, 2018; Silverman-Roati et al., 2022a). Other examples of domestic laws that are implicated for other climate interventions include the Clean Air Act for certain types of CDR and solar geoengineering (Reynolds, 2019; Webb, 2020), and the Marine Protection, Research and Sanctuaries Act for ocean fertilization (Silverman-Roati et al., 2022b). Many domestic laws include liability provisions that impose fines or penalties for violations, though Congress has limited liability exposure to support research on emerging technologies, including for nuclear power operators and CO2 sequestration projects (Hester, 2018).
Federal and Market-Based Fees and Incentives
U.S. EPA’s Greenhouse Gas Reporting Program (GHGRP) requires large GHG emissions sources, fuel and industrial gas suppliers, and CO2 injection sites to report their GHG emissions and other information annually. U.S. EPA finalized new reporting requirements for oil and natural gas systems as part of the GHGRP in 2024.12 Under the 2022 Inflation Reduction Act (IRA), certain facilities under the GHGRP are subject to a methane emissions charge ($900/metric ton, increasing after 2 years to $1,500), the first federal fee on GHG emissions (Congressional Research Service, 2022). Interestingly, this methane charge is the only fee (or tax) that comprises the IRA’s climate policy measures, with all other climate-related components of this legislation exclusively relying on incentives (NASEM, 2023). The IRA created additional programs and allocated funding toward reducing methane emissions. For example, the IRA made investments in the creation of the Methane Emissions Reduction Program13 to reduce emissions from the oil and gas sector as well as investments in “climate-smart” agriculture and monitoring related emissions (USDA, 2023a).
Carbon markets are another way of pricing carbon, and they come in two forms. Compliance carbon markets, also known as emissions trading schemes (ETSs), are marketplaces where regulated entities trade emissions allowances or offsets in order to meet regulatory targets. As of January 2023, 28 ETSs were in force covering 17 percent of global GHG emissions, with another eight ETSs in development (ICAP, 2023). The 1997 Kyoto Protocol set up global compliance markets through mechanisms like the
___________________
12See https://www.epa.gov/ghgreporting/rulemaking-notices-ghg-reporting.
13See https://www.epa.gov/inflation-reduction-act/methane-emissions-reduction-program.
Clean Development Mechanism and Joint Implementation (Jinnah, 2003), which were active in the mid-2000s until credit demand collapsed in 2012–2014 (Michaelowa et al., 2019, 2023).
Voluntary carbon markets allow anyone to purchase and sell carbon credits; the challenges of voluntary markets and the prospects for including atmospheric methane removal are discussed in Chapter 5. Voluntary markets evolved in parallel to international negotiations and have received new demand in recent years from companies that have set net-zero targets. Article 6 of the Paris Agreement allows for voluntary cooperation between countries to meet their mitigation targets, but the rules are not yet finalized. Article 6.2 covers the use of “internationally transferred mitigation outcomes”—for example, forest carbon trading—and Article 6.4 establishes a new, centralized crediting mechanism governed by the UNFCCC. Whether non-CO2 GHGs should be included in the definition of “removals” under Article 6.4 is a contested question being considered by the UNFCCC subsidiary body appointed to provide advice on implementing Article 6.4 (Silverman-Roati & Webb, 2024).
The U.S. government has also taken actions, via legislation and agency programs, to support the further development of mitigative carbon capture, utilization, and storage and CDR. Notably, the IRA extends and enhances the 45Q tax credit program for carbon capture and adds a tax credit for direct air capture of CO2 (in addition to a “direct pay” provision for non-tax-paying entities to participate) (NASEM, 2023). This legislation also provides funding to support research, development, demonstration, and deployment of these technologies, including $10 billion for carbon capture and storage for industrial and power-sector purposes, $3.5 billion in appropriations for regional direct air capture hubs, and support for programs for carbon utilization and carbon storage commercialization (NASEM, 2023). Complementing legislative action, agency support such as the U.S. Department of Energy’s (U.S. DOE’s) carbon negative “Earthshot” for carbon removal and storage pathways14 and U.S. DOE’s National Energy Technology Laboratory’s Carbon Storage Assurance Facility Enterprise (CarbonSAFE) Initiative15 has served to bolster efforts to stand up CDR technologies and related storage and utilization pathways.
Monitoring, Reporting, and Verification
Another component to the methane emissions mitigation landscape, both to design mitigation policies and to evaluate the effectiveness of policy actions, is integrating systems for MRV of GHG emissions. International progress has been made in recent years on MRV for methane. UNEP’s Climate and Clean Air Coalition, the secretariat for the Global Methane Pledge, established the Oil & Gas Methane Partnership 2.0 in 2020,16 its flagship program for oil and gas reporting and mitigation. Additionally,
___________________
14See https://www.energy.gov/fecm/carbon-negative-shot.
15See https://netl.doe.gov/carbon-management/carbon-storage/carbonsafe.
IMEO17 was launched at the G20 Leaders’ Summit in 2021 with the goal of producing an empirically verified global dataset of methane emissions across sectors in support of the Global Methane Pledge. IMEO initially has focused on methane emissions from the fossil fuel sector, including through the Methane Alert and Response System.18 A growing number of satellite instruments has also been developed by the public and private sector to monitor methane globally at high spatial and temporal resolution (Chulakadabba et al., 2023; NASEM, 2022c; Thorpe et al., 2023).
On the domestic side, the White House released its National Strategy to Advance an Integrated U.S. Greenhouse Gas Measurement, Monitoring, and Information System (GHGMMIS) in November 2023, which includes initiatives in the agriculture, energy, waste, and natural sectors to detect, quantify, and reduce methane emissions (The White House, 2023b; see Box 2-2). As part of this strategy, federal agencies led by the National Aeronautics and Space Administration (NASA), the National Oceanic and Atmospheric Administration (NOAA), the National Institute of Standards and Technology, and U.S. EPA have established the U.S. GHG Center19 as a central hub for GHG data and analysis, as recommended in a report of the National Academies (NASEM, 2022c).
Federal Research and Development Investments
Federal investments into research and development are another policy lever used to advance capabilities for methane mitigation and carbon removals. Notable incentives-oriented federal efforts in methane mitigation include U.S. DOE’s Advanced Research Projects Agency–Energy, which awarded $35 million to develop technologies to reduce methane emissions in the oil, gas, and coal industries in 2021 (ARPA-E, 2021). In 2023, U.S. DOE’s Office of Fossil Energy and Carbon Management (FECM) awarded $47 million in research projects to monitor, measure, and mitigate methane missions across the oil and natural gas supply chain (U.S. DOE, 2023a). In 2024, U.S. DOE and U.S. EPA issued a funding call for $850 million from the IRA to support projects to reduce methane emissions from existing wells and infrastructure and accelerate deployment of emissions mitigation and monitoring solutions.20 USDA funds many research programs on methane mitigation practices in farming and agriculture. For example, the Rural Business-Cooperative Service awarded $177 million in 2020 and $240 million in 2021 in grants and loans to anaerobic digester projects; the Environmental Quality Incentives Program introduced $10 million for climate-smart agriculture and forestry to reduce methane emissions via the installation of anaerobic digesters and in certain rice practices; and the formation of a Climate Change Center of Excellence will develop a research pipeline for climate-smart farming technologies and methane reduction (The White House, 2023a). Additional existing research programs at USDA, NOAA, and NASA are noted in the GHGMMIS (The White House, 2023b).
___________________
17See https://www.unep.org/explore-topics/energy/what-we-do/methane/about-imeo.
18See https://unenvironment.widen.net/s/7pmjgcdgkz/mars-infographic-1.
19See https://earth.gov/ghgcenter.
20See https://www.energy.gov/fecm/funding-notice-methane-emissions-reduction-program-oil-and-gas-methane-monitoring-and.
BOX 2-2
Relevant Methane Initiatives in the National Strategy to Advance an Integrated U.S. Greenhouse Gas Measurement, Monitoring, and Information System
The White House released a National Strategy to Advance an Integrated U.S. Greenhouse Gas Measurement, Monitoring, and Information System in November 2023 (The White House, 2023b). The strategy identifies priorities to leverage existing capabilities across federal agencies to advance measurement, monitoring, and data curation of greenhouse gas (GHG) emissions in the United States, including GHG removals. The strategy identified a number of sector-specific initiatives and demonstration projects relevant to improving understanding of U.S. methane emissions:
- Agriculture: improve estimates of management actions that reduce methane emissions from enteric fermentation and improve methane measurements from livestock farms.
- Oil and gas: establish a testbed in the Permian Basin to improve measurements and models of methane emissions, improve surface monitoring and the evaluation of measurements, and identify anomalous oil and gas emissions events.
- Coal mines: improve methane emissions estimates, including through the reconciliation of activity- and atmospheric-based measurements.
- Waste: improve municipal solid waste landfill emissions models, emissions factors, and activity data and develop cost-effective monitoring approaches for landfills.
- Natural sources: prioritize measurements to improve GHG estimates, explore the development of an interagency research program to support understanding of methane trends from natural systems, target wetlands for interagency measurement efforts, and increase availability and utility of methane flux data from natural systems.
CDR provides one example of how the federal government may support research for atmospheric methane removal technologies. U.S. DOE FECM has provided instrumental investment in the research, development, and demonstration of CDR technologies and carbon management approaches more broadly (U.S. DOE, 2022). U.S. DOE’s Office of Clean Energy Demonstrations also has provided support for direct air capture through its Regional Direct Air Capture Hubs, which are intended to demonstrate this technology at commercial scales.21 Another notable U.S. DOE program to support CDR
___________________
is the Carbon Negative Shot, an effort to establish CDR pathways to capture and store carbon at the gigaton scale for less than $100/net metric ton of CO2 equivalent. The Carbon Negative Shot extends across six different CDR pathways and draws cross-agency involvement, in addition to external engagement efforts with relevant groups.22
Marine CDR (mCDR) also has received recent investments of federal research dollars and interagency coordination. The 2023 Ocean Climate Action Plan (NOAA, 2023a) recommended the formation of the Marine Carbon Dioxide Removal Fast Track Action Committee under the National Science and Technology Council (2023) to facilitate the development of policies and research for mCDR (Doney & Lubchenco, 2023). In 2023, the NOAA Ocean Acidification Program invested $24.3 million in research on mCDR (NOAA, 2023b). In 2024, U.S. DOE announced up to $100 million of funding to develop a CDR industry that is commercially viable as part of its Carbon Negative Shot,23 which will support testing facilities and pilot projects for both terrestrial CDR and mCDR (U.S. DOE, 2024a). NOAA and U.S. DOE entered a memorandum of agreement in 2024 to coordinate mCDR research and resources (Doney & Lubchenco, 2023; U.S. DOE, 2024b).
___________________
22See https://www.energy.gov/fecm/carbon-negative-shot.
23See https://www.energy.gov/fecm/funding-notice-carbon-negative-shot-pilots.
This page intentionally left blank.


