The Role of Seafood Consumption in Child Growth and Development (2024)
Chapter: 3 Seafood Consumption Patterns in the United States and Canada
3
Seafood Consumption Patterns in the United States and Canada
This chapter provides an overview of evidence reviewed by the committee on the sources of seafood, the major types of seafood consumed, maternal and child seafood consumption in the United States and Canada—including trends over time, and factors that influence consumption. The committee also commissioned two scientists from the Johns Hopkins Center for a Livable Future at the Bloomberg School of Public Health to perform analyses using the National Health and Nutrition Examination Survey (NHANES) data from 2011 to March 2020 on seafood consumption and factors that are associated with dietary patterns. Consideration is given to special population subgroups, including racial and ethnic groups, Indigenous populations, and subsistence and sport fishers, as well as geographic area.
SOURCES OF SEAFOOD
The Role of Aquaculture in Fish and Seafood Supplies
Aquaculture continues to play an increasingly important role in providing seafood to the world’s expanding population. Of the 214 million metric tons of seafood harvested globally in 2020, aquaculture contributed a record 122.6 million metric tons, with aquatic animals accounting for 87.5 million metric tons and algae (principally various species of macroalgae or seaweed) accounting for 35.1 million metric tons (FAO, 2022). Considering the portion of fish from capture fisheries that is processed for nonhuman use (e.g., rendered into fishmeal and fish oil) and excluding algae production, world aquaculture has continued to increase its contribution of seafood destined for human consumption to the present figure of more than 50 percent (FAO, 2022).
In 2020, global aquaculture production had grown by 6 percent from 2018 levels and 2.7 percent from 2019 levels. This expansion in production was marked by increases in all regions, except Africa, which recorded a decrease owing to reduced production from Egypt and Nigeria, the two major producing countries in that region (FAO, 2022). The remaining countries in Africa experienced 14.5 percent growth from 2019. Asian countries contributed 70 percent of the total production of aquatic animals in 2020, followed by the Americas, Europe, Africa, and Oceania. Chile, China, and Norway were the top producers in their regions. With 35 percent of the total, China continued to be the world’s leading producer of aquatic animals and exports more aquatic animal products than any other country, although it also consumes a large quantity of domestically produced seafood. Other major exporting countries are Norway and Vietnam (FAO, 2022).
Seafood production for human consumption amounted to 20.2 kg per capita in 2022, slightly less than the all-time high of 20.5 kg in 2019 but more than double the average of 9.9 kg in the 1960s (FAO, 2022). Global consumption of seafood1 has increased annually at an average rate of 3.0 percent since 1961, compared with a 1.6 percent population growth rate (FAO, 2022). The relative contribution of seafood from aquaculture is expected to continue to increase to meet the demands of the world’s growing population; meanwhile, the global fishing fleet continues to decrease (a 10 percent reduction was estimated in 2020 compared with 2015). Moreover, most capture fisheries continue to decline in the amount of their catches because of factors such as overfishing, pollution, and poor management, although the number of landings from biologically sustainable stocks is reported to be on the rise (FAO, 2022). Overall, sustainable aquaculture development remains essential to supply the increasing demand for aquatic foods by an expanding global population. The Food and Agriculture Organization of the United Nations (FAO) projects that aquatic animal2 production will increase 14 percent by 2030 (FAO, 2020).
The European Union is (collectively) the world’s largest importing market for seafood; individual countries that import the most are the United States, China, and Japan (FAO, 2022). China imports large quantities of aquatic species for domestic consumption but also as raw material that is processed in China and reexported, at least since the year 2000 (Asche et al., 2022). Asche et al. (2022) proposed that Chinese domestic seafood demand is not a primary driver of its fish imports and that an estimated 74.9 percent of imported fish, such as imported Russian Alaskan pollock and Norwegian cod, are processed and reexported.
Data from the National Marine Fisheries Service’s (NMFS’s) Fisheries of the United States report indicate that aquaculture currently accounts for about 7 percent of the total U.S. domestic seafood production by weight (NMFS, 2022). From a cost perspective, aquaculture contributes approximately 24 percent of the value of domestic seafood products. For example, aquaculture production in the United States did not fluctuate between 2014 and 2019, but the value of sales of domestic aquaculture increased by an average of 2.3 percent per year within the same time frame (NMFS, 2022).
Domestic Seafood Supply
Seafood products available from domestic sources come from both capture fisheries and aquaculture. As the United States and Canada are bordered by the Atlantic and Pacific Oceans and the Gulf of Mexico is along the U.S. southern border, substantial quantities of seafood are obtained from commercial fishing from ports in those areas. A large diversity of aquatic species is harvested from the wild. The National Oceanic and Atmospheric Administration (NOAA) maintains yearly harvest records for several hundred fish, crustacean (e.g., crab, lobster, shrimp), and molluscan (e.g., abalone, clam, and oyster) species obtained from various U.S. regions, including the Great Lakes. Commercial harvest of aquatic species from U.S. inland waters is minor compared to that from marine waters (NMFS, 2020).
Commercial aquaculture in the United States also provides a diversity of seafood particularly for regional markets. For example, catfish aquaculture—the largest U.S. aquacultural—is primarily practiced in earthen ponds in Mississippi, Arkansas, Alabama, and Texas, whereas crayfish aquaculture principally occurs in Louisiana (USDA/FSIS, 2022). Aquaculture of rainbow trout occurs in flow-through raceway systems primarily in Idaho and North Carolina, where water and climatic conditions for this cold-water species are suitable and markets are well established (Hinshaw et al., 2004).
Production of Atlantic salmon occurs primarily in ocean net pens off the coast of Maine and both the east and west coasts of Canada, although aquaculture industries in Norway and Chile produce much larger quantities of Atlantic salmon (FAO, 2022). Oysters are produced in waters along the eastern, western, and southern coasts of the United States and are a primary domestic-origin product. Many other species of aquatic organisms (fish, crustaceans, and mollusks) are produced by aquaculture in various U.S. regions, but those species constitute a small percentage of the total seafood available to U.S. consumers compared with similar species produced by
___________________
1Aquatic food consumption data are expressed in live weight equivalents.
2Aquatic animals include finfish harvested from inland aquaculture as well as marine and coastal aquaculture, mollusks, crustaceans, marine invertebrates, aquatic turtles, and frogs.
aquaculture imported from other countries. They also make a minor contribution compared with various seafood species commercially harvested from the wild such as cod, Pacific salmon, pollock, and tuna (NMFS, 2020, 2022).
Canada produced 0.9 million tons of fish and seafood in 2020, with a value of $5.0 billion (CAD). Marine fisheries accounted for 750,000 tons, freshwater fisheries accounted for 22,000 tons, and aquaculture production accounted for 170,000 tons (Agriculture Canada, 2023).
The United States and Canada are important trading partners in fisheries. The United States is Canada’s largest export market. The top three imported foods were lobsters, prepared/preserved salmon, and sockeye salmon (Agriculture Canada, 2023).
Imported Seafood Supply
It has been reported that 60–65 percent of the U.S. seafood supply is imported (Gephart et al., 2019; NMFS, 2022), primarily from Asia, and that 70–85 percent of that proportion is imported for consumption (NMFS, 2020). More than 170 countries export seafood to the United States, with Canada, Chile, China, India, Indonesia, and Vietnam being the top six in order, based on value (Love et al., 2021).
Many imported seafood products are produced by aquaculture including penaeid shrimp, pangasius catfish,3 tilapia, and Atlantic salmon; these species constitute approximately half of U.S. seafood consumption (Shamshak et al., 2019), and the other half is composed of canned tuna, pollock, cod, crab, and clams (NFI, 2023).
Calculation of Seafood Consumption in the United States and Canada
NOAA compiles fisheries statistics from the previous year into an annual overview of the contribution of fishing to the U.S. food supply (NMFS, 2022).4 This annual report provides information on the total catch for domestic commercial and recreational fisheries by species and provides data on the U.S. fishery processing industry, imports and exports of fishery-related products, domestic supply, and per capita consumption of fishery products (NMFS, 2022). These data allow for tracking important indicators, such as annual estimates of seafood consumption. To capture more typical consumption patterns, the committee selected data from the 2018–2019 report rather than data collected during years covering the COVID-19 pandemic.
Per capita consumption is calculated by NOAA fisheries and based on a “disappearance” model using data derived primarily from secondary sources. Specifically, the total supply of imports and landings is converted to edible weight by decreases in supply, including exports and industrial uses. To estimate per capita consumption, the remaining total is divided by the U.S. population size. Limitations in the model include changes in source data and invalid model assumptions, with potentially inaccurate or outdated conversion factors that may affect calculations (Pulver et al., 2020). There are additional limitations to this estimate, as geographic location (i.e., interior regions compared to coastal regions) could affect the level of seafood consumption. Furthermore, the model used to calculate consumption does not consider inventories of products on hand at the beginning and end of the year and it assumes that all production is consumed within the year it is produced (NMFS, 2022).
Using this model, the top 10 most consumed species among the U.S. population in 2018–2019 accounted for 74 percent of total seafood consumption (Table 3-1) and the remaining 26 percent came from other seafood products from various sources (NFI, 2023). Half of the species listed in Table 3-1 (including penaeid shrimp, pangasius catfish, tilapia, and Atlantic salmon) are produced by aquaculture and are largely imported in contrast to domestic catfish. The other half of the species in Table 3-1 includes canned tuna, pollock, cod, crab, and clams.
In Canada, data on types and amounts of seafood consumed are collected through the Canadian Community Health Survey (CCHS). The CCHS is a series of nationally representative cross-sectional surveys that collect information on health status, use of health care services, and the determinants of health for the Canadian population during each survey cycle (Hu and Chan, 2021). The 2015 survey included a 24-hour dietary recall that gathered information on foods and beverage consumption via a computer-assisted participant interview for the total sample
___________________
3Pangasius is a type of large catfish imported from South and Southeast Asia.
4Available at https://www.fisheries.noaa.gov/national/sustainable-fisheries/fisheries-united-states (accessed August 29, 2023).
TABLE 3-1 Seafood Species Most Frequently Consumed, U.S. Per Capita Consumption, 2019
| United States | Per Capita Consumption, 2019, lb (g) |
|---|---|
| 1. Shrimp | 4.70 (2,131.9) |
| 2. Salmon | 3.10 (1,406.1) |
| 3. Canned tuna | 2.20 (997.9) |
| 4. Alaska pollock | 1.00 (453.6) |
| 5. Tilapia | 0.98 (444.5) |
| 6. Cod | 0.59 (267.6g) |
| 7. Catfish | 0.55 (249.5) |
| 8. Crab | 0.52 (235.9) |
| 9. Pangasius | 0.36 (163.3) |
| 10. Clams | 0.30 (136.1) |
NOTE: Per capita consumption is calculated from disappearance data by type of seafood (see NMFS, 2022).
SOURCE: Table created from data in NMFS, 2022.
(day 1), and via a telephone interview for a subsample (day 2) of participants. Table 3-2 summarizes 1-day 24-hour recall data on the top 10 seafood species consumed per capita among consumers in Canada.
Direct comparison of Canadian and U.S. values cannot be made because they are based on different data collection methodologies (food disappearance data vs. self-reported 24-hour dietary recall data), but per capita fish consumption appears to be lower in Canada. The United States consumes more imported species such as tilapia and pangasius than Canada, and differences exist between the native species consumed in the two countries, as shown in Tables 3-1 and 3-2. All species on the top 10 lists in both countries are rich in protein, and several (including salmon and albacore tuna) are also rich in docosahexaenoic acid (DHA). The other top 10 consumed seafood species are lower in total lipids and thus lower in long-chain polyunsaturated fatty acids (n-2 LCPUFAs) (Love et al., 2022). In terms of contaminants, species produced from aquaculture are typically exposed to more regulated environments than wild species (NOAA, n.d.) and are less likely to be exposed to toxins and toxicants that tend to accumulate and/or become concentrated in marine organisms in the wild (Burridge et al., 2010).
TABLE 3-2 Seafood Species Most Frequently Consumed, Canada Per Capita Consumption, 2015
| Canada | Per Capita Consumption, 2015, lb (g) |
|---|---|
| 1. Sardine | 0.24 (109.7) |
| 2. Salmon | 0.20 (92.4) |
| 3. Herring | 0.20 (91.3) |
| 4. Trout | 0.20 (89.6) |
| 5. Cod | 0.17 (74.9) |
| 6. Tuna | 0.14 (62.2) |
| 7. Clams | 0.09 (42.5) |
| 8. Crab | 0.09 (39.3) |
| 9. Shrimp | 0.08 (36.4) |
| 10. Scallops | 0.08 (34.8) |
SOURCE: Hu and Chan, 2020.
Summary of Evidence on Sources of Seafood
The majority (70–85 percent) of seafood consumed in the United States is imported, and aquaculture accounts for about half of seafood consumed (NMFS, 2022). The top 10 most consumed species for the total U.S. population in 2018–2019 accounted for about three-quarters of the total seafood consumption (NFI, 2023). Compared to consumption during 2004 as reported in the Seafood Choices: Balancing Benefits and Risks report (IOM, 2007), shrimp remains the most consumed seafood, but salmon has now surpassed tuna and is the second most consumed seafood in both the United States and Canada. Because of different data sources and collection methods, it is not possible to directly compare absolute intake of seafood in the United States and Canada.
TRENDS IN CONSUMPTION OF FISH AND SEAFOOD
To understand current trends in seafood consumption, the committee accessed the U.S. Department of Agriculture (USDA) Economic Research Service (ERS) Food Availability (Per Capita) Data System (FADS).5 This data source includes three data series on food and nutrient availability for consumption: (1) food availability data, (2) loss-adjusted food availability data, and (3) nutrient availability data. The FADS calculates the amount of food available for human consumption using the difference between available commodity supplies and nonfood use for each specific food item. The calculated data are a proxy for actual consumption of foods at the national level for consumers in the United States and Armed Forces overseas and for time-series data on food availability in the United States.
Figure 3-1 shows trends in seafood consumption from disappearance data over the past century in the United States. Overall, since 1909 consumption of cured seafood has decreased and remains low since 1930 while total intake increased to 16.1 lb (7.3 kg) per capita per year, a trend driven largely by intake of fresh and frozen seafood, which tripled since 1909. Canned seafood consumption has remained relatively stable at 2.6–3.5 lb (1.2–1.6 kg) per capita per year.
In Canada, there are no similar long-term trending data. From 1988 to 2022, the amount of seafood available for consumption per person per year ranged from 7.2 to 10.0 kg (15.9–22 lb) and there was no clear trend. In 2021, seafood consumption in Canada was 8.44 kg (18.6 lb)/per person per year and consisted of 6.6 kg (14.6 lb) of marine fish,6 0.89 kg (2 lb) of freshwater fish, and 0.95 kg (2.1 lb) of shellfish.
Table 3-3 shows trends in the past decade in U.S. per capita consumption of fresh and frozen, canned, and cured seafood collected by NMFS, Office of Science and Technology (NMFS, 2022). Data show that consumption of cured seafood has remained stable at 0.3 lb/per person per day while fresh and frozen as well as canned seafood intake has fluctuated, with an increasing trend starting in 2015. It is noteworthy to point out that in the same time frame, the population increased by approximately 7 percent. Consumption of fresh and frozen seafood increased more than canned seafood consumption, reflecting a change in food preference.
Summary of Evidence on Trends in Seafood Consumption
Over the past century, consumption of seafood has increased because of a combination of both increasing population and greater per capita consumption. Most of the increase in consumption relates to fresh and frozen seafood, whereas consumption of canned seafood has remained generally stable and cured seafood contributes negligibly to overall seafood consumption. Even during the past few decades, consumption of fresh and frozen seafood has continued to increase.
___________________
5Available at https://www.ers.usda.gov/data-products/food-availability-per-capita-data-system/ (accessed February 25, 2024).
6Available at https://www.statista.com/statistics/451558/volume-of-fish-products-available-for-consumption-per-person-canada/ (accessed February 25, 2024).
![Trends in U.S. consumption of total fishery products (boneless, trimmed [edible] weight), by type in pounds per capita per year, 1909–2018. Based on edible raw fish and shellfish. Excludes edible offal, bones, and viscera for fishery products. Excludes animal consumption for fishery product. Calculated from data not rounded](https://www.nationalacademies.org/read/27623/assets/images/img-46-1.jpg)
SOURCE: ERS, 2020.
TABLE 3-3 Annual Per Capita Consumption of Fish and Shellfish, United States, 2011–2020
| Year | U.S. Civilian Resident Population (millions) | Per Capita Consumption in Pounds (grams) | |||
|---|---|---|---|---|---|
| Fresh and Frozen | Canned | Cured | Total | ||
| 2011 | 310 | 13.4 (6,078) | 4.0 (1,814) | 0.3 (136) | 17.8 (8,074) |
| 2012 | 313 | 12.9 (5,851) | 3.6 (1,633) | 0.3 (136) | 16.8 (7,620) |
| 2013 | 315 | 13.8 (6,260) | 3.8 (1,724) | 0.3 (136) | 17.9 (8,119) |
| 2014 | 318 | 13.5 (6,124) | 3.5 (1,588) | 0.3 (136) | 17.3 (7,847) |
| 2015 | 320 | 14.6 (6,622) | 4.0 (1,814) | 0.3 (136) | 18.8 (8,528) |
| 2016 | 322 | 14.4 (6,532) | 3.6 (16,323) | 0.3 (136) | 18.3 (8,301) |
| 2017 | 325 | 15.1 (6,849) | 3.8 (1,724) | 0.3 (136) | 19.1 (8,664) |
| 2018 | 326 | 15.0 (6,804) | 3.7 (1,678) | 0.3 (136) | 19.0 (8,618) |
| 2019 | 327 | 15.1 (6,849) | 3.9 (1,769) | 0.3 (136) | 19.3 (8,754) |
| 2020 | 332 | 14.6 (6,622) | 4.2 (1,905) | 0.3 (136) | 19.0 (8,618) |
SOURCE: NMFS, 2022. Reprinted with permission.
SURVEY DATA ON SEAFOOD CONSUMPTION BY AGE AND SEX GROUP
The committee was asked to review and assess evidence on nutrition and toxicology associations of seafood intake during pregnancy, lactation, and childhood with child growth and development. As a first step, the committee sought information on the amount of seafood typically consumed by children ages 2–19 years, as well as for women during pregnancy and lactation. What We Eat in America, the dietary component of the NHANES, served as a source of national continuous cross-sectional intake data. The committee also used published results from other analyses of NHANES data as referenced below.
Because of small sample sizes for pregnant and lactating women in the NHANES dataset, results are reported for all women of childbearing age in the 2011–2020 NHANES analyses. For example, Razzaghi and Tinker (2014) used the NHANES 1999–2006 surveys, which included complete interview and survey data from 1,260 pregnant women and 5,848 nonpregnant women and found no significant differences in the proportion of fish or shellfish consumption between pregnant and nonpregnant women. This finding was consistent for prevalence, amount, and type of fish and shellfish consumed, separately or combined. The findings also showed consistency between the two measures of dietary intake in the 2011–2020 NHANES analyses commissioned for this study, namely the 30-day seafood intake questionnaire and the (day 1) 24-hour recall. The committee thus interpreted the 2011–2020 data from women of childbearing age from the later cycle years examined as hypothetically representative of pregnant and lactating women in the population. However, the committee also recognizes that because of changes in dietary patterns, this interpretation has limitations.
In Canada, data were extracted from the CCHS,7 a series of nationally representative cross-sectional surveys that includes nutrition studies in 2004 and 2015 (Béland, 2002). Each survey has two parts: a general health questionnaire and a 24-hour dietary recall. Information on respondents’ sociodemographic characteristics (e.g., age, sex, marital status, income, and education), chronic health conditions, and use of vitamin and mineral supplements was collected in the general health component. The 24-hour recall portion gathers data on food and beverage consumption via a computer-assisted personal interview for the total sample (day 1) and a telephonic interview on a subsample (day 2). The study population for both surveys was Canadians living within the 10 provinces. However, the CCHS does not include Indigenous populations living on reservations.
U.S. Women of Childbearing Age
Table 3-4 reports the percentage of seafood species commonly consumed by women of childbearing age, and Table 3-5 presents this information by race and ethnicity. The sample size reported in the table represents the number of seafood meals of each type reported. The weighted frequencies represent the percentage that each type contributes to the total seafood meals consumed. For example, shrimp represents 28.2 percent of all reported seafood meals, and tuna represents 15.9 percent (Table 3-4). By comparison, consumption of shrimp, tuna, and salmon by women of childbearing age represents 59 percent of the amount consumed by the general population.
The results of the data analysis commissioned by the committee show that the most consumed seafood types by U.S. women of childbearing age are (in descending order) shrimp, tuna, salmon, other fish, and crab. The type of seafood consumed varies with racial and ethnic identity. Non-Hispanic Asian and non-Hispanic Black races most frequently consume shrimp, salmon, other fish, and other unknown fish or catfish; Hispanic, non-Hispanic White, and other races most frequently consume shrimp, tuna, salmon, and crab (Table 3-5).
Table 3-6 presents the frequency of consuming seafood meals by women of childbearing age overall, and by race and ethnicity. Based on reported monthly frequency, fewer than one in five women consume two or more seafood meals per week, whereas more than one-quarter reported consuming seafood never or less than once per month. Large variation exists by racial and ethnic background, with non-Hispanic Asian women (37 percent) most likely to consume at least two seafood meals per week, and Hispanic (16 percent) and non-Hispanic Black (17 percent) least likely. Frequency of seafood meals increased with increasing income.
___________________
7Available at https://www.canada.ca/en/health-canada/services/food-nutrition/food-nutrition-surveillance/health-nutrition-surveys/canadian-community-health-survey-cchs.html (accessed February 25, 2024).
TABLE 3-4 Seafood Species Commonly Consumed, U.S. Women of Childbearing Age, by Percentage of Seafood Meals
| Seafood Species | Sample Size (n) | Frequency, Weighted (percent) |
|---|---|---|
| 1. Shrimp | 7,447 | 28.2 |
| 2. Tuna | 4,347 | 15.9 |
| 3. Salmon | 4,126 | 15.1 |
| 4. Other fish | 2,762 | 7.4 |
| 5. Crab | 1,479 | 5.3 |
| 6. Breaded fish | 861 | 3.0 |
| 7. Catfish | 1,315 | 2.8 |
| 8. Cod | 759 | 2.7 |
| 9. Scallops | 515 | 2.2 |
| 10. Lobster | 535 | 2.1 |
SOURCE: NHANES cycle years 2011–2012 through 2017–March 2020. Data are derived from the 30-day food frequency questionnaire.
TABLE 3-5 Seafood Species Commonly Consumed, U.S. Women of Childbearing Age by Percentage of Seafood Meals, by Race and Ethnicity
| Race and Ethnicity | Seafood Species | Sample Size (n) | Frequency, Weighted (percent) |
|---|---|---|---|
| Hispanic | 1. Shrimp | 1,756 | 28.6 |
| 2. Tuna | 1,160 | 17.5 | |
| 3. Salmon | 725 | 15.6 | |
| 4. Other fish | 702 | 9.7 | |
| 5. Crab | 206 | 5.1 | |
| Non-Hispanic Asian | 1. Shrimp | 1,555 | 27.5 |
| 2. Salmon | 1,097 | 18.4 | |
| 3. Other fish | 582 | 10.2 | |
| 4. Tuna | 476 | 9.2 | |
| 5. Other unknown fish | 256 | 4.8 | |
| Non-Hispanic Black | 1. Shrimp | 2,177 | 30.0 |
| 2. Salmon | 1,034 | 11.8 | |
| 3. Other fish | 921 | 10.8 | |
| 4. Tuna | 838 | 9.3 | |
| 5. Catfish | 784 | 8.1 | |
| Non-Hispanic White | 1. Shrimp | 1,621 | 26.9 |
| 2. Tuna | 1,673 | 20.0 | |
| 3. Salmon | 1,026 | 14.8 | |
| 4. Crab | 375 | 5.1 | |
| 5. Other fish | 441 | 4.3 | |
| Other Race, Multiracial | 1. Shrimp | 338 | 33.7 |
| 2. Salmon | 244 | 18.7 | |
| 3. Tuna | 200 | 11.9 | |
| 4. Other fish | 116 | 7.6 | |
| 5. Crab | 92 | 6.1 |
NOTE: See NHANES Data Analysis Methodology in Appendix E.
SOURCE: NHANES cycle years 2011–2012 through 2017–March 2020.
TABLE 3-6 Weighted Seafood Meal Frequency Among Women of Childbearing Age, by Percentage of Seafood Meals
| n, Weighted | 0 Meals per Month, Percent (n) | Less Than 2 Meals per Week, Percent (n) | 2 or more Meals per Week, Percent (n) | |
| Overall | 145,136,708 | 27 (3,694) | 54 (7,392) | 19 (2,646) |
| Race/Ethnicity | ||||
| Hispanic | 29,442,289 | 26 (936) | 58 (2,064) | 16 (516) |
| Non-Hispanic Asian | 9,262,960 | 21 (359) | 42 (749) | 37 (639) |
| Non-Hispanic White | 18,261,908 | 22 (727) | 57 (1,858) | 21 (661) |
| Non-Hispanic Black | 82,355,531 | 29 (1,478) | 54 (2,372) | 17 (687) |
| Other | 5,814,021 | 28 (194) | 53 (349) | 20 (143) |
| Income (IPR) | ||||
| Less than 1.3 | 39,028,154 | 33 (1,570) | 54 (2,616) | 14 (664) |
| 1.3–4.99 | 75,250,923 | 27 (1,748) | 55 (3,787) | 18 (1,342) |
| 5+ | 30,857,631 | 20 (376) | 53 (989) | 27 (640) |
NOTES: IPR = income poverty ratio; n = sample size. Values in parentheses are unweighted sample sizes. Seafood frequency measured using a 30-day food frequency questionnaire based on the total number of meals per month for all seafood species. Respondents not reporting food frequency are not presented in this table. See NHANES Data Analysis Methodology in Appendix E.
SOURCE: NHANES cycle years 2011–2012 through 2017–March 2020.
Children and Adolescents in the United States
Table 3-7 reports the most frequently consumed seafood species by U.S. children according to NHANES 2011–2020. The weighted frequencies represent the percentage that each type contributes to the total seafood meals consumed. For example, shrimp represent 28.7 percent of all reported seafood meals, and tuna 14.4 percent (Table 3-7). The top 10 types of seafood that U.S. children most frequently consume are similar to the top 10 types consumed by U.S. women of childbearing age (Table 3-4) and by the total U.S. population (Table 3-1). One difference is that breaded fish of unspecified species contributes almost 7 percent of the overall consumed seafood among children, but only 3 percent for women of childbearing age.
TABLE 3-7 Seafood Species Frequently Consumed, U.S. Children by Percentage of Seafood Meals
| Seafood Species | Sample Size (n) | Frequency, Weighted (percent) |
|---|---|---|
| 1. Shrimp | 7,168 | 28.7 |
| 2. Tuna | 3,466 | 14.4 |
| 3. Salmon | 3,172 | 12.1 |
| 4. Other fish | 2,586 | 7.8 |
| 5. Breaded fish | 1,732 | 6.7 |
| 6. Crab | 1,292 | 5.2 |
| 7. Catfish | 1,344 | 4.3 |
| 8. Cod | 633 | 2.6 |
| 9. Other unknown | 838 | 2.2 |
| 10. Clam | 392 | 2.2 |
NOTE: See NHANES Data Analysis Methodology in Appendix E.
SOURCE: NHANES cycle years 2011–2012 through 2017–March 2020. Data are derived from the 30-day food frequency questionnaire.
Table 3-8 presents information by sex and age group, and Table 3-9 presents information by racial and ethnic group. Seafood consumption for children increased with increasing age, which is expected given the higher energy demands and greater food intake as children grow. Female children were reported as having higher consumption than males, and consumption was highest among children who identify as non-Hispanic Black or other race (including Asian), compared to those who identify as non-Hispanic White, Mexican American, or other Hispanic.
The committee also requested information on frequency of seafood consumption and portion sizes consumed for children ages 12–24 months (Tables 3-10 and 3-11). Overall, about 45 percent of 1-year-old U.S. children consume seafood never or less than once per month and 3.8 percent consume seafood at least twice per week.
Table 3-12 reports frequency of seafood consumption for children ages 2–19 years by age group, sex, race and ethnicity, and income. Compared with 1-year-old children (Table 3-10), rates of consumption were only marginally higher with 43 percent consuming seafood less than once per month and 6.4 percent consuming two or more seafood meals per week. Differences by age and sex were small, although adolescent males ate seafood somewhat more frequently compared with younger males or females at all ages (7 percent of males 12–19 years consumed
TABLE 3-8 Seafood Species Commonly Consumed, U.S. Children by Percentage, by Sex and Age Group
| Age (years) Group and Sex | Seafood Species | Sample Size (n) | Frequency, Weighted (percent) |
|---|---|---|---|
| 2–5 years | |||
| Girls | 1. Shrimp | 866 | 24.5 |
| 2. Tuna | 470 | 17.5 | |
| 3. Breaded fish | 287 | 11.8 | |
| 4. Salmon | 368 | 11.8 | |
| 5. Other fish | 398 | 10.2 | |
| Boys | 1. Shrimp | 673 | 26.0 |
| 2. Tuna | 439 | 16.7 | |
| 3. Breaded fish | 355 | 14.7 | |
| 4. Salmon | 343 | 12.6 | |
| 5. Other fish | 335 | 11.0 | |
| 6–11 years | |||
| Girls | 1. Shrimp | 1,256 | 28.3 |
| 2. Tuna | 731 | 17.8 | |
| 3. Other fish | 605 | 12.0 | |
| 4. Salmon | 463 | 11.4 | |
| 5. Breaded fish | 310 | 7.0 | |
| Boys | 1. Shrimp | 1,214 | 26.2 |
| 2. Tuna | 566 | 13.5 | |
| 3. Salmon | 543 | 12.4 | |
| 4. Other fish | 579 | 11.3 | |
| 5. Breaded fish | 350 | 8.2 | |
| 12–19 years | |||
| Girls | 1. Shrimp | 1,640 | 35.1 |
| 2. Tuna | 578 | 12.6 | |
| 3. Salmon | 698 | 11.2 | |
| 4. Crab | 333 | 6.8 | |
| 5. Breaded fish | 224 | 5.1 | |
| Boys | 1. Shrimp | 1,519 | 26.4 |
| 2. Tuna | 682 | 13.9 | |
| 3. Salmon | 757 | 12.9 | |
| 4. Other fish | 321 | 5.6 | |
| 5. Crab | 307 | 5.2 | |
NOTE: See NHANES Data Analysis Methodology in Appendix E.
SOURCE: NHANES cycle years 2011–2012 through 2017–March 2020.
TABLE 3-9 Seafood Species Commonly Consumed, U.S. Children, by Percentage of Seafood Meals, by Race and Ethnicity
| Race and Ethnicity | Seafood Species | Sample Size (n) | Frequency, Weighted (percent) |
|---|---|---|---|
| Hispanic | 1. Shrimp | 2,468 | 31.4 |
| 2. Tuna | 1,377 | 18.0 | |
| 3. Salmon | 720 | 11.1 | |
| 4. Other fish | 847 | 10.0 | |
| 5. Breaded fish | 443 | 5.3 | |
| Non-Hispanic Asian | 1. Shrimp | 1,570 | 28.9 |
| 2. Salmon | 1,030 | 17.7 | |
| 3. Tuna | 394 | 9.3 | |
| 4. Other fish | 565 | 8.7 | |
| 5. Other unknown | 370 | 5.8 | |
| Non-Hispanic Black | 1. Shrimp | 2,791 | 31.3 |
| 2. Catfish | 1,011 | 11.0 | |
| 3. Other fish | 1,132 | 10.6 | |
| 4. Tuna | 865 | 10.0 | |
| 5. Salmon | 800 | 8.7 | |
| Non-Hispanic White | 1. Shrimp | 1,384 | 26.0 |
| 2. Tuna | 1,174 | 16.6 | |
| 3. Salmon | 801 | 12.6 | |
| 4. Breaded fish | 617 | 8.1 | |
| 5. Crab | 322 | 5.7 | |
| Other Race, Multiracial | 1. Shrimp | 552 | 34.6 |
| 2. Salmon | 397 | 15.0 | |
| 3. Tuna | 291 | 12.2 | |
| 4. Breaded fish | 171 | 6.2 | |
| 5. Cod | 127 | 6.1 |
NOTE: See NHANES Data Analysis Methodology in Appendix E.
SOURCE: NHANES cycle years 2011–2012 through 2017–March 2020.
TABLE 3-10 Weighted Seafood Meal Frequency, U.S. Children, 12–24 Months
| n, Weighted | 0 Meals per Month, Percent (n) | Less Than 2 Meals per Week, Percent (n) | 2 or More Meals per Week, Percent (n) | Portion Size from 24-Hour Recall, Grams Mean (SD) | Unweighted n for Portion Size Analysis (n) | |
| Overall | 3,786,018 | 45 (438) | 51 (466) | 3.8 (47) | N/A | N/A |
| Age (months) | ||||||
| 12–14 | 836,724 | 53 (116) | 43 (92) | 3.7 (7) | 45.1 (47.3) | 32 |
| 15–17 | 1,049,177 | 44 (120) | 52 (122) | 4.0 (11) | 33.3 (28.1) | 28 |
| 18–20 | 908,120 | 40 (94) | 57 (122) | 2.6 (15) | 36.0 (33.9) | 39 |
| 21–24 | 991,997 | 42 (108) | 53 (130) | 4.7 (14) | 39.4 (29.7) | 36 |
NOTES: n = sample size; SD = standard deviation. Values in parentheses are unweighted sample sizes. Seafood frequency measured using a 30-day food frequency questionnaire based on the total number of meals per month for all seafood species. Respondents not reporting food frequency are not presented in this table. Infants less than 12 months are not included in NHANES data collection, and for older children, parents, or other proxies report consumption of seafood on the child’s behalf. See NHANES Data Analysis Methodology in Appendix E.
SOURCE: NHANES cycle years 2011–2012 through 2017–March 2020.
TABLE 3-11 Weighted Average Number of Seafood Meals Per Month, U.S. children, 12–24 Months
| n, Weighted | n, Unweighted | Number of Seafood Meals (average per month) | SE | |
| Overall | 3,786,018 | 951 | 1.78 | 0.13 |
| Age (months) | ||||
| 12–14 | 836,724 | 215 | 1.67 | 0.21 |
| 15–17 | 1,049,177 | 253 | 1.81 | 0.22 |
| 18–20 | 908,120 | 231 | 1.79 | 0.20 |
| 21–24 | 991,997 | 252 | 1.82 | 0.23 |
NOTES: n = sample size; SE = standard error. Average number of seafood meals measured using a 30-day food frequency questionnaire based on the total number of meals per month for all seafood species. Infants less than 12 months are not included in NHANES data collection, and for older children, parents, or other proxies report consumption of seafood on the child’s behalf. See NHANES Data Analysis Methodology in Appendix E.
SOURCE: NHANES cycle years 2011–2012 through 2017–March 2020.
TABLE 3-12 Weighted Seafood Meal Frequency, U.S. children, 2–19 Years
| n, Weighted | 0 Meals per Month, Percent (n) | Less than 2 Meals per Week, Percent (n) | 2 or more Meals per Week, Percent (n) | |
| Overall | 74,270,808 | 43 (5,372) | 51 (6,631) | 6.4 (926) |
| Males (years) | ||||
| 2–5 | 7,908,059 | 46 (698) | 49 (735) | 5.9 (103) |
| 6–11 | 12,925,783 | 43 (945) | 50 (1,185) | 6.9 (164) |
| 12–19 | 17,022,525 | 42 (1,131) | 51 (1,364) | 7.0 (199) |
| Females (years) | ||||
| 2–5 | 8,029,348 | 39 (602) | 55 (828) | 5.9 (124) |
| 6–11 | 11,739,998 | 43 (909) | 52 (1,183) | 5.7 (163) |
| 12–19 | 16,645,096 | 44 (1,087) | 50 (1,336) | 6.2 (173) |
| Race/Ethnicity | ||||
| Hispanic | 17,869,766 | 44 (1,734) | 50 (1,936) | 5.4 (186) |
| Non-Hispanic Asian | 3,428,654 | 31 (343) | 50 (574) | 19 (234) |
| Non-Hispanic White | 10,429,463 | 36 (1,186) | 56 (1,896) | 8.1 (274) |
| Non-Hispanic Black | 38,447,678 | 45 (1,708) | 50 (1,762) | 5.0 (159) |
| Other | 4,095,247 | 43 (401) | 48 (463) | 9.1 (73) |
| Income (IPR) | ||||
| Less than 1.3 | 25,389,481 | 46 (2,488) | 49 (2,788) | 5.7 (325) |
| 1.3–4.99 | 37,715,367 | 43 (2,448) | 51 (3,172) | 5.8 (455) |
| 5+ | 11,165,960 | 36 (436) | 54 (671) | 9.8 (146) |
NOTES: IPR = income-to-poverty ratio. Values in parentheses are unweighted sample sizes. Seafood frequency measured using a 30-day food frequency questionnaire based on the total number of meals per month for all seafood species. Respondents not reporting food frequency are not presented in this table; n = sample size. See NHANES Data Analysis Methodology in Appendix E.
SOURCE: NHANES cycle years 2011–2012 through 2017–March 2020.
at least two seafood meals per week compared with 5.9 percent of males aged 2–5 and 6.2 percent of females aged 12–19. Clear differences existed, however, among racial and ethnic groups as well as by income groups. As with women of childbearing age, non-Hispanic Asian children were most likely (19 percent) to consume at least two seafood meals per week, and Hispanic (5.4 percent) and non-Hispanic Black children (5.0 percent) were least likely. Frequency of seafood meals increased with increasing income.
Women of Childbearing Age and Children in Canada
In Canada, the usual fish consumption rate (UFCR) from the CCHS estimates intake (grams per day raw weight, edible portion) by age, sex, race, and ethnicity. Table 3-13 reports the usual fish consumption rate among women of childbearing age and among children and adolescents ages 2–21 years in Canada, based on UFCR data.
Women of Childbearing Age
According to the 24-hour dietary recall data collected by the 2015 CCHS, 81.8 percent of women of childbearing age did not consume fish, and fewer than 5 percent consumed at least two servings of fish per week (Table 3-13). The median intake was 10.3 g (0.4 oz)/day for the population and 79.7 g (2.8 oz)/day for fish consumers. Asian population groups consumed more fish, 13.5 g (0.5 oz)/day, compared with White Canadians, 8.5 g (0.3 oz)/day. Individuals of other racial and ethnic identities combined consumed the most fish, 25 g (0.9 oz)/day.
Table 3-14 presents the most frequently consumed species of seafood among women of childbearing age, children, and adolescents in Canada. These species include marine fish such as cod, haddock, salmon, and tuna; freshwater fish such as tilapia and trout; and shellfish such as clam, crab, lobster, and shrimp. Salmon is the most frequently consumed species among consumers of seafood, reported by 5.3 percent of women of childbearing age and 3.8 percent of children and adolescents. Overall, consumers of seafood reported eating approximately 36–100 g of seafood per day. The highest rate of population intake is for salmon at 5.0 g/day for women of childbearing age and 2.9 g/day for children and adolescents.
Children and Adolescents
UFCR data indicate that 87.2 percent of children in Canada did not consume fish, and only 5.0 percent consumed at least two servings per week, similar to the 6.4 percent reported for U.S. children (Table 3-13). The median fish consumption rate was 6.2 g (0.2 oz)/day for all children, and 72.3 g (2.6 oz)/day among consumers of fish, with differences between males and females. The percent of children who consume fish was highest (19.7 percent) among young children (2–3 years old) compared to older children and adolescents. The median fish consumption rate increased with age among consumers of fish, and more Asian Canadian children consumed fish (20 percent) compared with White (10.2 percent) and “Others” (unspecified racial/ethnic group) (13.1 percent). Table 3-13 reports consumption amounts for the overall population, as well as among seafood consumers.
The most frequently consumed species of seafood among children and adolescents are similar to those reported by the Canadian general population (Table 3-2). Five percent or fewer of women of childbearing age and children reported consuming at least two servings of fish per week (Table 3-13). Salmon is the most frequently consumed fish by women of childbearing age, children, and adolescents, followed by tuna, shrimp, cod, and crab. Women of childbearing age had higher intakes than children and adolescents for all the most frequently consumed species, except for tilapia and trout.
Summary of Evidence on Fish and Seafood Intake by Age and Sex Group
Taken together, the evidence indicates that few women of childbearing age, children, and adolescents in the United States and Canada consume the Dietary Guidelines for Americans 2020–2025 (DGA)-recommended two or more servings of fish per week. Both the type and amount of fish consumed vary by race and ethnicity, as well as income, among women of childbearing age, children, and adolescents; age and sex are not strong drivers of fish consumption among children.
TABLE 3-13 Usual Fish Consumption Rate (UFCR), Women of Childbearing Age and Children in Canada by Age, Sex, Race, and Ethnicity, 2015
| Population Size (in 1,000s) | Percent Never Consuming Fish | Percent Consuming at Least 2 Servings per Week (40 day) | Estimated Consumption (day) at Selected Percentiles of Intake (whole population) | Estimated Consumption (day) at Selected Percentiles of Intake (fish consumers only) | |||||
| Population | 5th | 50th | 95th | 10th | 50th | 90th | |||
| Women of Childbearing Age (13–49 years) | |||||||||
| All females of childbearing age | 8,266 | 81.8 | 4.6 | 2.5 | 10.3 | 36.4 | 68.9 | 79.7 | 103.8 |
| Race and Ethnicitya | |||||||||
| Caucasian | 5,466 | 85.3 | 0.8 | 2.1 | 8.3 | 26.4 | 68.4 | 76.5 | 101.3 |
| Asian | 4,865 | 77.7 | 3.4 | 3.7 | 13.5 | 36.8 | 72.9 | 79.9 | 86.5 |
| Others | 896 | 69.3 | 21.1 | 7.6 | 25.0 | 58.4 | 83.0 | 91.5 | 120.4 |
| Geographic Region | |||||||||
| Coastal provinces | 1,586 | 83.5 | 2.9 | 2.4 | 9.5 | 31.3 | 68.9 | 76.6 | 101.9 |
| Noncoastal provinces | 6,640 | 81.5 | 4.0 | 2.5 | 10.5 | 37.6 | 69.4 | 81.0 | 104.1 |
| Prairies | 1,544 | 85.0 | 1.7 | 2.1 | 8.6 | 31.3 | 69.5 | 77.9 | 101.4 |
| Ontario | 3,249 | 82.2 | 3.8 | 2.4 | 10.1 | 37.0 | 75.6 | 82.9 | 113.5 |
| Quebec | 1,847 | 77.1 | 6.4 | 3.5 | 13.6 | 43.4 | 68.2 | 77.3 | 101.0 |
| Adolescents | |||||||||
| All adolescents (less than 21 years) | 7,296 | 87.2 | 5.0 | 0.7 | 6.2 | 39.9 | 33.3 | 72.3 | 145.6 |
| Children Age (years) | |||||||||
| 2 –3 | 804 | 80.3 | 3.0 | 0.8 | 6.3 | 32.9 | 24.4 | 49.9 | 93.2 |
| 4–8 | 1,901 | 87.4 | 2.2 | 0.6 | 4.7 | 28.4 | 29.7 | 58.9 | 106.4 |
| 9–13 | 1,796 | 89.0 | 1.8 | 0.5 | 4.3 | 26.5 | 31.1 | 61.9 | 112.8 |
| 14–18 | 1,843 | 87.4 | 7.1 | 1.0 | 8.1 | 46.6 | 50.8 | 95.7 | 169.9 |
| 19–21 | 953 | 88.5 | 14.0 | 1.5 | 12.3 | 65.7 | 63.5 | 119.3 | 208.2 |
| Sex | |||||||||
| Female | 3,643 | 86.2 | 5.1 | 0.7 | 6.1 | 40.3 | 33.3 | 72.6 | 146.1 |
| Male | 3,653 | 88.1 | 4.9 | 0.7 | 6.2 | 39.6 | 33.3 | 71.9 | 145.0 |
| Race and Ethnicitya | |||||||||
| Caucasian | 4,654 | 89.8 | 3.2 | 0.6 | 5.1 | 32.4 | 34.3 | 74.6 | 148.0 |
| Asian | 1,697 | 80.0 | 11.2 | 1.5 | 11.3 | 58.0 | 35.2 | 75.0 | 150.0 |
| Others | 945 | 86.9 | 2.9 | 0.7 | 5.3 | 31.7 | 26.3 | 57.7 | 116.3 |
| Geographic Region | |||||||||
| Coastal provinces | 1,348 | 84.9 | 6.8 | 0.9 | 7.5 | 46.3 | 36.5 | 79.7 | 157.5 |
| Noncoastal provinces | 5,948 | 87.7 | 4.6 | 0.7 | 5.9 | 38.4 | 32.4 | 70.0 | 141.6 |
| Prairies | 1,410 | 91.4 | 2.1 | 0.4 | 7.5 | 27.0 | 29.5 | 63.5 | 129.3 |
| Ontario | 2,948 | 87.0 | 5.2 | 0.8 | 6.4 | 40.8 | 31.7 | 68.2 | 135.9 |
| Quebec | 1,590 | 85.7 | 5.7 | 1.0 | 7.4 | 42.2 | 36.4 | 77.8 | 156.7 |
NOTE: The age range for women of childbearing age is different in Canada compared to U.S. data collected through NHANES.
a Race/ethnic categories as defined in Canadian Community Health Survey.
SOURCE: Canadian Community Health Survey, 2015 (Statistics Canada, 2015).
TABLE 3-14 Most Commonly Consumed Seafood Species, Women of Childbearing Age, Children, and Adolescents in Canada
| Women of Childbearing Age | Children and Adolescents (2–21 years) | |||||
| Species | Population Intake, g/day (SE) | Seafood Consumers, Percent (SE) | Intake Among Seafood Consumers, g/day (SE) | Population Intake, g/day (SE) | Seafood Consumer, Percent (SE) | Intake Among Seafood Consumers, g/day (SE) |
| Clam | 0.11 (0.06) | 0.14 (0.05) | 76.36 (22.31) | 0.08 (0.05) | 0.08 (0.04) | 90.98 (28.31) |
| Cod | 1.53 (0.51) | 2.42 (0.59) | 63.20 (17.58) | 0.76 (0.15) | 1.91 (0.36) | 39.80 (8.06) |
| Crab | 1.09 (0.30) | 2.32 (0.50) | 47.03 (15.57) | 0.62 (0.19) | 1.34 (0.30) | 46.27 (13.15) |
| Haddock | 0.41 (0.15) | 0.68 (0.20) | 60.86 (19.57) | 0.35 (0.14) | 0.48 (0.14) | 74.07 (22.12) |
| Lobster | 0.63 (0.28) | 0.64 (0.29) | 99.26 (31.80) | 0.23 (0.07) | 0.48 (0.22) | 48.40 (34.14) |
| Salmon | 5.00 (0.76) | 5.31 (0.61) | 94.23 (9.71) | 2.93 (0.47) | 3.81 (0.44) | 76.71 (8.02) |
| Shrimp | 1.50 (0.25) | 4.14 (0.61) | 36.24 (5.47) | 1.36 (0.34) | 3.01 (0.42) | 45.11 (8.35) |
| Tilapia | 0.33 (0.14) | 0.60 (0.23) | 54.48 (17.12) | 0.54 (0.22) | 0.63 (0.17) | 84.90 (25.47) |
| Trout | 0.16 (0.06) | 0.19 (0.06) | 87.09 (18.92) | 0.23 (0.11) | 0.27 (0.12) | 86.01 (22.89) |
| Tuna | 1.96 (0.33) | 3.69 (0.54) | 53.03 (5.88) | 1.31 (0.21) | 2.85 (0.38) | 46.10 (5.13) |
NOTE: g = grams; SE = standard error.
SOURCE: Canadian Community Health Survey, 2015. CCHS day 1 24-hour dietary recall analysis (Statistics Canada, 2015).
FACTORS INFLUENCING SEAFOOD CONSUMPTION
Geographic, sociocultural, and economic factors affect an individual’s decision to consume seafood. An understanding of the array of factors that influence the decisions to consume seafood can inform strategies to advise consumers about benefits and risks associated with seafood consumption.
Govzman et al. (2021) aimed to identify the main drivers and barriers to fish consumption as well as consumers’ perceptions about attributes of fish and seafood products in developed countries (Canada, United States, Australia, and European countries). The systematic review identified the main drivers of fish consumption as perceived health benefits, influences from family and social norms, availability of fresh seafood, and personal preferences. Although fish and seafood were commonly perceived as healthy foods, those perceptions alone were insufficient to explain variation in fish consumption because individual characteristics, such as interest in healthy eating, were also found to be important drivers.
The most frequently reported barriers included sensory dislike of fish, lack of convenience, health risk concerns, lack of self-efficacy in the choice and preparation of fish, lack of fish availability, and high prices of fish. Additional literature reviewed by the committee suggests that certain attributes such as quality, origin, and ecolabeling are factors that consumers value when selecting a type of seafood for purchase (Del Giudice et al., 2018; Dey et al., 2017; McClenachan et al., 2016; Nguyen et al., 2023). Consumption habits also emerged as an important factor in determining those who did and did not regularly consume fish (Honkanen et al., 2005).
Cultural and Lifestyle Factors
Multiple cultural and lifestyle factors influence seafood selection and consumption. For example, immigrants often use recipes and preparation methods derived from their home country’s cuisine and cooking practices. For recreational fishers, species of fish consumed may not reflect the same species available in the commercial marketplace. Economic factors, including the affordability of culturally appropriate seafood, may affect where people acquire or purchase seafood (Govzman et al., 2021; Judd et al., 2004).
Ethnicity
Certain ethnic groups have been reported to consume more fish than the national average. For example, Jahns et al. (2014) used NHANES data from 2005 to 2010 to show that non-Hispanic Black adults reported the highest fish consumption, and Mexican American adults reported the highest shellfish consumption compared with other racial and ethnic groups. Differences were not statistically significant, however, across racial or ethnic groups.
He et al. (2021) surveyed 103 Burmese refugees resettled in Wisconsin and found that most (72.5 percent) were women of childbearing age. About 30.6 percent reported consuming one to three meals of sport-caught fish per month, while 21.2 percent reported consuming more than three meals of such fish per month. When surveying the consumption of purchased fish, 26.3 percent reported eating one to three fish meals per month. Meanwhile, 88.3 percent were unaware of Wisconsin’s safe-eating sportfish guidelines, and 96.6 percent were unaware of the guidelines for Milwaukee’s waterbodies.
Tsuchiya et al. (2008) investigated the fish consumption rate among 108 Korean and 106 Japanese women living in Washington State. This study found that both Korean and Japanese women of childbearing age consumed amounts of fish that exceeded the national average. U.S. consumers of fish reported mean values of less than 20 g/day, whereas the Japanese and Korean cohorts had significantly higher mean values (73 and 82 g/day, respectively). Mean consumption values for the Koreans and Japanese approached or exceeded the 95th percentile intake for NHANES and the Continuing Survey of Food Intake of Individuals (CSFII) distributions (Tsuchiya et al., 2008). Among Canadian population groups, Hu and Chan (2020) also found that Asian and other ethnic groups had a higher average fish consumption rate (24 and 22 percent, respectively) than did Whites (15 percent).
Evidence from an analysis of familial eating habits of Hispanic parents and caregivers suggests that low intake of seafood in this adult population may be influenced by limited knowledge and ability to prepare fish as well as a lack of family members and caregivers who are a role model for recommended seafood consumption (Santiago-Torres et al., 2014). In addition, seafood preferences can evolve with increasing exposure to other cuisines, changes in local culture, and fewer family meals. These factors may contribute to the low intake of fish observed among Hispanic children, despite a traditionally high fish intake in this population (Huss et al., 2013; Santiago-Torres et al., 2014).
Oken et al. (2023) analyzed data from 10,800 pregnant women who gave birth from 1999 to 2020 and were enrolled across 23 cohorts participating in the Environmental Influences on Child Health Outcomes (ECHO) consortium. About 40 percent of participants reported consuming fish less than once per week, followed by 24 percent who reported consuming fish never or less than once per month, and about 22 percent who reported consuming fish one to two times per week. Respondents with the highest reported fish consumption (about 13 percent) ate fish at least twice per week. The relative risk of ever (vs. never) consuming fish was higher among those who were older (1.14, 95% confidence interval [CI]: 1.10, 1.18 for 35–40 years vs. < 29 years) or who did not identify as non-Hispanic White (1.13, 95% CI: 1.08, 1.18 for non-Hispanic Black; 1.05, 95% CI: 1.01, 1.10 for non-Hispanic Asian; 1.06, 95% CI: 1.02, 1.10 for Hispanic).
Native Tribes and Indigenous Peoples
For many Native tribes and Indigenous peoples, traditional preparation (e.g., smoking) and sourcing (e.g., using nets in rivers at specific locations) methods are dictated by intergenerational practices. Judd et al. (2004) reviewed rates and patterns of fish and shellfish consumption among the Native tribes in the Pacific Northwest that reported much higher average consumption rates than did the total U.S. population. For example, the average Squamish tribal member reported consuming 25 times the amount of shellfish compared with the national average. Native tribes also reported eating different species and parts of seafood (e.g., hepatopancreas of crab and skin and eggs of fish) compared with the total U.S. population.
Marushka et al. (2021) analyzed data from 6,258 participants in 92 First Nations across Canada, collected for the First Nations, Nutrition and Environment Study (2008–2018). They found that 95 percent of participating First Nations adults reported consuming at least one locally harvested traditional food in the previous year, and about 71 percent reported consuming fish or seafood. First Nations participants also reported eating 15.4 grams
(0.54 oz) of fish or seafood per day whereas participants in remote fly-in only communities reported consuming 23.6 g (0.83 oz)/day of fish or seafood. Earlier studies also found variety in species of fish consumed among different First Nations groups. For example, the most frequently consumed seafood types in British Columbia were sockeye salmon, chinook salmon, and halibut, compared with walleye, lake whitefish, and lake trout in Ontario (Marushka et al., 2017, 2018).
Recreational Fishers
Patterns of fish consumption differ between recreational fishers (also known as anglers) and the general population. For example, a review of recreational fishing and its contribution to nutrition at regional, national, and international levels reported that recreational fishing in the United States in 2004 accounted for 10 percent of the total commercial, industrial, recreational, and subsistence harvest of 4,995,418 tons (Cooke et al., 2017). Additionally, recreational harvest included 396,242 tons from inland waters and 103,779 tons from marine waters. As a result, recreational anglers (who represent about 9.3 percent of the population) had access to 7.3 kg of edible fish per angler per year (Cooke et al., 2017).
Comparable values reported for Canada in 2010 indicated that recreational fishers (9 percent of the population) harvested a total of 35,941 tons of fish including 22,758 tons from inland waters. Recreational harvest represented 3.7 percent of total harvest (commercial, industrial, recreational, and subsistence), contributing 4.7 kg of edible fish per angler per year (Cooke et al., 2017). Thus, this type of fishing is not only pursued for recreational purposes but also can provide accessible and affordable seafood.
Cost
Love et al. (2022) analyzed NHANES data and found that low-income groups consume less seafood than high-income groups. Low-income groups consumed substantially less n-3 LCPUFA-rich seafood compared with high-income groups. The committee’s analysis of NHANES 2011–2020 data reinforced the finding that the types of fish consumed by women of childbearing age varies with income (Table 3-15). For example, tuna is the second most consumed seafood species by those whose income is less than 1.3 times the income-to-poverty ratio (IPR), but it is the third most consumed by those whose income was more.
Another analysis of NHANES data from 2005–2010 found that a lower odds of seafood consumption was associated with participants who were younger, had lower incomes, and had lower education levels (Jahns et al., 2014).
TABLE 3-15 Seafood Species Commonly Consumed, U.S. Women of Childbearing Age, by Income-to-Poverty Ratio
| Income-to-Poverty Ratio | Seafood Species | Sample Size (n) | Frequency, Weighted (percent) |
|---|---|---|---|
| Less than 1.30 | 1. Shrimp | 1. 2,741 | 1. 30.7 |
| 2. Tuna | 2. 1,550 | 2. 14.3 | |
| 3. Salmon | 3. 1,074 | 3. 10.8 | |
| 4. Other fish | 4. 1,072 | 4. 8.4 | |
| 5. Crab | 5. 512 | 5. 6.3 | |
| 1.30–4.99 | 1. Shrimp | 1. 3,997 | 1. 29.4 |
| 2. Salmon | 2. 2,147 | 2. 16.6 | |
| 3. Tuna | 3. 2,237 | 3. 16.2 | |
| 4. Other fish | 4. 1,393 | 4. 7.2 | |
| 5. Crab | 5. 766 | 5. 5.2 | |
| 5.0 | 1. Shrimp | 1. 1,648 | 1. 26.2 |
| 2. Salmon | 2. 1,309 | 2. 17.0 | |
| 3. Tuna | 3. 941 | 3. 15.2 | |
| 4. Other fish | 4. 546 | 4. 4.6 | |
| 5. Crab | 5. 364 | 5. 4.1 |
SOURCE: NHANES 2011−2012 through 2017−March 2020.
Little evidence is available on access to seafood among low-income women, but potential contributing factors to lower access include lack of physical access to acquire seafood from local vendors, low quality of available seafood, and the higher cost of some fatty fish compared with, for example, processed meats (Jones et al., 2014).
Nguyen et al. (2023) examined perceptions of U.S. consumers in terms of specific safety, health, and environment-related attributes of a seafood entrée served at restaurants, as well as how those perceptions are associated with socioeconomic and demographic characteristics. Most participants expressed a positive perception about farm-raised and sustainability-certified fish. However, the difference in perceptions were found to be ambiguous for domestic and imported fish, while perceptions of nutritional value were neutral. The primary determinants of consumer perceptions included frequency of seafood consumption and demographic characteristics, including sex, ethnicity, age, and the number of children in a household.
Brockington et al. (2023) conducted a scoping review of the literature to identify barriers and pathways linking fish as a seafood to food security among Inuit Nunangat populations in the Northwest Territories. They identified direct pathways, such as intra- and intercommunity food and knowledge networks, which increased access to fish; and indirect pathways, such as fisheries’ efforts to increase household purchasing power, including employment opportunities in the fishing industry. Barriers linking seafood to food security included climate change, socioeconomic change, and the sustainability and stability of fisheries and fish-related community programs. To support the role of seafood in promoting food security in this population, the investigators suggested the improvement of metrics, shared management of fisheries resources, and an integrated policy framework.
Knowledge
The Dietary Guidelines for Americans (DGA)8 are published every 5 years and provide advice on what to eat and drink to meet nutrient needs, promote health, and prevent disease, as well as form the basis of federal food and nutrition guidance, policies, and programs. They are also a resource for state and local governments, schools, the food industry, other businesses, community groups, and media to develop programs, policies, and communication for the general public. Similarly, Canada’s Dietary Guidelines are written for professional audiences and serve as a resource for nutrition policies, programs, and educational resources for the Canadian population 2 years of age and older.9 Both the U.S. and Canadian dietary guidelines recommend eating fish as part of a healthy eating pattern.
The committee did not identify any research evaluating the role of knowledge of dietary guidelines in relation to fish consumption by women or children. The specific guidance for fish consumption during pregnancy and childhood included in the DGA derives from guidance put out by the U.S. Environmental Protection Agency (EPA) and the U.S. Food and Drug Administration (FDA) titled Advice “About Eating Fish for Those Who Might Become Pregnant, Are Pregnant, or Breastfeeding, and Children.”10 The committee did not identify any recent studies evaluating knowledge of the most recent FDA/EPA Fish Advice. However, a 2004 survey conducted in New Jersey found no sex differences in awareness of the then-current FDA advisories, although differences by ethnicity were found. Specifically, a lower percentage of Asian people were aware of the advisories, and fewer Black people knew that there were benefits from consuming fish, compared with people from other ethnic groups. Awareness of both the benefits and risks of consuming fish was lower for people aged 21–45 years compared with older people (Burger, 2005).
In a follow-up cross-sectional study in a similar population, the greatest decrease in fish consumption was reported between 2004 and 2007, from an average of nearly eight meals per month in 2004 to approximately six meals per month in 2007 (Burger, 2008). This suggests that some of the warnings and advisories may have had the unintended effect of decreasing overall fish consumption rather than reducing consumption of fish species known to have high contamination levels and switching to fish species with low contamination levels.
A 2008 study among people in three coastal regions of the New York Bight11 found that a far greater percentage of participants reported hearing nonspecific information about risks and benefits of eating fish than the percentage
___________________
8Available at https://www.dietaryguidelines.gov/ (accessed February 25, 2024).
9Available at https://food-guide.canada.ca/en/guidelines/#CDG-sections (accessed February 25, 2024).
10Available at https://www.fda.gov/food/consumers/advice-about-eating-fish (accessed February 25, 2024).
11The New York Bight runs along the east coast of the United States and encompasses an area that extends out from the New York–New Jersey shore to the eastern limit of Long Island and down to the southern tip of New Jersey.
who reported hearing any specific information about risks or benefits of eating fish (Burger and Gochfeld, 2009). The authors concluded that the lack of details in current fish advisories was a major component of ineffective communication.
Another study used nationally representative data pooled from the 2001 and 2006 U.S. Food Safety Surveys to examine changes in awareness and knowledge of mercury as a potential problem of contamination in fish. The study results indicated that consumers’ awareness increased from 69 percent in 2001 to 80 percent in 2006. Significant predictors for consumers’ awareness and knowledge included demographic characteristics (i.e., race, education, and income), region, fish preparation experiences, previous recent foodborne illness, and risk perceptions of food safety (Lando and Zhang, 2011).
In a qualitative study of pregnant women from Massachusetts, Bloomingdale et al. (2010) found that many women had knowledge that fish may contain mercury and had received advice to limit their fish consumption. Fewer women had prior knowledge that fish contains DHA or knew its function. None of the women had been advised to consume fish, and most had not been informed about the different types of fish containing lower levels of contaminants (e.g., mercury) and higher levels of DHA. Many of the women reported that they preferred to avoid fish rather than risk harm to themselves or their infants because they had received advice to limit fish intake and had been provided limited information about which types of fish they should consume (Bloomingdale et al., 2010).
Preparation Skills
Burns et al. (2023) examined whether parental confidence in preparing fish and seafood are associated with frequency of fish and seafood consumption in Canadian children. The investigators collected cross-sectional data from 28 parents (of 40 children) participating in the Guelph Family Health Study pilot, a longitudinal family-based cohort. The parents indicated that all children consumed fish and seafood at least once per year and 63 percent consumed fish and seafood at least monthly. Results of the analysis showed that the parent’s cooking confidence was significantly and positively associated with the child’s monthly fish and seafood consumption.
Sushi is gaining popularity in some North American subpopulations and can be an important source of seafood intake. Sushi is a preparation method that includes one or more of the fish types identified in Tables 3-4 and 3-7. A meal of eight sushi pieces for adults and adolescents could amount to an intake of 84 grams of fish, and three sushi pieces for children could amount to 31.5 grams of fish (González et al., 2021). Karimi et al. (2014) showed that tuna was consumed as steak, fillet, or sushi at least weekly by 34 percent of those surveyed in an adult population in New York.
Summary of Evidence on Factors Influencing Seafood Consumption
In summary, results from specific populations (e.g., Burmese refugees living in Wisconsin) have limited generalizability, but it is clear that amounts and types of seafood consumed vary widely across populations. Cultural traditions involving seafood and knowledge of seafood preparation methods are factors associated with greater seafood consumption. Recreational fishers are also likely to consume seafood more frequently than other populations. Individuals with lower household incomes may tend to eat fish less frequently and consume fish that are less rich in n-3 LCPUFAs, important nutrients whose roles in health are detailed in Chapter 4.
Insufficient information is available about awareness of fish consumption guidelines for women of childbearing age and children to determine any association with consumption of seafood; some evidence from previous decades suggested that no association existed between consumer awareness about prior editions of fish consumption guidelines and consumption of seafood.
SEAFOOD CONSUMPTION BY SETTING
To understand seafood consumption by setting among women of childbearing age, children, and adolescents, the committee evaluated results from analyses of NHANES 2011–2020 24-hour dietary recalls and examined evidence from the peer-reviewed published literature. The committee first discusses results from the NHANES analyses, then describes evidence from the peer-reviewed published literature.
NHANES Analyses
The committee commissioned the Johns Hopkins Center for a Livable Future at the Bloomberg School of Public Health to conduct analyses of data from NHANES 2011–2012 to 2017–March 2020 for women of childbearing age and children and adolescents up to age 19 years. The following sections report analyses of seafood consumption by these age and life-stage groups by setting.
Women of Childbearing Age
For U.S. women of childbearing age, dinner (62 percent of seafood meals) and lunch (32 percent of seafood meals) are the meal types most likely to include seafood. Together, these two meals account for 94 percent of meals at which seafood is consumed (Table 3-16). Hispanic women are somewhat more likely to consume seafood at breakfast (8 percent of seafood meals with 3 percent among all women) or lunch (45 percent vs. 32 percent among all women). No marked differences by income level were observed.
Table 3-17 shows that seafood consumption among U.S. women is primarily based on seafood purchased at retail outlets (60 percent) and from restaurants or food service locations (25 percent). All other food sources combined contribute 15 percent. A higher proportion of seafood was consumed at restaurants by non-Hispanic White (33 percent) and non-Hispanic Asian (28 percent) women compared with Hispanic (22 percent) women, non-Hispanic Black (15 percent) women, or women of another race or ethnicity (24 percent). Women with higher incomes also consumed a higher proportion of seafood meals in restaurant settings.
Children and Adolescents
For U.S. children, dinner (58 percent of seafood meals) and lunch (36 percent of seafood meals) are the meal types most likely to include seafood. Together, these two meals account for 94 percent of meals at which seafood is consumed (Table 3-18).
TABLE 3-16 Seafood Consumption by Meal Type, Women of Childbearing Age
| n, weighted | Dinner, Percent (n) | Lunch, Percent (n) | Breakfast, Percent (n) | Other, Percent (n) | |
| Overall | 22,549,512 | 62 (1,174) | 32 (837) | 3 (90) | 3 (122) |
| Race/Ethnicity | |||||
| Hispanic | 4,612,582 | 44 (216) | 45 (240) | 8 (27) | 3 (30) |
| Non-Hispanic Asian | 2,788,786 | 67 (241) | 28 (175) | 3 (23) | 2 (18) |
| Non-Hispanic White | 9,915,554 | 68 (273) | 28 (177) | 0 (6) | 3 (21) |
| Non-Hispanic Black | 4,347,238 | 59 (382) | 34 (219) | 2 (31) | 5 (47) |
| Other | 885,352 | 81 (62) | 16 (26) | 1 (3) | 2 (6) |
| Income (IPR) | |||||
| Less than 1.3 | 5,856,109 | 60 (356) | 34 (268) | 3 (33) | 3 (39) |
| 1.3–4.99 | 11,870,966 | 61 (608) | 32 (431) | 3 (45) | 4 (66) |
| 5.0+ | 4,822,437 | 66 (210) | 31 (138) | 2 (12) | 2 (17) |
NOTES: IPR = income-to-poverty ratio; n = sample size. Values in parentheses are unweighted sample sizes. Some rows sum to greater than 100 percent because of rounding.
SOURCE: NHANES 2011−2012 through 2017−March 2020, days 1 and 2.
TABLE 3-17 Food Source of Seafood, Women of Childbearing Age, Overall and by Race/Ethnicity and Income
| n, Weighted | Retail, Percent (n) | Restaurant or Food Service, Percent (n) | Restaurant Fast Food/Pizza, Percent (n) | From Someone Else/Gift, Percent (n) | Caught by You or Someone You Know, Percent (n) | Other, Percent (n) | |
| Overall | 23,430,754 | 60 (1265) | 25 (601) | 9 (294) | 5 (130) | 1 (20) | 1 (20) |
| Race/Ethnicity | |||||||
| Hispanic | 4,705,268 | 60 (298) | 22 (119) | 10 (63) | 7 (36) | 1 (5) | 1 (6) |
| Non-Hispanic Asian | 2,983,538 | 60 (279) | 28 (145) | 6 (33) | 4 (24) | 1 (4) | 1 (6) |
| Non-Hispanic Black | 4,572,743 | 66 (360) | 15 (156) | 14 (145) | 4 (44) | 1 (5) | 1 (7) |
| Non-Hispanic White | 10,233,695 | 57 (267) | 33 (154) | 6 (45) | 3 (19) | 1 (4) | 0 (3) |
| Other | 935,509 | 63 (61) | 24 (27) | 3 (8) | 9 (7) | 1 (2) | 0 (1) |
| Income (IPR) | |||||||
| Less than 1.3 | 6,001,777 | 66 (428) | 19 (137) | 10 (102) | 4 (38) | 1 (8) | 1 (7) |
| 1.3–4.99 | 12,456,955 | 57 (619) | 26 (339) | 10 (155) | 5 (73) | 1 (11) | 1 (12) |
| 5.0+ | 4,972,022 | 60 (218) | 33 (125) | 4 (37) | 3 (19) | 0 (1) | 0 (1) |
NOTE: IPR = income-to-poverty ratio; n = sample size.
SOURCE: NHANES 2011−2012 through 2017−March 2020, days 1 and 2.
TABLE 3-18 Seafood Consumption by Meal Type, United States, Children and Adolescents, Ages 2–19
| Meal Type | Sample Size (n) | Frequency, Weighted (percent) |
|---|---|---|
| Dinner | 1,448 | 58.1 |
| Lunch | 754 | 36.3 |
| Snack | 133 | 3.4 |
| Breakfast | 72 | 2.0 |
SOURCE: NHANES 2011−2012 through 2017−March 2020.
Compared with boys, girls are more likely to consume seafood at dinner and less likely at lunch. Hispanic (42 percent), non-Hispanic Asian (38 percent), and non-Hispanic White (41 percent) children are more likely to consume seafood at lunch compared with non-Hispanic Black children (21 percent of seafood meals). Lower-income children are more likely to consume seafood at lunch than higher-income children. Among children with the lowest income-to-poverty ratio (IPR), 43 percent of seafood was consumed at lunch compared with 26 percent among those with the highest IPR (Table 3-19).
Table 3-20 shows that children’s seafood consumption is primarily based on seafood purchased at retail outlets (67 percent) and from restaurants of food service locations (21 percent). All other food sources combined contribute 12 percent. The committee notes that only 2 percent of seafood consumption by children occurs in school cafeterias. Compared with women of childbearing age, children consume a smaller proportion of seafood at restaurants. Older children consumed a higher proportion of seafood meals at restaurants, as did Hispanic (26 percent) or non-Hispanic White (23 percent) children compared with non-Hispanic Asian (17 percent) children,
TABLE 3-19 Seafood Consumption by Meal Type, U.S. Children and Adolescents, Overall and by Age Group, Race/Ethnicity, and Income
| n, Weighted | Dinner, Percent, (n) | Lunch, Percent, (n) | Breakfast, Percent, (n) | Other, Percent, (n) | |
| Overall | 11,837,188 | 58 (1,238) | 36 (663) | 2 (66) | 4 (115) |
| Males (years) | |||||
| 2–5 | 1,041,125 | 54 (127) | 45 (68) | 1 (4) | 0 (3) |
| 6–11 | 2,139,205 | 45 (227) | 49 (130) | 1 (9) | 4 (20) |
| 12–19 | 2,512,058 | 58 (240) | 37 (129) | 3 (18) | 3 (23) |
| Females (years) | |||||
| 2–5 | 1,218,328 | 48 (127) | 46 (83) | 2 (6) | 4 (13) |
| 6–11 | 1,897,216 | 62 (224) | 30 (113) | 3 (12) | 4 (24) |
| 12–19 | 3,029,256 | 67 (293) | 27 (140) | 1 (17) | 4 (32) |
| Race/Ethnicity | |||||
| Hispanic | 3,157,323 | 52 (300) | 42 (206) | 1 (16) | 5 (42) |
| Non-Hispanic Asian | 1,316,481 | 54 (221) | 38 (129) | 6 (26) | 3 (16) |
| Non-Hispanic White | 4,357,496 | 56 (214) | 41 (134) | 1 (6) | 2 (15) |
| Non-Hispanic Black | 2,344,908 | 70 (412) | 21 (165) | 3 (16) | 6 (36) |
| Other | 660,980 | 72 (91) | 24 (29) | 1 (2) | 4 (6) |
| Income (IPR) | |||||
| Less than 1.3 | 3,823,044 | 50 (457) | 43 (294) | 2 (22) | 5 (45) |
| 1.3–4.99 | 5,848,239 | 58 (607) | 35 (290) | 3 (35) | 4 (60) |
| 5+ | 2,165,905 | 71 (174) | 26 (79) | 1 (9) | 1 (10) |
NOTES: IPR = income-to-poverty ratio; n = sample size. Values in parentheses are unweighted sample sizes. Some rows sum to greater than 100 percent because of rounding.
SOURCE: NHANES 2011−2012 through 2017−March 2020.
non-Hispanic Black (12 percent) children, or children of another race or ethnicity (18 percent). Higher-income children also consumed a higher proportion of seafood meals at a restaurant.
Evidence from Peer-Reviewed Published Literature
In addition to considering data from its commissioned analyses of NHANES data, the committee reviewed relevant evidence from peer-reviewed published literature on seafood consumption by women of childbearing age and children and adolescents, by setting.
Meals Eaten Away from Home
Engle et al. (2023) examined the results of an online consumer survey on seafood purchasing behavior pre- and post-COVID-19 pandemic. Fifty percent of respondents reported consuming a similar amount of seafood before and after the pandemic, whereas 31 percent reported consuming less after the pandemic, and 19 percent reported greater post-pandemic seafood consumption. The results suggested that the pandemic may have contributed to a shift in consumers eating a greater proportions of seafood meals at home compared with away from home. Among ethnic groups, no notable differences in at-home consumption of seafood were observed.
TABLE 3-20 Food Source of Seafood, U.S. Children and Adolescents, Overall and by Age Group, Race/Ethnicity, and Income
| n, Weighted | Retail, Percent (n) | Restaurant or Food Service, Percent (n) | Restaurant Fast Food/Pizza, Percent (n) | From Someone Else/Gift, Percent (n) | Cafeteria in K–12 School, Percent (n) | Caught by You or Someone You Know, Percent (n) | Other, Percent (n) | |
| Overall | 12,061,992 | 67 (1358) | 21 (380) | 4 (144) | 4 (96) | 2 (97) | 1 (30) | 1 (31) |
| Males (years) | ||||||||
| 2–5 | 1,056,427 | 78 (147) | 9 (25) | 3 (13) | 6 (10) | 1 (7) | 1 (1) | 1 (5) |
| 6–11 | 2,182,232 | 79 (260) | 9 (55) | 3 (23) | 4 (18) | 4 (34) | 1 (6) | 0 (1) |
| 12–19 | 2,546,688 | 58 (244) | 32 (93) | 4 (41) | 4 (14) | 2 (17) | 1 (4) | 1 (7) |
| Females (years) | ||||||||
| 2–5 | 1,223,417 | 81 (168) | 5 (20) | 4 (11) | 4 (15) | 1 (4) | 3 (5) | 2 (8) |
| 6–11 | 1,945,333 | 73 (249) | 14 (60) | 5 (23) | 4 (16) | 3 (24) | 1 (6) | 1 (5) |
| 12–19 | 3,107,895 | 61 (290) | 27 (127) | 6 (33) | 4 (23) | 1 (11) | 1 (8) | 0 (5) |
| Race/Ethnicity | ||||||||
| Hispanic | 3,195,842 | 63 (356) | 26 (106) | 4 (35) | 3 (20) | 2 (37) | 2 (12) | 0 (6) |
| Non-Hispanic Asian | 1,379,615 | 68 (269) | 17 (83) | 5 (15) | 3 (17) | 3 (12) | 4 (8) | 0 (2) |
| Non-Hispanic Black | 2,418,008 | 74 (428) | 12 (86) | 7 (68) | 3 (27) | 2 (28) | 0 (2) | 1 (13) |
| Non-Hispanic White | 4,385,414 | 67 (232) | 23 (76) | 3 (13) | 5 (24) | 1 (13) | 1 (8) | 0 (7) |
| Other | 683,113 | 66 (73) | 18 (29) | 5 (13) | 7 (8) | 4 (7) | 0 (0) | 0 (3) |
| Income (IPR) | ||||||||
| Less than 1.3 | 3,904,123 | 71 (543) | 16 (118) | 5 (68) | 4 (35) | 2 (50) | 1 (12) | 1 (13) |
| 1.3–4.99 | 5,964,264 | 64 (638) | 21 (194) | 5 (64) | 5 (49) | 2 (39) | 2 (18) | 0 (16) |
| 5+ | 2,193,604 | 66 (177) | 30 (68) | 2 (12) | 1 (12) | 2 (8) | 0 (0) | 0 (2) |
NOTES: IPR = income-to-poverty ratio; n = sample size. Values in parentheses are unweighted sample sizes. Income is defined as income-to-poverty ratio. Some rows sum to greater than 100 percent because of rounding.
SOURCE: NHANES 2011−2012 through 2017−March 2020.
Love et al. (2020) used NHANES data to assess U.S. seafood consumption patterns. Adults consumed 63 percent of their total seafood intake (by weight) at home. Twenty-five percent of seafood purchased from restaurants and other locations away from home was consumed in the home rather than at the point of purchase. Seafood-based dinners were primarily consumed at home compared with seafood lunches, which were more often consumed at restaurants and other venues.
School and Childcare Settings
Seafood is also consumed by children and adolescents participating in the National School Lunch Program (NSLP). From 2014 to 2019 the USDA seafood purchases represented between 1 and 2 percent of all animal food source proteins procured annually for the NSLP. The average quantity of USDA-purchased seafood for the NSLP during this time was about 3 oz per student per year and included three varieties of seafood: Alaska pollock, canned tuna, and catfish. USDA purchased only bulk Alaska pollock and breaded catfish strips during 2014–2015, and breaded Alaska pollock fish sticks were added in 2017 in response to requests from states (GAO, 2022). Figure 3-2 shows the average quantity (oz) of seafood available per student participating in the NSLP from 2014 to 2019.
Huss et al. (2013) conducted a pilot study to assess strategies to increase dietary intake of eicosapentaenoic acid (EPA) and docosahexaenoic acid (DHA) from fatty fish among preschool-age children in childcare settings in Indiana. Their analysis found that meats, such as chicken, were usually used in the lunch meals served in childcare settings, but that fatty fish could be a replacement if incorporated into familiar, well-accepted main dishes. Because fatty fish, such as salmon, herring, and sardines, are high in EPA and DHA, even a small increase in consumption of these fish results in significantly improved EPA and DHA intake. Adding fish to mixed dishes offers an opportunity to significantly improve children’s EPA and DHA levels in childcare settings.
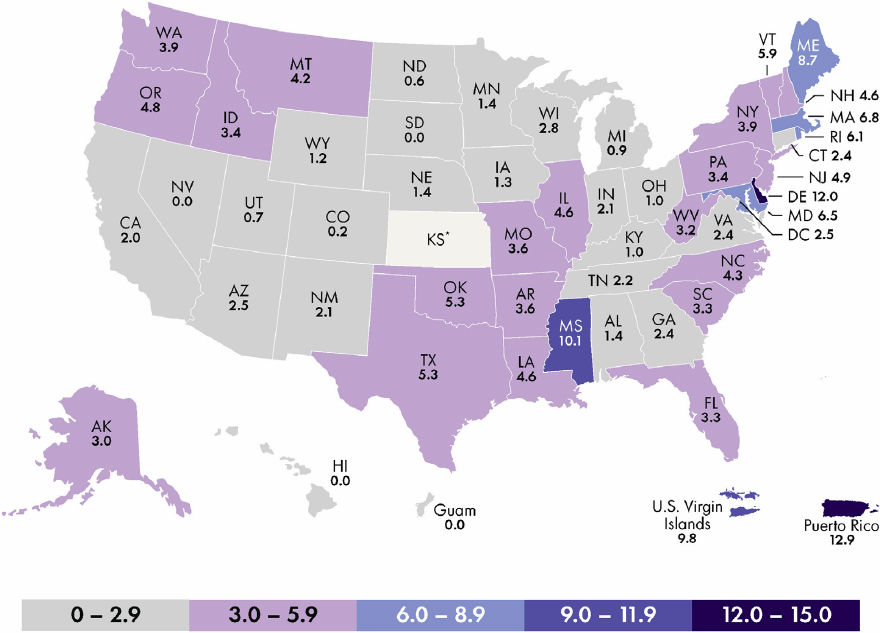
SOURCE: U.S. Government Accountability Office analysis of USDA information; Map Resources (map). GAO-23-105179.
Geographic Consumption Patterns
Patterns of fish and shellfish consumption vary by geographic location. For example, residents who live on or near a coast differ in the types and amounts of seafood consumed compared with those who live inland, or among different regions of the United States. Fish consumption patterns also vary by specific coast. Residents near the Atlantic coast, for example, may have different consumption patterns than those residing on the Gulf of Mexico. Table 3-21 shows estimates of usual fish consumption rates, by percentile, for children and adolescents ages 1–20 years across geographic regions (EPA, 2014).
Cusack et al. (2017) analyzed data on women of childbearing age from six consecutive cycles of NHANES (1999–2010 [n = 9,597]), including frequency and type of fish and shellfish consumed across the 30-day recall period. The types consumed included tuna, predator fish (shark and swordfish), marine fish (fish sticks, haddock, salmon, sardines, mackerel, porgy, sea bass, unknown, other unknown, pollock, and flatfish), freshwater (catfish, trout, bass, perch, pike, and walleye) and marine shellfish (crab, crayfish, lobster, scallops, shrimp, mussels, oyster, other shellfish, and unknown other shellfish).
Results indicated that seafood was most frequently consumed among women of childbearing age residing in the Atlantic, Gulf of Mexico, and Pacific regions (Cusack et al., 2017). In this population, shellfish was the most frequently consumed species across all regions other than noncoastal regions of the West and Midwest. Freshwater
TABLE 3-21 Usual Fish Consumption Rate Total Fish, Children and Adolescents Less Than 21 Years, by Geographic Area
| Grams/Day Raw Weight, Edible Portion, by Percentile (95% confidence interval) | ||
| 50th | 95th | |
| Youth (less than 21 years) | 4.9 (4.0, 6.1) | 34.2 (28.6, 40.8) |
| Geographic Regiona | ||
| Northeast | 5.7 (4.1, 7.8) | 40.4 (27.4, 59.6) |
| Midwest | 3.3 (2.5, 4.3) | 25.5 (21.9, 29.6) |
| South | 5.7 (4.2, 7.7) | 33.9 (27.4, 41.9) |
| West | 5.9 (4.1, 8.7) | 39.2 (27.3, 56.3) |
| Coastal Statusb | ||
| Noncoastal | 4.5 (3.5, 5.7) | 31.7 (24.3, 41.4) |
| Coastal | 5.9 (4.7, 7.4) | 38.0 (32.4, 44.6) |
| Coastal/Inland Regiona,b | ||
| Pacific | 5.9 (4.3, 8.1) | 40.2 (31.1, 52.0) |
| Atlantic | 7.2 (5.4, 9.6) | 40.3 (33.6, 48.3) |
| Gulf of Mexico | 7.0 (4.3, 11.5) | 41.5 (27.4, 62.9) |
| Great Lakes | 3.9 (2.9, 5.2) | 28.4 (21.7, 37.1) |
| Inland Northeast | 5.1 (3.6, 7.2) | 39.1 (21.7, 70.4) |
| Inland Midwest | 3.1 (2.3, 4.1) | 24.0 (20.4, 28.2) |
| Inland South | 4.9 (3.7, 6.4) | 30.3 (24.3, 37.6) |
| Inland West | 6.0 (3.5, 10.1) | 38.4 (22.2, 66.5) |
NOTE: Sample size = 13,100.
a U.S. regions are the U.S. Census Bureau regions. Midwest = OH, MI, IN, WI, IL, MO, IA, MN, SD, ND, NE, KS. Northeast = PA, NY, NJ, CT, RI, MA, NH, VT, ME. South = DE, MD, DC, VA, WV, KY, TN, NC, SC, GA, AL, MS, FL, LA, AR, OK, TX. West = NM, CO, WY, MT, ID, UT, AZ, NV, CA, OR, WA, AK, HI.
b Coastal regions include counties bordering the three coasts (Pacific, Atlantic, and Gulf of Mexico) and the Great Lakes and estuaries and bays. Additionally, any county that did not directly border a coast, but the central point was within 25 miles of a coast, was defined as coastal. The inland regions are the remaining counties in each of the four Census regions.
SOURCE: EPA, 2014.
fish was most often consumed by women living in the coastal region of the Gulf of Mexico and the least often consumed by women in the noncoastal regions of the Northeast. Marine fish were most often consumed by women living on the Pacific Coast and least often consumed by those living in the Gulf of Mexico. Consumption of tuna was similar between women in the Great Lakes, the Midwest, and noncoastal regions of the Northeast. Shellfish was the most frequently consumed species in the Gulf of Mexico and the least frequently consumed in the Great Lakes. Fewer than 1 percent of all women in all regions consumed swordfish and shark (Cusack et al., 2017).
Residents in the Great Lakes region also reported consuming high amounts of fish. A survey of 4,452 respondents representing residents in the Great Lakes basin states of Illinois, Indiana, Michigan, Minnesota, New York, Ohio, Pennsylvania, and Wisconsin in 2017 found that the majority (92 percent) of adults living in these states had eaten at least one fish meal in the previous year (He et al., 2022). Consumption of tuna was most prevalent with 78 percent of adults reporting at least one meal in the past 12 months. Consumption of any sportfish (from Great Lakes and non–Great Lakes water bodies) was reported by 28 percent (estimated 18.6 million) of adults, while 11 percent (estimated 7.1 million) of adults reported consuming Great Lakes sportfish. The majority (64 percent, estimated 42.2 million adults) consumed exclusively commercial fish, with an average of 57.64 (54.29, 61.00) meals per year. An average of 7.89 (95% CI: 6.24, 9.54) Great Lakes sportfish meals were reported to be consumed per year (He et al., 2022).
Species of fish consumed in the past 12 months by consumers of sport-caught fish were also examined with walleye accounting for about half of all reported sportfish consumption. Other species included bluegill, sunfish, or crappie (43 percent); whitefish, perch, or smelt (39 percent); bass (39 percent); and trout (34 percent). Fewer than 25 percent of respondents reported consumption of catfish, carp, chinook and Coho salmon, northern pike, and muskellunge (He et al., 2022).
Another survey, conducted in 2014 among 1,419 women of childbearing age in the Great Lakes region, found that the average fish consumption rate was 0.93 meals per week or 20.1 g (0.71 oz)/day and did not differ by state of residence (Connelly et al., 2016). Considerable variation was present in individual daily fish consumption, with half of the women eating 15.2–17.2 g (0.5–0.6 oz)/day or less, 10 percent consuming more than 35.4–38.4 g (1.2–1.4 oz)/day; and 1 percent consuming more than 67.8–73.3 g (2.4–2.6 oz)/day. Only 5 percent reported consumption levels exceeding 340 g (12 oz)/day based on the number of meals consumed. Even though women of childbearing age in the Great Lakes reported eating more fish on average than national study estimates, their reported fish consumption was below amounts recommended for obtaining the greatest health benefits from fish consumption. A small proportion of study participants (10–12 percent) reported eating within the recommended range of 8–12 oz of fish per week, with 84–87 percent eating less than the recommended amount (Connelly et al., 2016).
In Canada, UFCR data from the 2015 CCHS (Table 3-13) indicated that more children in the coastal provinces consumed fish than the national average (15.1 compared with 12.8 percent) and the fish consumers living in the coastal provinces consumed more fish than the overall fish consumers (median intake of 79.7 g [2.8 oz]/day compared with 72.3 g [2.6 oz]/day). In contrast, women of childbearing age in the noncoastal provinces of Ontario and Quebec consumed more fish than those in the coastal provinces. Among First Nations populations, mean intake of fish or seafood varied significantly across Canadian provinces, ranging from 40.8 g (1.4 oz)/day in British Columbia to 3 g (0.1 oz)/day of fish or seafood in Alberta, Canada (Marushka et al., 2021).
Summary of Evidence on Seafood Consumption by Setting
Evidence reviewed by the committee indicates that most of the seafood consumed by women of childbearing age, children, and adolescents occurs at home, at lunch and dinner meals, followed by retail establishments and less frequently, restaurant meals. School and other institutional meals provide a negligible contribution to overall seafood intake. Residence in a geographical area closer to the Atlantic, Pacific, or Gulf of Mexico coasts or to the Great Lakes was associated with greater average seafood consumption; nevertheless, few children or women in these areas consume the recommended two servings of fish per week.
FINDINGS AND CONCLUSIONS
Seafood Consumption Patterns
Findings
- Despite population-level increases in seafood disappearance during the past decade, seafood consumption among women of childbearing age and children and adolescents is generally low and has remained similar to that reported in Seafood Choices: Balancing Benefits and Risks (IOM, 2007).
- Limited evidence is available to suggest that the public is knowledgeable about both the types and amounts of seafood that are recommended for consumption by women of childbearing age and children and adolescents.
- Most of the seafood consumed by both women of childbearing age and children and adolescents comes from retail purchases and is consumed at home as part of lunch or dinner meals. School lunch is a negligible contributor of seafood to children’s diets.
Conclusions
- Most women of childbearing age and children and adolescents do not consume the recommended amounts and types of seafood. Strategies to support increasing consumption toward meeting recommendations are needed.
- Identification of strategies to overcome barriers to seafood consumption are needed so (1) individuals who consume some seafood will increase their intake toward recommended amounts, and (2) nonconsumers will begin consuming seafood with the goal of meeting recommended amounts.
Factors Influencing Seafood Consumption
Findings
- Limited evidence is available on the types and preparation methods of seafood consumed by pregnant and lactating women and children and adolescents in the general population.
- Although few women of childbearing age and children and adolescents in the general population meet the recommended intake of two servings of seafood per week, some from certain ethnic or cultural backgrounds—such as those of Asian or Native American heritage, Indigenous peoples, and sport and subsistence fishers and their families—consume greater than average amounts of seafood.
- Multiple factors influence patterns of seafood consumption, including residence in coastal areas or near bodies of water such as the Great Lakes, familiarity with fish preparation methods, and cultural and traditional practices.
Conclusion
- Insufficient evidence exists to suggest a need to revise seafood consumption guidelines, but a need does exist to identify strategies to help individuals meet current guidelines.
RECOMMENDATIONS
Recommendation 1: The Centers for Disease Control and Prevention should identify strategies to address gaps in current National Health and Nutrition Examination Survey monitoring to better assess the sources, types, amounts, and preparation methods of seafood consumed by women of childbearing age, pregnant and lactating women, and children and adolescents up to 18 years of age.
Recommendation 2: The U.S. Department of Agriculture should reevaluate its federal nutrition programs, especially school meals, to support greater inclusion of seafood in meal patterns.
RESEARCH GAPS
- Research is needed to characterize the knowledge of, and responses to, current seafood consumption guidelines among women of childbearing age and children and adolescents. This should include research of seafood consumption by children, particularly in school settings and other meals consumed outside the home.
- Further research is needed to assess the types, amounts, and patterns of seafood consumed during pregnancy and lactation.
- Additional research is needed to assess the barriers to providing seafood as a component of meals served in schools and other settings frequented by children.
REFERENCES
Agriculture Canada. 2023. Sector trend analysis—Fish and seafood trends in Canada. https://agriculture.canada.ca/en/international-trade/market-intelligence/reports/sector-trend-analysis-fish-and-seafood-trends-canada (accessed December 7, 2023).
Asche, F., B. Yang, J. A. Gephart, M. D. Smith, J. L. Anderson, E. V. Camp, T. M. Garlock, D. C. Love, A. Oglend, and H. M. Straume. 2022. China’s seafood imports—Not for domestic consumption? Science 375(6579):386-388.
Béland, Y. 2002. Canadian Community Health Survey—methodological overview. Health Reports 13(3):9-14.
Bloomingdale, A., L. B. Guthrie, S. Price, R. O. Wright, D. Platek, J. Haines, and E. Oken. 2010. A qualitative study of fish consumption during pregnancy. American Journal of Clinical Nutrition 92(5):1234-1240.
Brockington, M., D. Beale, J. Gaupholm, A. Naylor, T. A. Kenny, M. Lemire, M. Falardeau, P. Loring, J. Parmley, and M. Little. 2023. Identifying barriers and pathways linking fish and seafood to food security in Inuit Nunangat: A scoping review. International Journal of Environmental Research and Public Health 20(3).
Burger, J. 2005. Fishing, fish consumption, and knowledge about advisories in college students and others in central New Jersey. Environmental Research 98(2):268-275.
Burger, J. 2008. Fishing, fish consumption, and awareness about warnings in a university community in central New Jersey in 2007, and comparisons with 2004. Environmental Research 108(1):107-116.
Burger, J., and M. Gochfeld. 2009. Perceptions of the risks and benefits of fish consumption: Individual choices to reduce risk and increase health benefits. Environmental Research 109(3):343-349.
Burns, J. L. P., A. Bhattacharjee, G. P. Darlington, J. P. Haines, D. W. L. P. Ma, and The Guelph Family Health Study. 2023. Parental cooking confidence is associated with children’s intake of fish and seafood. Canadian Journal of Dietetic Practice and Research 1-4.
Burridge, L., J. S. Weis, F. Cabello, J. Pizarro, and K. Bostick. 2010. Chemical use in salmon aquaculture: A review of current practices and possible environmental effects. Aquaculture (Amsterdam, Netherlands) 306(1-4):7-23.
Connelly, N. A., T. Bruce Lauber, J. Niederdeppe, and B. A. Knuth. 2016. Fish consumption among women anglers of childbearing age in the Great Lakes region. Environmental Research 150:213-218.
Cooke, S. J., W. M. Twardek, R. J. Lennox, A. J. Zolderdo, S. D. Bower, L. F. G. Gutowsky, A. J. Danylchuk, R. Arlinghaus, and D. Beard. 2017. The nexus of fun and nutrition: Recreational fishing is also food. Fish and Fisheries 19:201-224.
Cusack, L. K., E. Smit, M. L. Kile, and A. K. Harding. 2017. Regional and temporal trends in blood mercury concentrations and fish consumption in women of child bearing age in the United States using NHANES data from 1999-2010. Environmental Health: A Global Access Science Source 16(1):10.
Del Giudice, T., S. Stranieri, F. Caracciolo, E. C. Ricci, L. Cembalo, A. Banterle, and G. Cicia. 2018. Corporate social responsibility certifications influence consumer preferences and seafood market price. Journal of Cleaner Production 178:526-533.
Dey, M. M., P. Surathkal, O. L. Chen, and C. R. Engle. 2017. Market trends for seafood products in the USA: Implication for southern aquaculture products. Aquaculture Economics & Management 21(1):25-43.
Engle, C., J. van Senten, G. Kumar, and M. Dey. 2023. Pre- and post-pandemic seafood purchasing behavior in the U.S. Aquaculture (Amsterdam, Netherlands) 571:739491.
EPA (U.S. Environmental Protection Agency). 2014. Estimated fish consumption rates for the U.S. population and selected subpopulations (NHANES 2003–2010). Final report. https://www.epa.gov/fish-tech/reports-and-fact-sheets-about-fish-consumption-and-human-health (accessed August 22, 2023).
ERS (Economic Research Service). 2020. Food availability (per capita) data system. Fish and shellfish. https://www.ers.usda.gov/data-products/food-availability-per-capita-data-system/food-availability-per-capita-data-system/#Loss-Adjusted%20Food%20Availability (accessed August 16, 2023).
FAO (Food and Agriculture Organization). 2020. The state of world fisheries and aquaculture. Sustainability in action. https://doi.org/10.4060/ca9229en (accessed August 16, 2023).
FAO. 2022. The state of world fisheries and aquaculture 2022. Towards blue transformation. https://doi.org/10.4060/cc0461en (accessed August 16, 2023).
GAO (Government Accountability Office). 2022. National School Lunch Program. USDA could enhance assistance to states and schools in providing seafood to students. GAO-23-105179. https://www.gao.gov/products/gao-23-105179 (accessed August 16, 2023).
Gephart, J. A., H. E. Froehlich, and T. A. Branch. 2019. Opinion: To create sustainable seafood industries, the United States needs a better accounting of imports and exports. Proceedings of the National Academy of Sciences of the United States of America 116(19):9142-9146.
González, N., E. Correig, I. Marmelo, A. Marques, R. la Cour, J. J. Sloth, M. Nadal, M. Marquès, and J. L. Domingo. 2021. Dietary exposure to potentially toxic elements through sushi consumption in Catalonia, Spain. Food and Chemical Toxicology 153:112285.
Govzman, S., S. Looby, X. Wang, F. Butler, E. R. Gibney, and C. M. Timon. 2021. A systematic review of the determinants of seafood consumption. British Journal of Nutrition 126(1):66-80.
He, X., M. Raymond, C. Tomasallo, A. Schultz, and J. Meiman. 2021. Fish consumption and awareness of fish advisories among Burmese refugees: A respondent-driven sampling study in Milwaukee, Wisconsin. Environmental Research 197:110906.
He, X., M. Raymond, N. LaHue, C. Tomasallo, H. Anderson, and J. Meiman. 2022. Fish consumption and advisory awareness in the Great Lakes basin. Science of the Total Environment 827:153974.
Hinshaw, J. M., G. Fornshell, and R. Kinnunen. 2004. A profile of the aquaculture of trout in the United States. https://freshwater-aquaculture.extension.org/wp-content/uploads/2019/08/Trout_Profile.pdf (accessed February 1, 2024).
Honkanen, P., S. O. Olsen, and B. Verplanken. 2005. Intention to consume seafood—the importance of habit. Appetite 45(2):161-168.
Hu, X. F., and H. M. Chan. 2020. Seafood consumption and its contribution to nutrients intake among Canadians in 2004 and 2015. Nutrients 13(1):77.
Huss, L. R., S. McCabe, J. Dobbs-Oates, J. Burgess, C. Behnke, C. R. Santerre, and S. Kranz. 2013. Development of child-friendly fish dishes to increase young children’s acceptance and consumption of fish. Food and Nutrition Sciences 4:78-87.
IOM (Institute of Medicine). 2007. Seafood choices. Balancing benefits and risks. Washington, DC: The National Academies Press.
Jahns, L., S. K. Raatz, L. K. Johnson, S. Kranz, J. T. Silverstein, and M. J. Picklo. 2014. Intake of seafood in the US varies by age, income, and education level but not by race-ethnicity. Nutrients 6(12):6060-6075.
Jones, N. R., A. I. Conklin, M. Suhrcke, and P. Monsivais. 2014. The growing price gap between more and less healthy foods: Analysis of a novel longitudinal UK dataset. PLoS One 9(10):e109343.
Judd, N. L., W. C. Griffith, and E. M. Faustman. 2004. Consideration of cultural and lifestyle factors in defining susceptible populations for environmental disease. Toxicology 198(1-3):121-133.
Lando, A. M., and Y. Zhang. 2011. Awareness and knowledge of methylmercury in fish in the United States. Environmental Research 111(3):442-450.
Karimi, R., S. Silbernagel, N. S. Fisher, and J. R. Meliker. 2014. Elevated blood Hg at recommended seafood consumption rates in adult seafood consumers. International Journal of Hygiene and Environmental Health 217(7):758-764.
Love, D. C., F. Asche, Z. Conrad, R. Young, J. Harding, E. M. Nussbaumer, A. L. Thorne-Lyman, and R. Neff. 2020. Food sources and expenditures for seafood in the United States. Nutrients 12(6).
Love, D. C., E. M. Nussbaumer, J. Harding, J. A. Gephart, J. L. Anderson, F. Asche, J. S. Stoll, A. L. Thorne-Lyman, and M. W. Bloem. 2021. Risks shift along seafood supply chains. Global Food Security-Agriculture Policy Economics and Environment 28:100476.
Love, D. C., A. L. Thorne-Lyman, Z. Conrad, J. A. Gephart, F. Asche, D. Godo-Solo, A. McDowell, E. M. Nussbaumer, and M. W. Bloem. 2022. Affordability influences nutritional quality of seafood consumption among income and race/ethnicity groups in the United States. American Journal of Clinical Nutrition 116(2):415-425.
Marushka, L., M. Batal, W. David, H. Schwartz, A. Ing, K. Fediuk, D. Sharp, A. Black, C. Tikhonov, and H. M. Chan. 2017. Association between fish consumption, dietary omega-3 fatty acids and persistent organic pollutants intake, and type 2 diabetes in 18 First Nations in Ontario, Canada. Environmental Research 156:725-737.
Marushka, L., M. Batal, T. Sadik, H. Schwartz, A. Ing, K. Fediuk, C. Tikhonov, and H. M. Chan. 2018. Seafood consumption patterns, their nutritional benefits and associated sociodemographic and lifestyle factors among First Nations in British Columbia, Canada. Public Health Nutrition 21(17):3223-3236.
Marushka, L., M. Batal, C. Tikhonov, T. Sadik, H. Schwartz, A. Ing, K. Fediuk, and H. M. Chan. 2021. Importance of fish for food and nutrition security among First Nations in Canada. Canadian Journal of Public Health 112(Suppl 1):64-80.
McClenachan, L., S. T. Dissanayake, and X. Chen. 2016. Fair trade fish: Consumer support for broader seafood sustainability. Fish and Fisheries 17(3):825-838.
NFI (National Fisheries Institute). 2023. Top 10 list for seafood consumption. https://www.aboutseafood.com/about/top-ten-list-for-seafood-consumption/ (accessed October 30, 2023).
Nguyen, L., Z. Gao, and J. L. Anderson. 2023. Perception shifts in seafood consumption in the United States. Marine Policy 148:105438.
NMFS (National Marine Fisheries Service). 2020. Fisheries of the United States, 2018. https://www.fisheries.noaa.gov/national/commercial-fishing/fisheries-united-states-2018 (accessed August 16, 2023).
NMFS. 2022 Fisheries of the United States, 2020. U.S. Department of Commerce, NOAA Current Fishery Statistics No. 2020. https://www.fisheries.noaa.gov/national/sustainable-fisheries/fisheries-united-states (accessed April 11, 2024).
NOAA (National Oceanic and Atmospheric Administration). n.d. Aquaculture: Regulation & policy. https://www.fisheries.noaa.gov/topic/aquaculture/regulation-&-policy (accessed February 2, 2024).
Oken, E., R. J. Musci, M. Westlake, K. Gachigi, J. L. Aschner, K. L. Barnes, T. M. Bastain, C. Buss, C. A. Camargo, J. F. Cordero, D. Dabelea, A. L. Dunlop, A. Ghassabian, A. E. Hipwell, C. W. Hockett, M. R. Karagas, C. Lugo-Candelas, A. E. Margolis, T. G. O’Connor, C. L. Shuster, J. K. Straughen, and K. Lyall. 2023. Demographic and health characteristics associated with fish and n-3 fatty acid supplement intake during pregnancy: Results from pregnancy cohorts in the ECHO program. https://doi.org/10.1101/2023.11.17.23298695.
Pulver, J. R., A. Lowther, and M. A. Yencho. 2020. Updating the NOAA fisheries per capita consumption model. NOAA Technical Memorandum NMFS-F/SPO-210. https://spo.nmfs.noaa.gov/sites/default/files/TMSPO210.pdf (accessed February 24, 2024).
Razzaghi, H., and S. C. Tinker. 2014. Seafood consumption among pregnant and non-pregnant women of childbearing age in the United States, NHANES 1999–2006. Food & Nutrition Research 58.
Santiago-Torres, M., A. K. Adams, A. L. Carrel, T. L. LaRowe, and D. A. Schoeller. 2014. Home food availability, parental dietary intake, and familial eating habits influence the diet quality of urban Hispanic children. Childhood Obesity 10(5):408-415.
Shamshak, G. L., J. L. Anderson, F. Asche, T. Garlock, and D. C. Love. 2019. U.S. seafood consumption. Journal of the World Aquaculture Society 50(4):715-727.
Statistics Canada. 2015. Canadian Community Health Survey 2015. https://www23.statcan.gc.ca/imdb/p2SV.pl?Function=getSurvey&Id=238854 (accessed February 26, 2024).
Tsuchiya, A., J. Hardy, T. M. Burbacher, E. M. Faustman, and K. Marien. 2008. Fish intake guidelines: Incorporating n-3 fatty acid intake and contaminant exposure in the Korean and Japanese communities. American Journal of Clinical Nutrition 87(6):1867-1875.
USDA/FSIS (U.S. Department of Agriculture and Food Safety Inspection Service). 2022. Catfish from farm to table. https://www.fsis.usda.gov/food-safety/safe-food-handling-and-preparation/meat-fish/catfish-farm-table (accessed December 7, 2023).
This page intentionally left blank.


