The Role of Seafood Consumption in Child Growth and Development (2024)
Chapter: 4 Dietary Intake and Nutrient Composition of Seafood
4
Dietary Intake and Nutrient Composition of Seafood
This chapter presents the committee’s review of evidence on the nutrient composition of seafood and the nutrient intake from seafood, with an emphasis on nutrients of public health concern and additional nutrients for which seafood is a rich source. The chapter also describes the contribution of seafood consumption to dietary patterns and to intake of nutrients including protein, eicosapentaenoic acid (EPA) and docosahexaenoic acid (DHA), and selected micronutrients. Finally, this chapter discusses various facets of diversity, equity, and inclusion that could be associated with intake of nutrients from seafood.
NUTRIENT COMPOSITION OF SEAFOOD
Nutrients and Dietary Components of Public Health Concern
Inadequate intake of nutrient-dense foods and beverages leads to underconsumption of some nutrients and dietary components. The Dietary Guidelines for Americans 2020–2025 (DGA) identified vitamin D, calcium, potassium, and dietary fiber as dietary components of public health concern because low intakes are associated with health concerns (USDA and HHS, 2020). Iron was also noted as a nutrient of public health concern for infants, particularly those consuming human milk, and for women of childbearing age. Consuming sufficient amounts of these nutrients can decrease risk of heart disease, anemia, and cancer, among other diet-related diseases. The following section reviews each nutrient of public health concern in terms of its availability in seafood (Table 4-1) and its relevant relationships to intake recommendations and potential for toxicity.
Vitamin D
Vitamin D is a group of fat-soluble seco-sterols. The two major forms are vitamin D2 (ergocalciferol) and vitamin D3 (cholecalciferol). Vitamin D3 is generated from dietary cholesterol, or it is generated endogenously by ultraviolet-induced synthesis of the inactive and subcutaneously fat-stored 7-dehydrocholesterol (IOM, 2011). Because of the risks associated with sun exposure, such conversion is not sufficient to cover vitamin D needs in the bodies of many people living in the United States and Canada; therefore, consumption of vitamin D3 is recommended. Vitamin D3 occurs naturally in a few food sources, which include fatty fish, fish liver oil, and egg yolk (Benedik, 2022). Fatty fish can contain between 5 and 15 µg of vitamin D (200–600 IU) per 100 g portion.
Atlantic herring can contain as much as 41 µg (1,600 IU) per 100 g portion (USDA, 1991). Diets high in fatty fish can therefore contribute substantially toward total vitamin D intake (USDA, 1991). The highest dietary vitamin D intakes have been recorded in pesco-vegetarians who regularly consume fish. Using 24-hour recall and diet history questionnaires, Crawford et al. (2023) found 52 percent of pregnant women to be below the Estimated Average Requirement/Adequate Intake (EAR/AI) for vitamin D when diet and supplements were included. Both vitamin D2 and vitamin D3 are also synthesized commercially for use in dietary supplements and fortification of foods.
Vitamin D is stored in the liver and in adipose tissue; thus the blubber and liver of arctic marine mammals such as seal, narwhal, beluga, and walrus as well as fish (e.g., char, cisco, lake trout, loche, sculpin, whitefish) are rich sources of vitamin D. This is especially relevant for consumers of a traditional Indigenous diet. Among Indigenous Canadian populations, exchanging a traditional diet that contains vitamin D–rich foods for a westernized diet has been shown to increase risk of vitamin D deficiency (Brunborg et al., 2006; Keiver et al., 1988; Kenny et al., 2004; Kuhnlein et al., 2006). In contrast, excessive intake may lead to increased serum 25-dihydroxy vitamin D levels and consequent hypercalcemia (Jones, 2008).
Calcium
Calcium is a bivalent mineral that plays a key role in bone formation, blood clotting, muscle movement, and neural signaling. The major physiological activities of calcium include bone accretion during skeletal growth and bone mass maintenance after growth is completed. Sufficient calcium intake is usually determined by measurement of bone strength (calcium amount in bone) using dual x-ray absorptiometry. The need for calcium corresponds to life stage, skeletal growth and remodeling, and lifestyle behaviors, such as weight-bearing activity. Calcium supplementation has been shown to reduce risk of preeclampsia in pregnant women by 50 percent (Hofmeyr et al., 2019).
Calcium metabolism is largely regulated by a parathyroid hormone–vitamin D endocrine system process for which protein, vitamin D, and calcium are needed. The interchange between the dynamics of calcium and vitamin D often complicates the interpretation of data relative to calcium requirements, deficiency states, and excess intake. Excess calcium accumulation in the body is almost never attributable to calcium intake from foods, but from dysfunction of calcium excretion. In the United States, about 72 percent of dietary calcium comes from dairy products, whereas seafood contributes only about 3 percent (IOM, 2011; NIH, 2022). Calcium absorption may be reduced by insufficient dietary protein intake and low vitamin D status, both of which are provided by fatty fish. In one study of European adults, consumers of fish had the highest intake of calcium (Sobiecki et al., 2016).
Potassium
Potassium is the major intracellular cation in the human body and has a critical role through signaling pathways in neural and muscular tissue. Relatively small changes in extracellular potassium concentration significantly affect the extracellular-to-intracellular potassium ratio and thereby neural transmission, muscle contraction, and vascular tone. Potassium concentrations are regulated by the kidneys (NASEM, 2019). Evidence from observational studies, clinical trials, and meta-analyses of trials demonstrate that higher intakes of potassium are associated with lower blood pressure (Frassetto et al., 2023). Excessive potassium (hyperkalemia) can be life threatening but is rare and not usually a result of high dietary intake, but of kidney dysfunction. The DGA note that older infants (6 to < 12 months) and children do not consume enough potassium (USDA and HHS, 2020). Dietary sources of potassium include most fruits and vegetables; as for seafood, potassium content varies by species. For example, salmon can contain 280–535 mg/100 calories and clams offer 534 mg/100 calories (ARS, 2019).
Dietary Fiber
Dietary fiber includes soluble fiber, which supports glucose control and the lowering of blood cholesterol levels. Soluble fibers are found in oatmeal, nuts, beans, lentils, fruits, and vegetables. Dietary fiber also includes insoluble fiber, which helps promote gastrointestinal regularity. Insoluble fibers are found in whole-wheat products, brown rice, legumes, leafy greens, nuts, seeds, and fruits with edible skins. Muscle-based foods, including
seafood, contain very little dietary fiber. Fiber that seafood products contain is attributed to preparation methods and the addition of breading, although breaded fish and seafood contain minimal amounts of dietary fiber (Bland et al., 2021). The USDA nutrient database1 estimates that one 226 g serving of breaded restaurant, family style fish fillet contains approximately 2 g of fiber.
Iron
Iron functions as a key component of hemoglobin and myoglobin, which oxygenate body tissues. This active transport of oxygen from the environment to the body’s tissues is critical for all aerobic bodily functions. Iron also plays a role in deoxyribonucleic acid (DNA) synthesis as well as electron transport to convert dietary energy to adenosine triphosphate (ATP). Thus, iron is critical for pregnancy, lactation, and growth. Near the end of pregnancy, absorption of 4–5 mg/day of iron is needed to maintain balance (IOM, 2001). Important subclinical and clinical consequences of iron deficiency include microcytic anemia, impaired muscle performance, adverse pregnancy outcomes, developmental delay, and cognitive impairment.
Studies of iron deficiency anemia and behavior in the developing human suggest persistent functional changes. For example, lower mental and motor test scores and behavioral alterations in infants have been associated with iron deficiency anemia (Idjradinata and Pollitt, 1993; Lozoff, 2007; Nokes et al., 1998; Walter, 2003). Additionally, increased perinatal maternal mortality is associated with anemia (Smith et al., 2019). Although high hemoglobin concentrations at the time of delivery are associated with adverse pregnancy outcomes, such as the newborn infant being small for gestational age, evidence suggests that this association is not causal or related to iron status; rather, it is attributable to hypertensive disorders of pregnancy (Yip, 2000). Iron toxicity is generally associated with excess intake from supplements and not high intake from food sources. Consequences of chronic excess iron intake include impaired zinc absorption, increased risk of vascular disease and cancer, and systemic iron overload (Kondaiah et al., 2019; Torti et al., 2018).
Dietary sources of iron are either heme iron or nonheme iron. In the United States and Canada, dietary sources of heme iron are found in meat, poultry, and fish, and dietary sources of nonheme iron are found in nuts, beans, vegetables, and fortified grain products such as breads and cereals. Muscle tissue from meat, poultry, or fish enhances absorption of bioavailable heme iron from these sources (Hurrell and Egli, 2010). Generally, absorption of dietary iron is low (approximately 1–2 mg), and daily consumption of iron-containing foods is recommended (Johnson-Wimbley and Graham, 2011). Human milk provides approximately 0.27 mg of heme iron per day (although that amount is insufficient to meet the needs of infants older than 4 to 6 months) (NIH, 2023), and levels of heme iron in milk are not significantly affected by supplementation (IOM, 2001).
Additional Nutrients in Seafood
Fish and other seafood are rich in a variety of nutrients, and many species are rich in at least some of the nutrients of public health concern, except for dietary fiber. Nutrient composition of seafood varies considerably among species obtained from marine and inland environments as well as from wild harvest and aquaculture sources. In addition to being a source of protein, fish and other seafood are a source of long-chain polyunsaturated fatty acids of the omega-3 series (n-3 LCPUFA) as well as a number of essential vitamins and minerals. The following sections review these additional nutrients that are often prominent in seafood. Health outcomes related to these nutrients in seafood and the interactions of nutrients with toxicants or other contaminants in seafood are discussed in Chapter 6.
Protein
Seafood is considered a protein source of high biological value (i.e., has all the essential amino acids, and has high absorption rates) and thus is included with other sources of dietary protein such as meat, poultry, and eggs.
___________________
1Available at https://fdc.nal.usda.gov/ (accessed October 20, 2023).
Evidence from studies on consumption patterns of seafood by U.S. and Canadian populations indicates that only about 2–4 percent of total protein intake comes from seafood (Auclair and Burgos, 2021; Gardner et al., 2019). Although protein intake from high-biological value protein foods is generally adequate across U.S. and Canadian populations (Table 4-2, Table 4-3, and Figure 4-1), replacing other animal protein sources with seafood could be expected to lead to higher nutrient intake while not reducing total protein intake. Certain Indigenous subgroups for whom seafood is a key source of complete protein, however, may be at risk of inadequate protein intake (Cisneros-Montemayor et al., 2016; Marushka et al., 2021).
Long-Chain Omega-3 Polyunsaturated Fatty Acids
Seafood can be a rich source of the n-3 LCPUFAs, EPA and DHA. Although they can be synthesized from alpha-linolenic acid (ALA), the essential short-chain n-3 fatty acid, the conversion rate is less than 10 percent in humans.2 Thus, dietary consumption of EPA and DHA is recommended (USDA and HHS, 2020). Thus, dietary consumption of EPA and DHA is recommended (USDA and HHS, 2020). The n-3 LCPUFAs are essential for fetal development and are key components of all cell membranes. Especially in the brain and retina, both EPA and DHA serve as precursors of several metabolites that are potent lipid mediators (Swanson et al., 2012). The evidence for health effects associated with diets low in EPA and DHA is discussed in Chapter 6.
Although seafood is not the only source of EPA and DHA, it is a primary dietary source (Saini and Keum, 2018) and any dietary pattern that excludes animal foods, such as seafood, may lead to insufficient intake. The n-3 LCPUFAs are particularly abundant in fatty fish such as salmon and lake trout. Seafood varieties commonly consumed in the United States that are higher in EPA and DHA and lower in methylmercury include salmon, anchovies, sardines, Pacific oysters, trout, shrimp, crab, and flounder (USDA, 2023b).
Aquaculture is the source of about 50 percent of seafood consumed globally and Atlantic salmon is a fatty fish and a rich source of n-3 LCPUFAs. The fatty-acid content of farmed fish is influenced by the composition of the feed mixture used in farming. For farmed salmon to have a fatty-acid profile like that of wild-caught salmon, the feed must include oils containing EPA and/or DHA in finishing diets (Bell et al., 2004).
Data from the National Health and Nutrition Examination Survey (NHANES) indicate that U.S. women of childbearing age and children and adolescents do not consume sufficient levels of DHA and EPA. The Joint Food and Agriculture Organization of the United Nations (FAO) and World Health Organization (WHO) report, Fats and Fatty Acids in Human Nutrition, Report of an Expert Consultation, recommends a range of intake for DHA/EPA targeted at preventing chronic disease (adjusted for age to ensure sufficient DHA/EPA with increasing body mass and activity). Recommendations are 100–150 mg/day for children ages 2–4 years; 150–200 mg/day for ages 4–6 years; and 200–300 mg/day for ages 6–10 years. For pregnant and lactating women, a combined 300 mg/day of EPA and DHA is recommended, of which at least 200 mg/day should be DHA (FAO, 2010; Middleton et al., 2018).
The Dietary Reference Intakes report on macronutrients (IOM, 2002/2005) recommends 0.5 g/day as an adequate intake (AI) of total n-3 LCPUFAs for infants (up 12 month). For children and adolescents, and pregnant and lactating women, AIs are established for ALA (as well as for linoleic acid).
Selenium
As discussed in Chapter 5, selenium (Se) is an essential nutrient that functions as a component of selenoproteins, which are critical in DNA synthesis and serve as oxidative defense enzymes in the immune system. Selenoenzymes are expressed in tissue-specific distributions in all cells of vertebrates. Selenomethionine or selenocysteine are the prominent forms of selenium in human tissue. Selenomethionine, which cannot be synthesized by humans, is initially synthesized in plants and incorporated in place of methionine in a number of proteins obtained from plant and animal sources (IOM, 2000). In food sources, the amount of available Se varies depending on the selenium content of the soil for both plants and the animals that feed on them (Rayman, 2020). Meat and seafood are
___________________
2Available at https://lpi.oregonstate.edu/mic/other-nutrients/essential-fatty-acids#metabolism-bioavailability (accessed February 26, 2024).
primary sources of Se in U.S. and Canadian diets. Seafood contains Se in its functional form as selenoproteins, with levels that can range from 0.4 to 1.5 µg/g (IOM, 2000). The USDA nutrient database estimates that yellowfin tuna is high in selenium; about 92 µg per 100 g. Sardines, oysters, clams, halibut, shrimp, salmon, and crab are moderate sources of selenium with 40 and 65 µg per 100 g. By comparison, among breastfeeding women in the United States and Canada, breastmilk levels of selenium are approximately 15–20 µg/L (Guo and Hendricks, 2008). Factors that affect dietary intake of Se include geographic origin of the food and the overall meat and seafood content of the diet. The lowest Se intakes have been observed in populations that eat vegetarian diets consisting of plants grown in soils low in Se (IOM, 2000).
The Recommended Dietary Allowance (RDA) for Se for pregnant and lactating women is 60 and 70 µg/day, respectively. RDAs for Se for children range 17–45 µg/day for girls and 20–50 µg/day for boys, depending on age group (IOM, 2000). The major forms of Se in the diet are highly bioavailable. Se intake varies according to geographic location, but there is no indication that average intakes fall below the RDA in the United States or Canada.
Se deficiency symptoms include muscle weakness and impaired immune function. There is low risk of Se toxicity at the Tolerable Upper Intake Level (UL). The UL for pregnant and lactating women is 400 µg/day. The UL for infants up to age 6 months is 45 µg/day, and 60 µg/day for infants 7–12 months. For children, the UL is 90 µg/day for ages 1–3 years; 150 µg/day for 4–8 years, and 280 µg/day for 9–13 years. For adolescents the UL is 400 µg/day for 14 to 18 years (IOM, 2000). Chapter 5 includes additional discussion on the selenium interaction with MeHg.
Iodine
Iodine is an essential component of the thyroid hormones, thyroxine and tri-iodothyronine. Thyroid function is critical to regulate basal metabolism as well as brain development. Low maternal iodine status during pregnancy can lead to an underdeveloped brain in the fetus. This earliest clinical response to suboptimal iodine nutrition occurs as an adaptation to the threat of hypothyroidism. Deficiency in selenium can exacerbate the effects of iodine deficiency (Kohrle, 2015). Iodine intake may be insufficient in pregnant and lactating women, leading to adverse outcomes for the child (Griebel-Thompson et al., 2023). Observational studies have shown associations between mild maternal iodine deficiency and decreased child cognition (Cortés-Albornoz et al., 2021; de Escobar et al., 2007). Dietary trends in higher use of sea salt, which is not iodized like most table salt produced in the United States, may contribute to lower iodine intakes in at-risk groups (Hatch-McChesney and Lieberman, 2022). Current guidelines do not recommend that prenatal supplements contain iodine, as there are insufficient data to reach any meaningful conclusions about the benefits or harms of routine iodine supplementation before, during, or after pregnancy (Harding et al., 2017).
The iodine content in most food sources is low and can be affected by the iodine concentration of soil, irrigation, and fertilizers. It ranges from 3 to 75 µg per 100 g serving. Foods of marine origin, however, can have higher concentrations of iodine because marine animals concentrate the mineral from seawater. For example, cod contains about 158 µg per 100 g, scallops provide about 135 µg per 100 g, and Alaskan pollock provides around 67 µg per 100 g.
A UL for iodine for infants up to age 12 months was not determined because of inadequate data; thus the only source of iodine for this age group should be from breastmilk, formula, and complementary foods. The UL for children is 200, 300, and 600 µg/day for ages 1–3, 4–8, and 9–13 years, respectively. The UL for adolescents ages 14–18 years (including pregnant and lactating) is 900 µg/day; for pregnant and lactating women 19 years and older the UL is 1,100 µg/day. For most individuals, iodine intake from foods (and supplements) is unlikely to exceed the UL (IOM, 2001).
The nutritional status of iodine can be measured using urinary iodine concentrations. Øyen et al. (2021) used a controlled, randomized crossover study design, where participants assigned to the experimental group consumed lean seafood in accordance with the Norwegian dietary guidance and restricted intake of milk and dairy to measure urinary iodine concentrations. The objective of the study was to determine the effect of consuming lean seafood on
iodine status in adult men and women. The investigators concluded that the seafood intervention increased urine iodine concentrations from suboptimal levels to adequate levels (i.e., greater than 100 µg/L).
Choline
Choline is an essential nutrient that has roles in neurotransmitter synthesis, cell-membrane signaling, methyl-group metabolism, and lipid transport. Choline functions in brain and memory development in the fetus and appears to decrease the risk of developing neural tube defects (Zeisel and da Costa, 2009). The plasma concentration of choline varies in response to diet, decreasing approximately 30 percent in humans consuming a choline-deficient diet for 3 weeks (Zeisel et al., 1991).
Owing to insufficient data to establish an RDA for choline, an AI was set based on the prevention of liver damage. The AI for choline for pregnant and lactating women is 450 mg/day and 550 mg/day, respectively (IOM, 1998). Choline crosses the placenta, and the concentration in amniotic fluid is 10-fold greater than that found in maternal blood (Zeisel, 2006). While most Americans consume below the AI, deficiencies are rare in healthy persons because choline can be synthesized (Corbin and Zeisel, 2012). The UL for choline is 1,000 mg/day for children up to age 8 years; 2,000 mg/day from 9 to 13 years; and 3,000 mg/day for 14–18 years. From 24-hour recall and diet history questionnaires, Crawford et al. (2023) found 83 percent of pregnant women were below the EAR/AI for choline when diet and supplements were included.
Choline is found in a wide variety of foods. Fish such as salmon, tuna, and cod are good sources, although eggs, milk, chicken, beef, and pork appear to be the greatest contributors of choline in the diets of women (Chiuve et al., 2007).
Vitamin B12
Vitamin B12 (cobalamin) is a water-soluble vitamin critical for central nervous system function (myelination and signaling) because it serves as a coenzyme in important steps in DNA synthesis. Adequate vitamin B12 is essential for normal erythrocyte formation and neurological function. Deficiency of B12 results in pernicious anemia. Neurological effects of deficiency include sensory and motor disturbances that include abnormal gait. Cognitive manifestations of deficiency include memory loss, disorientation, and frank dementia (IOM, 1998).
Vitamin B12 is present naturally only in animal foods and certain algae (Ford and Hunter, 1955). Fortified ready-to-eat cereals are an additional dietary source. The richest sources of vitamin B12 include shellfish—clams, oysters, mussels, crab, crayfish, scallops, and lobster. Finfish—salmon, catfish, pike, whiting, perch, swordfish, carp, porgy, and flounder—are also a rich source of B12 (IOM, 1998). To be absorbed, dietary vitamin B12 must bind to HCL-activated intrinsic factor (IF) in the stomach; the vitamin B12–IF compound is then absorbed in the small intestine. Individuals who consume high levels of antacids or who have impaired gastric function or are post-bariatric surgery are at risk for low vitamin B12 absorption. No adverse effects from high intakes of vitamin B12 have been identified in humans (IOM, 1998).
Folate
Folate is a water-soluble B-complex vitamin that is essential for brain development and function, amino acid metabolism, red blood cell production, and DNA synthesis. Sources of dietary folate are abundant and include vegetables, fruits, beans, peas, eggs, and some meats and seafood. Adequate intake of folate is particularly important for women of childbearing age because of its role in preventing neural tube defects. The RDA for folate for women of childbearing age is 400 µg/day. Folate requirements are higher during pregnancy and lactation (600 µg/day and 500 µg/day, respectively) to support the rapid growth of the fetus and newborn (IOM, 1998).
Nutrients in Seafood by Type
The following sections discuss the content of macronutrients, vitamins, and minerals in various types of seafood. Table 4-1 provides the amounts of selected nutrients in seafood, by seafood type.
Macronutrients
All seafood has approximately 20–30 percent of its total weight as protein, making it a high-quality protein source (Ariño et al., 2013). Breaded fish and seafood is also the only seafood-related source of dietary fiber, which is not naturally occurring in seafood. Because of the high consumption rate of breaded seafood by U.S. children (Table 3-7), these products become a contributor to the overall low intake of dietary fiber.
Total and saturated fat content varies greatly by species and preparation. For instance, fatty fish such as Atlantic, farmed salmon contributes 12.4 g total fat per 100 g, only 2.4 g of which are saturated fat; whereas cooked, unbreaded farmed catfish provides 7.2 g total fat per 100 g, of which 1.6 g is saturated fat. On average, the largest amount of unsaturated fat from a single seafood source is from mixed shrimp that is cooked, breaded, and fried (8.9 g/100 g). EPA and DHA intake reflect the proportion of unsaturated fatty acids from seafood with the largest amounts contained in Atlantic farmed and wild-caught salmon (1.5 and 1.4 g/100 g and 1.7 and 1.4 g/100 g, respectively) (see Table 4-1).3
Vitamins
Salmon is the fish with the highest concentration of vitamin D, providing more than 13.1–16.7 µg/100 g of fish, depending on the type of salmon. Catfish and shellfish, on the other hand, contain little vitamin D. Bluefish cooked tuna and clams contain the highest amount of vitamin A (757 and 171 µg/100 g, respectively). Clams have the largest concentration of vitamin B12 (98.9 µg/100 g); most other types of seafood contain very small amounts. Folate content is highest in crab (51 µg/100 g) and Atlantic farmed salmon (34 µg/100 g).
Minerals
Pink, canned salmon and shellfish are high in calcium (60–92 mg/100 g), and clams are high in iron (2.8 mg/100 g). Iron content is low in all other seafood types examined in this report, except for battered and fried or cooked fish because the grains used in the batter contain iron. Choline content is highest in cooked, unbreaded, fried shrimp (135 mg/100 g), cooked sockeye salmon (113 mg/100 g), and cooked unbreaded Alaskan pollock (92 mg/100 g). Many seafood types consumed in U.S. and Canadian diets do not contain choline. Magnesium content is highest in Alaskan pollock (81 mg/100 g), followed by bluefin tuna (64 mg/100 g) and Alaska king crab (63 mg/100 g). White canned tuna in water (65.7 µg/100 g) and clams (64 µg/100 g) are highest in selenium. Crab, clams, and catfish contain the highest concentrations of zinc.
The iodine concentration of protein sources, including various types of seafood, in the U.S. food supply is reflected in Table 4-2 in descending order. Direct comparisons between the seafood nutrient composition listed in Table 4-2 cannot be made to nutrient values reported in Table 4-1 because the USDA, the U.S. Food and Drug Administration (FDA), and the Office of Dietary Supplements (ODS)-National Institutes of Health (NIH) database (Table 4-2) has a smaller database than the USDA FoodData Central database and food codes (Table 4-1) that correspond to different preparation methods of seafood that can alter nutrient density.
The 15 most concentrated sources of iodine are seafood. Haddock has the highest concentration (227 µg/100 g), followed by dried smelt (216 µ/100 g), lobster (185 µg/100 g), and baked cod (172 µg/100 g). Contributors to iodine intake that are not seafood are pan-cooked ground beef (7.5 µg/100 g), turkey breast (4.8 µg/100 g), and beef steak (4.7 µg/100 g). Very low iodine concentrations are observed in oven-roasted chicken breast (1.2 µg/100 g). Overall, seafood has much larger iodine concentrations—by at least one order of magnitude—compared with other protein sources. However, given the RDA for iodine of 220 µg/day for pregnant women and 290 µg/day for
___________________
3Available at https://fdc.nal.usda.gov/fdc-app.html (accessed February 24, 2024).
TABLE 4-1 Selected Nutrients in Seafood, by Seafood Type, United States
| Seafood Type | Vitamin D (pg/100g) | Calcium (mg/100g) | Iron (mg/100g) | Potassium (mg/100g) | Dietary Fiber (g/100g) | Protoin (g/100g) | Total Fat (g/100g) | Saturated Fat (g/100g) | Unsaturated Fat (g/100g) | DHA (g/10Og) | EPA (g/100g) | Choline (mg/100g) | Magnesium (mg/100g) | Selenium (pg/100g) | Zinc (mg/100g) | Vitamin A (pg/100g) | Vitamin B-12 (pg/100g) | Folate (pg/100g) |
|---|---|---|---|---|---|---|---|---|---|---|---|---|---|---|---|---|---|---|
| Finfish | ||||||||||||||||||
| Alaska Pollock* Alaska, cooked, dry heat | 1.3 | 72 | 0.56 | 430 | 0 | 23.5 | 1.18 | 0.16 | 0.72 | 0.423 | 0.086 | 91.6 | 81 | 44.1 | 0.57 | 17 | 3.66 | 3 |
| Oven ready breaded fish sticks, USDA+ | 0 | 13 | 1.77 | 281 | 1.8 | 14.2 | 7.08 | 088 | N/A | N/A | N/A | N/A | N/A | N/A | N/A | N/A | N/A | N/A |
| Catfish* Channel, farmed, cooked, dry heat | 0.3 | 9 | 0.28 | 366 | 0 | 18.4 | 7.19 | 1.59 | 4.47 | 0.069 | 0.02 | N/A | 23 | 9.9 | 0.58 | 1 | 2.78 | 12 |
| Channel, wild, cooked, dry heat | N/A | 11 | 0.35 | 419 | 0 | 18.5 | 2.85 | 0.74 | 1.74 | 0.137 | 0.10 | N/A | 23 | 14.3 | 0.61 | 15 | 2.90 | 10 |
| Channel, cooked, breaded, and fried | N/A | 44 | 1.43 | 340 | 0.7 | 18.1 | 13.3 | 3.29 | 8.93 | 0.222 | 0.119 | N/A | 27 | 13.9 | 0.86 | 8 | 1.9 | 30 |
| Cod* Atlantic, cooked, dry heal** | 1.2 | 14 | 0.49 | N/A | 0 | 22.8 | 0.86 | 0.17 | 0.42 | 0.154 | 0.004 | 83.7 | 42 | 37.6 | 0.58 | 14 | 1.05 | 8 |
| Pacific, cooked, dry heat** | 0.6 | 10 | 0.2 | 289 | 0 | 18.7 | 0.50 | 0.11 | 0.29 | 0.118 | 0.042 | 79.7 | 24 | 28 | 0.39 | 2.0 | 2.31 | 8 |
| Pangasius#* | - | - | - | - | - | - | - | - | - | |||||||||
| Salmon* pink, canned, without skin and bones, drained solids | 14.1 | 60 | 0.57 | N/A | 0 | 24.6 | 4.21 | 0.75 | 2.27 | 0.074 | 0.274 | 88 | 24 | 39.6 | 0.65 | 20 | 4.96 | 4 |
| Atlantic, formed, cooked, dry heal | 13.1 | 15 | 0.34 | N/A | 0 | 22.1 | 12.4 | 2.4 | 8.73 | 1.46 | 0.69 | 90.5 | 30 | 41.4 | 0.43 | 69 | 2.8 | 34 |
| Atlantic, wild, cooked, dry heat | N/A | 15 | 1.03 | N/A | 0 | 25.4 | 8.13 | 1.26 | 5.96 | 1.43 | 0.411 | N/A | 37 | 46 8 | 0.82 | 13 | 3.05 | 29 |
| Chum, cooked, dry heal | N/A | 14 | 0.71 | 550 | 0 | 25.8 | 4.83 | 1.08 | 3.13 | 0.505 | 0.299 | N/A | 28 | 46.8 | 0.60 | 34 | 3.46 | 5 |
| Sockeye, cooked, dry heat | 16.7 | 11 | 0.52 | 436 | 0 | 26.5 | 5.57 | 0.97 | 3.19 | 0.56 | 0.299 | 113 | 36 | 35.5 | 0.55 | 58 | 4.47 | 7 |
| Seafood Type | Vitamin D (pg/100g) | Calcium (mg/100g) | Iron (mg/100g) | Potassium (mg/100g) | Dietary Fiber (g/100g) | Protoin (g/100g) | Total Fat (g/100g) | Saturated Fat (g/100g) | Unsaturated Fat (g/100g) | DHA (g/10Og) | EPA (g/100g) | Choline (mg/100g) | Magnesium (mg/100g) | Selenium (pg/100g) | Zinc (mg/100g) | Vitamin A (pg/100g) | Vitamin B-12 (pg/100g) | Folate (pg/100g) |
|---|---|---|---|---|---|---|---|---|---|---|---|---|---|---|---|---|---|---|
| Tilapia* Cooked, dry heat | 3.7 | 14 | 0.69 | N/A | 0 | 26.2 | 2.65 | 0.94 | 1.56 | 0.13 | 0.005 | 51.3 | 34 | 544 | 0.41 | 0 | 1.86 | 6 |
| Tuna* White, canned in water, drained solids | 2 | 14 | 0.97 | N/A | 0 | 23.6 | 2.97 | 0.79 | 1.89 | 0.629 | 0.233 | 29.3 | 33 | 65.7 | 048 | 6 | 1.17 | 2 |
| White, canned in oil, drained solids | N/A | 4 | 0.65 | 333 | 0 | 26.5 | 8.08 | 1.28 | 6.23 | 0.178 | 0.066 | N/A | 34 | 60.1 | 0.47 | 5 | 2.2 | 5 |
| Fresh bluefin, cooked, dry heal | N/A | 10 | 1.31 | 323 | 0 | 29.9 | 6.28 | 1.61 | 3.89 | 1.14 | 0.363 | N/A | 64 | 46.8 | 0.77 | 757 | 10.9 | 2 |
| Shellfish | ||||||||||||||||||
| Clams* Mixed, cooked, moist heat | N/A | 92 | 2.81 | 628 | 0 | 256 | 1.95 | 0.19 | 0.72 | 0.146 | 0.138 | N/A | 18 | 64 | 2.73 | 171 | 98.9 | 29 |
| Crab* Alaska king, cooked, moist heat | N/A | 59 | 0.76 | N/A | 0 | 19.4 | 1.54 | 0.13 | 0.72 | 0.118 | 0.295 | N/A | 63 | 40 | 7.62 | 9 | 11.5 | 51 |
| Shrimp* Mixed, cooked, moist heat | 0.1 | 91 | 0.32 | N/A | 0 | 22.8 | 1.7 | 0.52 | 0.95 | 0.141 | 0.135 | 135 | 37 | 49.5 | 1.63 | 90 | 1.66 | 24 |
| Mixed, cooked, breaded and fried | 0.1 | 67 | 1.26 | 225 | 0.4 | 21.4 | 12.3 | 2.09 | 8.89 | 0.124 | 0.109 | 91.2 | 40 | 41.7 | 1.38 | 56 | 1.87 | 33 |
* Indicates a top 10 seafood species from NFI, 2024.
** Indicates differentiation of farm-raised and wild-caught seafood species.
# Pangasius nutrient data are not collected from the USDA (2019) database.
+ Company source: Trident Seafoods Corps [supplies pollock (fish sticks), representing an option served in the Child Nutrition Program]
SOURCE: USDA Nutrient Database Release 28, 2019.
TABLE 4-2 Iodine Content by Protein Source, United States
| Iodine | |
| Portion Size* | mcg/100g |
| Seafood Sources | |
| Haddocka | 227 |
| Smelt, driedb | 216 |
| Lobsterc | 185 |
| Cod, bakedd | 172 |
| Oystere | 109 |
| Fish Sticksf | 67 |
| Clamg | 66 |
| Pollockh | 44 |
| Tuna, fresh, bluefini | 23 |
| Swordfishj | 19 |
| Salmon, pink, cannedk | 15 |
| Shrimpl | 15 |
| Flatfishm | 14 |
| Salmon, steaksn | 13 |
| Halibuto | 10 |
| Scallopp | <10 |
| Troutq | <10 |
| Tuna, canned in waterr | 9.4 |
| Tilapias | 6.9 |
| Catfisht | 3.2 |
| Meat Sources | |
| Beef, ground, pan-cookedu | 7.5 |
| Turkey Breastv | 4.8 |
| Beef Steakw | 4.7 |
| Chicken breast, oven-roastedx | 1.2 |
a Haddock, raw; b Smelt, dried (Alaska Native); c Lobster, northern, cooked, moist heat; d Cod, baked; e Oyster, eastern, wild, cooked, moist heat; f Fish sticks or patty, frozen, oven-cooked; g Clam mixed species, canned, drained solids; h Pollock, Alaska, raw; i Tuna, fresh, bluefin, cooked, dry heat; j Swordfish, raw; k Salmon, pink, canned, drained solids; l Shrimp. Precooked, shell removed, no tail; m Flatfish (flounder and sole species), raw; n Salmon, steaks/fillets, baked; o Halibut, Atlantic and Pacific, raw; p Scallop, mixed species, raw; q Trout, rainbow, wild, raw; r Tuna canned in water, drained; s Tilapia, baked; t Catfish, pan-cooked with oil; u Beef, ground, pan-cooked; v Turkey breast, oven-roasted; w Beef steak, loin/sirloin, broiled; x Chicken breast, oven-roasted (skin removed); y Pork chop, pan-cooked with oil.
SOURCE: USDA, FDA, and ODS-NIH Database for Iodine Content of Common Foods Release 3.0 (2023) (USDA, 2023a).
lactating women (IOM, 2001), even daily consumption of the most frequently consumed seafood types—shrimp at 15 µg iodine/100 g, canned salmon at 15 µg/100 g, canned tuna 9.4 µg/100 g—are not likely to achieve the RDA for iodine.
Table 4-3 shows the relative nutrient density of 4-oz portions of seafood compared with 3.5-oz portions of other protein sources (the recommended portion sizes for these different protein food sources). To approximate the energy and protein content of each serving, four different types of each protein source were selected. The four types of seafood are fatty-acid rich (salmon), canned tuna, cooked shrimp, and fried shrimp. Examples of protein sources other than seafood are ground beef (containing 25 percent fat), ground beef (containing 5 percent fat), fried chicken, and roasted chicken. Although the portion size of seafood is 0.5 oz larger than the portion of ground beef and chicken, the large difference in density of most micronutrients in these commonly consumed seafood choices is beyond the difference in nutrient density accounted for by portion size alone. These seafood types, however, contain less iron and zinc than ground beef. Total and types of fat content vary by species and by preparation method.
TABLE 4-3 Comparison of Nutrient Density Between Selected Seafood Choices and Other High-Quality Protein Sources
| Salmon Atlantica | Tuna, cannedb | Shrimp, cookedc | Shrimp, friedd | Ground beef, 25% fate | Ground beef, 5% fatf | Chicken, friedg | Chicken, roastedh | |
| Portion Size* | 4 oz. | 4 oz. | 4 oz. | 4 oz. | 3.5 oz. | 3.5 oz. | 3.5 oz | 3.5 oz. |
| Macronutrients | ||||||||
| Calories, kcal | 234 | 145 | 135 | 274 | 248 | 164 | 229 | 153 |
| Protein, g | 25.1 | 26.8 | 25.9 | 24.3 | 23.4 | 25.8 | 24.3 | 27.1 |
| Total fat, g | 14.1 | 3.4 | 1.9 | 13.9 | 16.4 | 5.9 | 12.7 | 4.1 |
| Saturated, g | 2.7 | 0.9 | 0.6 | 2.4 | 6.3 | 2.6 | 3.5 | 1.1 |
| Monounsaturated, g | 4.7 | 0.9 | 0.4 | 4.3 | 7.5 | 2.4 | 5.0 | 1.5 |
| Polyunsaturated, g | 5.2 | 1.3 | 0.7 | 5.8 | 0.5 | 0.3 | 2.9 | 0.9 |
| Micronutrients | ||||||||
| Vitamin A, μg | 78 | 7 | 1.2 | 64 | 3 | 3 | 23 | 8 |
| Vitamin D, μg | 15 | 2.3 | 0.1 | 0.1 | 0 | 0 | 0.1 | 0.1 |
| Vitamin B12, μg | 3.2 | 1.3 | 1.7 | 2.1 | 2.8 | 2.8 | 0.3 | 0.3 |
| Calcium, mg | 17 | 16 | 91 | 76 | 32 | 9 | 14 | 13 |
| Zinc, mg | 0.5 | 0.5 | 1.9 | 1.6 | 6.0 | 6.5 | 1.7 | 0.8 |
| Phosphorus, mg | 286 | 246 | 347 | 247 | 199 | 222 | 162 | 217 |
| Iron, mg | 0.4 | 1.1 | 0.4 | 1.4 | 2.5 | 2.9 | 1.2 | 1.1 |
| Choline, mg | 103 | 33 | 153 | 103 | 73 | 84 | 68 | 77 |
NOTES: * For seafood sources, the portion sizes represent the 2014 EPA-FDA “Advice about Eating Fish for Those Who Might Become Pregnant, Are Pregnant, or Breastfeeding, and Children” and 2020-2025 DGA recommendations. Seafood portion size amounts are based on a 2,000-calorie level of dietary pattern. For beef and chicken sources, portion sizes are estimates that draw on, but are not explicitly stated, in the DGA recommendation of 26 oz per week of lean meat and poultry for adult women and the Healthy U.S.-Style Dietary Pattern, based on a 2,000-calorie level of pattern.
a Salmon, Atlantic, farmed, cooked, dry heat; b Tuna, white, canned in water, drained solids; c Shrimp, mixed species, cooked, moist heat (may contain additives to retain moisture); d Shrimp, mixed, cooked, breaded and fried; e Beef, ground, 75% lean meat/25% fat, patty, cooked, pan-broiled; f Beef, ground, 95% lean meat/5% fat, patty, cooked, pan-broiled; g Chicken, broilers or fryers, meat and skin, cooked, fried, flour; h Chicken, roasting, light meat, meat only, cooked, roasted.
SOURCE: ARS, 2019.
DIETARY PATTERNS AND SEAFOOD CONSUMPTION
The DGA includes an overarching recommendation that all Americans should aim to consume at least 8 oz (about two servings of 4 oz/250 g each) of seafood per week. For children the DGA recommends two servings per week in amounts corresponding to total daily caloric intake.4 For adult women of childbearing age, the DGA recommends at least 8 oz of seafood per week. Pregnant or lactating women are encouraged to eat at least 8 oz and up to 12 oz of seafood per week, choosing varieties that are lower in methylmercury (USDA and HHS, 2020). The DGA also includes dietary patterns that were developed to serve as flexible frameworks to enable policy makers, programs, and health professionals to help people at any stage of life customize and enjoy nutrient-dense food and beverage choices to reflect personal preferences, cultural foodways, and budgetary considerations as recommended in the DGA.
The Healthy U.S.-Style Dietary Pattern, the primary pattern, focuses on nutrient-dense foods with an emphasis on vegetables, fruits, grains, dairy, protein, and oils, while limiting saturated fat, sugar, sodium, and alcohol. A variation on this pattern, the Healthy Mediterranean-Style Dietary Pattern, includes a range of 16–20 oz of seafood per week for adults (DGAC, 2015). In the following sections, the committee discusses various facets of diversity, equity, and inclusion that could affect dietary patterns and thus be associated with the intake of nutrients from seafood.
___________________
4Available at https://www.dietaryguidelines.gov/sites/default/files/2020-12/Dietary_Guidelines_for_Americans_2020-2025.pdf (accessed October 15, 2023).
The Contribution of Seafood to Diet and Nutrient Intake by Race and Ethnicity
The committee was charged to consider diversity, equity, and inclusion in its assessment of associations between seafood intake, in consideration of the nutritional contributions to the diet from seafood. Love et al. (2022) analyzed NHANES data and reported relationships between race and ethnicity and seafood. Overall, rates of seafood intake were significantly lower among non-Hispanic White adults than non-Hispanic Black (P = 0.001) or non-Hispanic Asian (P < 0.001) adults. Non-Hispanic Asian adults routinely met DGA recommendations to consume 227 g (8 oz) of seafood.
A cross-sectional analysis of 2011–2014 NHANES was performed to examine associations between food insecurity and diet quality, and variations by sex and race/ethnicity compared with adults living in food-secure households, and adults living in food-insecure households with a 2.22-unit lower Healthy Eating Index-2015 score (95% confidence interval [CI] –3.35 to –1.08). Food insecurity among non-Hispanic Whites was associated with lower scores for total protein foods, including seafood. There were no such associations among non-Hispanic Black or Hispanic adults with food insecurity and no differences by sex (Leung and Tester, 2019).
Kranz et al. (2017) used a nationally representative sample from the UK National Diet and Nutrition Survey Rolling Program (2008–2012) to describe fish consumption among children ages 2–18 years. Data were collected from four consecutive 24-hour estimated diet diaries (records) from the children surveyed. Analysis of the data found that eating any amount of fish was associated with better diet quality than not eating any fish, in that consuming any amount of fish was strongly and positively associated with being in the medium or highest tertile of vegetable intake and negatively associated with eating the medium or highest tertile of meat (odds ratio [OR] = 1.55, 95% CI 1.19–2.12; OR = 1.88, 95% CI 1.39–2.58; OR = 0.72, 95% CI 0.55–0.98; OR = 0.47, 95% CI 0.34–0.66, respectively). Consuming the recommended amount of two servings of fish per week was significantly and positively predicted by consuming the highest tertile of vegetables (OR = 2.51, 95% CI 1.30–4.84) and significantly but negatively associated with consuming the highest tertile of meat (OR = 0.32, 95% CI 0.16–0.64).
Changes in food availability among population groups that traditionally depend on seafood affects seafood-based dietary patterns. Slater et al. (2013) showed that transitioning from a nutrient-dense traditional seafood-based diet to nutrient-poor market foods in a Canadian Dene Indigenous population resulted in inadequate vitamin D intake. Their study found that only 11 and 13 percent of the study population had adequate vitamin D intake in winter and summer, respectively. Milk and local fish were the major dietary sources of vitamin D for this population group.
Kenny et al. (2018) examined data derived from 24-hour recalls collected by the Inuit Health Survey from 2007 to 2008. Their analysis of dietary patterns across all regions showed that the most frequently consumed Arctic foods were caribou (18–39 percent, by region) and fish (7–22 percent by region). The most frequently reported market food items were coffee and tea, (granulated) sugar, sweetened beverages, and bread. At the regional level, Arctic foods represented a modest contribution to total dietary intake (6.4–19.6 percent of total energy) but they were a major source of both micro- and macronutrients. For example, Arctic foods contributed significantly to intakes of protein (23–52 percent), iron (28–54 percent), niacin (24–52 percent), and vitamins D (73 percent), B6 (18–55 percent), and B12 (50–82 percent) by total dietary energy intake. This study concluded that although traditional Arctic foods are a rich source of micronutrients, the decreased use of micronutrient-rich animal food sources, combined with a pattern of substituting micronutrient-poor market foods for Arctic foods, places Inuit communities at risk of poor nutrition.
Similarly, Sharma et al. (2015) analyzed dietary patterns from three 24-hour recalls from Yup’ik women aged 18 years and older, not including pregnant and lactating women. Sweetened juices, drinks, and soda were among the leading contributors for total energy intake (8.2 percent), carbohydrates (16.1 percent), and sugar (32.7 percent), while traditional foods contributed significantly to intakes of protein, iron, and vitamin A. This study also found that a dietary transition away from traditional foods has resulted in a decrease in diet quality among Alaskan Native populations.
Seafood Contribution to Protein Intake by Race and Ethnicity Among Women of Childbearing Age
To identify the contribution of seafood to protein intake across racial and ethnic groups the committee commissioned an analysis of data from NHANES 2011−2020, as detailed in Chapter 3. As shown in Table 4-4, less than 10 percent of protein among women of childbearing age was from seafood (13.5 out of a total of 144.8 g/day) and consumption of seafood high in n-3 LCPUFAs was only 4.0 g/day. Even among the top consumers (95th percentile), only 36.9 g/day of protein consumed were from seafood. Although total protein intake was similar between racial and ethnic groups (ranging 140.9–159.4 g/day), non-Hispanic Asian and non-Hispanic White individuals had the highest proportion of protein intake from seafood at 24.8 and 20.6 g/day, respectively. Non-Hispanic Black individuals had the lowest proportions at 10.0 g/day. Accordingly, non-Hispanic Asian women had the highest intakes of seafood high in n-3 LCPUFAs at 9.5 g/day, but those of non-Hispanic White women were less than half that level (4.1 g/day).
Table 4-4 shows only small differences in daily consumption of total protein or protein from seafood between women by income group, but total protein and protein intake from seafood increased slightly with increasing income. Even in the highest-income groups, the greatest amount of protein consumed (95th percentile) from seafood was only 37.4 g/day (37.3 and 36.5 g/day in the lowest- and middle-income groups, respectively). Total seafood high in n-3 LCPUFAs was highest in the high-income groups at 4.4 g/day compared with 3.0 and 3.4 g/day in the lowest- and middle-income groups, respectively.
Data from the NHANES food frequency questionnaire (FFQ), which provides the average seafood intake over the previous 30 days, shows that among 7,355 intake records, 25.5 percent (n = 1,878) did not consume any seafood. Because the time frame of the FFQ did not necessarily include the days of 24-hour recall and the episodic intake of seafood for most individuals, the data still show that 2.3 g/day of protein intake was from seafood in women classified as “nonconsumers” based on their intake in the 30 days prior to completing the FFQ. Among women who reportedly eating at least some seafood in the prior 30 days, seafood contributed 17.4 g/day of protein and 4.6 g/day of high n-3 LCPUFAs. Women classified as seafood consumers had higher total protein intakes than nonconsumers (153.1 vs. 120.9 g/day), and almost 10 times greater intake of n-3 LCPUFAs (4.6 g/day compared with 0.5 g/day). For the top consumers of seafood (95th percentile), seafood contributed an average of 40 g/day of protein.
Seafood Contribution to Protein Intake by Race and Ethnicity Among Children and Adolescents
Table 4-5 shows the contribution to children and adolescents’ total protein intake by seafood from low– and high–n-3 LCPUFA sources compared with other animal sources as well as total protein sources by race and ethnicity. The data indicate that even in the highest consumption tertile, seafood accounts for only an estimated 27.3 g (0.96 oz) of protein per day. Increasing age was associated with increasing amounts of protein consumed; however, girls consistently consumed less protein from seafood per day compared with the age-matched boys. Total protein intake from seafood ranged from 4.3–8.3 g (0.15–0.29 oz)/day in males and 4.4–7.8 g (0.16–0.29 oz)/day in females, respectively. Only a small fraction of the seafood consumed was from fatty fish (or high–n-3 LCPUFA), and therefore protein intake from those fish was only 0.7–1.8 g (0.2–0.6 oz)/day in males and 0.8–1.8 g/day (0.3–0.6 oz)/day in females.
Although total protein intake increases with increasing income, protein intake from seafood was highest (8.5 g/day) in the highest-income group, followed by the lowest-income group (6.9 g/day) and lowest in the middle-income group (6.1 g/day). Data from the FFQ showed that of 13,177 records, 40.8 percent (n = 5,372) did not consume any seafood. Because the time frame of the FFQ did not necessarily include the days of 24-hour recall, the data still show that 1.4 g/day of protein intake was from seafood among children classified as “nonconsumers” based on their intake in the 30 days prior to completing the FFQ.
Data from NHANES 24-hour recalls (Table 4-5) show that only a small portion of daily protein intake among U.S. children is from seafood (6.7 g of 118.9 g/day); protein intake from seafood with high n-3 LCPUFA is extremely low with 1.3 g/day on average. Individuals at the 95th percentile consume 27.3 g/day of protein
TABLE 4-4 Estimated Usual Mean Intake and Percentiles for Protein Intake from Seafood and Other Sources, U.S. Women of Childbearing Age
| Source of Protein | Total Protein from Seafood (g/day) | ||||||||
| N | Total Protein Foods (g/day) | Total Protein from Meat, Poultry, and Seafood (g/day) | Total Protein from Seafood (g/day) | Total Protein from Seafood Low n-3 (g/day) | Total Protein from Seafood High n-3 (g/day)a | 5th Percentile | 50th Percentile | 95th Percentile | |
| Overall | 7,355 | 144.8 | 110.1 | 13.5 | 9.9 | 4.0 | 0.9 | 10.8 | 36.9 |
| Race/Ethnicity | |||||||||
| Hispanic | 1,927 | 146.9 | 114.2 | 14.6 | 11.1 | 3.7 | 1.2 | 12.5 | 36.8 |
| Non-Hispanic Asian | 911 | 147.2 | 110.2 | 24.8 | 15.9 | 9.5 | 2.7 | 23.2 | 54.5 |
| Non-Hispanic Black | 2,354 | 140.9 | 104.0 | 10.1 | 7.2 | 2.6 | 0.8 | 8.3 | 26.9 |
| Non-Hispanic White | 1,812 | 159.4 | 132.4 | 20.6 | 16.3 | 4.1 | 2.0 | 18.5 | 47.6 |
| Other | 351 | 134.5 | 98.9 | 14.2 | 10.4 | 3.8 | 1.2 | 12.3 | 35.3 |
| Income (IPR)b | |||||||||
| Less than 1.3 | 2,736 | 138.8 | 110.8 | 13.1 | 10.1 | 3.0 | 0.9 | 10.0 | 37.3 |
| 1.3–4.99 | 3,604 | 146.8 | 111.1 | 13.4 | 9.9 | 3.4 | 0.9 | 10.8 | 36.5 |
| >5 | 1,015 | 148.1 | 106.5 | 14.3 | 9.6 | 4.4 | 1.1 | 11.7 | 37.4 |
| Seafood Consumption in the Previous 30 Days from FFQc | |||||||||
| None | 1,878 | 120.9 | 92.1 | 2.3 | 1.9 | 0.5 | 0.5 | 2.9 | 6.1 |
| Some | 5,473 | 153.1 | 116.3 | 17.4 | 12.7 | 4.6 | 4.6 | 14.5 | 40.0 |
NOTES: Usual seafood consumption modeled using 24-hour recall data. FFQ = food frequency questionnaire; IPR = income-to-poverty ratio.
a Refers to grams per day. Cooked seafood containing 500 mg or more n-3 fatty acids (EPA and DHA) per 3 oz was assigned as seafood high in n-3 fatty acids.
b Income-to-poverty ratio.
c Seafood consumers and nonconsumers defined as any/no intake of seafood in the previous 30 days in the food frequency questionnaire.
SOURCE: NHANES 2011–2012 through 2017–March 2020.
from seafood, approximately 25 percent of the daily total protein intake. Children consumed more seafood with increasing age, and boys had higher protein intake from seafood compared with girls; nonetheless, the proportion of protein intake from seafood was less than 25 percent in all age groups. Non-Hispanic Asian children consumed more protein (4.3 g/day) from seafood high in n-3 LCPUFAs than all other children, followed by Hispanic (1.5 g/day) and “other” (1.5 g/day).
Using these data from NHANES 2011–2012 through 2017–March 2020, the committee was able to estimate for children ages 2–19 years a percentage of protein intake that came from seafood compared with other animal sources and total protein sources.
A technical report from the American Academy of Pediatrics (Bernstein et al., 2019) reviewed the benefits and potential risks associated with the consumption of fish and shellfish by children and concluded that, despite the nutritional benefits, children in the United States eat relatively small amounts of fish and shellfish compared with other protein sources. The authors noted that evidence-based expert guidance, such as the DGA, advises that seafood should have a larger place in the American diet.
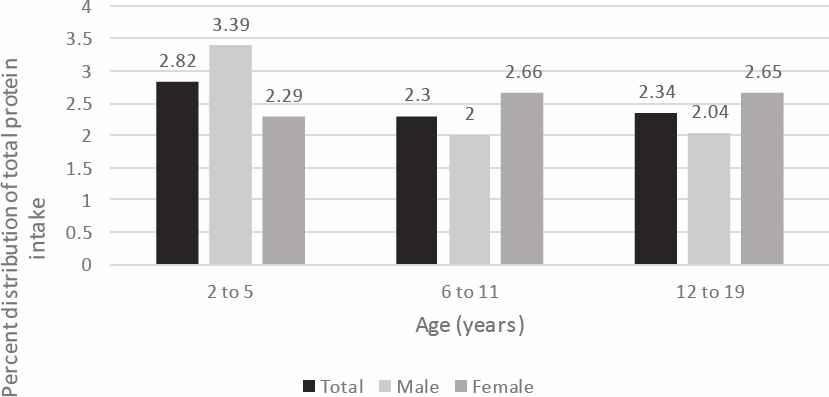
Seafood Contribution to Nutrient Intake by Age and Sex Group
Figure 4-1 shows that among children ages 2–5 years old, boys consume a higher proportion of protein from seafood than girls, and the proportion of intake from seafood is higher in this age group (2.82 percent of total protein intake) than in children ages 6–11 and 12–19 (2.3 percent of total intake). In those two older age groups, girls consume a higher proportion of protein from seafood than boys.
Seafood Contribution to EPA and DHA Intake Among Women of Childbearing Age and Children and Adolescents
To understand the contribution of seafood to daily intake of EPA and DHA, the committee compared intake of these n-3 LCPUFAs for seafood consumers and seafood nonconsumers.
Tables 4-6, 4-7, 4-8, and 4-9 show the total daily intake of EPA and DHA from all sources among U.S. individuals by age and sex group. For women of childbearing age, total intake of n-3 LCPUFAs was low, at 57 mg/day, and seafood consumers had double the intake (64 mg/day) compared with nonconsumers of seafood (36 mg/day). Children and adolescents had even lower intakes of total n-3 LCPUFAs (33 mg/day), and seafood consumers had higher intakes (39 mg/day) than nonconsumers of seafood (26 mg/day).
Kranz (2015) studied EPA and DHA consumption from seafood using 24-hour recall data from NHANES 2003–2010 (primary analysis) and 30-day FFQ data from the same NHANES cycles (secondary analysis). These analyses found that fewer than 50 percent of U.S. children and adolescents ages 2–18 years reported any consumption of fish or shellfish; only 0.3 percent of the study population reported consumption of fish high in EPA and DHA. Furthermore, among fish consumers, an average of fewer than 25 percent achieved the recommended intake of EPA and DHA. Among the full surveyed population, the fish that contributed the highest amounts of dietary EPA and DHA (on average) were canned sardines, cooked salmon, and fried carp.
Kranz et al., (2017) also used National Diet and Nutrition Survey Rolling Program data from 2008 to 2012 to examine national fish consumption trends for UK children ages 2–5, 6–11, and 12–18 years. Among all participants, 55 percent reported consumption of fish during a 4-day period, but only 4.5 percent met the recommended intake levels for fatty fish. Logistic regression models found no associations of income or ethnic group with either total fish or fatty fish consumption in the UK population. Similarly, an analysis of dietary fish consumption among U.S. children ages 1–5 years found very low intake of fish and n-3 LCPUFAs (Maguire and Monsivais, 2015).
Table 4-6 presents average mean amounts of fat consumed by women of childbearing age stratified by percentile of the seafood intake amounts and by age group, race and ethnicity, income-to-poverty ratio, and seafood consumers versus nonconsumers. Overall fat intake was 68 g/day, 25 g/day saturated and 44 g/day unsaturated. Intake of n-3 LCPUFAs was 57 mg/day with 16 mg/day from EPA and 43 mg/day from DHA. Younger women tended to consume less total fat and subtypes of fat, including n-3 LCPUFAs, compared to women 25 years and older. Non-Hispanic Asian women consumed the lowest amount of saturated fat (21 g/day) but the highest amount
TABLE 4-5 Estimated Usual Mean Intake and Percentiles for Protein Intake from Seafood and Other Sources, U.S. Children, Ages 2–19 Years
| Source of Protein | Total Protein from Seafood (g/day) | ||||||||
| N | Total Protein Foods (g/day) | Total Protein from Meat, Poultry, and Seafood (g/day) | Total Protein from Seafood (g/day) | Total Protein from Seafood Low in n-3 LCPUFA (g/day) | Total Protein from Seafood High in n-3 LCPUFA (g/day)a | 5th Percentile | 50th Percentile | 95th Percentile | |
| Overall | 13,177 | 118.9 | 95.2 | 6.7 | 5.4 | 1.3 | 0.3 | 3.4 | 27.3 |
| Males (years) | |||||||||
| 2–5 | 1,567 | 101.4 | 76.0 | 4.3 | 3.6 | 0.7 | 0.2 | 2.1 | 15.7 |
| 6–11 | 2,344 | 127.0 | 101.1 | 6.6 | 5.6 | 1.1 | 0.3 | 3.4 | 23.4 |
| 12–19 | 2,739 | 148.6 | 123.1 | 8.3 | 6.5 | 1.8 | 0.4 | 4.3 | 29.3 |
| Females (years) | |||||||||
| 2–5 | 1,584 | 81.3 | 59.8 | 4.4 | 3.5 | 0.8 | 0.2 | 2.3 | 15.3 |
| 6–11 | 2,299 | 102.7 | 80.6 | 6.2 | 5.2 | 1.1 | 0.3 | 3.3 | 21.9 |
| 12–19 | 2,644 | 120.4 | 98.6 | 7.8 | 6.1 | 1.8 | 0.3 | 4.1 | 27.7 |
| Race/Ethnicity | |||||||||
| Hispanic | 3,912 | 117.2 | 94.7 | 7.9 | 6.4 | 1.5 | 0.4 | 4.2 | 27.7 |
| Non-Hispanic Asian | 1,196 | 115.7 | 93.0 | 13.4 | 9.3 | 4.3 | 0.8 | 9.5 | 39.8 |
| Non-Hispanic Black | 3,688 | 118.3 | 92.2 | 5.0 | 4.0 | 1.1 | 0.2 | 2.4 | 18.2 |
| Non-Hispanic White | 3,430 | 127.4 | 110.1 | 9.1 | 8.1 | 0.9 | 0.4 | 5.6 | 29.6 |
| Other | 951 | 114.0 | 89.7 | 6.1 | 4.4 | 1.5 | 0.3 | 3.3 | 21.2 |
| Income (IPR)b | |||||||||
| Less than 1.3 | 5,690 | 117.3 | 97.1 | 6.9 | 5.7 | 1.2 | 0.3 | 3.3 | 25.1 |
| 1.3–4.99 | 6,195 | 119.6 | 94.9 | 6.1 | 4.9 | 1.2 | 0.2 | 3.0 | 22.1 |
| 5 or greater | 1,292 | 120.6 | 91.9 | 8.5 | 6.5 | 2.1 | 0.4 | 5.0 | 28.8 |
| Seafood Consumption in the Previous 30 Days from FFQc | |||||||||
| None | 5,372 | 106.0 | 84.4 | 1.4 | 1.2 | 0.2 | 0.2 | 0.9 | 4.3 |
| Some | 7,799 | 128.4 | 103.0 | 10.6 | 8.4 | 2.2 | 1.5 | 7.5 | 30.0 |
NOTE: Usual seafood consumption modeled using 24-hour recall data.
a Refers to grams per day. Cooked seafood containing 500 mg or more n-3 fatty acids (EPA and DHA) per 3 oz was assigned as seafood high in n-3 fatty acids.
b Income-to-poverty ratio.
c Seafood consumers and nonconsumers defined as any/no intake of seafood in the previous 30 days in the food frequency questionnaire (FFQ).
SOURCE: NHANES 2011–2012 through March 2017–2020.
SOURCE: DGAC, 2020.
of n-3 LCPUFA (80 mg/day), EPA (22 mg/day), and DHA (72 mg/day). Increasing income was associated with increased amount of total fat, saturated fat, and unsaturated fat but intake of n-3 LCPUFAs and of DHA was slightly higher in the middle-income group than the lowest- and highest-income groups. Intakes of total fat, saturated fat, and unsaturated fat were similar between seafood consumers and nonconsumers, but intakes of n-3 LCPUFA, EPA, and DHA among seafood nonconsumers were 33 percent, 7 percent, and almost 50 percent lower, respectively, compared to intake among seafood consumers.
Table 4-7 shows mean daily consumption of fatty acids by children and adolescents (ages 2–19 years). On average, they consumed 67 g/day total fat, 26 g/day saturated fat, and 41.g/day unsaturated fat, and boys had higher intakes of total fat than girls in every age group. Only 33 mg/day were n-3 LCPUFAs, of which 11 mg/day were EPA and 22 mg/day were DHA. Seafood consumers at the highest percentile of intake consumed 71 mg/day. Thus, no subgroup of the population age 2–19 years met recommendations for combined intake of EPA/DHA (100–150 mg/day for 2- to 4-year-olds; 150–200 mg/day for 4- to 6-year-olds; 200–300 mg/day for ages 6–10 years; and 300 mg/day for all older children) (NHANES 2011–2020). Even individuals with the highest intakes of n-3 LCPUFAs achieved intakes around 50 percent of recommended levels. For males, increasing age was associated with higher EPA and DHA intake levels. For females intakes were higher in ages 6–19 years (11 mg/day EPA and 22 mg/day DHA) than ages 2–5 years (7 mg/day EPA and 17 mg/day DHA).
Total and saturated fat intake was highest in non-Hispanic Black and Other (unspecified race/ethnicity) children, but intakes of n-3 LCPUFAs were highest among non-Hispanic Asians. Non-Hispanic Asians consumed 45 mg/day, followed by non-Hispanic Whites (37 mg/day), Hispanics (36 mg/day), and non-Hispanic Blacks (30 mg/day). At the lowest percentiles of fat intake, little differences existed by racial/ethnic group in n-3 LCPUFA intake levels, whereas at the highest percentiles of fat intake, non-Hispanic Asian children had the highest n-3 LCPUFA intake (94 mg/day), followed by non-Hispanic White (77 mg/day) and Hispanic children (75 mg/day). Intakes of total fat, saturated fat, and unsaturated fat increased with increasing income, but n-3 LCPUFA intakes did not differ among income groups.
Table 4-8 presents population representative data from the Canadian Community Health Survey for seafood-consuming women of childbearing age and children ages 1–19 years in terms of intake of EPA, DHA, and EPA+DHA. Women of childbearing age (20–54 years old) had mean intakes of 298.7 mg/day of EPA, 515.7 mg/day of DHA, and 814.4 mg/day of EPA+DHA. Compared with pregnant women, lactating women had more than three-fold higher EPA, DHA, and EPA+DHA intake (358.1 vs. 95.7 mg/day EPA; 651.1 vs. 160.0 mg/day DHA; and 1,009.2 vs. 255.8 mg/day EPA+DHA.
TABLE 4-6 Estimated Usual Mean Intake and Percentiles of Fatty Acids by Women of Childbearing Age, by Age Group, Race/Ethnicity, Income, and Seafood Consumption Status
| N | Total Fat (g) | Total Saturated Fat (g) | Total Unsaturated Fat (g) | Total Long Chain n-3 Fatty Acid (mg) | EPA (mg) | DHA (mg) | 5th Percentile | 50th Percentile | 95th Percentile | |
| Overall | 7,355 | 68.2 | 24.5 | 43.8 | 57 | 16 | 43 | 0.014 | 0.047 | 0.134 |
| Age Group (years) | ||||||||||
| 16–25 | 2,465 | 66.4 | 24.3 | 42.1 | 50 | 16 | 36 | 0.013 | 0.041 | 0.118 |
| 25–40 | 2,918 | 70.2 | 25.1 | 45.3 | 61 | 17 | 46 | 0.016 | 0.050 | 0.143 |
| 41–50 | 1,972 | 67.1 | 23.8 | 43.3 | 59 | 16 | 46 | 0.015 | 0.049 | 0.136 |
| Race/Ethnicity | ||||||||||
| Hispanic | 1,927 | 66.9 | 23.9 | 43.1 | 60 | 16 | 45 | 0.016 | 0.050 | 0.138 |
| Non-Hispanic Asian | 911 | 60.9 | 20.9 | 39.9 | 80 | 22 | 72 | 0.019 | 0.066 | 0.186 |
| Non-Hispanic White | 1,812 | 71.3 | 24.7 | 46.6 | 69 | 20 | 52 | 0.019 | 0.058 | 0.158 |
| Non-Hispanic Black | 2,354 | 68.8 | 25.1 | 43.8 | 51 | 15 | 37 | 0.013 | 0.042 | 0.117 |
| Other | 351 | 67.7 | 24.4 | 43.2 | 55 | 16 | 40 | 0.014 | 0.046 | 0.127 |
| Income-to-Poverty Ratio | ||||||||||
| Less than 1.3 | 2,724 | 65.6 | 23.7 | 41.8 | 54 | 16 | 41 | 0.013 | 0.044 | 0.129 |
| 1.3–4.99 | 3,613 | 68.8 | 24.7 | 44.1 | 59 | 16 | 45 | 0.015 | 0.049 | 0.139 |
| ≥ 5.0 | 1,018 | 70.6 | 25.1 | 45.7 | 56 | 17 | 41 | 0.015 | 0.046 | 0.128 |
| Seafood Consumption Status | ||||||||||
| Nonconsumer of seafood | 1,878 | 67.8 | 24.5 | 43.3 | 36 | 11 | 24 | 0.010 | 0.030 | 0.082 |
| Seafood consumer | 5,473 | 68.4 | 24.5 | 43.9 | 64 | 18 | 49 | 0.019 | 0.054 | 0.145 |
NOTES: Seafood consumers and nonconsumers defined as any/no intake of seafood in the previous 30 days in the food frequency questionnaire (FFQ). Excludes intake of dietary supplements. Variables used to predict n-3, EPA, and DHA consumption included sex, age, race, income category, and seafood consumption in the FFQ; for other fatty acids FFQ consumption was not included in the model.
SOURCE: NHANES 2011−2012 through 2017−March 2020.
TABLE 4-7 Estimated Usual Mean Intake and Percentiles of Fatty Acids by Children and Adolescents, by Age Group, Race/Ethnicity, Income Status, and Seafood Consumption Status
| N | Total Fat (g) | Total Saturated Fat (g) | Total Unsaturated Fat (g) | Total Long-Chain n-3 Fatty Acid (mg) | EPA (mg) | DHA (mg) | 5th Percentile | 50th Percentile | 95th Percentile | |
| Overall | 13,177 | 66.6 | 25.6 | 41.0 | 33 | 11 | 22 | 0.011 | 0.029 | 0.071 |
| Males (years) | ||||||||||
| 2–5 | 1,567 | 58.2 | 23.0 | 35.3 | 28 | 9 | 19 | 0.010 | 0.024 | 0.058 |
| 6–11 | 2,344 | 74.0 | 28.9 | 45.2 | 37 | 13 | 24 | 0.013 | 0.032 | 0.077 |
| 12–19 | 2,739 | 75.9 | 28.7 | 47.0 | 39 | 14 | 25 | 0.013 | 0.034 | 0.081 |
| Females (years) | ||||||||||
| 2–5 | 1,584 | 49.6 | 19.4 | 30.3 | 24 | 7 | 17 | 0.008 | 0.021 | 0.049 |
| 6–11 | 2,299 | 63.8 | 26.7 | 39.2 | 31 | 11 | 21 | 0.011 | 0.027 | 0.065 |
| 12–19 | 2,644 | 65.6 | 24.5 | 40.9 | 33 | 11 | 22 | 0.011 | 0.028 | 0.068 |
| Race/Ethnicity | ||||||||||
| Hispanic | 3,912 | 63.8 | 24.4 | 39.3 | 36 | 11 | 24 | 0.012 | 0.031 | 0.075 |
| Non-Hispanic Asian | 1,196 | 61.2 | 23.5 | 37.6 | 45 | 14 | 35 | 0.015 | 0.039 | 0.094 |
| Non-Hispanic White | 3,430 | 66.2 | 24.1 | 42.0 | 37 | 13 | 24 | 0.012 | 0.032 | 0.077 |
| Non-Hispanic Black | 3,688 | 68.5 | 26.6 | 41.9 | 30 | 11 | 19 | 0.010 | 0.026 | 0.063 |
| Other | 951 | 67.5 | 26.3 | 41.1 | 32 | 12 | 21 | 0.011 | 0.027 | 0.068 |
| Income-to-Poverty Ratio | ||||||||||
| Less than 1.3 | 5,690 | 64.5 | 24.7 | 39.7 | 33 | 11 | 22 | 0.011 | 0.029 | 0.071 |
| 1.3–4.99 | 6,195 | 67.3 | 25.8 | 41.5 | 33 | (11) | 22 | 0.011 | 0.029 | 0.071 |
| ≥ 5 | 1,292 | 69.2 | 26.6 | 42.5 | 33 | (12) | 23 | 0.011 | 0.029 | 0.071 |
| Seafood Intake Status | ||||||||||
| Nonconsumer of seafood | 5,372 | 66.6 | 25.6 | 41.0 | 26 | (10) | 15 | 0.009 | 0.023 | 0.053 |
| Seafood consumer | 7,799 | 66.6 | 25.4 | 41.1 | 39 | (13) | 27 | 0.014 | 0.034 | 0.079 |
NOTES: Seafood consumers and nonconsumers defined as any/no intake of seafood in the previous 30 days in the food frequency questionnaire (FFQ). Excludes intake of dietary supplements. Variables used to predict n-3, EPA, and DHA consumption included sex, age, race, income category, and seafood consumption in the FFQ; for other fatty acids, FFQ consumption was not included in the model.
SOURCE: NHANES 2011–2012 through 2017–March 2020.
TABLE 4-8 Daily EPA and DHA Intake by Age, Sex, and Pregnancy/Lactating Status for Seafood Consumers in Canada, 2015
| EPA | DHA | EPA+DHA | |||||
| Weighted (%) | Mean (mg/day) | SEc (mg) | Mean (mg/day) | SE (mg/day) | Mean (mg/day) | SE (mg/day) | |
| Male (years)a | |||||||
| 1–5 | 4.77 | 124.9 | 25.8 | 235.5 | 41.9 | 360.4 | 66.3 |
| 6–11 | 4.82 | 302.0 | 88.5 | 583.4 | 182.1 | 885.4 | 270.0 |
| 12–19 | 5.02 | 298.7 | 39.1 | 581.7 | 72.2 | 880.4 | 105.3 |
| Female (years)b | |||||||
| 1–5 | 4.90 | 95.3 | 27.0 | 179.7 | 40.7 | 275.0 | 67.5 |
| 6–11 | 3.47 | 131.8 | 30.3 | 273.0 | 73.9 | 404.9 | 103.1 |
| 12–19 | 7.06 | 322.6 | 64.2 | 518.5 | 93.1 | 841.1 | 154.5 |
| 20–54 | 50.05 | 298.7 | 61.6 | 515.7 | 89.7 | 814.4 | 151.1 |
| Pregnant | 1.03 | 95.7 | 25.1 | 160.0 | 53.2 | 255.8 | 75.2 |
| Lactating | 1.62 | 358.1 | 108.2 | 651.1 | 195.6 | 1009.2 | 300.8 |
a 17.1% of the total surveyed male population are seafood consumers.
b 17.9% of the total surveyed male population are seafood consumers.
cSE = standard error.
SOURCE: Canadian Community Health Survey, 2015 (Statistics Canada, 2015).
Among children consuming seafood, boys ages 6–11 years consumed more EPA, DHA, and EPA+DHA than boys ages 1–5 or 12–19 years. Girls consumed less EPA, DHA, and EPA+DHA than boys at every age group; they consumed more fatty acids with increasing age.
Table 4-9 presents the same data as Table 4-8, but for nonconsumers of seafood. Women of childbearing age consumed an average 5.9 mg/day of EPA, 28.4 mg/day of DHA, and 34.3 mg/day of EPA+DHA. Pregnant women consumed approximately twice as much EPA, DHA, and EPA+DHA compared with lactating women. For both boys and girls, increasing age was associated with increasing EPA, DHA, and EPA+DHA intake. Overall, boys consumed more than girls, except girls ages 1–5 years consumed slightly more DHA than boys in that age group.
A comparison of seafood consumers and nonconsumers indicates that individuals of all ages and sex groups who were seafood consumers had much higher intakes of EPA, DHA, and EPA+DHA. For instance, 12–19-year-old boys who consumed seafood had 880.4 mg/day of EPA+DHA, whereas nonconsumer boys of the same age had only 48.1 mg/day, a 20-fold difference.
Seafood Contribution to Micronutrient Intake Among Women of Childbearing Age and Children and Adolescents
According to Table 4-10, women age 16–25 years consumed lower amounts of micronutrients compared to older women of childbearing age, except for vitamin B12, which was consumed in lowest amounts by women age 41–50 years. No large differences in average intakes of any of the micronutrients were observed by race or ethnicity. Increasing income was associated with increased intake for all micronutrients, except for vitamin D, which was the same in women from middle- and high-income households (3.9 µg/day compared to 3.7 µg/day in the low-income group). The RDA for vitamin D for adult and pregnant and lactating women is 15 µg/day. Only small differences were observed in intake of any micronutrient between seafood consumers and nonconsumers.
Table 4-11 shows average consumption of micronutrients among children age 2–19 years. Among boys, increasing age is associated with increased consumption of selenium, zinc, and magnesium. Boys age 6–11 years had the highest intake of iron (15.8 mg/day), folate (405.0 µg/day), vitamin B12 (5.4 µg/day), choline (5.4 µg/day),
TABLE 4-9 Daily EPA and DHA Intake by Age, Sex, and Pregnancy/Lactating Status for Nonconsumers of Fish in Canada, 2015
| Weighted (%) | EPA | DHA | EPA and DHA | ||||
| Mean (mg/day) | SEc (mg/day) | Mean (mg/day) | SE (mg/day) | Mean (mg/day) | SE (mg/day) | ||
| Male (years)a | |||||||
| 1–5 | 5.69 | 4.7 | 0.3 | 18.7 | 1.3 | 23.5 | 1.5 |
| 6–11 | 7.31 | 5.9 | 0.4 | 23.1 | 1.7 | 29.1 | 2.0 |
| 12–19 | 10.18 | 10.2 | 1.1 | 37.9 | 5.5 | 48.1 | 6.6 |
| Female (years)b | |||||||
| 1–5 | 6.00 | 4.0 | 0.4 | 18.8 | 1.5 | 22.8 | 1.7 |
| 6–11 | 6.85 | 5.6 | 0.4 | 19.8 | 1.5 | 25.4 | 1.8 |
| 12–19 | 8.57 | 7.6 | 0.6 | 25.1 | 1.5 | 32.7 | 1.8 |
| 20–54 | 46.46 | 5.9 | 0.2 | 28.4 | 1.3 | 34.3 | 1.5 |
| Pregnant | 1.18 | 11.8 | 3.5 | 51.5 | 15.7 | 63.3 | 19.0 |
| Lactating | 1.58 | 5.9 | 0.8 | 26.6 | 3.8 | 32.5 | 4.4 |
a 82.9% of the total surveyed male population are seafood consumers.
b 82.1% of the total surveyed male population are seafood consumers.
cSE = standard error.
SOURCE: Canadian Community Health Survey, 2015 (Statistics Canada, 2015).
potassium (2,367.5 mg/day), and calcium (1,157.3 mg/day). Older boys (12–19 years) consumed lower levels of these nutrients, and younger boys (2–5 years) had the lowest intake levels.
Similarly, among girls, intakes were also highest among ages 6–11 years for iron (13.3 mg/day), folate (350.8 µg/day), vitamin B12 (4.3 µg/day), choline (4.3 µg/day), potassium (2,037.3 mg/day), and calcium (981.6 mg/day). Older girls consumed lower levels of these nutrients, and younger girls had the lowest intakes.
Vitamin D intake decreased among both boys and in girls as age increased. No large differences existed in consumption of any of the nutrients by racial or ethnic group except calcium, which was the highest in non-Hispanic Black children (1,055.4 mg/day) and lowest in non-Hispanic White children (842.9 mg/day). Intakes of selenium and zinc increased with increasing household income level, and the highest intakes of magnesium, iron, folate, potassium, calcium, and vitamin D were found in the highest-income group. Only small differences were observed in nutrient intake of any micronutrient between seafood consumers and nonconsumers.
Summary of Evidence on Dietary Patterns and Seafood Consumption
Children and women of childbearing age consume very small amounts of seafood, which contributes less than 25 percent of their total protein intake. Different types of seafood vary greatly in nutrient density. For example, fatty fish such as salmon have much higher n-3 LCPUFA content, vitamin D, and calcium, while shrimp, salmon, and Alaskan pollock are high in choline. Compared with other types of seafood, Alaskan pollock has the highest content of magnesium. Overall, both women of childbearing age and children and adolescents have low intake of n-3 LCPUFAs from seafood, particularly EPA and DHA in all age groups. Non-Hispanic Asian women and children and adolescents have higher consumption compared to the other racial and ethnic groups. Household income was not associated with intake levels of EPA and DHA.
Both women of childbearing age and children and adolescents classified as seafood consumers were 40.8 and 25.6 percent, respectively, of the NHANES sample population. Seafood nonconsumers had much lower intakes of EPA and DHA. Total fat, saturated fat, and nutrient intakes either did not differ at all or only slightly differed between individuals classified as consumers, and nonconsumers.
TABLE 4-10 Estimated Usual Mean Intake of Micronutrients by Women of Childbearing Age by Age Group, Race/Ethnicity, Income Status, and Seafood Consumption Status
| N | Selenium (µg) | Zinc (mg) | Magnesium (mg) | Iron (mg) | Folate (µg) | B12 (µg) | Choline (mg) | Potassium (mg) | Calcium (mg) | Vitamin D (µg) | |
| Overall | 7,355 | 98.7 | 9.4 | 268.5 | 12.6 | 351.9 | 4.0 | 280.0 | 2,272.5 | 879.3 | 3.9 |
| Age Group (years) | |||||||||||
| 16–25 | 2,465 | 94.7 | 8.9 | 240.6 | 12.1 | 338.2 | 4.0 | 252.7 | 2,056.0 | 855.0 | 3.7 |
| 25–40 | 2,918 | 102.4 | 9.8 | 282.0 | 13.0 | 362.4 | 4.1 | 294.7 | 2,371.3 | 904.9 | 4.0 |
| 41–50 | 1,972 | 97.4 | 9.4 | 278.5 | 12.4 | 350.9 | 3.9 | 287.0 | 2,355.0 | 867.1 | 3.9 |
| Race/Ethnicity | |||||||||||
| Hispanic | 1,927 | 102.0 | 9.7 | 275.8 | 13.1 | 359.2 | 4.1 | 292.9 | 2,319.6 | 903.6 | 4.1 |
| Non-Hispanic Asian | 911 | 105.7 | 9.3 | 290.8 | 12.9 | 402.4 | 3.8 | 297.3 | 2,443.2 | 788.5 | 4.2 |
| Non-Hispanic White | 1,812 | 99.9 | 8.7 | 237.9 | 12.0 | 313.0 | 3.8 | 271.3 | 2,080.4 | 767.9 | 3.4 |
| Non-Hispanic Black | 2,354 | 96.5 | 9.5 | 271.6 | 12.5 | 354.1 | 4.1 | 276.6 | 2,291.3 | 910.2 | 3.9 |
| Other | 351 | 95.7 | 8.9 | 258.5 | 12.0 | 333.9 | 4.2 | 263.2 | 2,151.5 | 849.2 | 3.5 |
| Income-to-Poverty Ratio | |||||||||||
| Less than 1.3 | 2,724 | 96.5 | 9.0 | 246.2 | 12.3 | 335.7 | 3.9 | 267.0 | 2,136.8 | 847.1 | 3.7 |
| 1.3–4.99 | 3,613 | 99.2 | 9.4 | 268.6 | 12.5 | 351.3 | 4.0 | 284.4 | 2,274.1 | 880.6 | 3.9 |
| ≥ 5.0 | 1,018 | 100.3 | 10.0 | 301.2 | 13.2 | 376.9 | 4.2 | 286.9 | 2,464.0 | 936.9 | 3.9 |
| Seafood Consumption Status | |||||||||||
| Nonconsumer of seafood | 1,878 | 97.9 | 9.4 | 264.1 | 12.5 | 350.2 | 4.0 | 275.8 | 2,240.8 | 881.4 | 3.8 |
| Seafood consumer | 5,473 | 98.9 | 9.4 | 270.0 | 12.6 | 352.5 | 4.0 | 281.4 | 2,283.5 | 878.6 | 3.9 |
NOTES: Seafood consumers and nonconsumers defined as any/no intake of seafood in the previous 30 days in the food frequency questionnaire. Excludes intake of dietary supplements.
SOURCE: NHANES 2011–2012 through 2017–March 2020.
TABLE 4-11 Estimated Usual Mean Intake of Micronutrients by U.S. Children and Adolescents, by Age Group, Race/Ethnicity, Income Status, and Seafood Consumption Status
| N | Selenium (µg) | Zinc (mg) | Magnesium (mg) | Iron (mg) | Folate (µg) | B12 (µg) | Choline (mg) | Potassium (mg) | Calcium (mg) | Vitamin D (µg) | |
| Overall | 13,177 | 95.8 | 9.8 | 236.0 | 13.7 | 356.0 | 4.6 | 4.6 | 2,144.6 | 1,009.6 | 5.3 |
| Males (years) | |||||||||||
| 2–5 | 1,567 | 83.9 | 9.1 | 224.8 | 12.5 | 325.9 | 4.7 | 4.7 | 2,166.3 | 1,054.0 | 6.8 |
| 6–11 | 2,344 | 106.1 | 11.1 | 258.6 | 15.8 | 405.0 | 5.4 | 5.4 | 2,367.5 | 1,157.3 | 6.4 |
| 12–19 | 2,739 | 113.3 | 11.1 | 260.0 | 15.3 | 390.1 | 5.2 | 5.2 | 2,321.7 | 1,061.6 | 4.9 |
| Females (years) | |||||||||||
| 2–5 | 1,584 | 68.7 | 7.4 | 195.5 | 10.4 | 280.5 | 3.7 | 3.7 | 1,855.9 | 893.0 | 5.6 |
| 6–11 | 2,299 | 87.9 | 9.1 | 225.2 | 13.3 | 350.8 | 4.3 | 4.3 | 2,037.3 | 981.6 | 5.2 |
| 12–19 | 2,644 | 94.2 | 9.2 | 225.6 | 12.9 | 337.4 | 4.1 | 4.1 | 1,994.9 | 896.7 | 4.0 |
| Race/Ethnicity | |||||||||||
| Hispanic | 3,912 | 95.3 | 9.8 | 237.8 | 14.0 | 365.6 | 4.7 | 4.7 | 2,201.0 | 1,024.7 | 5.6 |
| Non-Hispanic Asian | 1,196 | 102.3 | 9.8 | 249.6 | 13.6 | 385.9 | 4.4 | 4.4 | 2,243.4 | 951.0 | 5.7 |
| Non-Hispanic White | 3,430 | 92.9 | 8.9 | 213.1 | 13.1 | 329.7 | 4.1 | 4.1 | 1,995.2 | 842.9 | 4.3 |
| Non-Hispanic Black | 3,688 | 96.4 | 10.0 | 240.9 | 13.8 | 357.5 | 4.8 | 4.7 | 2,157.5 | 1,055.4 | 5.4 |
| Other | 951 | 94.0 | 9.6 | 229.4 | 13.4 | 342.4 | 4.6 | 4.6 | 2,074.6 | 987.9 | 5.2 |
| Income-to-Poverty Ratio | |||||||||||
| Less than 1.3 | 5,690 | 94.7 | 9.6 | 224.8 | 13.7 | 351.7 | 4.7 | 4.7 | 2,098.5 | 977.2 | 5.3 |
| 1.3–4.99 | 6,195 | 95.4 | 9.7 | 236.5 | 13.6 | 353.4 | 4.6 | 4.6 | 2,135.9 | 1,004.4 | 5.1 |
| ≥ 5.0 | 1,292 | 99.8 | 10.1 | 257.8 | 14.1 | 374.5 | 4.7 | 4.7 | 2,278.7 | 1,101.2 | 5.6 |
| Seafood Intake Status | |||||||||||
| Nonconsumer of seafood | 5,372 | 95.7 | 9.8 | 235.7 | 13.7 | 355.8 | 4.7 | 4.7 | 2,142.6 | 1,012.9 | 5.3 |
| Seafood consumer | 7,799 | 95.9 | 9.7 | 236.3 | 13.7 | 356.2 | 4.6 | 4.6 | 2,146.0 | 1,007.2 | 5.3 |
NOTES: Seafood consumers and nonconsumers defined as any/no intake of seafood in the previous 30 days in the food frequency questionnaire (FFQ). Excludes intake of dietary supplements.
SOURCE: NHANES 2011–2012 through 2017–March 2020.
FINDINGS AND CONCLUSION
Findings
Nutrient Composition of Seafood
- Current evidence on the nutrient content of seafood indicates that seafood is a rich source of multiple nutrients, including vitamin D, calcium, potassium, and iron, which are identified as nutrients of public health concern by the Dietary Guidelines for Americans and play roles in supporting pregnancy and lactation as well as growth and development.
- Seafood is an important source of n-3 LCPUFAs, which are key nutrients for the prenatal period, during lactation, and throughout childhood. Choline, iodine, and magnesium are additional nutrients that are provided by seafood and have important functions throughout childhood and adolescence.
- Individuals who do not consume seafood likely have intakes of n-3 LCPUFAs below recommended amounts.
Dietary Patterns
- Seafood is one component of healthful dietary patterns described in the Dietary Guidelines for Americans. The majority of the U.S. and Canadian population has lower-than-recommended intakes of n-3 LCPUFAs from seafood. Intakes are highest among high-income women and children, but income status, however, is not consistently associated with intake levels of other nutrients.
- Among Native and Indigenous populations who are transitioning away from traditional diets, limiting seafood consumption increases the risk of not achieving optimal intake of a range of nutrients, including n-3 LCPUFAs. Low seafood consumption may also contribute to inadequate nutrient intakes among other at-risk populations who are low consumers, such as non-Hispanic Black and Hispanic Americans, and especially among those with lower incomes or experiencing food insecurity.
Conclusion
- Taken together, the committee concludes that nutrient intakes from seafood by women of childbearing age and children are low.
RESEARCH GAPS
- Data are needed on levels of nutrient intake by seafood consumers who meet current seafood intake recommendations compared to nonconsumers and low consumers of seafood.
- Additional data are needed on the nutrient composition of types of seafood frequently consumed in different geographic regions in the United States and Canada.
REFERENCES
Ariño, A., J. Beltrán, A. Herrera, and P. Roncalés. 2013. Fish and seafood: Nutritional value. In Encyclopedia of human nutrition, 3rd ed. Pp. 254-261.
ARS (Agricultural Research Service). 2019. FoodData Central. http://fdc.nal.usda.gov (accessed February 27, 2024).
Auclair, O., and S. A. Burgos. 2021. Protein consumption in Canadian habitual diets: Usual intake, inadequacy, and the contribution of animal- and plant-based foods to nutrient intakes. Applied Physiology, Nutrition, and Metabolism 46(5):501-510.
Bell, J. G., R. J. Henderson, D. R. Tocher, and J. R. Sargent. 2004. Replacement of dietary fish oil with increasing levels of linseed oil: Modification of flesh fatty acid compositions in Atlantic salmon (Salmo salar) using a fish oil finishing diet. Lipids 39(3):223-232.
Benedik, E. 2022. Sources of vitamin D for humans. International Journal for Vitamin and Nutrition Research 92(2):118-125.
Bernstein, A. S., E. Oken, S. de Ferranti, Council on Environmental Health, and Committee on Nutrition. 2019. Fish, shellfish, and children’s health: An assessment of benefits, risks, and sustainability. Pediatrics 143(6):e20190999.
Bland, J. M., C. C. Grimm, P. J. Bechtel, U. Deb, and M. M. Dey. 2021. Proximate composition and nutritional attributes of ready-to-cook catfish products. Foods 10(11):2716. https://doi.org/10.3390/foods10112716.
Brunborg, L. A., K. Julshamn, R. Nortvedt, and L. Frøyland. 2006. Nutritional composition of blubber and meat of hooded seal (Cystophora cristata) and harp seal (Phagophilus groenlandicus) from Greenland. Food Chemistry 96(4):524-531.
Chiuve, S., E. Giovannucci, S. Hankinson, S. H. Zeisel, L. W. Dougherty, W. C. Willett, and E. B. Rimm. 2007. The association between betaine and choline intakes and the plasma concentrations of homocysteine in women. American Journal of Clinical Nutrition 86:1073-1081.
Cisneros-Montemayor, A. M., D. Pauly, L. V. Weatherdon, and Y. Ota. 2016. A global estimate of seafood consumption by coastal Indigenous peoples. PLoS One 11(12):e0166681.
Corbin, K. D., and S. H. Zeisel. 2012. Choline metabolism provides novel insights into non-alcoholic fatty liver disease and its progression. Current Opinion in Gastroenterology 28(2):159.
Cortes-Albornoz, M. C., D. P. Garcia-Guaqueta, A. Velez-van-Meerbeke, and C. Talero-Gutierrez. 2021. Maternal nutrition and neurodevelopment: A scoping review. Nutrients 13(10).
Crawford, S. A., A. R. Brown, J. Teruel Camargo, E. H. Kerling, S. E. Carlson, B. J. Gajewski, D. K. Sullivan, and C. J. Valentine. 2023. Micronutrient gaps and supplement use in a diverse cohort of pregnant women. Nutrients 15(14).
de Escobar, G. M., M. J. Obregon, and F. E. del Rey. 2007. Iodine deficiency and brain development in the first half of pregnancy. Public Health Nutrition 10(12A):1554-1570.
DGAC (Dietary Guidelines Advisory Committee). 2015. Scientific Report of the 2015 Dietary Guidelines Advisory Committee: Advisory Report to the Secretary of Health and Human Services and the Secretary of Agriculture. U.S. Department of Agriculture, Agricultural Research Service, Washington, DC.
DGAC. 2020. Data Supplement for Food Category Sources: All Life Stages. 2020 Dietary Guidelines Advisory Committee Project. Washington, DC: U.S. Department of Agriculture and U.S. Department of Health and Human Services.
FAO (Food and Agriculture Organization of the United Nations). 2010. Fats and fatty acids in human nutrition. Report of an expert consultation. https://www.fao.org/documents/card/en?details=8c1967eb-69a8-5e62-9371-9c18214e6fce (accessed February 27, 2024).
Ford, J. E., and S. H. Hutner. 1955. Role of vitamin B12 in the metabolism of microorganisms. Vitamins and Hormones (13):101-136.
Frassetto, L. A., A. Goas, R. Gannon, S. A. Lanham-New, and H. Lambert. 2023. Potassium. Advances in Nutrition 14(5):1237-1240.
Gardner, C. D., J. C. Hartle, R. D. Garrett, L. C. Offringa, and A. S. Wasserman. 2019. Maximizing the intersection of human health and the health of the environment with regard to the amount and type of protein produced and consumed in the United States. Nutrition Reviews 77(4):197-215.
Griebel-Thompson, A. K., S. Sands, L. Chollet-Hinton, D. Christifano, D. K. Sullivan, H. Hull, J. T. Camargo, and S. E. Carlson. 2023. Iodine intake from diet and supplements and urinary iodine concentration in a cohort of pregnant women in the United States. American Journal of Clinical Nutrition 118(1):283-289.
Guo, M., and G. M. Hendricks. 2008. Chemistry and biological properties of human milk. Current Nutrition and Food Science 4(4):305-320.
Harding, K. B., J. P. Peña-Rosas, A. C. Webster, C. M. Yap, B. A. Payne, E. Ota, and L. M. De-Regil. 2017. Iodine supplementation for women during the preconception, pregnancy and postpartum period. Cochrane Database of Systematic Reviews(3). 3(3):CD011761.
Hatch-McChesney, A., and H. R. Lieberman. 2022. Iodine and iodine deficiency: A comprehensive review of a re-emerging issue. Nutrients 14(17).
Hofmeyr, G. J., A. P. Betrán, M. Singata-Madliki, G. Cormick, S. P. Munjanja, S. Fawcus, S. Mose, D. Hall, A. Ciganda, and A. H. Seuc. 2019. Prepregnancy and early pregnancy calcium supplementation among women at high risk of pre-eclampsia: A multicentre, double-blind, randomised, placebo-controlled trial. Lancet 393(10169):330-339.
Hurrell, R., and I. Egli. 2010. Iron bioavailability and dietary reference values. American Journal of Clinical Nutrition 91(5):1461S-1467S.
Idjradinata, P., and E. Pollitt. 1993. Reversal of developmental delays in iron-deficient anaemic infants treated with iron. Lancet 341(8836):1-4.
IOM. 1998. Dietary Reference Intakes for thiamin, riboflavin, niacin, vitamin B6, folate, vitamin B12, pantothenic acid, biotin, and choline. Washington, DC: National Academy Press.
IOM. 2000. Dietary Reference Intakes for vitamin C, vitamin E, selenium, and carotenoids. Washington, DC: National Academy Press.
IOM. 2001. Dietary Reference Intakes for vitamin A, vitamin K, arsenic, boron, chromium, copper, iodine, iron, manganese, molybdenum, nickel, silicon, vanadium, and zinc. Washington, DC: National Academy Press.
IOM. 2002/2005. Dietary Reference Intakes for water, potassium, sodium, chloride, and sulfate. Washington, DC: The National Academies Press.
IOM. 2011. Dietary Reference Intakes for calcium and vitamin D. Washington, DC: The National Academies Press.
Johnson-Wimbley, T. D., and D. Y. Graham. 2011. Diagnosis and management of iron deficiency anemia in the 21st century. Therapeutic Advances in Gastroenterology 4(3):177-184.
Jones, G. 2008. Pharmacokinetics of vitamin D toxicity. American Journal of Clinical Nutrition 88(2):582S-586S.
Keiver, K., K. Ronald, and H. Draper. 1988. Plasma levels of vitamin D and some metabolites in marine mammals. Canadian Journal of Zoology 66(6):1297-1300.
Kenny, D. E., T. O’Hara, T. C. Chen, Z. Lu, X. Tian, and M. F. Holick. 2004. Vitamin D content in Alaskan arctic zooplankton, fishes, and marine mammals. Zoo Biology 23(1):33-43.
Kenny, T. A., X. F. Hu, H. V. Kuhnlein, S. D. Wesche, and H. M. Chan. 2018. Dietary sources of energy and nutrients in the contemporary diet of Inuit adults: Results from the 2007-08 Inuit health survey. Public Health Nutrition 21(7):1319-1331.
Kohrle, J. 2015. Selenium and the thyroid. Current Opinion in Endocrinology, Diabetes, and Obesity 22(5):392-401.
Kondaiah, P., P. S. Yaduvanshi, P. A. Sharp, and R. Pullakhandam. 2019. Iron and zinc homeostasis and interactions: Does enteric zinc excretion cross-talk with intestinal iron absorption? Nutrients 11(8).
Kranz, S. 2015. Food sources of EPA and DHA in the diets of American children, NHANES 2003–2010. BAOJ Nutrition 1(1):1-12.
Kranz, S., N. R. V. Jones, and P. Monsivais. 2017. Intake levels of fish in the UK paediatric population. Nutrients 9(4).
Kuhnlein, H. V., V. Barthet, A. Farren, E. Falahi, D. Leggee, O. Receveur, and P. Berti. 2006. Vitamins A, D, and E in Canadian arctic traditional food and adult diets. Journal of Food Composition and Analysis 19(6-7):495-506.
Leung, C. W., and J. M. Tester. 2019. The association between food insecurity and diet quality varies by race/ethnicity: An analysis of National Health and Nutrition Examination Survey 2011–2014 results. Journal of the Academy of Nutrition and Dietetics 19(10):1676-1686.
Love, D. C., A. L. Thorne-Lyman, Z. Conrad, J. A. Gephart, F. Asche, D. Godo-Solo, A. McDowell, E. M. Nussbaumer, and M. W. Bloem. 2022. Affordability influences nutritional quality of seafood consumption among income and race/ethnicity groups in the United States. American Journal of Clinical Nutrition 116(2):415-425.
Lozoff, B. 2007. Iron deficiency and child development. Food and Nutrition Bulletin 28(4):0S560-S571.
Maguire, E. R., and P. Monsivais. 2015. Socio-economic dietary inequalities in UK adults: An updated picture of key food groups and nutrients from national surveillance data. British Journal of Nutrition 113(1):181-189.
Marushka, L., M. Batal, C. Tikhonov, T. Sadik, H. Schwartz, A. Ing, K. Fediuk, and H. M. Chan. 2021. Importance of fish for food and nutrition security among First Nations in Canada. Canadian Journal of Public Health 112(Suppl 1):64-80.
Middleton, P., J. C. Gomersall, J. F. Gould, E. Shepherd, S. F. Olsen, and M. Makrides. 2018. Omega-3 fatty acid addition during pregnancy. Cochrane Database of Systematic Reviews 11(11):CD003402.
NASEM (National Academies of Science, Engineering, and Medicine). 2019. Dietary Reference Intakes for sodium and potassium. Washington, DC: The National Academies Press. https://doi.org/10.17226/25353.
NFI (National Fisheries Institute). 2024. Top 10 list for seafood consumption. https://aboutseafood.com/about/top-ten-list-for-seafood-consumption/ (accessed April 16, 2024).
NIH (National Institutes of Health). 2022. Calcium: Fact sheet for professionals. https://ods.od.nih.gov/factsheets/Calcium-HealthProfessional/ (accessed October 31, 2023).
NIH. 2023. Iron: Fact sheet for professionals.https://ods.od.nih.gov/factsheets/Iron-HealthProfessional/ (accessed February 23, 2024).
Nokes, C., C. van den Bosch, and D. A. Bundy. 1998. The effects of iron deficiency and anemia on mental and motor performance, educational achievement, and behavior in children: An annotated bibliography. Washington, DC: International Nutritional Anemia Consultative Group.
Øyen J., E. Aadland, B. Liaset, E. Fjære, L. Dahl, and L. Madsen. 2021. Lean-seafood intake increases urinary iodine concentrations and plasma selenium levels: A randomized controlled trial with crossover design. European Journal of Nutrition 60:1679–1689. https://doi.org/10.1007/s00394-020-02366-2.
Rayman, M. P. 2020. Selenium intake, status, and health: A complex relationship. Hormones (Athens) 19(1):9-14.
Saini, R. K., and Y. S. Keum. 2018. Omega-3 and omega-6 polyunsaturated fatty acids: Dietary sources, metabolism, and significance - A review. Life Sciences 203:255-267.
Sharma, S., E. Mead, D. Simeon, G. Ferguson, and F. Kolahdooz. 2015. Dietary adequacy among rural Yup’ik women in western Alaska. Journal of the American College of Nutrition 34(1):65-72.
Slater, J., L. Larcombe, C. Green, C. Slivinski, M. Singer, L. Denechezhe, C. Whaley, P. Nickerson, and P. Orr. 2013. Dietary intake of vitamin D in a northern Canadian Dene First Nation community. International Journal of Circumpolar Health 72.
Smith, C., F. Teng, E. Branch, S. Chu, and K. S. Joseph. 2019. Maternal and perinatal morbidity and mortality associated with anemia in pregnancy. Obstetrics and Gynecology 134(6):1234-1244.
Sobiecki, J. G., P. N. Appleby, K. E. Bradbury, and T. J. Key. 2016. High compliance with dietary recommendations in a cohort of meat eaters, fish eaters, vegetarians, and vegans: Results from the European Prospective Investigation into Cancer and Nutrition-Oxford study. Nutrition Research 36(5):464-477.
Statistics Canada. 2015. Canadian Community Health Survey 2015. https://www23.statcan.gc.ca/imdb/p2SV.pl?Function=getSurvey&Id=238854 (accessed February 26, 2024).
Swanson, D., R. Block, and S. A. Mousa. 2012. Omega-3 fatty acids EPA and DHA: Health benefits throughout life. Advances in Nutrition 3(1):1-7.
Torti, S. V., D. H. Manz, B. T. Paul, N. Blanchette-Farra, and F. M. Torti. 2018. Iron and cancer. Annual Review of Nutrition 38:97-125.
USDA (U.S. Department of Agriculture). 1991. Provisional table on the vitamin D content of foods. Washington, DC: USDA.
U.S. Department of Agriculture, Agricultural Research Service. 2019. FoodData Central. fdc.nal.usda.gov (accessed October 20, 2023).
USDA. 2023a. USDA, FDA and ODS-NIH Database for the Iodine Content of Common Foods. https://www.ars.usda.gov/northeast-area/beltsville-md-bhnrc/beltsville-human-nutrition-research-center/methods-and-application-of-food-composition-laboratory/mafcl-site-pages/iodine/ (accessed March 1, 2024).
USDA. 2023b. Why is it important to eat seafood and how often should I eat it?https://ask.usda.gov/s/article/How-often-should-I-eat-seafood (accessed February 1, 2024).
USDA and HHS (U.S. Department of Health and Human Services). 2020. Dietary Guidelines for Americans, 2020–2025,. 9th ed. http://www.dietaryguidelines.gov/ (accessed August 17, 2023).
Walter, T. 2003. Effect of iron-deficiency anemia on cognitive skills and neuromaturation in infancy and childhood. Food and Nutrition Bulletin 24(4 Suppl):S104-S110.
Yip, R. 2000. Significance of an abnormally low or high hemoglobin concentration during pregnancy: Special consideration of iron nutrition. American Journal of Clinical Nutrition 72(1 Suppl):272s-279s.
Zeisel, S. H. 2006. Choline: Critical role during fetal development and dietary requirements in adults. Annual Review of Nutrition 26:229-250.
Zeisel, S. H., and K. A. da Costa. 2009. Choline: An essential nutrient for public health. Nutrition Review 67(11):615-623.
Zeisel, S. H., K.-A. Da Costa, P. D. Franklin, E. A. Alexander, J. T. Lamont, N. F. Sheard, and A. Beiser. 1991. Choline, an essential nutrient for humans. FASEB Journal 5(7):2093-2098.


