Pile Design for Downdrag: Examples and Supporting Materials (2024)
Chapter: Appendix I: Design Example 7 - Liquefaction in Gravel Using PileAXL and TZPILE
APPENDIX I
Design Example 7 — Liquefaction in Gravel Using PileAXL and TZPILE
Design Example 7 is similar to Design Examples 5 and 6. The similarity is associated with the post-liquefaction reconsolidation settlement leading to drag load development in the pile. The difference between Design Example 7 and Design Examples 5 and 6 is that Design Example 7 deals with liquefaction of gravel while Design Examples 5 and 6 dealt with liquefaction of sands. Similar procedures for determining the amount of soil settlement were used; however, the design calculations for gravel are different than the design calculations for sands. Another difference between this design example (Design Example 7) and the previous liquefaction related design examples (Design Examples 5 and 6) is that this design example uses shear wave velocity-based liquefaction-triggering
procedures (Kayen et al. 2013, Rollins et al. 2022) to compute liquefaction-induced settlement and the other design examples used CPT-based settlement procedures (Boulanger and Idriss 2014).
Step 1: Establish soil data
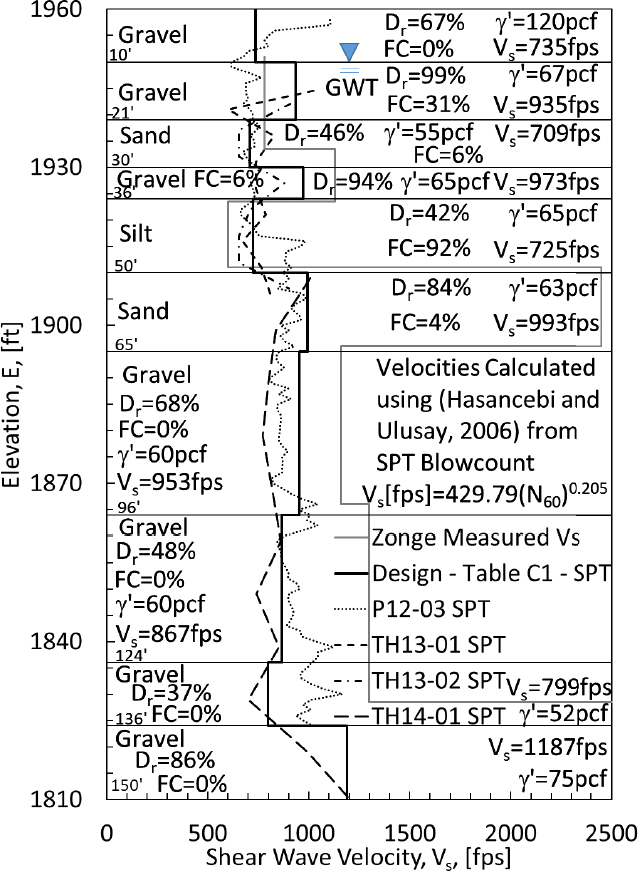
The data for this design example were provided by the Alaska Department of Transportation (Hemstreet, 2014). Specifically, the interpreted soil profile is provided in Figure I1. This figure was developed using the correlations between the AKDOT obtained SPT blow count and the shear wave velocity. Field measured shear wave velocity and design shear wave velocity are also presented in Figure I1. Based on the collected data, the site predominately consists of gravel to a depth of 150 feet with a few interbedded sand and silt layers. Factors required for additional calculations include effective unit weight (γ’), relative density (Dr), and FC are also presented in Figure I1 and tabulated in Table I1.
Table I1. Design soil properties for the Alaska gravel design example.
| Material | Depth | z | γ′ | φ′ | N1,60 | σz′ | Vs | Es | ν | Ko | Ir | qn′ | fs | ||
| Gravel | 0 | - | 10 | 5 | 120 | 36 | 25 | 1200 | 735 | 428634 | 0.2 | 0.4 | 194 | 120021 | 161 |
| Gravel | 10 | - | 21 | 15.5 | 67 | 38 | 50 | 1937 | 935 | 106269 | 0.3 | 0.3 | 271 | 226386 | 256 |
| Sand | 21 | - | 30 | 25.5 | 55 | 33 | 11 | 2432 | 709 | 275908 | 0.2 | 0.4 | 72 | 140667 | 328 |
| Gravel | 30 | - | 36 | 33 | 65 | 38 | 47 | 2822 | 973 | 129277 | 0.3 | 0.3 | 226 | 300946 | 373 |
| Silt | 36 | - | 50 | 43 | 65 | 30 | 10 | 3732 | 725 | 307209 | 0.1 | 0.5 | 61 | 194674 | 500 |
| Sand | 50 | - | 65 | 57.5 | 63 | 38 | 41 | 4677 | 993 | 142671 | 0.3 | 0.3 | 151 | 405671 | 619 |
| Gravel | 65 | - | 96 | 80.5 | 60 | 38 | 29 | 6537 | 953 | 116535 | 0.3 | 0.3 | 88 | 431575 | 865 |
| Gravel | 96 | - | 124 | 110 | 60 | 35 | 16 | 8217 | 867 | 737490 | 0.2 | 0.4 | 51 | 409767 | 110 |
| Gravel | 12 | - | 136 | 130 | 52 | 33 | 10 | 8841 | 799 | 495616 | 0.2 | 0.4 | 35 | 367109 | 119 |
| Gravel | 13 | - | 200 | 168 | 75 | 40 | 60 | 1364 | 118 | 341389 | 0.3 | 0.3 | 113 | 102991 | 177 |
| z=Midpoint depth of layer [ft], γ′=Effective unit weight [pcf], φ′=Friction angle [o], N1,60=Corrected SPT blow count [bpf], σz′=Effective vertical stress [psf], Vs=Shear wave velocity [ft/sec], Es=Young’s modulus of the soil, ν=Poisson’s ratio of the soil, K=Lateral earth pressure coefficient, Ir=Rigidity index, qn′=Nominal unit end bearing capacity [psf], fs=Nominal unit side resistance [psf] | |||||||||||||||
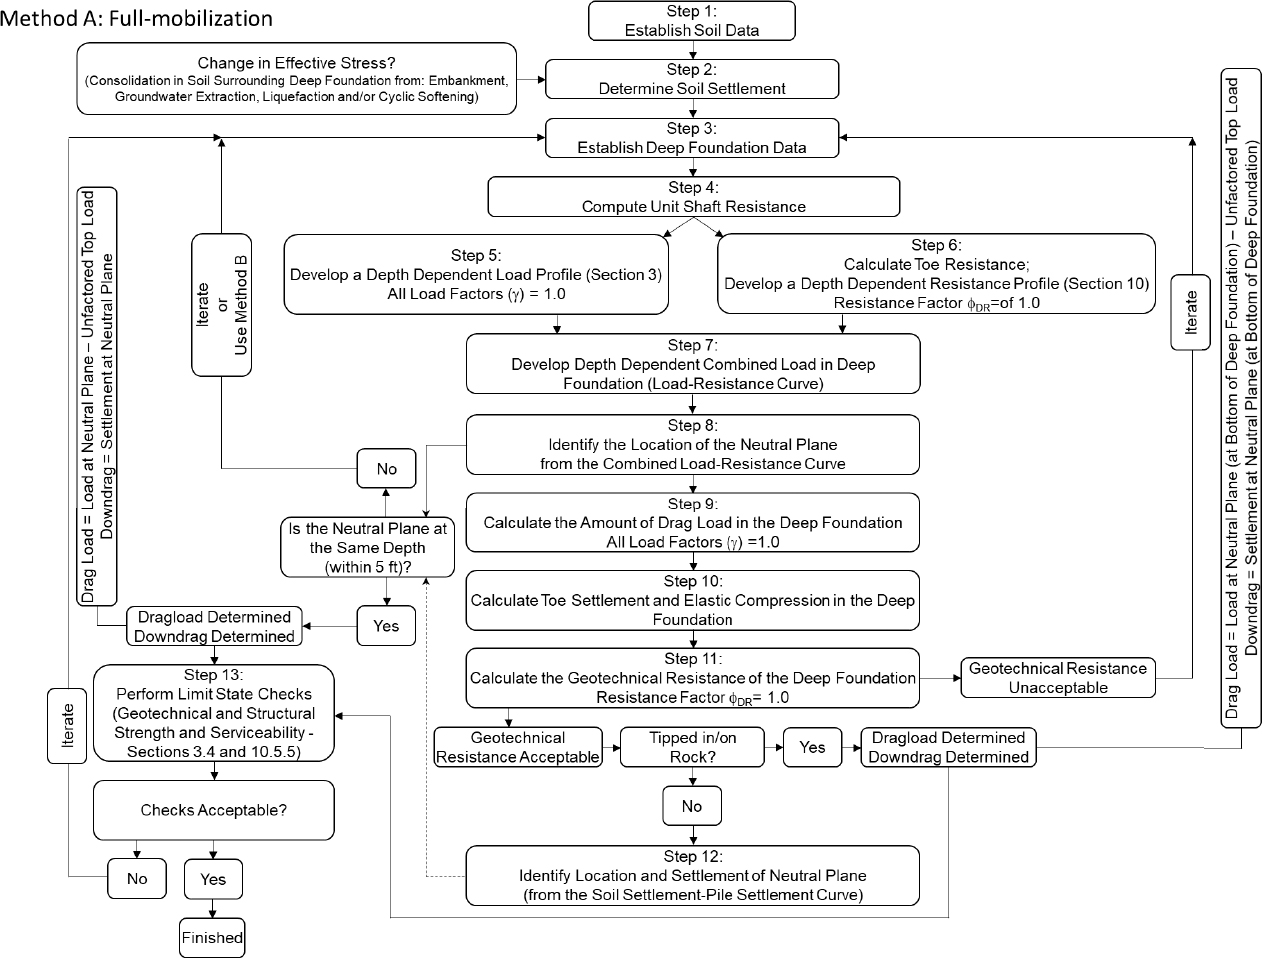
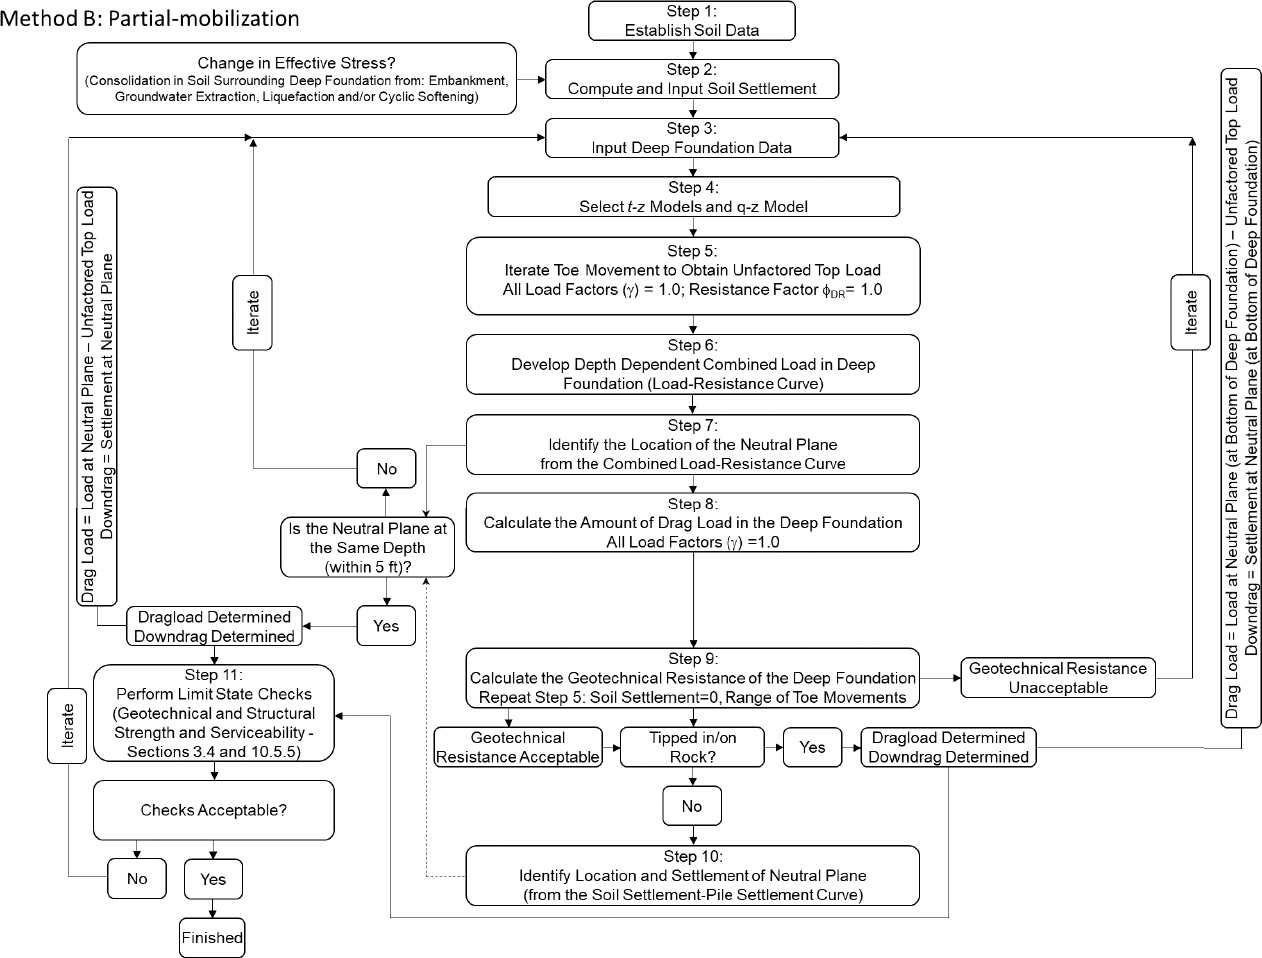
The values presented in Figure I1 include correlations between SPT, blow counts, and other parameters (Coduto et al. 2016). These parameters include: the soil modulus, Poisson’s ratio, coefficient of lateral earth pressure at rest, rigidity index, unit bearing capacity (as obtained using bearing capacity factors Nγ*, Nq∗, Nσ) and nominal unit side resistance. The correlated parameters were calculated using Equations 1 through 9. The Method A and Method B flowcharts, as proposed by the NCHRP 12-116A project team, were followed to complete this design example. The flowcharts are include herein for reference.
| Equation 1 |
| Equation 2 |
| Equation 3 |
| Equation 4 |
| Equation 5 |
| Equation 6 |
Step 2: Determine soil settlement
Liquefaction-triggering and liquefaction-induced settlements
This shear wave velocity-based example calculation of liquefaction-triggering and liquefaction-induced settlement implements the Rollins et al. (2022) and Kayen et al. (2013) shear wave velocity-based (Vsbased) liquefaction-triggering methods for gravels and sands, respectively, coupled with the Yoshimine et al. (2006) post-liquefaction settlement estimation method. The estimate of post-liquefaction reconsolidation settlement is driven by the factor of safety against liquefaction triggering, FSL. Deterministic liquefaction-triggering calculations methods commonly link initial liquefaction to an excess pore pressure ratio of 100% (and/or cyclic shear strain of 3%) corresponding to FSL = 1.0. However, it is critical to recognize that FSL > 1.0 does not mean that excess pore pressures have not been generated under strong ground motion. Volumetric strains can accumulate within a soil deposit for FSL up to 2.0 as shaking generated excess pore pressures dissipate. Thus, seismic design scenario-based liquefaction-triggering calculations which indicate that liquefaction will not be triggered (i.e., FSL > 1.0) do not justify the omission of reconsolidation settlement calculations when considering adverse effects of strong ground motion on transportation infrastructure.
Discussion of liquefaction susceptibility for gravel-rich soils
The calculation procedure for 1D reconsolidation settlement is directly linked to FSL for soils which are susceptible to liquefaction. Soils which are not susceptible to liquefaction will need to be evaluated for the potential of cyclic softening, as very soft to medium stiff, plastic soils may generate excess pore pressures in the design seismic scenario to result in volumetric strain upon dissipation of excess pore pressures (e.g., Jana and Stuedlein 2021, Dadashiserej et al. 2024). The engineer will need to decide how to judge liquefaction susceptibility. CPTs may encounter significant challenges when conducted in gravel-rich soils; hence, drilling and sampling may offer the sole reliable means to assess whether a particular gravel-rich layer (e.g., clayey gravel) will be susceptible to liquefaction. Atterberg limits conducted on the portion of the sample finer than the #40 sieve should be used to assess liquefaction susceptibility (Stuedlein et al. 2023).
Liquefaction triggering
The factor of safety against liquefaction is computed as the ratio of resistance (i.e., capacity) to demand (loading), in which resistance is represented by the cyclic resistance, CRR, and loading is represented using the cyclic stress ratio, CSR. Owing to the inability to reliably sample many liquefaction-susceptible soils, the triggering calculations typically rely on CRR which are correlated to penetration resistance or shear wave velocity. Shear wave velocity must be corrected to account for the effects of overburden stresses. For liquefaction-triggering evaluations using Vs, the overburden stress-corrected Vs, Vs1, is computed in meters per second (m/s) using:
| Eqn. 12 |
where Pa = atmospheric pressure (taken as 100 kPa) and σv0′ = vertical effective stress at the depth corresponding to Vs.
The standardized cyclic resistance of gravelly soils corresponding to a moment magnitude, Mw, earthquake of 7.5, corresponding to 15 uniform shear stress cycles, N = 15, and one atmosphere of pressure may then be computed using Rollins et al. (2022):
| Eqn. 13 |
where PL is the probability of liquefaction triggering. Note that the case history database of gravelly soils collected by Rollins et al. (2022) contains few cases where the Vs1 of the critical layer was smaller than 150 m/s. Accordingly, caution should be exercised in applying this Vs-based liquefaction-triggering relationship to gravelly soils with Vs1 < 150 m/s.
The cyclic resistance for a given magnitude earthquake is then scaled from the standardized cyclic resistance using:
| Eqn. 14 |
where MSF = the magnitude scaling factor. Rollins et al. (2022) present the MSF to be used with their gravelly soil CRR, given by:
| Eqn. 15 |
which is valid for 5.5 < Mw < 9.0.
The standardized cyclic resistance of sandy soils corresponding to a moment magnitude, Mw, earthquake of 7.5, corresponding to 15 uniform shear stress cycles, N = 15, and one atmosphere of pressure may be computed using (Kayen et al. 2013):
| Eqn. 16 |
where FC = fines content and all other parameters have been defined above. The Rollins et al. (2022) method for gravelly soils does not consider the effect of silty fines on cyclic resistance; nonetheless, sampling is necessary to make assessments of liquefaction susceptibility, and should thus include determinations of FC and the plasticity index of fines-containing soils.
Kayen et al. (2013) suggested that deterministic liquefaction-triggering analyses consider PL = 15% in view of precedent (e.g., Seed and Idriss 1971). The cyclic resistance for a given magnitude earthquake is then scaled from the standardized cyclic resistance using:
| Eqn. 17 |
where DWF = the duration weighting factor, which serves to relate the duration of earthquakes to their magnitude, and is given by (Kayen et al. 2013):
| Eqn. 18 |
which is valid for 5.5 < Mw < 9.0.
A significant difference between the CRR computed using standard penetration tests and CPTs and that computed using Vs is that the overburdens stress correction factor, Kσ, is not used to increase or decrease
the cyclic resistance. Kayen et al. (2013) note that the range in vertical effective overburden stresses for critical layers in the case history database was not sufficiently large to justify development and application of the Kσ correction.
In the Simplified method for liquefaction-triggering evaluation, the effective loading imposed by shear waves is taken equal to 65% of the maximum shear stress, τmax, and is equal to:
| Eqn. 19 |
where σv0= total vertical overburden stress, amax/g = peak ground acceleration at the ground surface as a fraction of the gravitational constant, and rd = shear stress reduction coefficient to account for “flexibility” of the soil column relative to the rigid block model (Seed and Idriss 1971). The Rollins et al. (2022) gravelly soil liquefaction-triggering procedure uses the Idriss and Boulanger (2008) formulation for rd, given by:
| Eqn. 20 |
where α(z) and β(z) are given by:
| Eqn. 21 |
| Eqn. 22 |
respectively, with z = depth in meters, and the elements encapsulated within the parenthesis are in radians. In contrast, the Kayen et al. (2013) liquefaction-triggering procedure for sandy soils uses a shear stress reduction coefficient given by:
| Eqn. 23 |
where Vs∗,12m = the average Vs in the upper 12.2 m (40 ft). Kayen et al. (2013) note that rd is applicable for z < 20 m.
The factor of safety against liquefaction triggering (i.e., ru = 100%) may then be determined for the depth of interest using:
| Eqn. 24 |
It is worthwhile to note that there exist other corrections to cyclic resistance than those described above, including corrections to account for soil aging (Andrus et al. 2009), which are particularly useful in Pleistocene deposits, and to account for partial saturation (e.g., Hossein et al. 2013), which are useful in silty sands and nonplastic silts which may exhibit partial saturation below the static groundwater table.
Post-liquefaction reconsolidation settlement
The dissipation of shaking-induced excess pore pressures to result in reconsolidation strains and settlement must be estimated when FSL < 2.0. Several methods are available to estimate seismically-induced reconsolidation settlement (Zhang et al. 2002; Yoshimine et al. 2006). This example considers the Yoshimine et al. (2006) methodology for sands as reformulated by Idriss and Boulanger (2008); however, it is emphasized that this methodology was not developed for gravels or gravel-rich soils. In the Yoshimine et al. (2006) methodology, the amount of volumetric strain in cyclic laboratory test specimens is linked to the relative density of the specimen and the magnitude of excess pore pressure generated during cyclic loading, which is in turn related to the maximum shear strain imposed upon the specimen during loading. Hence, the procedure to estimate reconsolidation settlement from volumetric strain includes the calculation of the limiting and maximum shear strain anticipated for a given soil deposit and seismic event, respectively. The limiting shear strain, γlim, in decimal is given by:
| Eqn. 25 |
where Dr = relative density expressed in decimal. The maximum shear strain, γmax, anticipated under a given design loading scenario is assumed smaller than that necessary to trigger excess pore pressures if FSL ≥ 2.0, equal to γlim if FSL ≤ FSα, and:
| Eqn. 26 |
for 2 > FSL > FSα, where FSα is given by:
| Eqn. 27 |
with Dr ≥ 0.4 when calculating FSα. The volumetric strain at a given depth can then be computed as:
| Eqn. 28 |
The increment of settlement associated with the volumetric strain at a given depth, z, may then be computed as:
| Eqn. 29 |
where ∆z = the increment in depth pertaining to the measured penetration resistance at a given depth. Thereafter, the cumulative settlement representing the one-dimensional reconsolidation settlement at the ground surface is computed as the sum of incremental settlements from the base of the exploration, z = zmax, as:
| Eqn. 30 |
Worked Example
The following example calculation of post-seismic reconsolidation settlement was conducted for a site along the Tok River in Alaska. The subsurface consists of interlayered cohesionless gravel and sand deposits. The stratigraphy includes interlayered gravel, sand, and silt layers. Specifically, from the ground surface to the depth of termination of the borings, the deposit is comprised of layers of gravel (21 feet thick), sand (9 feet thick), gravel (6 feet thick), silt (14 feet thick), sand (15 feet thick), and gravel (at least
31 feet thick). The groundwater is located 10 feet below the ground surface. The seismic hazards driving design centers on two design events: (1) Event 1, PGA=0.3g and Mw=6.2; and (2) Event 2, PGA=0.35g and Mw=7.8. Detailed calculations of the factor of safety against liquefaction and 1D reconsolidation settlement for both events are presented for a depth of 122ft below the ground surface (Table I2). The design values, including the effective unit weight (γ′=60pcf), relative density (Dr=48%), fines content (FC=0%), and shear wave velocity (Vs= 867fps) for the depth presented in the calculations and at other depths are shown in Figure I1. Individual parameters that were calculated for all depths for determination of the post-liquefaction reconsolidation settlement are included in Table I4. At a depth of 122ft, the total and effective stresses are σv0 = 15,088 psf, σ′v0 = 8,037 psf, respectively. Pile lengths of 124ft were considered. This pile length corresponded with the minimum penetration of the abutment piles, as listed on the design plans provided by the Alaska DOT.
The results of the liquefaction settlement analysis for Event 1 and Event 2 are presented in Figure I2a and Figure I2b, respectively. For Event 1, liquefaction triggering was not indicated with FSL > 1.0 for all depths, but 2.85 inches of reconsolidation settlement was predicted due to the dissipation of excess pore pressures which are presumed to have been generated under shaking. For Event 2, liquefaction was indicated for all depths except for the gravel layer from 0 to 10ft and for the sand layer from depths of 52 to 64ft, and soil settlement of 40.1 inches was calculated. For both events, soil settlements were observed to the depth of the dense sand layer (136ft).
The results from calculations for all depths are included in Tables I3 through I7. The parameters associated with the corrected shear wave velocity are included in Table I3. Parameters related to the determination of the factor of safety against liquefaction within gravel using the Rollins et al. (2022) method are presented in Table I4. The results from the Kayen et al. (2013) liquefaction-triggering procedure for sandy soils are included in Table I5 because the entire soil deposit was not only a gravel deposit but also contained sand and silt (as shown previously in Figure I1). The factor of safety values were merged so the appropriate factor of safety was assigned to the appropriate soil type (Rollins et al. (2022) for gravel, Kayen et al. (2013) for sand and silt). The settlement values, as a function of depth using the merged factor of safety values, are presented in Table I6.
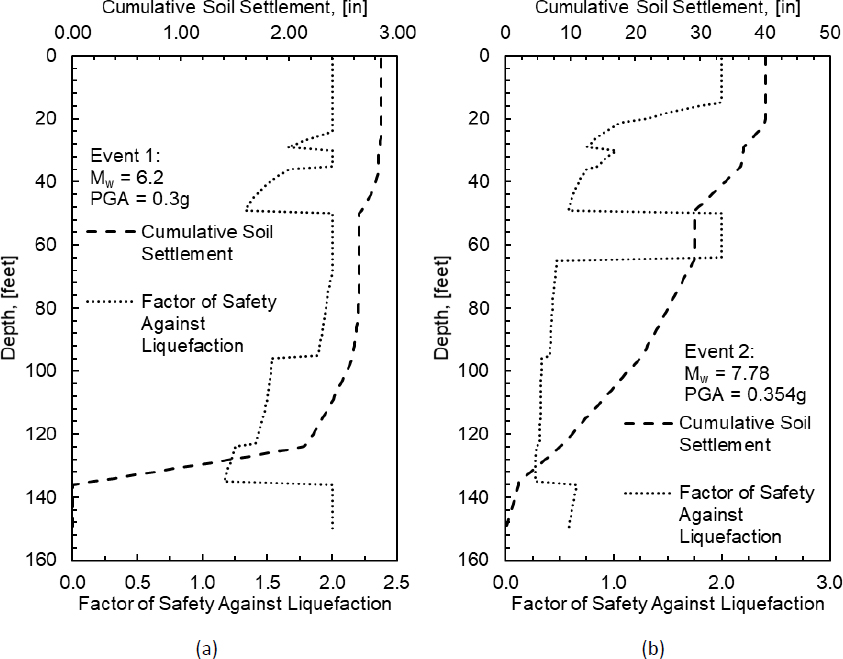
Table I2. Detailed calculations for determining post-liquefaction soil settlement.
| Event 1 – PGA=0.3g, Mw=6.2 | ||
| Equation | Worked Example at Depth of 122 ft | Comment |
| Calculate the overburden corrected shear wave velocity, CRR | ||
| Pa=100 kPa=2088psf | ||
| PL=0.15 | ||
SF equation valid or 5.5 < Mw < 9.0 | ||
| Calculate the cyclic stress ratio, CSR | ||
| Calculate the factor of safety against liquefaction, FSL | ||
| See Figure I2; FSL ≤ 2.0 triggers calculation of volumetric strain and corresponding settlement | ||
| Calculate reconsolidation settlement | ||
| Dr expressed as a decimal | ||
| If Dr ≥ 0.392 If Dr ≥ 0.392 | ||
| S1D = 2.85 inches | See Figure I2 |
Table I3. Results from calculations to find corrected shear wave velocity.
| Elev | z | Soil Type | γ′ | σvo | σvo′ | Vs | Vs1 | FC | Comments: For Event #1 – amax=0.3, Mw=6.2, Elev=Elevation above sea level [t], z=Depth [ft], γ′=Effective unit weight [pcf], σvo=Vertical total stress [psf], σvo′=Vertical effective stress [psf], Vs=Shear wave velocity [fps], Vs1=Overburden corrected shear wave velocity [fps], FC=Fines Content. |
| 1960 | 0 | Gravel | 120 | 0 | 0 | 735 | - | 0 | |
| 1959 | 1 | Gravel | 120 | 120 | 120 | 735 | 1506 | 0 | |
| 1958 | 2 | Gravel | 120 | 240 | 240 | 735 | 1267 | 0 | |
| 1957 | 3 | Gravel | 120 | 360 | 360 | 735 | 1144 | 0 | |
| 1956 | 4 | Gravel | 120 | 480 | 480 | 735 | 1065 | 0 | |
| 1955 | 5 | Gravel | 120 | 600 | 600 | 735 | 1007 | 0 | |
| 1954 | 6 | Gravel | 120 | 720 | 720 | 735 | 962 | 0 | |
| 1953 | 7 | Gravel | 120 | 840 | 840 | 735 | 926 | 0 | |
| 1952 | 8 | Gravel | 120 | 960 | 960 | 735 | 896 | 0 | |
| 1951 | 9 | Gravel | 120 | 1080 | 1080 | 735 | 870 | 0 | |
| 1950 | 10 | Gravel | 67 | 1209 | 1147 | 935 | 1090 | 31 | |
| 1949 | 11 | Gravel | 67 | 1339 | 1214 | 935 | 1074 | 31 | |
| 1948 | 12 | Gravel | 67 | 1468 | 1281 | 935 | 1060 | 31 | |
| 1947 | 13 | Gravel | 67 | 1598 | 1348 | 935 | 1047 | 31 | |
| 1946 | 14 | Gravel | 67 | 1727 | 1415 | 935 | 1034 | 31 | |
| 1945 | 15 | Gravel | 67 | 1856 | 1482 | 935 | 1022 | 31 | |
| 1944 | 16 | Gravel | 67 | 1986 | 1549 | 935 | 1011 | 31 | |
| 1943 | 17 | Gravel | 67 | 2115 | 1616 | 935 | 1000 | 31 | |
| 1942 | 18 | Gravel | 67 | 2245 | 1683 | 935 | 990 | 31 | |
| 1941 | 19 | Gravel | 67 | 2374 | 1750 | 935 | 980 | 31 | |
| 1940 | 20 | Gravel | 67 | 2503 | 1817 | 935 | 971 | 31 | |
| 1939 | 21 | Sand | 55 | 2621 | 1872 | 709 | 731 | 6 | |
| 1938 | 22 | Sand | 55 | 2738 | 1927 | 709 | 726 | 6 | |
| 1937 | 23 | Sand | 55 | 2856 | 1982 | 709 | 721 | 6 | |
| 1936 | 24 | Sand | 55 | 2973 | 2037 | 709 | 716 | 6 | |
| 1935 | 25 | Sand | 55 | 3090 | 2092 | 709 | 711 | 6 | |
| 1934 | 26 | Sand | 55 | 3208 | 2147 | 709 | 706 | 6 | |
| 1933 | 27 | Sand | 55 | 3325 | 2202 | 709 | 702 | 6 | |
| 1932 | 28 | Sand | 55 | 3443 | 2257 | 709 | 698 | 6 | |
| 1931 | 29 | Sand | 55 | 3560 | 2312 | 709 | 693 | 6 | |
| 1930 | 30 | Gravel | 65 | 3687 | 2377 | 973 | 945 | 6 | |
| 1929 | 31 | Gravel | 65 | 3815 | 2442 | 973 | 939 | 6 | |
| 1928 | 32 | Gravel | 65 | 3942 | 2507 | 973 | 933 | 6 | |
| 1927 | 33 | Gravel | 65 | 4070 | 2572 | 973 | 927 | 6 | |
| 1926 | 34 | Gravel | 65 | 4197 | 2637 | 973 | 921 | 6 | |
| 1925 | 35 | Gravel | 65 | 4324 | 2702 | 973 | 915 | 6 | |
| 1924 | 36 | Silt | 65 | 4452 | 2767 | 725 | 678 | 92 | |
| 1923 | 37 | Silt | 65 | 4579 | 2832 | 725 | 674 | 92 | |
| 1922 | 38 | Silt | 65 | 4707 | 2897 | 725 | 670 | 92 | |
| 1921 | 39 | Silt | 65 | 4834 | 2962 | 725 | 667 | 92 | |
| 1920 | 40 | Silt | 65 | 4961 | 3027 | 725 | 663 | 92 | |
| 1919 | 41 | Silt | 65 | 5089 | 3092 | 725 | 659 | 92 | |
| 1918 | 42 | Silt | 65 | 5216 | 3157 | 725 | 656 | 92 | |
| 1917 | 43 | Silt | 65 | 5344 | 3222 | 725 | 653 | 92 | |
| 1916 | 44 | Silt | 65 | 5471 | 3287 | 725 | 649 | 92 | |
| 1915 | 45 | Silt | 65 | 5598 | 3352 | 725 | 646 | 92 | |
| 1914 | 46 | Silt | 65 | 5726 | 3417 | 725 | 643 | 92 | |
| 1913 | 47 | Silt | 65 | 5853 | 3482 | 725 | 640 | 92 | |
| 1912 | 48 | Silt | 65 | 5981 | 3547 | 725 | 637 | 92 | |
| 1911 | 49 | Silt | 65 | 6108 | 3612 | 725 | 634 | 92 | |
| 1910 | 50 | Sand | 63 | 6233 | 3675 | 993 | 865 | 4 |
| Elev | z | Soil Type | γ′ | σvo | σvo′ | Vs | Vs1 | FC | Comments: See definition of variables on previous page. |
| 1909 | 51 | Sand | 63 | 6359 | 3738 | 993 | 861 | 4 | |
| 1908 | 52 | Sand | 63 | 6484 | 3801 | 993 | 858 | 4 | |
| 1907 | 53 | Sand | 63 | 6610 | 3864 | 993 | 854 | 4 | |
| 1906 | 54 | Sand | 63 | 6735 | 3927 | 993 | 851 | 4 | |
| 1905 | 55 | Sand | 63 | 6860 | 3990 | 993 | 847 | 4 | |
| 1904 | 56 | Sand | 63 | 6986 | 4053 | 993 | 844 | 4 | |
| 1903 | 57 | Sand | 63 | 7111 | 4116 | 993 | 841 | 4 | |
| 1902 | 58 | Sand | 63 | 7237 | 4179 | 993 | 838 | 4 | |
| 1901 | 59 | Sand | 63 | 7362 | 4242 | 993 | 835 | 4 | |
| 1900 | 60 | Sand | 63 | 7487 | 4305 | 993 | 831 | 4 | |
| 1899 | 61 | Sand | 63 | 7613 | 4368 | 993 | 828 | 4 | |
| 1898 | 62 | Sand | 63 | 7738 | 4431 | 993 | 825 | 4 | |
| 1897 | 63 | Sand | 63 | 7864 | 4494 | 993 | 823 | 4 | |
| 1896 | 64 | Sand | 63 | 7989 | 4557 | 993 | 820 | 4 | |
| 1895 | 65 | Gravel | 60 | 8111 | 4617 | 953 | 784 | 0 | |
| 1894 | 66 | Gravel | 60 | 8234 | 4677 | 953 | 782 | 0 | |
| 1893 | 67 | Gravel | 60 | 8356 | 4737 | 953 | 779 | 0 | |
| 1892 | 68 | Gravel | 60 | 8479 | 4797 | 953 | 777 | 0 | |
| 1891 | 69 | Gravel | 60 | 8601 | 4857 | 953 | 774 | 0 | |
| 1890 | 70 | Gravel | 60 | 8723 | 4917 | 953 | 772 | 0 | |
| 1889 | 71 | Gravel | 60 | 8846 | 4977 | 953 | 770 | 0 | |
| 1888 | 72 | Gravel | 60 | 8968 | 5037 | 953 | 767 | 0 | |
| 1887 | 73 | Gravel | 60 | 9091 | 5097 | 953 | 765 | 0 | |
| 1886 | 74 | Gravel | 60 | 9213 | 5157 | 953 | 763 | 0 | |
| 1885 | 75 | Gravel | 60 | 9335 | 5217 | 953 | 761 | 0 | |
| 1884 | 76 | Gravel | 60 | 9458 | 5277 | 953 | 758 | 0 | |
| 1883 | 77 | Gravel | 60 | 9580 | 5337 | 953 | 756 | 0 | |
| 1882 | 78 | Gravel | 60 | 9703 | 5397 | 953 | 754 | 0 | |
| 1881 | 79 | Gravel | 60 | 9825 | 5457 | 953 | 752 | 0 | |
| 1880 | 80 | Gravel | 60 | 9947 | 5517 | 953 | 750 | 0 | |
| 1879 | 81 | Gravel | 60 | 10070 | 5577 | 953 | 748 | 0 | |
| 1878 | 82 | Gravel | 60 | 10192 | 5637 | 953 | 746 | 0 | |
| 1877 | 83 | Gravel | 60 | 10315 | 5697 | 953 | 744 | 0 | |
| 1876 | 84 | Gravel | 60 | 10437 | 5757 | 953 | 742 | 0 | |
| 1875 | 85 | Gravel | 60 | 10559 | 5817 | 953 | 740 | 0 | |
| 1874 | 86 | Gravel | 60 | 10682 | 5877 | 953 | 738 | 0 | |
| 1873 | 87 | Gravel | 60 | 10804 | 5937 | 953 | 736 | 0 | |
| 1872 | 88 | Gravel | 60 | 10927 | 5997 | 953 | 734 | 0 | |
| 1871 | 89 | Gravel | 60 | 11049 | 6057 | 953 | 733 | 0 | |
| 1870 | 90 | Gravel | 60 | 11171 | 6117 | 953 | 731 | 0 | |
| 1869 | 91 | Gravel | 60 | 11294 | 6177 | 953 | 729 | 0 | |
| 1868 | 92 | Gravel | 60 | 11416 | 6237 | 953 | 727 | 0 | |
| 1867 | 93 | Gravel | 60 | 11539 | 6297 | 953 | 726 | 0 | |
| 1866 | 94 | Gravel | 60 | 11661 | 6357 | 953 | 724 | 0 | |
| 1865 | 95 | Gravel | 60 | 11783 | 6417 | 953 | 722 | 0 | |
| 1864 | 96 | Gravel | 60 | 11906 | 6477 | 867 | 655 | 0 | |
| 1863 | 97 | Gravel | 60 | 12028 | 6537 | 867 | 654 | 0 | |
| 1862 | 98 | Gravel | 60 | 12151 | 6597 | 867 | 652 | 0 | |
| 1861 | 99 | Gravel | 60 | 12273 | 6657 | 867 | 651 | 0 | |
| 1860 | 100 | Gravel | 60 | 12395 | 6717 | 867 | 650 | 0 | |
| 1859 | 101 | Gravel | 60 | 12518 | 6777 | 867 | 648 | 0 |
| Elev | z | Soil Type | γ′ | σvo | σvo′ | Vs | Vs1 | FC | Comments: See definition of variables on previous page. |
| 1858 | 102 | Gravel | 60 | 12640 | 6837 | 867 | 647 | 0 | |
| 1857 | 103 | Gravel | 60 | 12763 | 6897 | 867 | 645 | 0 | |
| 1856 | 104 | Gravel | 60 | 12885 | 6957 | 867 | 644 | 0 | |
| 1855 | 105 | Gravel | 60 | 13007 | 7017 | 867 | 642 | 0 | |
| 1854 | 106 | Gravel | 60 | 13130 | 7077 | 867 | 641 | 0 | |
| 1853 | 107 | Gravel | 60 | 13252 | 7137 | 867 | 640 | 0 | |
| 1852 | 108 | Gravel | 60 | 13375 | 7197 | 867 | 638 | 0 | |
| 1851 | 109 | Gravel | 60 | 13497 | 7257 | 867 | 637 | 0 | |
| 1850 | 110 | Gravel | 60 | 13619 | 7317 | 867 | 636 | 0 | |
| 1849 | 111 | Gravel | 60 | 13742 | 7377 | 867 | 634 | 0 | |
| 1848 | 112 | Gravel | 60 | 13864 | 7437 | 867 | 633 | 0 | |
| 1847 | 113 | Gravel | 60 | 13987 | 7497 | 867 | 632 | 0 | |
| 1846 | 114 | Gravel | 60 | 14109 | 7557 | 867 | 631 | 0 | |
| 1845 | 115 | Gravel | 60 | 14231 | 7617 | 867 | 629 | 0 | |
| 1844 | 116 | Gravel | 60 | 14354 | 7677 | 867 | 628 | 0 | |
| 1843 | 117 | Gravel | 60 | 14476 | 7737 | 867 | 627 | 0 | |
| 1842 | 118 | Gravel | 60 | 14599 | 7797 | 867 | 626 | 0 | |
| 1841 | 119 | Gravel | 60 | 14721 | 7857 | 867 | 625 | 0 | |
| 1840 | 120 | Gravel | 60 | 14843 | 7917 | 867 | 623 | 0 | |
| 1839 | 121 | Gravel | 60 | 14966 | 7977 | 867 | 622 | 0 | |
| 1838 | 122 | Gravel | 60 | 15088 | 8037 | 867 | 621 | 0 | |
| 1837 | 123 | Gravel | 60 | 15211 | 8097 | 867 | 620 | 0 | |
| 1836 | 124 | Gravel | 52 | 15325 | 8149 | 799 | 570 | 0 | |
| 1835 | 125 | Gravel | 52 | 15439 | 8201 | 799 | 569 | 0 | |
| 1834 | 126 | Gravel | 52 | 15554 | 8253 | 799 | 569 | 0 | |
| 1833 | 127 | Gravel | 52 | 15668 | 8305 | 799 | 568 | 0 | |
| 1832 | 128 | Gravel | 52 | 15783 | 8357 | 799 | 567 | 0 | |
| 1831 | 129 | Gravel | 52 | 15897 | 8409 | 799 | 566 | 0 | |
| 1830 | 130 | Gravel | 52 | 16011 | 8461 | 799 | 565 | 0 | |
| 1829 | 131 | Gravel | 52 | 16126 | 8513 | 799 | 564 | 0 | |
| 1828 | 132 | Gravel | 52 | 16240 | 8565 | 799 | 563 | 0 | |
| 1827 | 133 | Gravel | 52 | 16355 | 8617 | 799 | 562 | 0 | |
| 1826 | 134 | Gravel | 52 | 16469 | 8669 | 799 | 562 | 0 | |
| 1825 | 135 | Gravel | 52 | 16583 | 8721 | 799 | 561 | 0 | |
| 1824 | 136 | Gravel | 75 | 16721 | 8796 | 1187 | 831 | 0 | |
| 1823 | 137 | Gravel | 75 | 16858 | 8871 | 1187 | 830 | 0 | |
| 1822 | 138 | Gravel | 75 | 16996 | 8946 | 1187 | 828 | 0 | |
| 1821 | 139 | Gravel | 75 | 17133 | 9021 | 1187 | 826 | 0 | |
| 1820 | 140 | Gravel | 75 | 17270 | 9096 | 1187 | 824 | 0 | |
| 1819 | 141 | Gravel | 75 | 17408 | 9171 | 1187 | 823 | 0 | |
| 1818 | 142 | Gravel | 75 | 17545 | 9246 | 1187 | 821 | 0 | |
| 1817 | 143 | Gravel | 75 | 17683 | 9321 | 1187 | 819 | 0 | |
| 1816 | 144 | Gravel | 75 | 17820 | 9396 | 1187 | 818 | 0 | |
| 1815 | 145 | Gravel | 75 | 17957 | 9471 | 1187 | 816 | 0 | |
| 1814 | 146 | Gravel | 75 | 18095 | 9546 | 1187 | 814 | 0 | |
| 1813 | 147 | Gravel | 75 | 18232 | 9621 | 1187 | 813 | 0 | |
| 1812 | 148 | Gravel | 75 | 18370 | 9696 | 1187 | 811 | 0 | |
| 1811 | 149 | Gravel | 75 | 18507 | 9771 | 1187 | 810 | 0 | |
| 1810 | 150 | Gravel | 75 | 18644 | 9846 | 1187 | 808 | 0 |
Table I4. Results from calculations to find factor of safety against liquefaction (Rollins et al., 2022).
| Elev | z | α(z) | β(z) | rd | CRR7.5 | CRR | CSR | FSLiq | Comments: For Event #1 – amax=0.3, Mw=6.2, MSF=Magnitude scaling factor=1.5, PL=probability of liquefaction triggering=0.15, Elev=Elevation above sea level [t], z=Depth [ft], rd=Shear stress reduction coefficient, α(z)=Term used to find rd, β(z)=Term used to find rd, CRR7.5 = standardized cyclic resistance corresponding to a moment magnitude earthquake of 7.5, with 15 uniform shear stress cycles, and one atmosphere of pressure, CRR=Cyclic resistance ratio for the magnitude and effective stress of interest, CSR=Cyclic stress ratio for the magnitude and effective stress of interest, FSLiq=Factor of safety against liquefaction. |
| 1960 | 0 | 0.02 | 0.00 | 1.00 | - | - | |||
| 1959 | 1 | 0.00 | 0.00 | 1.00 | 1.00 | 1.50 | 0.20 | 2.00 | |
| 1958 | 2 | -0.01 | 0.00 | 1.00 | 1.00 | 1.50 | 0.20 | 2.00 | |
| 1957 | 3 | -0.02 | 0.00 | 1.00 | 1.00 | 1.50 | 0.19 | 2.00 | |
| 1956 | 4 | -0.04 | 0.00 | 0.99 | 1.00 | 1.50 | 0.19 | 2.00 | |
| 1955 | 5 | -0.05 | 0.01 | 0.99 | 0.92 | 1.38 | 0.19 | 2.00 | |
| 1954 | 6 | -0.07 | 0.01 | 0.98 | 0.69 | 1.03 | 0.19 | 2.00 | |
| 1953 | 7 | -0.08 | 0.01 | 0.98 | 0.55 | 0.83 | 0.19 | 2.00 | |
| 1952 | 8 | -0.10 | 0.01 | 0.97 | 0.47 | 0.70 | 0.19 | 2.00 | |
| 1951 | 9 | -0.12 | 0.01 | 0.97 | 0.41 | 0.61 | 0.19 | 2.00 | |
| 1950 | 10 | -0.14 | 0.02 | 0.96 | 1.00 | 1.50 | 0.20 | 2.00 | |
| 1949 | 11 | -0.16 | 0.02 | 0.96 | 1.00 | 1.50 | 0.21 | 2.00 | |
| 1948 | 12 | -0.17 | 0.02 | 0.95 | 1.00 | 1.50 | 0.21 | 2.00 | |
| 1947 | 13 | -0.19 | 0.02 | 0.94 | 1.00 | 1.50 | 0.22 | 2.00 | |
| 1946 | 14 | -0.22 | 0.02 | 0.94 | 1.00 | 1.50 | 0.22 | 2.00 | |
| 1945 | 15 | -0.24 | 0.03 | 0.93 | 1.00 | 1.50 | 0.23 | 2.00 | |
| 1944 | 16 | -0.26 | 0.03 | 0.93 | 0.94 | 1.41 | 0.23 | 2.00 | |
| 1943 | 17 | -0.28 | 0.03 | 0.92 | 0.87 | 1.32 | 0.23 | 2.00 | |
| 1942 | 18 | -0.30 | 0.03 | 0.91 | 0.82 | 1.23 | 0.24 | 2.00 | |
| 1941 | 19 | -0.32 | 0.04 | 0.91 | 0.77 | 1.16 | 0.24 | 2.00 | |
| 1940 | 20 | -0.35 | 0.04 | 0.90 | 0.73 | 1.09 | 0.24 | 2.00 | |
| 1939 | 21 | -0.37 | 0.04 | 0.89 | 0.23 | 0.34 | 0.24 | 1.39 | |
| 1938 | 22 | -0.40 | 0.04 | 0.89 | 0.22 | 0.33 | 0.25 | 1.36 | |
| 1937 | 23 | -0.42 | 0.05 | 0.88 | 0.22 | 0.33 | 0.25 | 1.32 | |
| 1936 | 24 | -0.45 | 0.05 | 0.87 | 0.21 | 0.32 | 0.25 | 1.30 | |
| 1935 | 25 | -0.47 | 0.05 | 0.87 | 0.21 | 0.32 | 0.25 | 1.27 | |
| 1934 | 26 | -0.50 | 0.06 | 0.86 | 0.21 | 0.31 | 0.25 | 1.25 | |
| 1933 | 27 | -0.52 | 0.06 | 0.85 | 0.20 | 0.31 | 0.25 | 1.23 | |
| 1932 | 28 | -0.55 | 0.06 | 0.85 | 0.20 | 0.30 | 0.25 | 1.21 | |
| 1931 | 29 | -0.58 | 0.06 | 0.84 | 0.20 | 0.30 | 0.25 | 1.19 | |
| 1930 | 30 | -0.60 | 0.07 | 0.83 | 0.62 | 0.93 | 0.25 | 2.00 | |
| 1929 | 31 | -0.63 | 0.07 | 0.82 | 0.60 | 0.90 | 0.25 | 2.00 | |
| 1928 | 32 | -0.66 | 0.07 | 0.82 | 0.57 | 0.86 | 0.25 | 2.00 | |
| 1927 | 33 | -0.69 | 0.08 | 0.81 | 0.56 | 0.84 | 0.25 | 2.00 | |
| 1926 | 34 | -0.72 | 0.08 | 0.80 | 0.54 | 0.81 | 0.25 | 2.00 | |
| 1925 | 35 | -0.74 | 0.08 | 0.80 | 0.52 | 0.78 | 0.25 | 2.00 | |
| 1924 | 36 | -0.77 | 0.09 | 0.79 | 0.19 | 0.29 | 0.25 | 1.15 | |
| 1923 | 37 | -0.80 | 0.09 | 0.78 | 0.19 | 0.28 | 0.25 | 1.14 | |
| 1922 | 38 | -0.83 | 0.09 | 0.77 | 0.19 | 0.28 | 0.25 | 1.14 | |
| 1921 | 39 | -0.86 | 0.10 | 0.77 | 0.18 | 0.28 | 0.24 | 1.13 | |
| 1920 | 40 | -0.89 | 0.10 | 0.76 | 0.18 | 0.27 | 0.24 | 1.12 | |
| 1919 | 41 | -0.92 | 0.10 | 0.75 | 0.18 | 0.27 | 0.24 | 1.12 | |
| 1918 | 42 | -0.95 | 0.11 | 0.75 | 0.18 | 0.27 | 0.24 | 1.11 | |
| 1917 | 43 | -0.98 | 0.11 | 0.74 | 0.18 | 0.26 | 0.24 | 1.11 | |
| 1916 | 44 | -1.00 | 0.11 | 0.73 | 0.17 | 0.26 | 0.24 | 1.10 | |
| 1915 | 45 | -1.03 | 0.11 | 0.72 | 0.17 | 0.26 | 0.24 | 1.10 | |
| 1914 | 46 | -1.06 | 0.12 | 0.72 | 0.17 | 0.26 | 0.23 | 1.10 | |
| 1913 | 47 | -1.09 | 0.12 | 0.71 | 0.17 | 0.26 | 0.23 | 1.10 | |
| 1912 | 48 | -1.12 | 0.12 | 0.70 | 0.17 | 0.25 | 0.23 | 1.09 | |
| 1911 | 49 | -1.15 | 0.13 | 0.70 | 0.17 | 0.25 | 0.23 | 1.09 | |
| 1910 | 50 | -1.18 | 0.13 | 0.69 | 0.40 | 0.60 | 0.23 | 2.00 |
| Elev | z | α(z) | β(z) | rd | CRR7.5 | CRR | CSR | FSLiq | Comments: See definition of variables on previous page. |
| 1909 | 51 | -1.21 | 0.13 | 0.68 | 0.39 | 0.59 | 0.23 | 2.00 | |
| 1908 | 52 | -1.24 | 0.14 | 0.68 | 0.39 | 0.58 | 0.23 | 2.00 | |
| 1907 | 53 | -1.27 | 0.14 | 0.67 | 0.38 | 0.57 | 0.22 | 2.00 | |
| 1906 | 54 | -1.29 | 0.14 | 0.67 | 0.37 | 0.56 | 0.22 | 2.00 | |
| 1905 | 55 | -1.32 | 0.15 | 0.66 | 0.37 | 0.55 | 0.22 | 2.00 | |
| 1904 | 56 | -1.35 | 0.15 | 0.65 | 0.36 | 0.54 | 0.22 | 2.00 | |
| 1903 | 57 | -1.38 | 0.15 | 0.65 | 0.36 | 0.53 | 0.22 | 2.00 | |
| 1902 | 58 | -1.41 | 0.15 | 0.64 | 0.35 | 0.53 | 0.22 | 2.00 | |
| 1901 | 59 | -1.43 | 0.16 | 0.63 | 0.34 | 0.52 | 0.21 | 2.00 | |
| 1900 | 60 | -1.46 | 0.16 | 0.63 | 0.34 | 0.51 | 0.21 | 2.00 | |
| 1899 | 61 | -1.49 | 0.16 | 0.62 | 0.34 | 0.50 | 0.21 | 2.00 | |
| 1898 | 62 | -1.51 | 0.17 | 0.62 | 0.33 | 0.50 | 0.21 | 2.00 | |
| 1897 | 63 | -1.54 | 0.17 | 0.61 | 0.33 | 0.49 | 0.21 | 2.00 | |
| 1896 | 64 | -1.56 | 0.17 | 0.61 | 0.32 | 0.48 | 0.21 | 2.00 | |
| 1895 | 65 | -1.59 | 0.17 | 0.60 | 0.28 | 0.42 | 0.21 | 2.00 | |
| 1894 | 66 | -1.61 | 0.18 | 0.59 | 0.27 | 0.41 | 0.20 | 2.00 | |
| 1893 | 67 | -1.64 | 0.18 | 0.59 | 0.27 | 0.41 | 0.20 | 2.00 | |
| 1892 | 68 | -1.66 | 0.18 | 0.58 | 0.27 | 0.40 | 0.20 | 2.00 | |
| 1891 | 69 | -1.69 | 0.18 | 0.58 | 0.27 | 0.40 | 0.20 | 2.00 | |
| 1890 | 70 | -1.71 | 0.19 | 0.57 | 0.26 | 0.40 | 0.20 | 1.99 | |
| 1889 | 71 | -1.73 | 0.19 | 0.57 | 0.26 | 0.39 | 0.20 | 1.99 | |
| 1888 | 72 | -1.76 | 0.19 | 0.57 | 0.26 | 0.39 | 0.20 | 1.98 | |
| 1887 | 73 | -1.78 | 0.19 | 0.56 | 0.26 | 0.39 | 0.19 | 1.98 | |
| 1886 | 74 | -1.80 | 0.20 | 0.56 | 0.25 | 0.38 | 0.19 | 1.97 | |
| 1885 | 75 | -1.82 | 0.20 | 0.55 | 0.25 | 0.38 | 0.19 | 1.97 | |
| 1884 | 76 | -1.84 | 0.20 | 0.55 | 0.25 | 0.38 | 0.19 | 1.97 | |
| 1883 | 77 | -1.86 | 0.20 | 0.54 | 0.25 | 0.37 | 0.19 | 1.96 | |
| 1882 | 78 | -1.88 | 0.20 | 0.54 | 0.25 | 0.37 | 0.19 | 1.96 | |
| 1881 | 79 | -1.90 | 0.20 | 0.53 | 0.24 | 0.37 | 0.19 | 1.95 | |
| 1880 | 80 | -1.91 | 0.21 | 0.53 | 0.24 | 0.36 | 0.19 | 1.95 | |
| 1879 | 81 | -1.93 | 0.21 | 0.53 | 0.24 | 0.36 | 0.19 | 1.95 | |
| 1878 | 82 | -1.95 | 0.21 | 0.52 | 0.24 | 0.36 | 0.18 | 1.94 | |
| 1877 | 83 | -1.96 | 0.21 | 0.52 | 0.24 | 0.36 | 0.18 | 1.94 | |
| 1876 | 84 | -1.98 | 0.21 | 0.52 | 0.24 | 0.35 | 0.18 | 1.94 | |
| 1875 | 85 | -1.99 | 0.21 | 0.51 | 0.23 | 0.35 | 0.18 | 1.93 | |
| 1874 | 86 | -2.01 | 0.22 | 0.51 | 0.23 | 0.35 | 0.18 | 1.93 | |
| 1873 | 87 | -2.02 | 0.22 | 0.51 | 0.23 | 0.35 | 0.18 | 1.92 | |
| 1872 | 88 | -2.03 | 0.22 | 0.50 | 0.23 | 0.34 | 0.18 | 1.92 | |
| 1871 | 89 | -2.05 | 0.22 | 0.50 | 0.23 | 0.34 | 0.18 | 1.92 | |
| 1870 | 90 | -2.06 | 0.22 | 0.50 | 0.23 | 0.34 | 0.18 | 1.91 | |
| 1869 | 91 | -2.07 | 0.22 | 0.50 | 0.22 | 0.34 | 0.18 | 1.91 | |
| 1868 | 92 | -2.08 | 0.22 | 0.49 | 0.22 | 0.34 | 0.18 | 1.91 | |
| 1867 | 93 | -2.09 | 0.22 | 0.49 | 0.22 | 0.33 | 0.18 | 1.90 | |
| 1866 | 94 | -2.09 | 0.22 | 0.49 | 0.22 | 0.33 | 0.17 | 1.90 | |
| 1865 | 95 | -2.10 | 0.22 | 0.49 | 0.22 | 0.33 | 0.17 | 1.89 | |
| 1864 | 96 | -2.11 | 0.22 | 0.48 | 0.18 | 0.27 | 0.17 | 1.54 | |
| 1863 | 97 | -2.12 | 0.22 | 0.48 | 0.18 | 0.27 | 0.17 | 1.54 | |
| 1862 | 98 | -2.12 | 0.22 | 0.48 | 0.18 | 0.26 | 0.17 | 1.53 | |
| 1861 | 99 | -2.13 | 0.22 | 0.48 | 0.18 | 0.26 | 0.17 | 1.53 | |
| 1860 | 100 | -2.13 | 0.22 | 0.48 | 0.17 | 0.26 | 0.17 | 1.53 | |
| 1859 | 101 | -2.13 | 0.22 | 0.48 | 0.17 | 0.26 | 0.17 | 1.53 |
| Elev | z | α(z) | β(z) | rd | CRR7.5 | CRR | CSR | FSLiq | Comments: See definition of variables on previous page. |
| 1858 | 102 | -2.14 | 0.22 | 0.47 | 0.17 | 0.26 | 0.17 | 1.52 | |
| 1857 | 103 | -2.14 | 0.22 | 0.47 | 0.17 | 0.26 | 0.17 | 1.52 | |
| 1856 | 104 | -2.14 | 0.22 | 0.47 | 0.17 | 0.26 | 0.17 | 1.52 | |
| 1855 | 105 | -2.14 | 0.22 | 0.47 | 0.17 | 0.26 | 0.17 | 1.51 | |
| 1854 | 106 | -2.14 | 0.22 | 0.47 | 0.17 | 0.26 | 0.17 | 1.51 | |
| 1853 | 107 | -2.14 | 0.22 | 0.47 | 0.17 | 0.26 | 0.17 | 1.51 | |
| 1852 | 108 | -2.13 | 0.22 | 0.47 | 0.17 | 0.25 | 0.17 | 1.50 | |
| 1851 | 109 | -2.13 | 0.22 | 0.47 | 0.17 | 0.25 | 0.17 | 1.50 | |
| 1850 | 110 | -2.13 | 0.22 | 0.47 | 0.17 | 0.25 | 0.17 | 1.49 | |
| 1849 | 111 | -2.12 | 0.22 | 0.47 | 0.17 | 0.25 | 0.17 | 1.49 | |
| 1848 | 112 | -2.12 | 0.22 | 0.47 | 0.17 | 0.25 | 0.17 | 1.48 | |
| 1847 | 113 | -2.11 | 0.22 | 0.47 | 0.17 | 0.25 | 0.17 | 1.48 | |
| 1846 | 114 | -2.11 | 0.22 | 0.47 | 0.17 | 0.25 | 0.17 | 1.47 | |
| 1845 | 115 | -2.10 | 0.21 | 0.47 | 0.17 | 0.25 | 0.17 | 1.47 | |
| 1844 | 116 | -2.09 | 0.21 | 0.47 | 0.16 | 0.25 | 0.17 | 1.46 | |
| 1843 | 117 | -2.08 | 0.21 | 0.47 | 0.16 | 0.25 | 0.17 | 1.45 | |
| 1842 | 118 | -2.07 | 0.21 | 0.47 | 0.16 | 0.25 | 0.17 | 1.45 | |
| 1841 | 119 | -2.06 | 0.21 | 0.47 | 0.16 | 0.25 | 0.17 | 1.44 | |
| 1840 | 120 | -2.05 | 0.21 | 0.47 | 0.16 | 0.24 | 0.17 | 1.43 | |
| 1839 | 121 | -2.04 | 0.21 | 0.47 | 0.16 | 0.24 | 0.17 | 1.43 | |
| 1838 | 122 | -2.03 | 0.20 | 0.47 | 0.16 | 0.24 | 0.17 | 1.42 | |
| 1837 | 123 | -2.01 | 0.20 | 0.47 | 0.16 | 0.24 | 0.17 | 1.41 | |
| 1836 | 124 | -2.00 | 0.20 | 0.47 | 0.14 | 0.22 | 0.17 | 1.25 | |
| 1835 | 125 | -1.99 | 0.20 | 0.47 | 0.14 | 0.22 | 0.17 | 1.24 | |
| 1834 | 126 | -1.97 | 0.20 | 0.47 | 0.14 | 0.21 | 0.17 | 1.24 | |
| 1833 | 127 | -1.95 | 0.19 | 0.47 | 0.14 | 0.21 | 0.17 | 1.23 | |
| 1832 | 128 | -1.94 | 0.19 | 0.48 | 0.14 | 0.21 | 0.18 | 1.22 | |
| 1831 | 129 | -1.92 | 0.19 | 0.48 | 0.14 | 0.21 | 0.18 | 1.21 | |
| 1830 | 130 | -1.90 | 0.19 | 0.48 | 0.14 | 0.21 | 0.18 | 1.21 | |
| 1829 | 131 | -1.89 | 0.19 | 0.48 | 0.14 | 0.21 | 0.18 | 1.20 | |
| 1828 | 132 | -1.87 | 0.18 | 0.48 | 0.14 | 0.21 | 0.18 | 1.19 | |
| 1827 | 133 | -1.85 | 0.18 | 0.48 | 0.14 | 0.21 | 0.18 | 1.18 | |
| 1826 | 134 | -1.83 | 0.18 | 0.49 | 0.14 | 0.21 | 0.18 | 1.17 | |
| 1825 | 135 | -1.81 | 0.18 | 0.49 | 0.14 | 0.21 | 0.18 | 1.17 | |
| 1824 | 136 | -1.79 | 0.17 | 0.49 | 0.34 | 0.51 | 0.18 | 2.00 | |
| 1823 | 137 | -1.76 | 0.17 | 0.49 | 0.34 | 0.51 | 0.18 | 2.00 | |
| 1822 | 138 | -1.74 | 0.17 | 0.50 | 0.33 | 0.50 | 0.18 | 2.00 | |
| 1821 | 139 | -1.72 | 0.17 | 0.50 | 0.33 | 0.50 | 0.18 | 2.00 | |
| 1820 | 140 | -1.70 | 0.16 | 0.50 | 0.33 | 0.50 | 0.19 | 2.00 | |
| 1819 | 141 | -1.67 | 0.16 | 0.51 | 0.33 | 0.49 | 0.19 | 2.00 | |
| 1818 | 142 | -1.65 | 0.16 | 0.51 | 0.32 | 0.49 | 0.19 | 2.00 | |
| 1817 | 143 | -1.63 | 0.15 | 0.51 | 0.32 | 0.48 | 0.19 | 2.00 | |
| 1816 | 144 | -1.60 | 0.15 | 0.51 | 0.32 | 0.48 | 0.19 | 2.00 | |
| 1815 | 145 | -1.58 | 0.15 | 0.52 | 0.32 | 0.48 | 0.19 | 2.00 | |
| 1814 | 146 | -1.55 | 0.15 | 0.52 | 0.31 | 0.47 | 0.19 | 2.00 | |
| 1813 | 147 | -1.52 | 0.14 | 0.53 | 0.31 | 0.47 | 0.19 | 2.00 | |
| 1812 | 148 | -1.50 | 0.14 | 0.53 | 0.31 | 0.47 | 0.20 | 2.00 | |
| 1811 | 149 | -1.47 | 0.14 | 0.53 | 0.31 | 0.46 | 0.20 | 2.00 | |
| 1810 | 150 | -1.44 | 0.13 | 0.54 | 0.31 | 0.46 | 0.20 | 2.00 |
Table I5. Results from calculations to find factor of safety against liquefaction (Kayen et al., 2013).
| Elev | z | rd | CSR | CRR7.5 | CRR | FSLiq | Comments: For Event #1 – amax=0.3, Mw=6.2, DFW=Duration weighting factor=1.29, PL=probability of liquefaction triggering=0.15, Elev=Elevation above sea level [t], z=Depth [ft], rd=Shear stress reduction coefficient, CSR=Cyclic stress ratio for the magnitude and effective stress of interest, CRR7.5 = standardized cyclic resistance corresponding to a moment magnitude earthquake of 7.5, with 15 uniform shear stress cycles, and one atmosphere of pressure, CRR=Cyclic resistance ratio for the magnitude and effective stress of interest, FSLiq=Factor of safety against liquefaction. |
| 1960 | 0 | ||||||
| 1959 | 1 | 1.00 | 0.19 | 1.00 | 1.29 | 2.00 | |
| 1958 | 2 | 1.00 | 0.19 | 1.00 | 1.29 | 2.00 | |
| 1957 | 3 | 1.00 | 0.19 | 1.00 | 1.29 | 2.00 | |
| 1956 | 4 | 1.00 | 0.19 | 1.00 | 1.29 | 2.00 | |
| 1955 | 5 | 1.00 | 0.19 | 1.00 | 1.29 | 2.00 | |
| 1954 | 6 | 1.00 | 0.19 | 1.00 | 1.29 | 2.00 | |
| 1953 | 7 | 1.00 | 0.19 | 1.00 | 1.29 | 2.00 | |
| 1952 | 8 | 1.00 | 0.19 | 1.00 | 1.29 | 2.00 | |
| 1951 | 9 | 1.00 | 0.19 | 1.00 | 1.29 | 2.00 | |
| 1950 | 10 | 1.00 | 0.20 | 1.00 | 1.29 | 2.00 | |
| 1949 | 11 | 1.00 | 0.21 | 1.00 | 1.29 | 2.00 | |
| 1948 | 12 | 0.99 | 0.22 | 1.00 | 1.29 | 2.00 | |
| 1947 | 13 | 0.99 | 0.23 | 1.00 | 1.29 | 2.00 | |
| 1946 | 14 | 0.99 | 0.24 | 1.00 | 1.29 | 2.00 | |
| 1945 | 15 | 0.99 | 0.24 | 1.00 | 1.29 | 2.00 | |
| 1944 | 16 | 0.99 | 0.25 | 1.00 | 1.29 | 2.00 | |
| 1943 | 17 | 0.99 | 0.25 | 1.00 | 1.29 | 2.00 | |
| 1942 | 18 | 0.99 | 0.26 | 1.00 | 1.29 | 2.00 | |
| 1941 | 19 | 0.99 | 0.26 | 1.00 | 1.29 | 2.00 | |
| 1940 | 20 | 0.99 | 0.26 | 1.00 | 1.29 | 2.00 | |
| 1939 | 21 | 0.98 | 0.27 | 0.49 | 0.63 | 2.00 | |
| 1938 | 22 | 0.98 | 0.27 | 0.47 | 0.61 | 2.00 | |
| 1937 | 23 | 0.98 | 0.28 | 0.45 | 0.58 | 2.00 | |
| 1936 | 24 | 0.98 | 0.28 | 0.44 | 0.56 | 2.00 | |
| 1935 | 25 | 0.98 | 0.28 | 0.42 | 0.54 | 1.94 | |
| 1934 | 26 | 0.97 | 0.28 | 0.41 | 0.53 | 1.86 | |
| 1933 | 27 | 0.97 | 0.29 | 0.39 | 0.51 | 1.78 | |
| 1932 | 28 | 0.97 | 0.29 | 0.38 | 0.49 | 1.72 | |
| 1931 | 29 | 0.96 | 0.29 | 0.37 | 0.48 | 1.66 | |
| 1930 | 30 | 0.96 | 0.29 | 1.00 | 1.29 | 2.00 | |
| 1929 | 31 | 0.96 | 0.29 | 1.00 | 1.29 | 2.00 | |
| 1928 | 32 | 0.95 | 0.29 | 1.00 | 1.29 | 2.00 | |
| 1927 | 33 | 0.95 | 0.29 | 1.00 | 1.29 | 2.00 | |
| 1926 | 34 | 0.94 | 0.29 | 1.00 | 1.29 | 2.00 | |
| 1925 | 35 | 0.94 | 0.29 | 1.00 | 1.29 | 2.00 | |
| 1924 | 36 | 0.93 | 0.29 | 0.38 | 0.49 | 1.67 | |
| 1923 | 37 | 0.93 | 0.29 | 0.37 | 0.47 | 1.63 | |
| 1922 | 38 | 0.92 | 0.29 | 0.36 | 0.46 | 1.59 | |
| 1921 | 39 | 0.91 | 0.29 | 0.35 | 0.45 | 1.55 | |
| 1920 | 40 | 0.91 | 0.29 | 0.34 | 0.44 | 1.52 | |
| 1919 | 41 | 0.90 | 0.29 | 0.33 | 0.43 | 1.49 | |
| 1918 | 42 | 0.89 | 0.29 | 0.33 | 0.42 | 1.47 | |
| 1917 | 43 | 0.89 | 0.29 | 0.32 | 0.41 | 1.44 | |
| 1916 | 44 | 0.88 | 0.29 | 0.31 | 0.40 | 1.42 | |
| 1915 | 45 | 0.87 | 0.28 | 0.31 | 0.40 | 1.40 | |
| 1914 | 46 | 0.86 | 0.28 | 0.30 | 0.39 | 1.38 | |
| 1913 | 47 | 0.86 | 0.28 | 0.30 | 0.38 | 1.36 | |
| 1912 | 48 | 0.85 | 0.28 | 0.29 | 0.38 | 1.34 | |
| 1911 | 49 | 0.84 | 0.28 | 0.29 | 0.37 | 1.33 | |
| 1910 | 50 | 0.84 | 0.28 | 1.00 | 1.29 | 2.00 |
| Elev | z | rd | CSR | CRR7.5 | CRR | FSLiq | Comments:See definition of variables on previous page. |
| 1909 | 51 | 0.83 | 0.27 | 1.00 | 1.29 | 2.00 | |
| 1908 | 52 | 0.82 | 0.27 | 1.00 | 1.29 | 2.00 | |
| 1907 | 53 | 0.81 | 0.27 | 1.00 | 1.29 | 2.00 | |
| 1906 | 54 | 0.81 | 0.27 | 1.00 | 1.29 | 2.00 | |
| 1905 | 55 | 0.80 | 0.27 | 1.00 | 1.29 | 2.00 | |
| 1904 | 56 | 0.80 | 0.27 | 1.00 | 1.29 | 2.00 | |
| 1903 | 57 | 0.79 | 0.27 | 1.00 | 1.29 | 2.00 | |
| 1902 | 58 | 0.78 | 0.26 | 1.00 | 1.29 | 2.00 | |
| 1901 | 59 | 0.78 | 0.26 | 1.00 | 1.29 | 2.00 | |
| 1900 | 60 | 0.77 | 0.26 | 1.00 | 1.29 | 2.00 | |
| 1899 | 61 | 0.77 | 0.26 | 1.00 | 1.29 | 2.00 | |
| 1898 | 62 | 0.76 | 0.26 | 1.00 | 1.29 | 2.00 | |
| 1897 | 63 | 0.76 | 0.26 | 1.00 | 1.29 | 2.00 | |
| 1896 | 64 | 0.76 | 0.26 | 1.00 | 1.29 | 2.00 | |
| 1895 | 65 | 0.75 | 0.26 | 0.75 | 0.96 | 2.00 | |
| 1894 | 66 | 0.75 | 0.26 | 0.73 | 0.94 | 2.00 | |
| 1893 | 67 | 0.75 | 0.26 | 0.71 | 0.92 | 2.00 | |
| 1892 | 68 | 0.74 | 0.26 | 0.70 | 0.90 | 2.00 | |
| 1891 | 69 | 0.74 | 0.26 | 0.68 | 0.89 | 2.00 | |
| 1890 | 70 | 0.74 | 0.26 | 0.67 | 0.87 | 2.00 | |
| 1889 | 71 | 0.74 | 0.26 | 0.66 | 0.85 | 2.00 | |
| 1888 | 72 | 0.74 | 0.26 | 0.64 | 0.83 | 2.00 | |
| 1887 | 73 | 0.73 | 0.26 | 0.63 | 0.82 | 2.00 | |
| 1886 | 74 | 0.73 | 0.26 | 0.62 | 0.80 | 2.00 | |
| 1885 | 75 | 0.73 | 0.25 | 0.61 | 0.79 | 2.00 | |
| 1884 | 76 | 0.73 | 0.25 | 0.60 | 0.77 | 2.00 | |
| 1883 | 77 | 0.73 | 0.25 | 0.59 | 0.76 | 2.00 | |
| 1882 | 78 | 0.73 | 0.25 | 0.58 | 0.75 | 2.00 | |
| 1881 | 79 | 0.73 | 0.25 | 0.57 | 0.74 | 2.00 | |
| 1880 | 80 | 0.73 | 0.25 | 0.56 | 0.72 | 2.00 | |
| 1879 | 81 | 0.72 | 0.25 | 0.55 | 0.71 | 2.00 | |
| 1878 | 82 | 0.72 | 0.26 | 0.54 | 0.70 | 2.00 | |
| 1877 | 83 | 0.72 | 0.26 | 0.53 | 0.69 | 2.00 | |
| 1876 | 84 | 0.72 | 0.26 | 0.52 | 0.68 | 2.00 | |
| 1875 | 85 | 0.72 | 0.26 | 0.52 | 0.67 | 2.00 | |
| 1874 | 86 | 0.72 | 0.26 | 0.51 | 0.66 | 2.00 | |
| 1873 | 87 | 0.72 | 0.26 | 0.50 | 0.65 | 2.00 | |
| 1872 | 88 | 0.72 | 0.26 | 0.49 | 0.64 | 2.00 | |
| 1871 | 89 | 0.72 | 0.26 | 0.49 | 0.63 | 2.00 | |
| 1870 | 90 | 0.72 | 0.26 | 0.48 | 0.62 | 2.00 | |
| 1869 | 91 | 0.72 | 0.26 | 0.47 | 0.61 | 2.00 | |
| 1868 | 92 | 0.72 | 0.26 | 0.47 | 0.61 | 2.00 | |
| 1867 | 93 | 0.72 | 0.26 | 0.46 | 0.60 | 2.00 | |
| 1866 | 94 | 0.72 | 0.26 | 0.46 | 0.59 | 2.00 | |
| 1865 | 95 | 0.72 | 0.26 | 0.45 | 0.58 | 2.00 | |
| 1864 | 96 | 0.72 | 0.26 | 0.28 | 0.37 | 1.43 | |
| 1863 | 97 | 0.72 | 0.26 | 0.28 | 0.36 | 1.41 | |
| 1862 | 98 | 0.72 | 0.26 | 0.28 | 0.36 | 1.40 | |
| 1861 | 99 | 0.72 | 0.26 | 0.28 | 0.36 | 1.38 | |
| 1860 | 100 | 0.72 | 0.26 | 0.27 | 0.35 | 1.37 | |
| 1859 | 101 | 0.72 | 0.26 | 0.27 | 0.35 | 1.36 |
| Elev | z | rd | CSR | CRR7.5 | CRR | FSLiq | Comments: See definition of variables on previous page. |
| 1858 | 102 | 0.72 | 0.26 | 0.27 | 0.35 | 1.34 | |
| 1857 | 103 | 0.72 | 0.26 | 0.27 | 0.34 | 1.33 | |
| 1856 | 104 | 0.72 | 0.26 | 0.26 | 0.34 | 1.32 | |
| 1855 | 105 | 0.72 | 0.26 | 0.26 | 0.34 | 1.31 | |
| 1854 | 106 | 0.72 | 0.26 | 0.26 | 0.34 | 1.29 | |
| 1853 | 107 | 0.72 | 0.26 | 0.26 | 0.33 | 1.28 | |
| 1852 | 108 | 0.72 | 0.26 | 0.26 | 0.33 | 1.27 | |
| 1851 | 109 | 0.72 | 0.26 | 0.25 | 0.33 | 1.26 | |
| 1850 | 110 | 0.72 | 0.26 | 0.25 | 0.33 | 1.25 | |
| 1849 | 111 | 0.72 | 0.26 | 0.25 | 0.32 | 1.24 | |
| 1848 | 112 | 0.72 | 0.26 | 0.25 | 0.32 | 1.23 | |
| 1847 | 113 | 0.72 | 0.26 | 0.25 | 0.32 | 1.22 | |
| 1846 | 114 | 0.72 | 0.26 | 0.24 | 0.32 | 1.21 | |
| 1845 | 115 | 0.72 | 0.26 | 0.24 | 0.31 | 1.20 | |
| 1844 | 116 | 0.72 | 0.26 | 0.24 | 0.31 | 1.19 | |
| 1843 | 117 | 0.72 | 0.26 | 0.24 | 0.31 | 1.18 | |
| 1842 | 118 | 0.72 | 0.26 | 0.24 | 0.31 | 1.17 | |
| 1841 | 119 | 0.72 | 0.26 | 0.24 | 0.30 | 1.16 | |
| 1840 | 120 | 0.72 | 0.26 | 0.23 | 0.30 | 1.15 | |
| 1839 | 121 | 0.72 | 0.26 | 0.23 | 0.30 | 1.14 | |
| 1838 | 122 | 0.72 | 0.26 | 0.23 | 0.30 | 1.14 | |
| 1837 | 123 | 0.72 | 0.26 | 0.23 | 0.30 | 1.13 | |
| 1836 | 124 | 0.72 | 0.26 | 0.18 | 0.23 | 0.87 | |
| 1835 | 125 | 0.72 | 0.26 | 0.18 | 0.23 | 0.86 | |
| 1834 | 126 | 0.72 | 0.26 | 0.17 | 0.23 | 0.86 | |
| 1833 | 127 | 0.72 | 0.26 | 0.17 | 0.22 | 0.85 | |
| 1832 | 128 | 0.72 | 0.26 | 0.17 | 0.22 | 0.85 | |
| 1831 | 129 | 0.72 | 0.26 | 0.17 | 0.22 | 0.84 | |
| 1830 | 130 | 0.72 | 0.26 | 0.17 | 0.22 | 0.84 | |
| 1829 | 131 | 0.72 | 0.26 | 0.17 | 0.22 | 0.83 | |
| 1828 | 132 | 0.72 | 0.26 | 0.17 | 0.22 | 0.83 | |
| 1827 | 133 | 0.72 | 0.27 | 0.17 | 0.22 | 0.83 | |
| 1826 | 134 | 0.72 | 0.27 | 0.17 | 0.22 | 0.82 | |
| 1825 | 135 | 0.72 | 0.27 | 0.17 | 0.22 | 0.82 | |
| 1824 | 136 | 0.72 | 0.27 | 1.00 | 1.29 | 2.00 | |
| 1823 | 137 | 0.72 | 0.27 | 1.00 | 1.29 | 2.00 | |
| 1822 | 138 | 0.72 | 0.27 | 1.00 | 1.29 | 2.00 | |
| 1821 | 139 | 0.72 | 0.27 | 1.00 | 1.29 | 2.00 | |
| 1820 | 140 | 0.72 | 0.27 | 1.00 | 1.29 | 2.00 | |
| 1819 | 141 | 0.72 | 0.27 | 1.00 | 1.29 | 2.00 | |
| 1818 | 142 | 0.72 | 0.27 | 1.00 | 1.29 | 2.00 | |
| 1817 | 143 | 0.72 | 0.27 | 1.00 | 1.29 | 2.00 | |
| 1816 | 144 | 0.72 | 0.26 | 1.00 | 1.29 | 2.00 | |
| 1815 | 145 | 0.72 | 0.26 | 0.99 | 1.28 | 2.00 | |
| 1814 | 146 | 0.72 | 0.26 | 0.98 | 1.26 | 2.00 | |
| 1813 | 147 | 0.72 | 0.26 | 0.96 | 1.25 | 2.00 | |
| 1812 | 148 | 0.72 | 0.26 | 0.95 | 1.23 | 2.00 | |
| 1811 | 149 | 0.72 | 0.26 | 0.93 | 1.21 | 2.00 | |
| 1810 | 150 | 0.72 | 0.26 | 0.92 | 1.19 | 2.00 |
Table I6. Results from calculations to find soil settlement (Boulanger and Idriss, 2008).
| Elev | z | Dr | Fα | γlim | γmax | εv | δ | Σδ | Comments: For Event #1 – amax=0.3, Mw=6.2, z=Depth [ft], FSα =Factor of Safety, γlim =Limiting shear strain, γmax =Maximum shear strain, εv =Volumetric strain, δ = ∆s = Incremental soil settlement [in], Σδ = s1D = Cumulative soil settlement from bottom of soil profile to top of soil profile [in]. Applicable for gravel and sand (merged FS based on Rollins et al. 2022 for gravel or Kayen et al. 2013 for sand and silt). |
| 1960 | 0 | ||||||||
| 1959 | 1 | 67 | 0.488 | 15 | 0.000 | 0.00 | 0.00 | 2.85 | |
| 1958 | 2 | 67 | 0.488 | 15 | 0.000 | 0.00 | 0.00 | 2.85 | |
| 1957 | 3 | 67 | 0.488 | 15 | 0.000 | 0.00 | 0.00 | 2.85 | |
| 1956 | 4 | 67 | 0.488 | 15 | 0.000 | 0.00 | 0.00 | 2.85 | |
| 1955 | 5 | 67 | 0.488 | 15 | 0.000 | 0.00 | 0.00 | 2.85 | |
| 1954 | 6 | 67 | 0.488 | 15 | 0.000 | 0.00 | 0.00 | 2.85 | |
| 1953 | 7 | 67 | 0.488 | 15 | 0.000 | 0.00 | 0.00 | 2.85 | |
| 1952 | 8 | 67 | 0.488 | 15 | 0.000 | 0.00 | 0.00 | 2.85 | |
| 1951 | 9 | 67 | 0.488 | 15 | 0.000 | 0.00 | 0.00 | 2.85 | |
| 1950 | 10 | 99 | -1.196 | 0 | 0.000 | 0.00 | 0.00 | 2.85 | |
| 1949 | 11 | 99 | -1.196 | 0 | 0.000 | 0.00 | 0.00 | 2.85 | |
| 1948 | 12 | 99 | -1.196 | 0 | 0.000 | 0.00 | 0.00 | 2.85 | |
| 1947 | 13 | 99 | -1.196 | 0 | 0.000 | 0.00 | 0.00 | 2.85 | |
| 1946 | 14 | 99 | -1.196 | 0 | 0.000 | 0.00 | 0.00 | 2.85 | |
| 1945 | 15 | 99 | -1.196 | 0 | 0.000 | 0.00 | 0.00 | 2.85 | |
| 1944 | 16 | 99 | -1.196 | 0 | 0.000 | 0.00 | 0.00 | 2.85 | |
| 1943 | 17 | 99 | -1.196 | 0 | 0.000 | 0.00 | 0.00 | 2.85 | |
| 1942 | 18 | 99 | -1.196 | 0 | 0.000 | 0.00 | 0.00 | 2.85 | |
| 1941 | 19 | 99 | -1.196 | 0 | 0.000 | 0.00 | 0.00 | 2.85 | |
| 1940 | 20 | 99 | -1.196 | 0 | 0.000 | 0.00 | 0.00 | 2.85 | |
| 1939 | 21 | 46 | 0.924 | 49 | 0.000 | 0.00 | 0.00 | 2.85 | |
| 1938 | 22 | 46 | 0.924 | 49 | 0.000 | 0.00 | 0.00 | 2.85 | |
| 1937 | 23 | 46 | 0.924 | 49 | 0.000 | 0.00 | 0.00 | 2.85 | |
| 1936 | 24 | 46 | 0.924 | 49 | 0.000 | 0.00 | 0.00 | 2.85 | |
| 1935 | 25 | 46 | 0.924 | 49 | 0.017 | 0.01 | 0.00 | 2.85 | |
| 1934 | 26 | 46 | 0.924 | 49 | 0.041 | 0.02 | 0.00 | 2.85 | |
| 1933 | 27 | 46 | 0.924 | 49 | 0.067 | 0.03 | 0.00 | 2.85 | |
| 1932 | 28 | 46 | 0.924 | 49 | 0.094 | 0.04 | 0.01 | 2.84 | |
| 1931 | 29 | 46 | 0.924 | 49 | 0.124 | 0.06 | 0.01 | 2.84 | |
| 1930 | 30 | 94 | -0.852 | 1 | 0.000 | 0.00 | 0.00 | 2.83 | |
| 1929 | 31 | 94 | -0.852 | 1 | 0.000 | 0.00 | 0.00 | 2.83 | |
| 1928 | 32 | 94 | -0.852 | 1 | 0.000 | 0.00 | 0.00 | 2.83 | |
| 1927 | 33 | 94 | -0.852 | 1 | 0.000 | 0.00 | 0.00 | 2.83 | |
| 1926 | 34 | 94 | -0.852 | 1 | 0.000 | 0.00 | 0.00 | 2.83 | |
| 1925 | 35 | 94 | -0.852 | 1 | 0.000 | 0.00 | 0.00 | 2.83 | |
| 1924 | 36 | 42 | 0.948 | 58 | 0.085 | 0.04 | 0.01 | 2.83 | |
| 1923 | 37 | 42 | 0.948 | 58 | 0.101 | 0.05 | 0.01 | 2.82 | |
| 1922 | 38 | 42 | 0.948 | 58 | 0.118 | 0.06 | 0.01 | 2.82 | |
| 1921 | 39 | 42 | 0.948 | 58 | 0.135 | 0.07 | 0.01 | 2.81 | |
| 1920 | 40 | 42 | 0.948 | 58 | 0.153 | 0.08 | 0.01 | 2.80 | |
| 1919 | 41 | 42 | 0.948 | 58 | 0.171 | 0.09 | 0.01 | 2.79 | |
| 1918 | 42 | 42 | 0.948 | 58 | 0.189 | 0.10 | 0.01 | 2.78 | |
| 1917 | 43 | 42 | 0.948 | 58 | 0.208 | 0.11 | 0.01 | 2.77 | |
| 1916 | 44 | 42 | 0.948 | 58 | 0.227 | 0.12 | 0.01 | 2.76 | |
| 1915 | 45 | 42 | 0.948 | 58 | 0.246 | 0.13 | 0.02 | 2.74 | |
| 1914 | 46 | 42 | 0.948 | 58 | 0.265 | 0.14 | 0.02 | 2.73 | |
| 1913 | 47 | 42 | 0.948 | 58 | 0.284 | 0.15 | 0.02 | 2.71 | |
| 1912 | 48 | 42 | 0.948 | 58 | 0.304 | 0.16 | 0.02 | 2.69 | |
| 1911 | 49 | 42 | 0.948 | 58 | 0.323 | 0.17 | 0.02 | 2.67 | |
| 1910 | 50 | 84 | -0.254 | 3 | 0.000 | 0.00 | 0.00 | 2.65 |
| Elev | z | Dr | Fα | γlim | γmax | εv | δ | Σδ | Comments: See definition of variables on previous page. Applicable for gravel and sand (merged FS based on Rollins et al. 2022 for gravel or Kayen et al. 2013 for sand and silt). |
| 1909 | 51 | 84 | -0.254 | 3 | 0.000 | 0.00 | 0.00 | 2.65 | |
| 1908 | 52 | 84 | -0.254 | 3 | 0.000 | 0.00 | 0.00 | 2.65 | |
| 1907 | 53 | 84 | -0.254 | 3 | 0.000 | 0.00 | 0.00 | 2.65 | |
| 1906 | 54 | 84 | -0.254 | 3 | 0.000 | 0.00 | 0.00 | 2.65 | |
| 1905 | 55 | 84 | -0.254 | 3 | 0.000 | 0.00 | 0.00 | 2.65 | |
| 1904 | 56 | 84 | -0.254 | 3 | 0.000 | 0.00 | 0.00 | 2.65 | |
| 1903 | 57 | 84 | -0.254 | 3 | 0.000 | 0.00 | 0.00 | 2.65 | |
| 1902 | 58 | 84 | -0.254 | 3 | 0.000 | 0.00 | 0.00 | 2.65 | |
| 1901 | 59 | 84 | -0.254 | 3 | 0.000 | 0.00 | 0.00 | 2.65 | |
| 1900 | 60 | 84 | -0.254 | 3 | 0.000 | 0.00 | 0.00 | 2.65 | |
| 1899 | 61 | 84 | -0.254 | 3 | 0.000 | 0.00 | 0.00 | 2.65 | |
| 1898 | 62 | 84 | -0.254 | 3 | 0.000 | 0.00 | 0.00 | 2.65 | |
| 1897 | 63 | 84 | -0.254 | 3 | 0.000 | 0.00 | 0.00 | 2.65 | |
| 1896 | 64 | 84 | -0.254 | 3 | 0.000 | 0.00 | 0.00 | 2.65 | |
| 1895 | 65 | 68 | 0.454 | 14 | 0.000 | 0.00 | 0.00 | 2.65 | |
| 1894 | 66 | 68 | 0.454 | 14 | 0.000 | 0.00 | 0.00 | 2.65 | |
| 1893 | 67 | 68 | 0.454 | 14 | 0.000 | 0.00 | 0.00 | 2.65 | |
| 1892 | 68 | 68 | 0.454 | 14 | 0.000 | 0.00 | 0.00 | 2.65 | |
| 1891 | 69 | 68 | 0.454 | 14 | 0.002 | 0.00 | 0.00 | 2.65 | |
| 1890 | 70 | 68 | 0.454 | 14 | 0.008 | 0.00 | 0.00 | 2.65 | |
| 1889 | 71 | 68 | 0.454 | 14 | 0.015 | 0.00 | 0.00 | 2.65 | |
| 1888 | 72 | 68 | 0.454 | 14 | 0.021 | 0.01 | 0.00 | 2.65 | |
| 1887 | 73 | 68 | 0.454 | 14 | 0.027 | 0.01 | 0.00 | 2.65 | |
| 1886 | 74 | 68 | 0.454 | 14 | 0.033 | 0.01 | 0.00 | 2.65 | |
| 1885 | 75 | 68 | 0.454 | 14 | 0.038 | 0.01 | 0.00 | 2.65 | |
| 1884 | 76 | 68 | 0.454 | 14 | 0.044 | 0.01 | 0.00 | 2.65 | |
| 1883 | 77 | 68 | 0.454 | 14 | 0.049 | 0.01 | 0.00 | 2.65 | |
| 1882 | 78 | 68 | 0.454 | 14 | 0.054 | 0.01 | 0.00 | 2.64 | |
| 1881 | 79 | 68 | 0.454 | 14 | 0.059 | 0.02 | 0.00 | 2.64 | |
| 1880 | 80 | 68 | 0.454 | 14 | 0.064 | 0.02 | 0.00 | 2.64 | |
| 1879 | 81 | 68 | 0.454 | 14 | 0.068 | 0.02 | 0.00 | 2.64 | |
| 1878 | 82 | 68 | 0.454 | 14 | 0.073 | 0.02 | 0.00 | 2.64 | |
| 1877 | 83 | 68 | 0.454 | 14 | 0.078 | 0.02 | 0.00 | 2.63 | |
| 1876 | 84 | 68 | 0.454 | 14 | 0.083 | 0.02 | 0.00 | 2.63 | |
| 1875 | 85 | 68 | 0.454 | 14 | 0.088 | 0.02 | 0.00 | 2.63 | |
| 1874 | 86 | 68 | 0.454 | 14 | 0.093 | 0.03 | 0.00 | 2.63 | |
| 1873 | 87 | 68 | 0.454 | 14 | 0.098 | 0.03 | 0.00 | 2.62 | |
| 1872 | 88 | 68 | 0.454 | 14 | 0.103 | 0.03 | 0.00 | 2.62 | |
| 1871 | 89 | 68 | 0.454 | 14 | 0.108 | 0.03 | 0.00 | 2.62 | |
| 1870 | 90 | 68 | 0.454 | 14 | 0.113 | 0.03 | 0.00 | 2.61 | |
| 1869 | 91 | 68 | 0.454 | 14 | 0.119 | 0.03 | 0.00 | 2.61 | |
| 1868 | 92 | 68 | 0.454 | 14 | 0.125 | 0.03 | 0.00 | 2.61 | |
| 1867 | 93 | 68 | 0.454 | 14 | 0.131 | 0.04 | 0.00 | 2.60 | |
| 1866 | 94 | 68 | 0.454 | 14 | 0.137 | 0.04 | 0.00 | 2.60 | |
| 1865 | 95 | 68 | 0.454 | 14 | 0.143 | 0.04 | 0.00 | 2.59 | |
| 1864 | 96 | 48 | 0.906 | 44 | 0.242 | 0.11 | 0.01 | 2.59 | |
| 1863 | 97 | 48 | 0.906 | 44 | 0.244 | 0.11 | 0.01 | 2.57 | |
| 1862 | 98 | 48 | 0.906 | 44 | 0.245 | 0.11 | 0.01 | 2.56 | |
| 1861 | 99 | 48 | 0.906 | 44 | 0.247 | 0.11 | 0.01 | 2.55 | |
| 1860 | 100 | 48 | 0.906 | 44 | 0.250 | 0.11 | 0.01 | 2.53 | |
| 1859 | 101 | 48 | 0.906 | 44 | 0.252 | 0.11 | 0.01 | 2.52 |
| Elev | z | Dr | Fα | γlim | γmax | εv | δ | Σδ | Comments: See definition of variables on previous page. Applicable for gravel and sand (merged FS based on Rollins et al. 2022 for gravel or Kayen et al. 2013 for sand and silt). |
| 1858 | 102 | 48 | 0.906 | 44 | 0.255 | 0.12 | 0.01 | 2.51 | |
| 1857 | 103 | 48 | 0.906 | 44 | 0.258 | 0.12 | 0.01 | 2.49 | |
| 1856 | 104 | 48 | 0.906 | 44 | 0.261 | 0.12 | 0.01 | 2.48 | |
| 1855 | 105 | 48 | 0.906 | 44 | 0.264 | 0.12 | 0.01 | 2.47 | |
| 1854 | 106 | 48 | 0.906 | 44 | 0.268 | 0.12 | 0.01 | 2.45 | |
| 1853 | 107 | 48 | 0.906 | 44 | 0.272 | 0.12 | 0.01 | 2.44 | |
| 1852 | 108 | 48 | 0.906 | 44 | 0.276 | 0.12 | 0.01 | 2.42 | |
| 1851 | 109 | 48 | 0.906 | 44 | 0.280 | 0.13 | 0.02 | 2.41 | |
| 1850 | 110 | 48 | 0.906 | 44 | 0.285 | 0.13 | 0.02 | 2.39 | |
| 1849 | 111 | 48 | 0.906 | 44 | 0.291 | 0.13 | 0.02 | 2.38 | |
| 1848 | 112 | 48 | 0.906 | 44 | 0.296 | 0.13 | 0.02 | 2.36 | |
| 1847 | 113 | 48 | 0.906 | 44 | 0.302 | 0.14 | 0.02 | 2.34 | |
| 1846 | 114 | 48 | 0.906 | 44 | 0.308 | 0.14 | 0.02 | 2.33 | |
| 1845 | 115 | 48 | 0.906 | 44 | 0.315 | 0.14 | 0.02 | 2.31 | |
| 1844 | 116 | 48 | 0.906 | 44 | 0.322 | 0.15 | 0.02 | 2.29 | |
| 1843 | 117 | 48 | 0.906 | 44 | 0.330 | 0.15 | 0.02 | 2.28 | |
| 1842 | 118 | 48 | 0.906 | 44 | 0.338 | 0.15 | 0.02 | 2.26 | |
| 1841 | 119 | 48 | 0.906 | 44 | 0.346 | 0.16 | 0.02 | 2.24 | |
| 1840 | 120 | 48 | 0.906 | 44 | 0.356 | 0.16 | 0.02 | 2.22 | |
| 1839 | 121 | 48 | 0.906 | 44 | 0.365 | 0.17 | 0.02 | 2.20 | |
| 1838 | 122 | 48 | 0.906 | 44 | 0.376 | 0.170 | 0.020 | 2.18 | |
| 1837 | 123 | 48 | 0.906 | 44 | 0.386 | 0.17 | 0.02 | 2.16 | |
| 1836 | 124 | 37 | -0.952 | 72 | 2.325 | 1.38 | 0.17 | 2.14 | |
| 1835 | 125 | 37 | -0.952 | 72 | 2.354 | 1.40 | 0.17 | 1.98 | |
| 1834 | 126 | 37 | -0.952 | 72 | 2.383 | 1.42 | 0.17 | 1.81 | |
| 1833 | 127 | 37 | -0.952 | 72 | 2.413 | 1.44 | 0.17 | 1.64 | |
| 1832 | 128 | 37 | -0.952 | 72 | 2.445 | 1.45 | 0.17 | 1.47 | |
| 1831 | 129 | 37 | -0.952 | 72 | 2.477 | 1.47 | 0.18 | 1.29 | |
| 1830 | 130 | 37 | -0.952 | 72 | 2.511 | 1.49 | 0.18 | 1.11 | |
| 1829 | 131 | 37 | -0.952 | 72 | 2.545 | 1.51 | 0.18 | 0.93 | |
| 1828 | 132 | 37 | -0.952 | 72 | 2.581 | 1.54 | 0.18 | 0.75 | |
| 1827 | 133 | 37 | -0.952 | 72 | 2.618 | 1.56 | 0.19 | 0.57 | |
| 1826 | 134 | 37 | -0.952 | 72 | 2.655 | 1.58 | 0.19 | 0.38 | |
| 1825 | 135 | 37 | -0.952 | 72 | 2.694 | 1.60 | 0.19 | 0.19 | |
| 1824 | 136 | 86 | -0.364 | 3 | 0.000 | 0.00 | 0.00 | 0.00 | |
| 1823 | 137 | 86 | -0.364 | 3 | 0.000 | 0.00 | 0.00 | 0.00 | |
| 1822 | 138 | 86 | -0.364 | 3 | 0.000 | 0.00 | 0.00 | 0.00 | |
| 1821 | 139 | 86 | -0.364 | 3 | 0.000 | 0.00 | 0.00 | 0.00 | |
| 1820 | 140 | 86 | -0.364 | 3 | 0.000 | 0.00 | 0.00 | 0.00 | |
| 1819 | 141 | 86 | -0.364 | 3 | 0.000 | 0.00 | 0.00 | 0.00 | |
| 1818 | 142 | 86 | -0.364 | 3 | 0.000 | 0.00 | 0.00 | 0.00 | |
| 1817 | 143 | 86 | -0.364 | 3 | 0.000 | 0.00 | 0.00 | 0.00 | |
| 1816 | 144 | 86 | -0.364 | 3 | 0.000 | 0.00 | 0.00 | 0.00 | |
| 1815 | 145 | 86 | -0.364 | 3 | 0.000 | 0.00 | 0.00 | 0.00 | |
| 1814 | 146 | 86 | -0.364 | 3 | 0.000 | 0.00 | 0.00 | 0.00 | |
| 1813 | 147 | 86 | -0.364 | 3 | 0.000 | 0.00 | 0.00 | 0.00 | |
| 1812 | 148 | 86 | -0.364 | 3 | 0.000 | 0.00 | 0.00 | 0.00 | |
| 1811 | 149 | 86 | -0.364 | 3 | 0.000 | 0.00 | 0.00 | 0.00 | |
| 1810 | 150 | 86 | -0.364 | 3 | 0.000 | 0.00 | 0.00 | 0.00 |
Step 3: Establish pile data
Design-specific information, obtained from Hemstreet (2014), for the piles (type, size, length, modulus) that were to be installed within Embankment 1 for the Tok River Bridge No. 0603 and the design earthquake are presented in Table I7. The pile investigated was a 124-foot long 18inch diameter open ended steel pipe pile with a 0.5-inch wall thickness.
Table I7. Pile and earthquake information from Hemstreet (2014).
| Anticipated Liquefaction Settlement | 6-8 [inches] |
| Anticipated Nominal Drag load | 75 [kips] |
| Anticipated Driving Resistance | 600 [kips] |
| Pile Material | Steel |
| Pile Shape | Open Ended Pipe Pile |
| Pile Thickness | 0.5 [inches] |
| Pile Area | 27.49 [sq. inches] |
| Pile Embedded Length | 124 [ft] |
| Pile Modulus | 29000 [ksi] |
| Strength I Factored Load | 300 [kips] |
| Nominal Resistance | 460 [kips] |
| Resistance Factor | 0.65 |
| Top Load on Pile | 0 [kips] |
| Number of Pile Increments | 61 |
| Ground Water Table Depth | 10 [ft] |
| Design Earthquake Sources | Denali Fault Western Part Totshunda Fault |
| Attenuation Relationships | Abrahamson and Silva (2008) Boore and Atkinson (2008) Campbell and Bozorgnia (2008) |
Step 4: Compute incremental side resistance
The unit side resistance and incremental side resistance were identified using the Innovative Geotechnics (2023) PileAXL program (Version 2.5). As mentioned in the description of the previous design examples that used the Innovative Geotechnics programs, the programs only accept metric units. Therefore, many of the parameters were converted between imperial units and metric units. The input data, within the PileAXL program, are shown in Figures I3 through I11. The pile section properties and analysis options are shown in Figures I3 and I4.

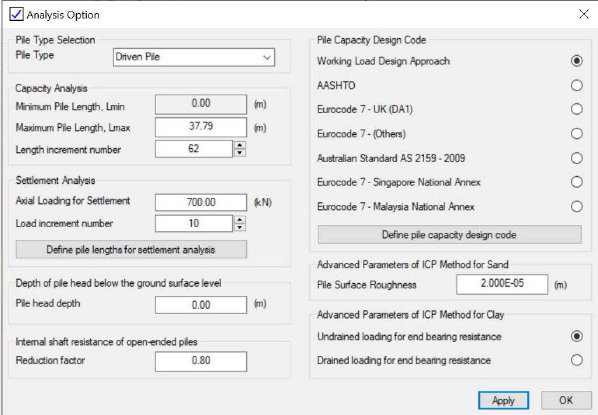

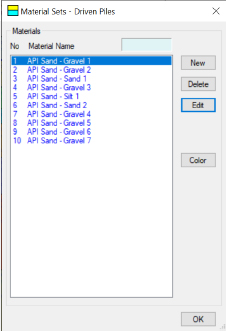
The working load design approach is presented in Figure I5. As with all of the other design examples, all of the used loads were unfactored loads and all of the determined resistances were unfactored resistances. Therefore, the factors of safety values in Figure I5 were set to unity. The different soil layer materials were created using the Material Sets, as shown in Figure I6. Each of the materials was created then modified by selecting the Edit button to enable input of the various soil parameters (material type, material name, total unit weight, friction angle, and coefficient of lateral earth pressure) as shown in Figure I7. Additional parameters included in the driven pile material input (bearing capacity factor, limiting skin resistance, and limiting unit end bearing) were automatically populated by selection on the appropriate material using the (…) button that was located next to the bearing capacity factor input box. The friction angle and soil type were used to select the appropriate soil description (Figure I8).
Upon completion of the creation of the soil materials, the soil material were assigned to soil layers (Figure I9). The nine soil layers that were created using the Define – Soil Layers – Edit buttons are presented in Figure I10. All of the required information was available within the program at the end of the definition of soil layers stage (Figure I11). The program was then executed to obtain the desired results that are presented in Figure I12 and Table I8. The incremental side resistance is presented as ∆Q in Table I8. These values were obtained by differencing the ultimate total side resistance (ULS Qs) for each sublayer as a function of depth.
Step 5: Develop a depth-dependent load profile
A depth-dependent load profile was output directly from the program. The depth depended load profile was obtained by adding the unfactored top load (149.5tons) to each reported in the ultimate total side resistance (ULS Qs) column. Although a depth-dependent load profile is not presented, this profile can be developed by plotting each depth-dependent load (Q) against the corresponding depth (z).
Step 6: Compute end bearing resistance; develop a depth resistance profile
The depth-dependent resistance profile was developed by adding the output end bearing resistance to the side resistance. The profile is developed from the bottom of the pile to the top of the pile; the incremental side resistance will cumulate from the bottom of the pile to the top of the pile. Although a depth-dependent resistance profile is not presented, this profile can be developed by plotting each depth-dependent load (R) against the corresponding depth (z).
Step 7: Develop a depth-dependent combined load profile
The depth-dependent combined load-resistance curve is presented as Figure I13. This curve was developed by plotting the minimum of load or resistance as a function of depth against the corresponding depth. For this curve, a maximum load in the pile of 282 tons was observed.
Step 8: Identify the location of the neutral plane from the combined load-resistance curve
As observed in Figure I13, the neutral plane is observed to occur at the location of maximum load in the pile. This location is identified as occurring at 99.99ft below the ground surface. For this analysis, the open ended pile was assumed to be plugged.
Step 9: Calculate the amount of drag load in the pile
The 129 tons drag load was calculated for the pile. This drag load was obtained by subtracting the unfactored top load (149.5 tons) from the maximum load in the pile (282 tons). As previously mentioned in Steps 7 and 8, the maximum load in the pile occurred at the neutral plane (at a depth of 99.99 feet below the ground surface).
Steps 10 and 11: Calculate the toe settlement, elastic compression, and geotechncial resistance
Steps 10 and 11 of the NCHRP12-116A Method A flowchart were combined because the values are presented using the load-settlement curve. The load-settlement curve that was developed using output from the PileAXL software is shown in Figure I14 and the results are tabulated in Table I9. From Figure I14, the pile head settlement was calculated to be 1.54in and the geotechnical resistance was calculated to be 337tons. The elastic compression of the pile was calculated using the depth-dependent loads from the combined load-resistance curve. The amount of cumulative elastic compression was determined by summing the individual elastic compression values from the bottom of the pile to the top of the pile. By subtracting the cumulative elastic compression in the pile, as a function of depth, a toe settlement of 0.786in was obtained for Event 1 (a=0.3, Mw=6.2). The geotechnical resistance was determined to be sufficient, although the amount of settlement at the pile toe was determined to be excessive. The pile was not tipped into rock, so Step 12 of the NCHRP12-116A Method A flowchart was then completed.
Step 12: Determine the location and settlement of the neutral plane (from the soil settlement-pilesettlement curve)
The pile settlement mentioned in Steps 10 and 11 was plotted on the same plot as the soil settlement obtained in Step 2. As shown in Figure I15, the pile settlement and the soil settlement curves do not cross. Therefore, the location of the neutral plane cannot be determined using the load-settlement–soil-settlement curve. If the two pile settlement and soil settlement curves do not cross than no drag load should develop but significant downdrag will develop. The evaluated pile (124ft long) was too short and should be extended to prevent the significant downdrag. Although the pile is able to maintain the design load, as the downdrag develops the pile toe moves downward creating a serviceability issue.
The design check of the neutral plane locations, which were obtained in Step 8 and in Step 12, being within 5 feet of each other was not met because the neutral plane was not able to be identified in the pile-settlement–soil-settlement curve in Step 12. Therefore, Steps 3 through 12 were repeated by following the NCHRP12-116A Method A flowchart. A pile length of 136 feet was evaluated because no post-liquefaction reconsolidation settlement was observed below this depth. The key figures developed by using a pile length of 136 feet are presented in Figures I16 through I18.
Step 13: Perform limit state checks
From these Figures I16 through I18, the neutral plane locations that were obtained from the combined load-resistance curve and the soil settlement-pile settlement curve were 105.99ft and 131ft. The design check of the neutral plane locations, which were obtained in Step 8 and in Step 12, being within 5 feet of each other was not met because the difference in the neutral plane locations was greater than 5 feet. Step 13 of the NCHRP12-116A Method A flowchart could not be completed due to the difference in neutral plane locations being greater than 5 feet. Therefore, a difference pile geometry should be selected or Method B should be attempted. As with Design Example 6, due to the large difference modifications to the pile geometry are not expected to alter the difference in the locations of the neutral plane. Therefore, for this design example, it is recommended that the Method B flowchart be followed.


Table I8. PileAXL output for the Tok River Bridge Abutment 1 piles (converted to imperial units).
| Depth | ULS fs | ULS Qs | ULS Qb | ∆Q | Q | R | min(Q,R) | δpile | Comments: ULS fs = Ultimate unit side shear (PileAXL output), ULS Qs = Ultimate total side resistance (PileAXL output), ULS Qb = Ultimate bearing resistance (PileAXL output), ∆Q =incremental side resistance (Excel calculation), Q = cumulative load in the pile (Excel calculation), R= resistance from soil surrounding pile; resistance values are calculated at the top of each sublayer (Excel calculation), min(Q,R) = minimum of Q and R for each depth (Excel calculation). |
| [ft] | [tsf] | [tons] | [tons] | [tons] | [tons] | [tons] | [tons] | [in] | |
| 0.00 | 0.0000 | 0.0000 | 0.0000 | 0.0000 | 149.5000 | 411.6266 | 149.5000 | 1.540 | |
| 2.00 | 0.0357 | 0.1684 | 10.6007 | 0.1684 | 149.6684 | 411.6266 | 149.6684 | 1.531 | |
| 4.00 | 0.0715 | 0.6736 | 21.2014 | 0.5052 | 150.1736 | 411.4583 | 150.1736 | 1.523 | |
| 6.00 | 0.0835 | 1.4040 | 31.8022 | 0.7304 | 150.9040 | 410.9531 | 150.9040 | 1.514 | |
| 8.00 | 0.0835 | 2.1912 | 42.4029 | 0.7872 | 151.6912 | 410.2227 | 151.6912 | 1.505 | |
| 10.00 | 0.0835 | 2.9784 | 53.0036 | 0.7872 | 152.4784 | 409.4355 | 152.4784 | 1.496 | |
| 12.00 | 0.1253 | 3.9624 | 58.8319 | 0.9840 | 153.4624 | 408.6482 | 153.4624 | 1.487 | |
| 14.00 | 0.1253 | 5.1433 | 64.6412 | 1.1808 | 154.6433 | 407.6642 | 154.6433 | 1.478 | |
| 16.00 | 0.1253 | 6.3241 | 70.4505 | 1.1808 | 155.8241 | 406.4834 | 155.8241 | 1.469 | |
| 18.00 | 0.1253 | 7.5049 | 76.2598 | 1.1808 | 157.0049 | 405.3025 | 157.0049 | 1.460 | |
| 20.00 | 0.1253 | 8.6858 | 82.0691 | 1.1808 | 158.1858 | 404.1217 | 158.1858 | 1.451 | |
| 22.00 | 0.1671 | 10.0634 | 69.8799 | 1.3776 | 159.5634 | 402.9409 | 159.5634 | 1.441 | |
| 24.00 | 0.1671 | 11.6379 | 73.6816 | 1.5744 | 161.1379 | 401.5632 | 161.1379 | 1.432 | |
| 26.00 | 0.1671 | 13.2123 | 77.4832 | 1.5744 | 162.7123 | 399.9888 | 162.7123 | 1.423 | |
| 28.00 | 0.1671 | 14.7867 | 81.2849 | 1.5745 | 164.2867 | 398.4143 | 164.2867 | 1.413 | |
| 30.00 | 0.1880 | 16.4596 | 106.3620 | 1.6728 | 165.9596 | 396.8399 | 165.9596 | 1.403 | |
| 32.00 | 0.1880 | 18.2308 | 111.9858 | 1.7713 | 167.7308 | 395.1671 | 167.7308 | 1.394 | |
| 34.00 | 0.1880 | 20.0021 | 117.6095 | 1.7713 | 169.5021 | 393.3958 | 169.5021 | 1.384 | |
| 36.00 | 0.1880 | 21.7733 | 123.2332 | 1.7712 | 171.2733 | 391.6245 | 171.2733 | 1.374 | |
| 37.99 | 0.2506 | 23.8398 | 103.0855 | 2.0665 | 173.3398 | 389.8533 | 173.3398 | 1.364 | |
| 39.99 | 0.2506 | 26.2015 | 107.5845 | 2.3617 | 175.7015 | 387.7868 | 175.7015 | 1.353 | |
| 41.99 | 0.2506 | 28.5631 | 112.0835 | 2.3617 | 178.0631 | 385.4252 | 178.0631 | 1.343 | |
| 43.99 | 0.2506 | 30.9248 | 116.5825 | 2.3617 | 180.4248 | 383.0635 | 180.4248 | 1.333 | |
| 45.99 | 0.2506 | 33.2865 | 121.0815 | 2.3617 | 182.7865 | 380.7018 | 182.7865 | 1.322 | |
| 47.99 | 0.2506 | 35.6481 | 125.5804 | 2.3617 | 185.1481 | 378.3402 | 185.1481 | 1.311 | |
| 49.99 | 0.3133 | 38.3050 | 162.5888 | 2.6569 | 187.8050 | 375.9785 | 187.8050 | 1.300 | |
| 51.99 | 0.3133 | 41.2571 | 168.0438 | 2.9521 | 190.7571 | 373.3216 | 190.7571 | 1.289 | |
| 53.99 | 0.3133 | 44.2092 | 173.4988 | 2.9521 | 193.7092 | 370.3695 | 193.7092 | 1.278 | |
| 55.99 | 0.3133 | 47.1613 | 178.9538 | 2.9521 | 196.6613 | 367.4174 | 196.6613 | 1.266 | |
| 57.99 | 0.3133 | 50.1134 | 184.4088 | 2.9521 | 199.6134 | 364.4654 | 199.6134 | 1.255 | |
| 59.99 | 0.3133 | 53.0654 | 189.8638 | 2.9521 | 202.5654 | 361.5133 | 202.5654 | 1.243 | |
| 61.99 | 0.3133 | 56.0175 | 195.3188 | 2.9521 | 205.5175 | 358.5612 | 205.5175 | 1.231 | |
| 63.99 | 0.3133 | 58.9696 | 200.7738 | 2.9521 | 208.4696 | 355.6091 | 208.4696 | 1.219 | |
| 65.99 | 0.4282 | 62.4629 | 206.0956 | 3.4933 | 211.9629 | 352.6570 | 211.9629 | 1.207 | |
| 67.99 | 0.4282 | 66.4974 | 211.2919 | 4.0345 | 215.9974 | 349.1637 | 215.9974 | 1.194 | |
| 69.99 | 0.4282 | 70.5319 | 216.4882 | 4.0345 | 220.0319 | 345.1292 | 220.0319 | 1.181 | |
| 71.99 | 0.4282 | 74.5665 | 221.4368 | 4.0345 | 224.0665 | 341.0947 | 224.0665 | 1.168 | |
| 73.99 | 0.4282 | 78.6010 | 221.4368 | 4.0345 | 228.1010 | 337.0602 | 228.1010 | 1.155 | |
| 75.99 | 0.4282 | 82.6355 | 221.4368 | 4.0345 | 232.1355 | 333.0257 | 232.1355 | 1.141 | |
| 77.99 | 0.4282 | 86.6700 | 221.4368 | 4.0345 | 236.1700 | 328.9911 | 236.1700 | 1.128 | |
| 79.99 | 0.4282 | 90.7045 | 221.4368 | 4.0345 | 240.2045 | 324.9566 | 240.2045 | 1.114 | |
| 81.99 | 0.4282 | 94.7390 | 221.4368 | 4.0345 | 244.2390 | 320.9221 | 244.2390 | 1.099 | |
| 83.99 | 0.4282 | 98.7736 | 221.4368 | 4.0345 | 248.2736 | 316.8876 | 248.2736 | 1.085 | |
| 85.99 | 0.4282 | 102.8081 | 221.4368 | 4.0345 | 252.3081 | 312.8531 | 252.3081 | 1.070 | |
| 87.99 | 0.4282 | 106.8426 | 221.4368 | 4.0345 | 256.3426 | 308.8186 | 256.3426 | 1.055 | |
| 89.99 | 0.4282 | 110.8771 | 221.4368 | 4.0345 | 260.3771 | 304.7840 | 260.3771 | 1.040 | |
| 91.99 | 0.4282 | 114.9116 | 221.4368 | 4.0345 | 264.4116 | 300.7495 | 264.4116 | 1.025 | |
| 93.99 | 0.4282 | 118.9461 | 221.4368 | 4.0345 | 268.4461 | 296.7150 | 268.4461 | 1.009 | |
| 95.99 | 0.4282 | 122.9807 | 221.4368 | 4.0345 | 272.4807 | 292.6805 | 272.4807 | 0.993 | |
| 97.99 | 0.5535 | 127.6056 | 221.4368 | 4.6249 | 277.1056 | 288.6460 | 277.1056 | 0.977 | |
| 99.99 | 0.5535 | 132.8209 | 221.4368 | 5.2153 | 282.3209 | 284.0210 | 282.3209 | 0.961 |
| Depth | ULS fs | ULS Qs | ULS Qb | ∆Q | Q | R | min(Q,R) | δpile | Comments: See definition of variables on previous page. |
| 101.99 | 0.5535 | 138.0363 | 221.4368 | 5.2153 | 287.5363 | 278.8057 | 278.8057 | 0.945 | |
| 103.99 | 0.5535 | 143.2516 | 221.4368 | 5.2153 | 292.7516 | 273.5903 | 273.5903 | 0.929 | |
| 105.99 | 0.5535 | 148.4670 | 221.4368 | 5.2153 | 297.9670 | 268.3750 | 268.3750 | 0.913 | |
| 107.99 | 0.5535 | 153.6823 | 221.4368 | 5.2153 | 303.1823 | 263.1596 | 263.1596 | 0.898 | |
| 109.98 | 0.5535 | 158.8977 | 221.4368 | 5.2154 | 308.3977 | 257.9443 | 257.9443 | 0.883 | |
| 111.98 | 0.5535 | 164.1130 | 221.4368 | 5.2153 | 313.6130 | 252.7289 | 252.7289 | 0.868 | |
| 113.98 | 0.5535 | 169.3284 | 221.4368 | 5.2153 | 318.8284 | 247.5136 | 247.5136 | 0.854 | |
| 115.98 | 0.5535 | 174.5437 | 221.4368 | 5.2153 | 324.0437 | 242.2982 | 242.2982 | 0.840 | |
| 117.98 | 0.5535 | 179.7591 | 221.4368 | 5.2153 | 329.2591 | 237.0829 | 237.0829 | 0.826 | |
| 119.98 | 0.5535 | 184.9744 | 221.4368 | 5.2153 | 334.4744 | 231.8675 | 231.8675 | 0.812 | |
| 121.98 | 0.5535 | 190.1898 | 221.4368 | 5.2153 | 339.6898 | 226.6522 | 226.6522 | 0.799 | |
| 123.98 | 0.5535 | 195.4051 | 221.4368 | 5.2153 | 344.9051 | 221.4368 | 221.4368 | 0.786 |


Table I9. Load-settlement curve data for a 124ft long pile. Note: presented using imperial units.
| δhead | Qhead | Comments: δhead=Pile head movement, Qhead=Pile head load |
| [in] | [tons] | |
| 0.000 | 0.000 | |
| 0.065 | 33.721 | |
| 0.132 | 67.443 | |
| 0.212 | 101.164 | |
| 0.307 | 134.885 | |
| 0.415 | 168.607 | |
| 0.534 | 202.328 | |
| 0.668 | 236.049 | |
| 0.847 | 269.771 | |
| 1.094 | 303.492 | |
| 1.522 | 337.213 |


Table I10. Load-settlement curve data for a 136ft long pile. Note: presented using imperial units.
| δhead | Qhead | Comments: δhead=Pile head movement, Qhead=Pile head load |
| [in] | [tons] | |
| 0.000 | 0.000 | |
| 0.087 | 44.962 | |
| 0.184 | 89.924 | |
| 0.308 | 134.885 | |
| 0.456 | 179.847 | |
| 0.624 | 224.809 | |
| 0.816 | 269.771 | |
| 1.093 | 314.733 | |
| 1.556 | 359.694 | |
| 2.235 | 404.656 | |
| 3.285 | 449.618 |
Method B: TZPILE design calculations with PileAXL input
For ease of use, t-z and Q-w curves that were “Generated by the program” were used. The use of these curves allows for soil layer data to be input instead of t-z and Q-w curves. These data are presented in Step 1. Steps 2 and 3 for Method B are identical to those listed above for Method A. Therefore, these steps are not repeated in this section.
Step 1: Establish soil data
The soil data, as input into the TZPILE software program are presented in Figure I19. The ultimate unit skin resistance and ultimate unit tip resistance for each of the identified layers was obtained from the PileAXL output. As discussed previously in other design example problems, the TZPILE program uses units of inches and pounds, so the output from the PileAXL program were converted from metric units to imperial units prior to input into the TZPILE program. Also, the unit weight profile and undrained shear strength had to be converted from units of lb/ft3 and lb/ft2 to lb/in3 and lb/in2, respectively.
Steps 2 and 3: Determine soil settlement and establish pile data
The soil settlement and pile data used in Method B are the same as those used in Method A. These data, as used in the TZPILE program, are included as Figures I20 and I21. The pile data include axial stiffness.
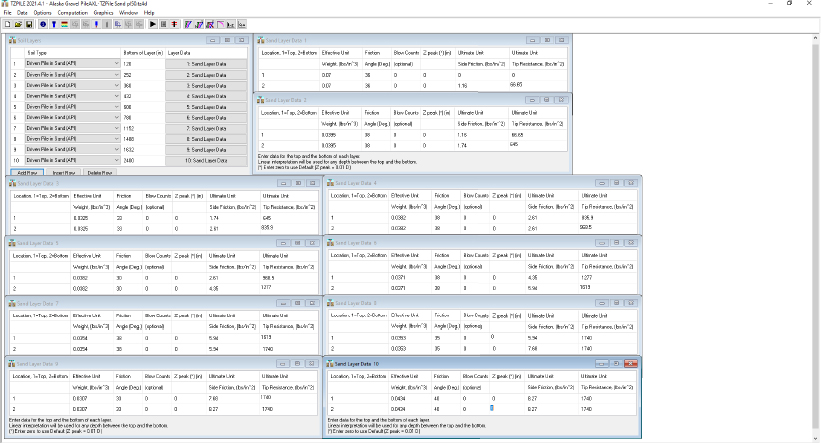
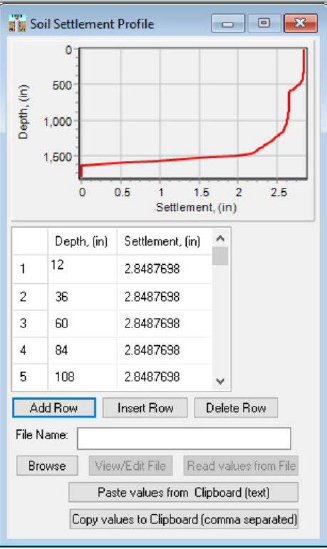
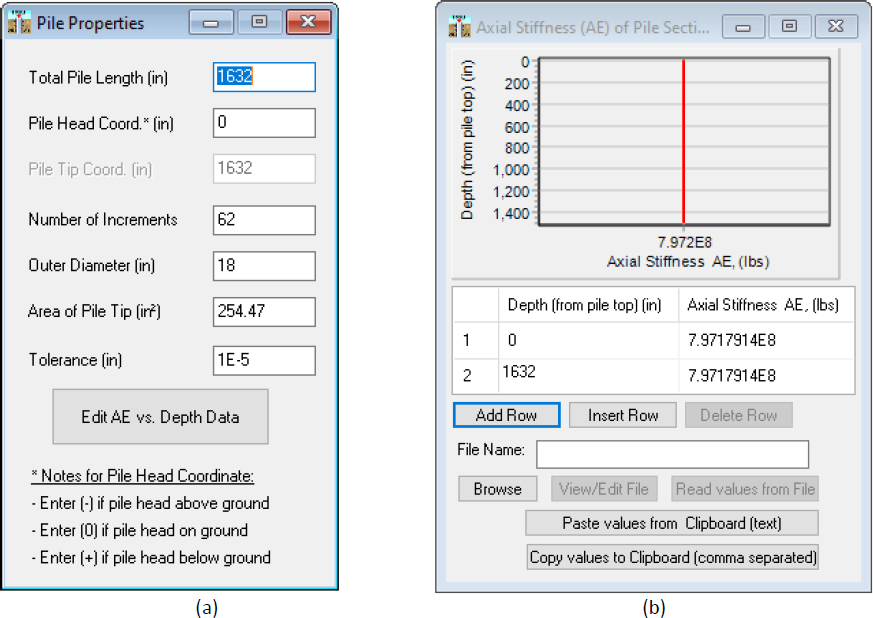
Step 4: Select t-z models and q-z model
As mentioned previously and shown in Figure I19, “Generated by the program” t-z and Q-w curves were used. Specifically, Driven Pile in Sand (API) curves were used for each layer. The selection of using curves that were generated by the program instead of user defined was for ease of use. The use of user defined gravel curves for the gravel layers may be more appropriate; however, no user defined t-z curves specifically for gravel currently exist.
Step 5: Iterate toe movement to obtain unfactored top load
As shown in Figure I22, the toe movement was iterated to obtain the unfactored top load. Specifically, a toe movement of 2.114in resulted in the unfactored top load of 298.5kips. Steps 6 through 8: Develop depth-dependent combined load inpile, identify the location of the neutral plane from thecombined load-resistance curve, and calculate the amount ofdrag load in the pile

The depth-dependent combined load and resistance curve that was developed using the TZPILE program is presented in Figure I23 and reported in Table I11. From Figure I23, the neutral plane occurs at a depth
of 119.0ft. Based on the results, the maximum load in the pile is 514.1 kips, resulting in a drag load of 215.6kips.
Table I11. Results from TZPILE, as obtained by using PileAXL input and additional spreadsheet post-processing calculations.
| z | Min(Q,R) | δp | Comments: z=Depth [ft], Min(Q,R)=Load used to develop combination curve to identify the location of the neutral plane, δp =pile settlement. |
| 1 | 294.1 | 2.887 | |
| 3 | 294.0 | 2.878 | |
| 5 | 293.8 | 2.870 | |
| 7 | 293.7 | 2.861 | |
| 9 | 293.6 | 2.852 | |
| 11 | 293.6 | 2.843 | |
| 13 | 293.8 | 2.834 | |
| 15 | 294.1 | 2.825 | |
| 17 | 294.7 | 2.816 | |
| 19 | 295.5 | 2.808 | |
| 21 | 296.5 | 2.799 | |
| 23 | 297.7 | 2.790 | |
| 25 | 299.2 | 2.781 | |
| 27 | 300.9 | 2.772 | |
| 29 | 302.9 | 2.763 | |
| 31 | 305.0 | 2.753 | |
| 33 | 307.2 | 2.744 | |
| 35 | 309.6 | 2.735 | |
| 37 | 312.2 | 2.726 | |
| 39 | 315.0 | 2.716 | |
| 41 | 317.9 | 2.707 | |
| 43 | 320.7 | 2.697 | |
| 45 | 323.3 | 2.687 | |
| 47 | 325.5 | 2.678 | |
| 49 | 326.5 | 2.668 | |
| 51 | 326.5 | 2.658 | |
| 53 | 326.4 | 2.648 | |
| 55 | 327.0 | 2.638 | |
| 57 | 328.4 | 2.628 | |
| 59 | 330.5 | 2.618 | |
| 61 | 333.2 | 2.608 | |
| 63 | 336.7 | 2.598 | |
| 65 | 340.7 | 2.588 | |
| 67 | 345.3 | 2.578 | |
| 69 | 350.4 | 2.567 | |
| 71 | 355.9 | 2.557 | |
| 73 | 361.8 | 2.546 | |
| 75 | 368.1 | 2.535 | |
| 77 | 374.6 | 2.524 | |
| 79 | 381.3 | 2.512 | |
| 81 | 388.3 | 2.501 | |
| 83 | 395.5 | 2.489 | |
| 85 | 402.8 | 2.477 | |
| 87 | 410.3 | 2.465 | |
| 89 | 418.0 | 2.452 | |
| 91 | 425.7 | 2.440 |
| z | Min(Q,R) | δp | |
| 103 | 473.0 | 2.358 | |
| 105 | 480.4 | 2.344 | |
| 107 | 487.4 | 2.329 | |
| 109 | 494.0 | 2.315 | |
| 111 | 500.1 | 2.300 | |
| 113 | 505.4 | 2.285 | |
| 115 | 509.8 | 2.269 | |
| 117 | 512.9 | 2.254 | |
| 119 | 514.1 | 2.238 | |
| 121 | 513.2 | 2.223 | |
| 123 | 509.9 | 2.208 | |
| 125 | 502.5 | 2.192 | |
| 127 | 491.9 | 2.177 | |
| 129 | 481.2 | 2.163 | |
| 131 | 470.4 | 2.148 | |
| 133 | 459.4 | 2.134 | |
| 135 | 448.4 | 2.121 |
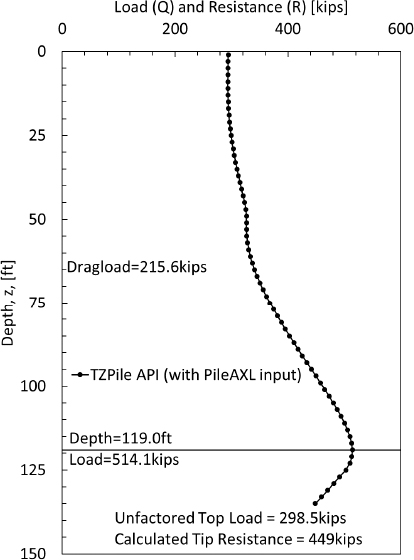
| 93 | 433.6 | 2.427 | |
| 95 | 441.6 | 2.414 | |
| 97 | 449.6 | 2.400 | |
| 99 | 457.6 | 2.386 | |
| 101 | 465.4 | 2.373 |
Step 9: Calculate the geotechnical resistance of the pile
The geotechnical resistance was determined in TZPILE by repeating Step 5 of the Method B flowchart. For these analyses, the soil settlement was neglected by turning off the Include Down-Drag (negative Skin Friction) toggle within TZPILE (Figure I24) and by also selecting the Load Method as User-Specified Tip Movements (Figure I25). Specifically, multiple tip movements (Figure I26) were evaluated to develop a load-settlement curve (Figure I27 and Table I12). This curve represents the pile head axial load and the pile head settlement. Two specific tip movements were included during the creation of the load-settlement curve; tip movements corresponding with a tip movement of 0.0138in, which was calculated when the unfactored design load (298.5kips) was obtained at the top of the pile, and a tip movement of 0.05B (0.9in). The geotechnical resistance was identified as 573kips and the pile head movement required to mobilize the geotechnical resistance was 0.95in.

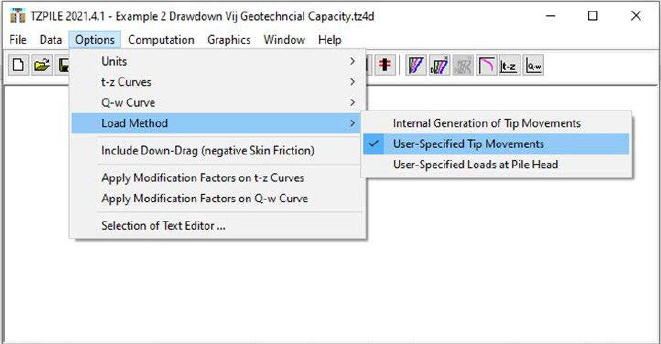

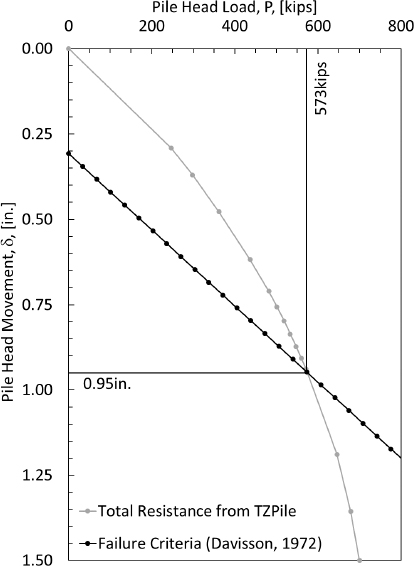
Table I12. TZPILE obtained load-settlement curve.
| Pile Head Load, P, [kips] | Pile Head Movement, δ [in.] |
| 0.0 | 0.000 |
| 246.7 | 0.291 |
| 298.0 | 0.370 |
| 361.9 | 0.478 |
| 436.8 | 0.618 |
| 481.6 | 0.710 |
| 501.1 | 0.756 |
| 518.1 | 0.797 |
| 533.4 | 0.836 |
| 547.3 | 0.872 |
| 559.9 | 0.907 |
| 571.3 | 0.939 |
| 645.8 | 1.189 |
| 678.8 | 1.357 |
| 700.0 | 1.500 |
| 721.2 | 1.643 |
| 742.4 | 1.787 |
| 763.6 | 1.930 |
| 780.7 | 2.065 |
| 792.6 | 2.190 |
Step 10: Identify the location and settlement of the neutral plane (from the soil settlement-pilesettlement curve)
The amount of elastic compression within the pile was automatically calculated in the TZPILE software program. These automatically generated values simplify efforts compared to the hand calculation that
was presented in Design Example 1. Just like Design Example 1, the TZPILE elastic compression calculations are based on the amount of calculated load within the pile at each incremental depth. The calculated soil settlements were tabulated and shown previously in Table I6 and Figure I20. From Figure I28, the neutral plane that was obtained from the soil settlement-pile settlement curves was at a depth of 119.0ft. The amount of settlement of the neutral plane (downdrag) for Event 1 was 2.238in.
Step 11: Perform limit state checks
Limit state checks were performed to determine if the pile size was suitable for the design loads. For the structural strength limit state, the determined drag load associated with Event 1 (215.6kips) was multiplied by the drag load factor (γDR=1.1) to obtained a factored load of drag load 237.2kips. The unfactored top load (298.5kips) placed on the top of the pile was multiplied by the deadload factor (γD=1.25) to obtained a factored deadload of 373.1. The combined total factored load was 610 kips. The yield stress for the steel pile pile was assumed to be 45ksi resulting in a factored structural stress of 40.5ksi (0.9*45ksi) and a factored structural strength of 1113kips when the stress was multiplied by the cross-sectional area of the pile wall (27.5in2). If Grade 3 A-252 pipe piles were used then the pile is adequately sized because the factored structural strength (1113kips) was determined to be greater than the combined total factored load (610kips).
Serviceability issues associated with the large ground surface movements (2.848in), large pile head movements (2.887in), and large pile toe movements (2.121in) for Event 1 (amax=0.3,Mw=6.2) are of concern. The geometry of the pile should be modified to prevent these large movements. It is suggested that the pile be lengthened to provide more positive side resistance below the depth of the neutral plane. Ground improvement techniques that will limit the amount of ground surface settlement are also recommended.
Conclusion:
The PileAXL and TZPILE programs were used in conjunction to determine the amount of drag load and downdrag resulting from a hypothetical post-liquefaction recompression in a gravel deposit at the Tok River bridge site in Alaska. The amount of soil settlement resulting from the post-liquefaction recompression was determined by using the Rollins et al. (2022), Kayen et al. (2013), and Boulanger and Idriss (2008) procedures. The calculated soil settlement profile and the obtained unit side resistance and unit end bearing values from the PileAXL program were used to identify the location of the neutral plane using the NCHRP12-116A Method A approach. The neutral plane locations obtained from the load-resistance curve and the pile-soil settlement curve in the PileAXL Method A approach were not within the required 5 foot difference. Therefore, the NCHRP12-116A Method B approach was evaluated using the TZPILE

software program. Based on the TZPILE analysis, the 18-inch diameter by 136-foot long piles that were modeled were able to provide adequate geotechnical resistance and were structurally competent to withstand the predicted drag load. However, the amount of downdrag was excessive and longer piles and/or ground improvement techniques should be evaluated. The amounts of drag load and downdrag reported in Hemstreet (2014) and determined herein were significantly different. These differences were attributed to the differences in the amount of unfactored load that was modeled at the top of the pile and due to different pile lengths being considered.
References
Andrus, R.D., Hayati, H., and Mohanan, N.P. (2009). “Correcting Liquefaction Resistance for Aged Sands Using Measured to Estimated Velocity Ratio.” Journal of Geotechnical and Geoenvironmental Engineering, 135(6), 735-744.
Bong, T., and Stuedlein, A.W. (2018). “Effect of Cone Penetration Conditioning on Random Field Model Parameters and Impact of Spatial Variability on Liquefaction-induced Differential Settlements.” Journal of Geotechnical and Geoenvironmental Engineering, 144(5), 04018018.
Boulanger, R.W., and Idriss, I.M. (2014). “CPT and SPT based liquefaction triggering procedures.” Report No. UCD/CGM.-14, University of California, Davis, California.
Cary, J.R., Stuedlein, A.W., McGann, C.R., Bradley, B.A., and Maurer, B.W. (2022). “Effect of Refinements to CPT-Based Liquefaction Triggering Analysis on Liquefaction Severity Indices at the Avondale Playground Site, Christchurch, NZ.” Proceedings, PBDIV, Fourth Conference on Performance-based Design in Earthquake Geotechnical Engineering, Beijing, China, Springer, pp. 1454-1466.
Coduto, D.P., Kitch, W.A., and Yeung, M.R. (2016). Foundation Design :Principles and Practices, 3rd ed. Pearson Education Inc. 960 pgs.
Dadashiserej, A., Jana, A., Ortiz, S.C., Walters, J.J., Stuedlein, A.W., and Evans, T.M. (2022). “Monotonic, Cyclic, and Post-Cyclic Response of Willamette River Silt at the Van Buren Bridge.” Geotechnical Special Publication No. 334, Proceedings, Geo-Congress 2022: 431–443.ASCE.
Duku, P.M., Stewart, J.P., Whang, D.H., and Yee, E. (2008). “Volumetric Strains of Clean Sands Subject to Cyclic Loads.” Journal of Geotechnical and Geoenvironmental Engineering, 134(8), 1073–1085.
Ensoft. (2021). “TZPILE v. 2021”. Software Program.
Hemstreet, David, A. (2014). “Final Structural Foundation Engineering Report. Tok River Bridge No. 0663” August.
Hossain, A.M., Andrus, R.D., and Camp III, W.M. (2013). “Correcting liquefaction resistance of unsaturated soil using wave velocity.” Journal of Geotechnical and Geoenvironmental Engineering, 139(2), 277-287.
Idriss, I.M., and Boulanger, R.W. (2008). “Soil liquefaction during earthquakes.” Monograph MNO-12, Earthquake Engineering Research Institute, Oakland, CA, 261 pp.
Innovative Geotechnics Pty Ltd. (2023). “PileAXL 2.4: A Program for Single Piles Under Axial Loading.” Software Program.
Ishihara, K., and Yoshimine, M. (1992). “Evaluation of settlements in sand deposits following liquefaction during earthquakes.” Soils and Foundations, 32(1), 173-188.
Jana, A., and Stuedlein, A.W. (2021). “Monotonic, Cyclic, and Post-Cyclic Responses of an Alluvial Plastic Silt Deposit.” Journal of Geotechnical and Geoenvironmental Engineering 147 (3): 04020174.
Lee, K.L., and Albaisa, A. (1974). “Earthquake induced settlements in saturated sands.” Journal of the Geotechnical Engineering Division, 100(4), 387-406.
Robertson, P.K., and Cabal, K.L. (2015). Guide to Cone Penetration Testing for Geotechnical Engineering, 6th ed. Gregg Drilling & Testing, Inc.
Seed, H.B., and Idriss, I.M. (1971). “Simplified procedure for evaluating soil liquefaction potential.” Journal of the Soil Mechanics and Foundations Division, 97(9), 1249-1273.
Stewart, J.P., Smith, P.M., and Whang, D.H. (2002). “Documentation and analysis of field case histories of seismic compression during the 1994 Northridge, California earthquake.” Report No. PEER 2002/09, Pacific Earthquake Engineering Research Center, University of California, Berkeley, California, 246 pp.
Stuedlein, A.W., Dadashiserej, A., Jana, A., and Evans, T.M. (2023). “Liquefaction Susceptibility and Cyclic Response of Intact Nonplastic and Plastic Silts.” Journal of Geotechnical and Geoenvironmental Engineering 149 (1): 04022125.
Yoshimine, M., Nishizaki, H., Amano, K., and Hosono, Y. (2006). “Flow Deformation of Liquefied Sand Under Constant Shear Load and Its Application to Analysis of Flow Slide of Infinite Slope.” Soil Dynamics and Earthquake Engineering 26 (2-4): 253–264.
Zhang, G., Robertson, P.K., and Brachman, R.W. (2002). “Estimating Liquefaction-Induced Ground Settlements from CPT for Level Ground.” Canadian Geotechnical Journal 39 (5): 1168–1180.


