Pile Design for Downdrag: Examples and Supporting Materials (2024)
Chapter: Appendix H: Design Example 6 - Liquefaction in Sand (Pipe Pile) Using ALLCPT and TZPILE
APPENDIX H
Design Example 6 — Liquefaction in Sand (Pipe Pile) Using ALLCPT and TZPILE
In Design Example 5, the amount of downdrag, drag load, pile settlement, and soil settlement for an H-pile within a liquefiable soil deposit were determined. In this design example (Design Example 6), the amount of amount of downdrag, drag load, pile settlement and soil settlement for a pipe pile within the same liquefiable soil deposit were examined. This pipe pile design case is presented because the load development can be different for a pipe pile than for a H-pile.
The Innovative Geotechnics (2023) ALLCPT program was used for this design example and the results from the program are presented herein. The results from the Innovative Geotechnics (2023) ALLCPT program are for a fully-mobilized condition like those required for using Method A suggested by the NCHRP-12-116A project team. The obtained unit side resistance and unit end bearing output from the ALLCPT program were used as input in the Ensoft (2021) TZPILE program to perform a partially-mobilized analysis (Method B suggested by the NCHRP 12-116A project team). Using the TZPILE program, the influence of soil settlement was considered during pile load and pile settlement calculations. The flowcharts and steps for Method A and Method B that were followed during this design example are included herein. The Method A approach is presented first, followed by the Method B approach.
Step 1: Establish soil data
The same CPT data and interpreted soil profile that were used in Design Example 5 were reused in Design Example 6. The CPT data are presented in Figure H1 and Table H1.

Step 2: Determine soil settlement
The soil settlement profiles for Events 1 and 2, with a peak ground acceleration of 0.1g and a moment magnitude of 6.5 (PGA =0.1g, Mw=6.5) for Event 1 and PGA=0.4g and Mw=7.7 for Event 2, are presented in Figure H2 and tabulated in Table H2. Moreover, the procedures for determining post-liquefaction reconsolidation settlement and the soil settlement profile that were used in Design Example 5 were reused for Design Example 6.
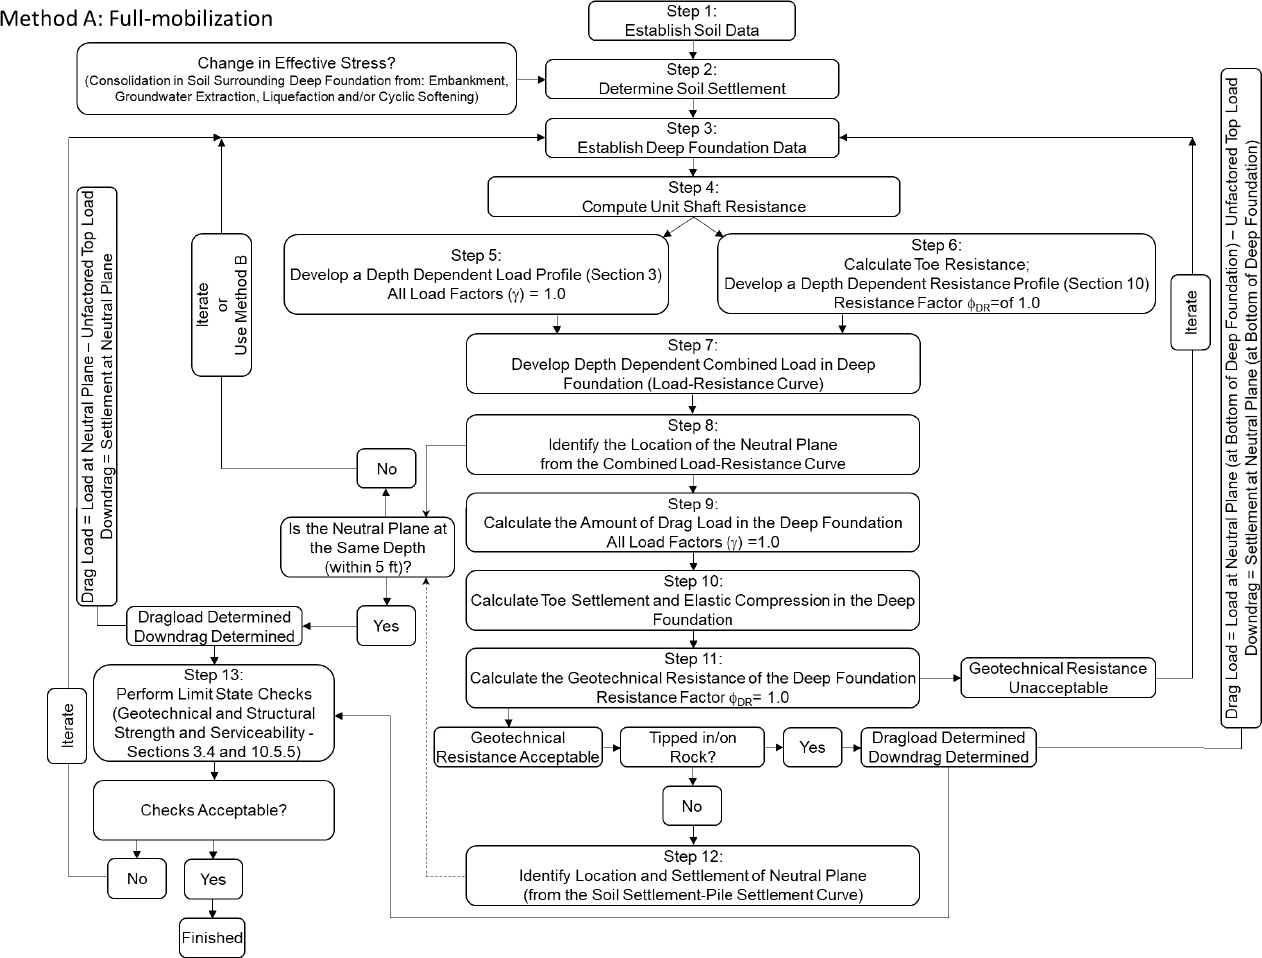
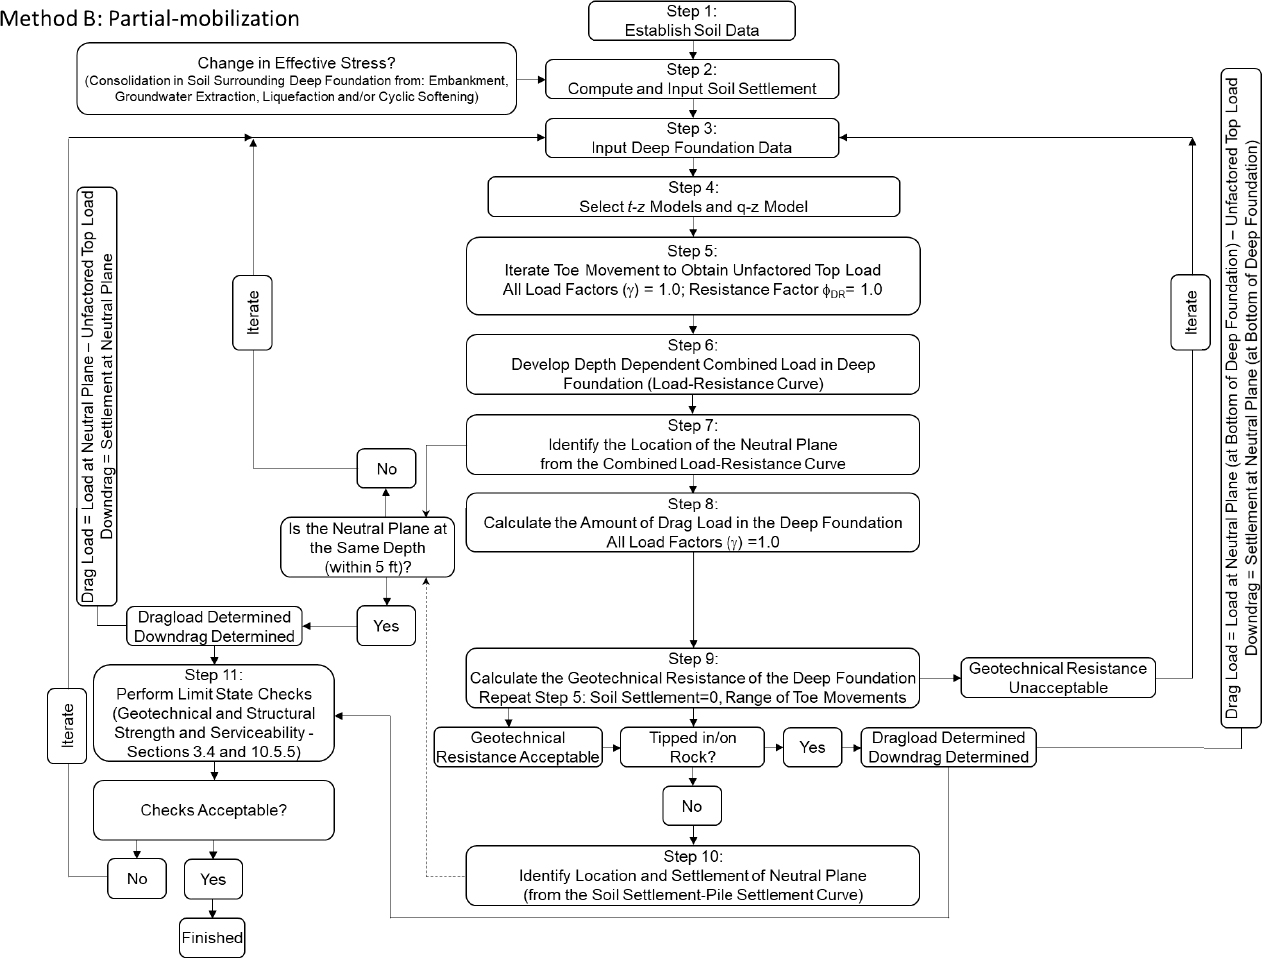
Table H1. Average CPT sounding record for the Blytheville, AR Test Site.
| z | fs | qt | u2 | Comments: z=Depth [ft], fs=Sleeve friction [tsf], qt=Tip resistance [tsf], u2=Pore pressure [psi] Values collected every |
| 0.163 | 0.163 | 5.990 | -0.080 | |
| 1.148 | 0.343 | 6.644 | -4.346 | |
| 2.133 | 0.321 | 5.024 | -3.507 | |
| 3.117 | 0.232 | 30.509 | -0.474 | |
| 4.101 | 0.283 | 8.452 | 0.052 | |
| 5.085 | 0.259 | 3.602 | 1.817 | |
| 6.070 | 0.279 | 4.583 | 2.308 | |
| 7.054 | 0.321 | 5.619 | 3.310 | |
| 8.038 | 0.314 | 7.221 | 3.799 | |
| 9.022 | 0.178 | 4.880 | 4.400 | |
| 10.007 | 0.153 | 26.554 | 4.783 | |
| 10.991 | 0.283 | 55.585 | 4.052 | |
| 11.975 | 0.380 | 57.579 | 3.349 | |
| 12.959 | 0.299 | 41.164 | 3.934 | |
| 13.944 | 0.332 | 44.718 | 1.888 | |
| 14.928 | 0.412 | 80.277 | 0.862 | |
| 15.912 | 0.485 | 99.291 | 1.548 | |
| 16.896 | 0.549 | 102.243 | 3.270 | |
| 17.881 | 0.435 | 82.030 | 3.717 | |
| 18.865 | 0.413 | 81.470 | 3.345 | |
| 19.849 | 0.259 | 50.410 | 3.707 | |
| 20.833 | 0.233 | 30.238 | 3.041 | |
| 21.818 | 0.294 | 56.976 | 4.014 | |
| 22.802 | 0.274 | 48.270 | 7.523 | |
| 23.786 | 0.306 | 58.057 | 7.823 | |
| 24.770 | 0.316 | 59.929 | 8.438 | |
| 25.755 | 0.303 | 59.692 | 9.553 | |
| 26.739 | 0.271 | 53.975 | 11.429 | |
| 27.723 | 0.290 | 60.599 | 11.954 | |
| 28.707 | 0.307 | 68.630 | 12.150 | |
| 29.692 | 0.328 | 76.193 | 13.576 | |
| 30.676 | 0.350 | 86.086 | 13.470 | |
| 31.660 | 0.336 | 89.231 | 14.176 | |
| 32.644 | 0.419 | 98.042 | 15.180 | |
| 33.629 | 0.396 | 96.314 | 15.467 | |
| 34.613 | 0.372 | 107.343 | 15.953 | |
| 35.597 | 0.410 | 113.077 | 16.297 | |
| 36.581 | 0.508 | 143.899 | 16.744 | |
| 37.566 | 0.666 | 185.609 | 16.821 | |
| 38.550 | 0.608 | 179.809 | 17.287 | |
| 39.561 | 0.656 | 185.487 | 17.292 | |
| 40.546 | 0.840 | 206.957 | 17.771 | |
| 41.530 | 0.866 | 205.632 | 16.569 | |
| 42.569 | 0.925 | 210.830 | 18.586 | |
| 43.553 | 0.995 | 232.122 | 18.903 | |
| 44.537 | 1.028 | 245.359 | 19.529 | |
| 45.549 | 1.077 | 259.473 | 19.777 | |
| 46.533 | 1.035 | 227.953 | 20.100 | |
| 47.517 | 1.000 | 211.495 | 20.318 | |
| 48.529 | 0.967 | 220.913 | 20.881 | |
| 49.513 | 1.070 | 253.789 | 20.833 | |
| 50.498 | 0.895 | 268.331 | 21.315 | |
| 51.482 | 0.757 | 256.276 | 21.870 | |
| 52.466 | 0.680 | 247.751 | 22.581 |
| z | fs | qt | u2 | Comments: See definition of variables on previous page. |
| 53.450 | 0.717 | 240.933 | 22.914 | |
| 54.435 | 0.653 | 219.256 | 23.600 | |
| 55.474 | 0.648 | 245.683 | 24.005 | |
| 56.458 | 0.688 | 250.659 | 24.232 | |
| 57.442 | 0.767 | 245.872 | 24.346 | |
| 58.481 | 0.847 | 268.145 | 25.168 | |
| 59.465 | 1.130 | 329.023 | 25.588 | |
| 60.449 | 1.317 | 379.164 | 25.735 | |
| 61.488 | 1.457 | 392.789 | 24.920 | |
| 62.473 | 1.366 | 378.497 | 26.585 | |
| 63.457 | 1.462 | 393.080 | 26.816 | |
| 64.469 | 1.218 | 375.347 | 27.283 | |
| 65.518 | 1.017 | 343.502 | 27.677 | |
| 66.503 | 1.156 | 355.590 | 28.325 | |
| 67.626 | 1.355 | 342.052 | 29.154 | |
| 68.611 | 0.844 | 311.256 | 29.417 | |
| 69.595 | 0.687 | 298.517 | 29.799 | |
| 70.579 | 0.727 | 290.580 | 30.460 | |
| 71.563 | 0.842 | 289.159 | 30.683 | |
| 72.548 | 0.729 | 249.830 | 31.720 | |
| 73.710 | 0.863 | 273.813 | 31.332 | |
| 74.694 | 0.901 | 348.687 | 31.865 | |
| 75.678 | 1.635 | 376.848 | 31.968 | |
| 77.018 | 0.980 | 322.823 | 32.031 | |
| 78.002 | 0.885 | 260.040 | 28.425 | |
| 78.986 | 1.091 | 375.017 | 32.978 | |
| 79.970 | 0.986 | 345.087 | 32.455 | |
| 80.955 | 0.788 | 374.134 | 33.192 | |
| 81.939 | 1.274 | 374.530 | 34.805 | |
| 82.923 | 1.856 | 404.210 | 33.297 | |
| 83.661 | 1.557 | 351.657 | 29.414 |
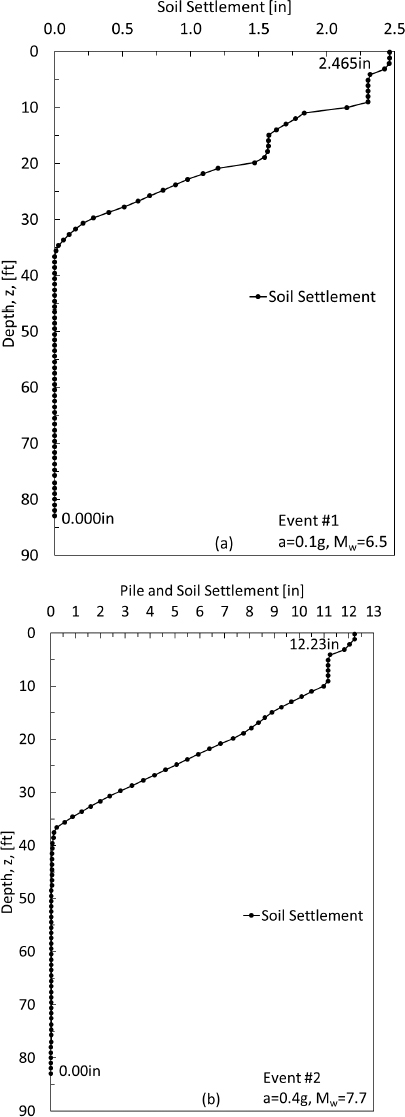
Table H2. Results from Yoshimine et at. (2006) and Idriss and Boulanger (2008) calculations.
| Event 1 | Event 2 | Comments: For Event #1 amax=0.1, Mw=6.5, For Event #2 amax=0.4, Mw=7.7, z=Depth [ft], δ = ∆s = Incremental soil settlement [in], Σδ = s1D = Cumulative soil settlement from bottom of soil profile top of soil profile [in]. Values collected every ∆z=0.164ft but reported herein every ∆z=0.984ft (except for first and last values). | |||
| z | δ | Σδ | δ | Σδ | |
| 0.163 | 0.00 | 2.46 | 0.00 | 12.23 | |
| 1.148 | 0.00 | 2.46 | 0.20 | 12.23 | |
| 2.133 | 0.00 | 2.46 | 0.21 | 12.03 | |
| 3.117 | 0.03 | 2.43 | 0.57 | 11.82 | |
| 4.101 | 0.02 | 2.32 | 0.09 | 11.25 | |
| 5.085 | 0.00 | 2.30 | 0.00 | 11.16 | |
| 6.070 | 0.00 | 2.30 | 0.00 | 11.16 | |
| 7.054 | 0.00 | 2.30 | 0.00 | 11.16 | |
| 8.038 | 0.00 | 2.30 | 0.00 | 11.16 | |
| 9.022 | 0.00 | 2.30 | 0.17 | 11.16 | |
| 10.007 | 0.08 | 2.15 | 0.49 | 10.99 | |
| 10.991 | 0.01 | 1.84 | 0.40 | 10.50 | |
| 11.975 | 0.01 | 1.77 | 0.41 | 10.10 | |
| 12.959 | 0.01 | 1.70 | 0.40 | 9.69 | |
| 13.944 | 0.01 | 1.63 | 0.38 | 9.29 | |
| 14.928 | 0.00 | 1.58 | 0.29 | 8.91 | |
| 15.912 | 0.00 | 1.57 | 0.26 | 8.62 | |
| 16.896 | 0.00 | 1.57 | 0.29 | 8.36 | |
| 17.881 | 0.00 | 1.57 | 0.32 | 8.07 | |
| 18.865 | 0.01 | 1.54 | 0.41 | 7.75 | |
| 19.849 | 0.02 | 1.47 | 0.50 | 7.34 | |
| 20.833 | 0.01 | 1.20 | 0.45 | 6.84 | |
| 21.818 | 0.02 | 1.09 | 0.45 | 6.39 | |
| 22.802 | 0.01 | 0.98 | 0.44 | 5.94 | |
| 23.786 | 0.02 | 0.89 | 0.44 | 5.50 | |
| 24.770 | 0.02 | 0.80 | 0.44 | 5.06 | |
| 25.755 | 0.02 | 0.70 | 0.44 | 4.62 | |
| 26.739 | 0.02 | 0.61 | 0.45 | 4.18 | |
| 27.723 | 0.02 | 0.51 | 0.46 | 3.73 | |
| 28.707 | 0.02 | 0.40 | 0.46 | 3.27 | |
| 29.692 | 0.01 | 0.28 | 0.43 | 2.81 | |
| 30.676 | 0.01 | 0.21 | 0.39 | 2.38 | |
| 31.660 | 0.01 | 0.15 | 0.38 | 1.99 | |
| 32.644 | 0.01 | 0.11 | 0.37 | 1.61 | |
| 33.629 | 0.01 | 0.07 | 0.36 | 1.24 | |
| 34.613 | 0.00 | 0.03 | 0.32 | 0.88 | |
| 35.597 | 0.00 | 0.01 | 0.31 | 0.56 | |
| 36.581 | 0.00 | 0.00 | 0.12 | 0.25 | |
| 37.566 | 0.00 | 0.00 | 0.02 | 0.13 | |
| 38.550 | 0.00 | 0.00 | 0.04 | 0.11 | |
| 39.561 | 0.00 | 0.00 | 0.01 | 0.07 | |
| 40.546 | 0.00 | 0.00 | 0.01 | 0.06 | |
| 41.530 | 0.00 | 0.00 | 0.00 | 0.05 | |
| 42.569 | 0.00 | 0.00 | 0.00 | 0.05 | |
| 43.553 | 0.00 | 0.00 | 0.00 | 0.05 | |
| 44.537 | 0.00 | 0.00 | 0.00 | 0.05 | |
| 45.549 | 0.00 | 0.00 | 0.00 | 0.05 | |
| 46.533 | 0.00 | 0.00 | 0.00 | 0.05 | |
| 47.517 | 0.00 | 0.00 | 0.03 | 0.05 | |
| 48.529 | 0.00 | 0.00 | 0.00 | 0.02 | |
| 49.513 | 0.00 | 0.00 | 0.00 | 0.02 | |
| Event 1 | Event 2 | Comments: See definition of variables on previous page. Values collected every 0.164ft but reported herein every 0.984ft (except for first and last values). | |||
| z | δ | Σδ | δ | Σδ | |
| 50.498 | 0.00 | 0.00 | 0.00 | 0.02 | |
| 51.482 | 0.00 | 0.00 | 0.00 | 0.02 | |
| 52.466 | 0.00 | 0.00 | 0.00 | 0.02 | |
| 53.450 | 0.00 | 0.00 | 0.00 | 0.02 | |
| 54.435 | 0.00 | 0.00 | 0.00 | 0.02 | |
| 55.474 | 0.00 | 0.00 | 0.00 | 0.02 | |
| 56.458 | 0.00 | 0.00 | 0.00 | 0.02 | |
| 57.442 | 0.00 | 0.00 | 0.00 | 0.02 | |
| 58.481 | 0.00 | 0.00 | 0.00 | 0.02 | |
| 59.465 | 0.00 | 0.00 | 0.00 | 0.02 | |
| 60.449 | 0.00 | 0.00 | 0.00 | 0.02 | |
| 61.488 | 0.00 | 0.00 | 0.00 | 0.02 | |
| 62.473 | 0.00 | 0.00 | 0.00 | 0.02 | |
| 63.457 | 0.00 | 0.00 | 0.00 | 0.02 | |
| 64.469 | 0.00 | 0.00 | 0.00 | 0.02 | |
| 65.518 | 0.00 | 0.00 | 0.00 | 0.02 | |
| 66.503 | 0.00 | 0.00 | 0.00 | 0.02 | |
| 67.626 | 0.00 | 0.00 | 0.00 | 0.02 | |
| 68.611 | 0.00 | 0.00 | 0.00 | 0.02 | |
| 69.595 | 0.00 | 0.00 | 0.00 | 0.02 | |
| 70.579 | 0.00 | 0.00 | 0.00 | 0.02 | |
| 71.563 | 0.00 | 0.00 | 0.00 | 0.02 | |
| 72.548 | 0.00 | 0.00 | 0.00 | 0.02 | |
| 73.710 | 0.00 | 0.00 | 0.00 | 0.02 | |
| 74.694 | 0.00 | 0.00 | 0.00 | 0.02 | |
| 75.678 | 0.00 | 0.00 | 0.00 | 0.02 | |
| 77.018 | 0.00 | 0.00 | 0.02 | 0.02 | |
| 78.002 | 0.00 | 0.00 | 0.00 | 0.00 | |
| 78.986 | 0.00 | 0.00 | 0.00 | 0.00 | |
| 79.970 | 0.00 | 0.00 | 0.00 | 0.00 | |
| 80.955 | 0.00 | 0.00 | 0.00 | 0.00 | |
| 81.939 | 0.00 | 0.00 | 0.00 | 0.00 | |
| 82.923 | 0.00 | 0.00 | 0.00 | 0.00 | |
| 83.661 | 0.00 | 0.00 | 0.00 | 0.02 | |
Step 3: Establish pile data
The input parameters for the Bustamante and Gianeselli (1982) LCPC analysis, performed within the ALLCPT program, are provided in Figures H3 and H4. These parameters are similar to the parameters used in the ALLCPT program for Design Example 5 but are used for a 21.64m long pipe pile instead of a 26.67m long H-pile. The input length, diameter, and wall thickness for the closed-ended pipe pile were 71ft, 18in, and 0.5in, respectively. Because the ALLCPT program only accepts metric units, the length, diameter, and wall thickness for the closed-ended pipe pile are 21.64m, 0.457m, and 0.013m, respectively. As with Design Example 5, the factors of safety were set to unity. The default values for dimensionless flexibility factor and effective length coefficient were also used. The soil stiffness at the pile base was changed to 106400kPa based upon the value reported in row 430 (pile toe) of the ALLCPT correlated soil parameters (106.438MPa). The concrete-filled steel shell pile elastic modulus was set to 20684280kPa (30000ksi).
Step 4: Compute Incremental Side Resistance
The output from the ALLCPT Pile Capacity Analysis Tool included program output data to determine the load and resistance in the pile (Figures H5 and H6; Table H3). The reported values of ∆Q in Table H3 are the incremental side resistance values.
Step 5: Develop a depth-dependent load profile
The loads in the pile (QwUTL), as a function of depth, are presented in Table H3. The cumulative load, as a function of depth, was obtained by adding the incremental side resistance from the top of the pile to the bottom of the pile. The unfactored top load was also added to all of the obtained depth-dependent load values.
Step 6: Calculate end bearing resistance; develop a depth depended resistance profile
The resistances in the pile (R), as a function of depth, are also presented in Table H3. The cumulative resistance, as a function of depth, was obtained by adding the incremental side resistance from the bottom of the pile to the top of the pile. The end bearing at the pile toe (Qb=206.465tons at a depth of 71.063ft) was also added to all of the obtained depth-dependent resistance values.
Step 7: Develop the depth-dependent combined load profile
The load-resistance curve was developed by plotting the minimum load (QwUTL) or resistance (R) values at a given depth as a function of depth. The combined load-resistance curve is presented in Figure H7.
As observed in Figure H7, the maximum value of this curve was 279.8 tons. This value corresponds with the maximum load in the pile.
Step 8: Identify the location of the neutral plane
The location of the neutral plane is also identified in Figure H7. The location of the neutral plane occurs at the same location of maximum load in the pile that was mentioned in Step 7. The location of the neutral plane was identified at a depth of 58.8ft.
Step 9: Calculate the amount of drag load in the pile
As shown in Figure H7, a drag load of 172.8 tons was calculated. This drag load was calculated by subtracting the unfactored top load (107 tons) from the maximum load in the pile (279.8 tons).


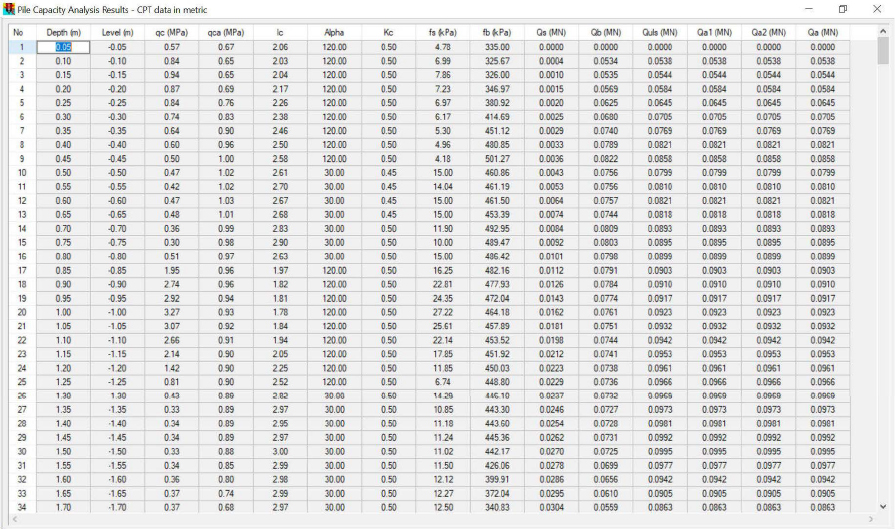
Table H3. Results from ALLCPT Pile Capacity Analysis and calculations (reported in imperial units).
| z | Qs | Qb | ∆Qs | QwUTL | R | Min(Q,R) | δEC | Σδ | Comments: z=Depth [ft], Qs=Summation of side resistance from ALLCPT pile capacity analysis [tons], Qb=End resistance from ALLCPT pile capacity analysis [tons], ∆Q=Incremental side resistance [tons], QwUTL=Load in pile with unfactored top load [tons], R=Resistance in pile [tons], Min(Q,R)=Load [tons] used to develop combination curve to identify the location of the neutral plane. δEC=incremental elastic compression in pile [in], Σδ=pile settlement [in], Values calculated every ∆z=0.164ft but reported herein every ∆z=0.984ft (except for first and last values). |
| 0.164 | 0.000 | 0.000 | 0.000 | 107.000 | 451.652 | 107.000 | 0.00051 | 0.399 | |
| 1.148 | 0.326 | 8.329 | 0.045 | 107.326 | 451.371 | 107.326 | 0.00051 | 0.396 | |
| 2.133 | 0.832 | 8.363 | 0.112 | 107.832 | 450.933 | 107.832 | 0.00051 | 0.393 | |
| 3.117 | 1.607 | 8.711 | 0.191 | 108.607 | 450.236 | 108.607 | 0.00052 | 0.390 | |
| 4.101 | 2.574 | 8.284 | 0.067 | 109.574 | 449.146 | 109.574 | 0.00052 | 0.387 | |
| 5.085 | 3.125 | 7.857 | 0.090 | 110.125 | 448.617 | 110.125 | 0.00053 | 0.384 | |
| 6.070 | 3.766 | 5.204 | 0.124 | 110.766 | 448.011 | 110.766 | 0.00053 | 0.381 | |
| 7.054 | 4.474 | 5.216 | 0.124 | 111.474 | 447.302 | 111.474 | 0.00053 | 0.378 | |
| 8.038 | 5.204 | 8.273 | 0.124 | 112.204 | 446.572 | 112.204 | 0.00054 | 0.374 | |
| 9.022 | 5.924 | 13.275 | 0.112 | 112.924 | 445.841 | 112.924 | 0.00054 | 0.371 | |
| 10.007 | 6.666 | 22.672 | 0.157 | 113.666 | 445.144 | 113.666 | 0.00054 | 0.368 | |
| 10.991 | 8.048 | 31.406 | 0.214 | 115.048 | 443.818 | 115.048 | 0.00055 | 0.365 | |
| 11.975 | 9.442 | 40.735 | 0.225 | 116.442 | 442.435 | 116.442 | 0.00056 | 0.361 | |
| 12.959 | 10.937 | 48.177 | 0.270 | 117.937 | 440.985 | 117.937 | 0.00056 | 0.358 | |
| 13.944 | 12.511 | 56.124 | 0.281 | 119.511 | 439.423 | 119.511 | 0.00057 | 0.355 | |
| 14.928 | 14.039 | 64.026 | 0.303 | 121.039 | 437.917 | 121.039 | 0.00058 | 0.351 | |
| 15.912 | 16.153 | 70.702 | 0.382 | 123.153 | 435.882 | 123.153 | 0.00059 | 0.348 | |
| 16.896 | 18.513 | 72.613 | 0.393 | 125.513 | 433.533 | 125.513 | 0.00060 | 0.344 | |
| 17.881 | 20.682 | 69.443 | 0.326 | 127.682 | 431.296 | 127.682 | 0.00061 | 0.340 | |
| 18.865 | 22.661 | 61.407 | 0.337 | 129.661 | 429.329 | 129.661 | 0.00062 | 0.337 | |
| 19.849 | 24.156 | 52.853 | 0.247 | 131.156 | 427.744 | 131.156 | 0.00063 | 0.333 | |
| 20.833 | 25.684 | 46.727 | 0.225 | 132.684 | 426.193 | 132.684 | 0.00063 | 0.329 | |
| 21.818 | 27.000 | 44.512 | 0.225 | 134.000 | 424.878 | 134.000 | 0.00064 | 0.325 | |
| 22.802 | 28.405 | 44.714 | 0.281 | 135.405 | 423.529 | 135.405 | 0.00065 | 0.322 | |
| 23.786 | 30.001 | 47.716 | 0.214 | 137.001 | 421.865 | 137.001 | 0.00065 | 0.318 | |
| 24.770 | 31.383 | 50.031 | 0.225 | 138.383 | 420.494 | 138.383 | 0.00066 | 0.314 | |
| 25.755 | 32.788 | 51.965 | 0.236 | 139.788 | 419.100 | 139.788 | 0.00067 | 0.310 | |
| 26.739 | 34.160 | 54.089 | 0.247 | 141.160 | 417.740 | 141.160 | 0.00067 | 0.306 | |
| 27.723 | 35.542 | 57.506 | 0.236 | 142.542 | 416.346 | 142.542 | 0.00068 | 0.302 | |
| 28.707 | 37.026 | 61.879 | 0.259 | 144.026 | 414.885 | 144.026 | 0.00069 | 0.297 | |
| 29.692 | 38.667 | 67.162 | 0.292 | 145.667 | 413.278 | 145.667 | 0.00070 | 0.293 | |
| 30.676 | 40.522 | 72.962 | 0.337 | 147.522 | 411.468 | 147.522 | 0.00070 | 0.289 | |
| 31.660 | 42.568 | 78.739 | 0.348 | 149.568 | 409.433 | 149.568 | 0.00071 | 0.285 | |
| 32.644 | 44.748 | 84.719 | 0.371 | 151.748 | 407.275 | 151.748 | 0.00072 | 0.281 | |
| 33.629 | 46.996 | 92.554 | 0.371 | 153.996 | 405.027 | 153.996 | 0.00074 | 0.276 | |
| 34.613 | 49.346 | 103.176 | 0.405 | 156.346 | 402.712 | 156.346 | 0.00075 | 0.272 | |
| 35.597 | 51.976 | 92.914 | 0.438 | 158.976 | 400.115 | 158.976 | 0.00076 | 0.267 | |
| 36.581 | 54.876 | 105.177 | 0.540 | 161.876 | 397.316 | 161.876 | 0.00077 | 0.263 | |
| 37.566 | 58.889 | 117.485 | 0.719 | 165.889 | 393.483 | 165.889 | 0.00079 | 0.258 | |
| 38.550 | 63.272 | 127.669 | 0.708 | 170.272 | 389.088 | 170.272 | 0.00081 | 0.253 | |
| 39.567 | 67.780 | 136.088 | 0.719 | 174.780 | 384.592 | 174.780 | 0.00083 | 0.248 | |
| 40.551 | 72.433 | 143.383 | 0.809 | 179.433 | 380.028 | 179.433 | 0.00086 | 0.243 | |
| 41.535 | 77.087 | 149.622 | 0.787 | 184.087 | 375.352 | 184.087 | 0.00088 | 0.238 | |
| 42.585 | 82.336 | 155.883 | 0.798 | 189.336 | 370.114 | 189.336 | 0.00090 | 0.232 | |
| 43.570 | 87.518 | 161.244 | 0.888 | 194.518 | 365.022 | 194.518 | 0.00093 | 0.227 | |
| 44.554 | 93.116 | 164.234 | 0.933 | 200.116 | 359.470 | 200.116 | 0.00096 | 0.221 | |
| 45.538 | 99.017 | 165.493 | 0.967 | 206.017 | 353.602 | 206.017 | 0.00098 | 0.215 |
| z | Qs | Qb | ∆Qs | QwUTL | R | Min(Q,R) | δEC | Σδ | Comments: See definition of variables on previous page. Values calculated every ∆z=0.164ft but reported herein every ∆z=0.984ft (except for first and last values). |
| 46.522 | 104.682 | 165.482 | 0.899 | 211.682 | 347.869 | 211.682 | 0.00101 | 0.209 | |
| 47.507 | 109.684 | 165.920 | 0.821 | 216.684 | 342.789 | 216.684 | 0.00103 | 0.203 | |
| 48.524 | 114.619 | 168.157 | 0.821 | 221.619 | 337.854 | 221.619 | 0.00106 | 0.197 | |
| 49.508 | 120.205 | 171.878 | 0.967 | 227.205 | 332.414 | 227.205 | 0.00108 | 0.191 | |
| 50.492 | 126.017 | 174.463 | 0.967 | 233.017 | 326.602 | 233.017 | 0.00111 | 0.184 | |
| 51.476 | 131.828 | 175.272 | 0.967 | 238.828 | 320.791 | 238.828 | 0.00114 | 0.177 | |
| 52.461 | 137.583 | 174.710 | 0.955 | 244.583 | 315.025 | 244.583 | 0.00117 | 0.170 | |
| 53.445 | 143.259 | 172.878 | 0.944 | 250.259 | 309.337 | 250.259 | 0.00119 | 0.163 | |
| 54.429 | 148.599 | 171.473 | 0.854 | 255.599 | 303.908 | 255.599 | 0.00122 | 0.156 | |
| 55.479 | 154.354 | 173.676 | 0.933 | 261.354 | 298.232 | 261.354 | 0.00125 | 0.148 | |
| 56.463 | 160.165 | 180.488 | 0.978 | 267.165 | 292.465 | 267.165 | 0.00128 | 0.141 | |
| 57.448 | 165.898 | 191.874 | 0.955 | 272.898 | 286.710 | 272.898 | 0.00130 | 0.133 | |
| 58.465 | 171.810 | 208.342 | 0.978 | 278.810 | 280.820 | 278.810 | 0.00133 | 0.125 | |
| 59.449 | 177.622 | 227.484 | 0.967 | 284.622 | 274.998 | 274.998 | 0.00131 | 0.117 | |
| 60.433 | 183.433 | 244.907 | 0.967 | 290.433 | 269.186 | 269.186 | 0.00129 | 0.110 | |
| 61.483 | 189.570 | 257.833 | 0.978 | 296.570 | 263.060 | 263.060 | 0.00126 | 0.102 | |
| 62.467 | 195.381 | 264.353 | 0.967 | 302.381 | 257.238 | 257.238 | 0.00123 | 0.094 | |
| 63.451 | 201.193 | 265.263 | 0.967 | 308.193 | 251.426 | 251.426 | 0.00120 | 0.087 | |
| 64.469 | 207.161 | 261.161 | 0.967 | 314.161 | 245.458 | 245.458 | 0.00117 | 0.080 | |
| 65.518 | 213.366 | 254.484 | 1.360 | 320.366 | 239.646 | 239.646 | 0.00114 | 0.073 | |
| 66.503 | 219.177 | 245.413 | 0.967 | 326.177 | 233.442 | 233.442 | 0.00111 | 0.066 | |
| 67.618 | 225.809 | 233.689 | 0.967 | 332.809 | 226.810 | 226.810 | 0.00108 | 0.060 | |
| 68.602 | 231.621 | 223.112 | 0.967 | 338.621 | 220.998 | 220.998 | 0.00106 | 0.053 | |
| 69.587 | 237.432 | 214.513 | 0.967 | 344.432 | 215.187 | 215.187 | 0.00103 | 0.047 | |
| 71.063 | 246.155 | 206.465 | 0.967 | 353.155 | 206.465 | 206.465 | 0.00099 | 0.038 |

Step 10: Calculate the toe settlement and elastic compression in the pile
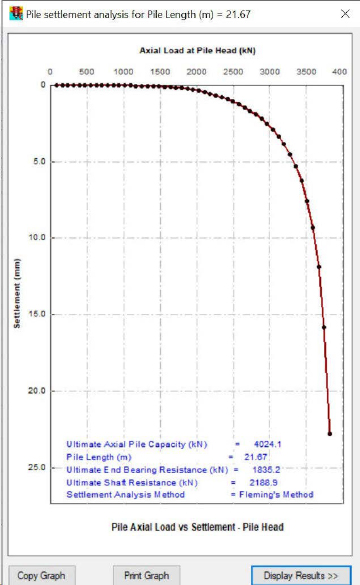
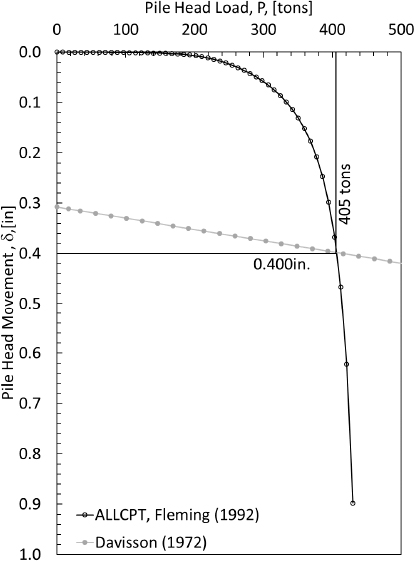
A pile settlement curve (Figure H8) was developed. The pile settlement data were processed along with the Davisson (1972) technique to determine the pile head settlement (0.400in as shown in Figure H9). As shown previously in Table H3, the cumulative elastic compression was calculated using the load in the each pile segment that was provided by ALLCPT. The cumulative elastic compression was subtracted from the pile head settlement as a function of depth to obtain the pile settlement curve. As shown in Figure H10, the pile settlement curve is plotted along with the soil settlement data that were previously presented in Table H2 and previously shown in Figure H2.
Step 11: Calculate the geotechnical resistance of the pile
The geotechnical resistance of the pile is also presented in Figure H9. The geotechnical resistance was determined by identifying where the Davisson (1972) failure line crosses the ALLCPT-generated load-settlement curve. A value of 405 tons was obtained for the geotechnical resistance.
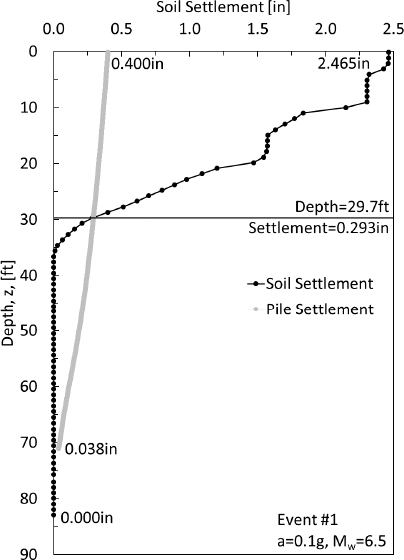
Step 12: Identify the location and settlement of the neutral plane (from the soil settlement-pilesettlement profile)
The obtained location of the neutral plane, as identified from the soil settlement-pile settlement curve is identified in Figure H10. The neutral plane was identified to occur at a depth of 29.7ft. The resulting settlement at the depth of the neutral plane (downdrag) was 0.293in.
The neutral plane locations from the combined load-resistance curve (58.8ft) and from the soil settlement-pile settlement curve (29.7ft) are not within the required 5 feet difference. Because the neutral plane locations are not within the required difference, Step 13 of the NCHRP12-116A Method A flowchart cannot be completed and a different pile geometry should be selected or Method B should be attempted. Because the difference is so large, modifications to the pile geometry are not expected to alter the difference in the locations of the neutral plane. Therefore, for this design example, it is recommended that the Method B flowchart be followed.
Method B: TZPILE design calculations with ALLCPT input
For ease of use, t-z and Q-w curves that were “Generated by the program” were used. The use of these curves allows for soil layer data to be input instead of t-z and Q-w curves. These data are presented in Step 1. Steps 2 and 3 for Method B are identical to those listed above for Method A. Therefore, these steps are not repeated in this section.
Step 1: Establish soil data
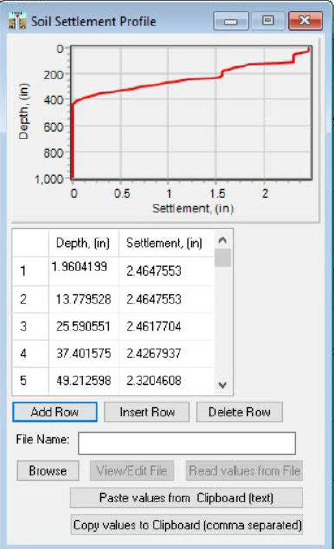
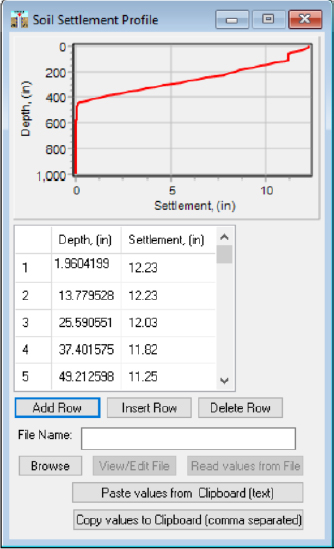
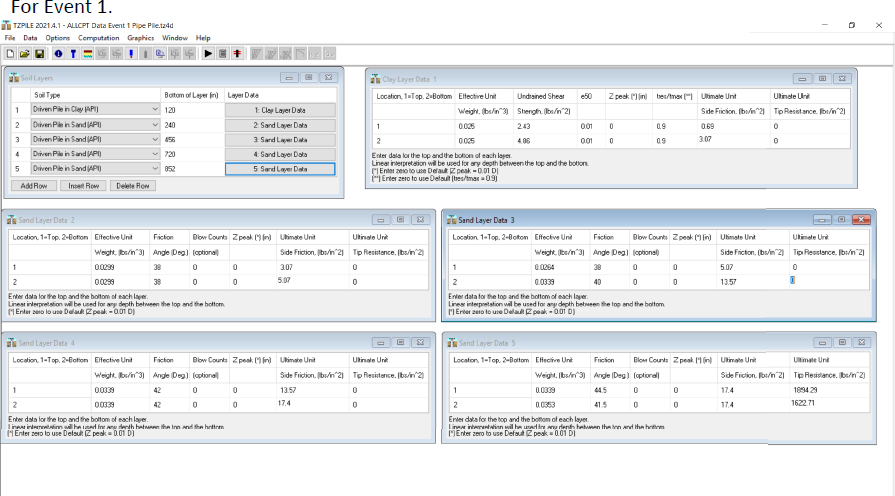
The design profile that was developed from correlations with the CPT data is presented in Figure H11. The developed design profile parameters, the ALLCPT output unit side resistance (fs), and the ALLCPT output unit end bearing (fb) from the ALLCPT Pile Capacity Analysis Tool were used as input in the TZPILE program. The input windows from TZPILE for this problem are presented as Figures H12 through H15. The pile properties are included in Figure H12. The soil properties are included in Figures H13 and the soil settlement is included in Figure H14 (Event 1) and Figure H15 (Event 2). As discussed previously in other design example problems, the TZPILE program uses units of inches and pounds, so the output from the ALLCPT program were converted prior to input into the TZPILE program. Also, the unit weight profile and undrained shear strength had to be converted from units of lb/ft3 and lb/ft2 to lb/in3 and lb/in2, respectively.
Steps 2 and 3 Identical to Method A presented previously but in TZPILE. The pile information is presented in Figure H12, and the soil settlement data resulting from the two design earthquake events are presented in Figures H13 and H14.
Step 4: Select t-z models and q-z model
As previously mentioned, the t-z and q-z curves that were selected were “Generated by the program”. Specifically, the API curves were selected. The inputs for these curves are shown in Figure H15.


Step 5: Iterate toe movement to obtain the unfactored top load
As shown in Figure H16, the toe movement was iterated by the changing the values in the TZPILE program to obtain and unfactored top load of 107tons. A toe movement of 0.0305in was used for Event 1 and a toe movement of 0.069in was used for Event 2. The program also uses the calculated elastic compression in the pile to determine the pile settlement as a function of depth (Figure H17). Therefore, the selected toe movement corresponded with a pile head movement of 0.251in for Event 1 and 0.323in for Event 2.


The results that were output from the TZPILE program included load as a function of depth, pile settlement as a function of depth, and soil settlement as a function of depth (Table H4 for Event 1 and Table H5 for Event 2). The soil settlement (show previously in Table H2) as a function of depth are output even though these values were directly input and no changes to the values occurred during the execution of the program.
Table H4. TZPILE output for Event 1.
| Depth [ft] | Load [tons] | Pile Settlement [in] |
| 70.5 | 44.67 | 0.031 |
| 69.5 | 46.57 | 0.032 |
| 68.5 | 48.53 | 0.034 |
| 67.5 | 50.55 | 0.035 |
| 66.5 | 52.65 | 0.037 |
| 65.5 | 54.80 | 0.038 |
| 64.5 | 57.00 | 0.040 |
| 63.5 | 59.30 | 0.042 |
| 62.5 | 61.70 | 0.043 |
| 61.5 | 64.15 | 0.045 |
| 60.5 | 66.70 | 0.047 |
| 59.5 | 69.30 | 0.049 |
| 58.5 | 71.95 | 0.051 |
| 57.5 | 74.70 | 0.053 |
| 56.5 | 77.50 | 0.056 |
| 55.5 | 80.35 | 0.058 |
| 54.5 | 83.30 | 0.060 |
| 53.5 | 86.20 | 0.063 |
| 52.5 | 89.20 | 0.065 |
| 51.5 | 92.25 | 0.068 |
| 50.5 | 95.30 | 0.071 |
| 49.5 | 98.40 | 0.073 |
| 48.5 | 101.60 | 0.076 |
| 47.5 | 104.80 | 0.079 |
| 46.5 | 108.05 | 0.082 |
| 45.5 | 111.35 | 0.086 |
| 44.5 | 114.70 | 0.089 |
| 43.5 | 118.10 | 0.092 |
| 42.5 | 121.55 | 0.096 |
| 41.5 | 125.05 | 0.099 |
| 40.5 | 128.60 | 0.103 |
| 39.5 | 132.20 | 0.107 |
| 38.5 | 135.80 | 0.111 |
| 37.5 | 139.40 | 0.115 |
| 36.5 | 142.95 | 0.119 |
| 35.5 | 146.35 | 0.123 |
| 34.5 | 149.40 | 0.127 |
| 33.5 | 151.85 | 0.132 |
| 32.5 | 153.25 | 0.136 |
| 31.5 | 153.25 | 0.141 |
| 30.5 | 151.80 | 0.145 |
| 29.5 | 149.20 | 0.150 |
| 28.5 | 146.15 | 0.154 |
| 27.5 | 143.15 | 0.158 |
| 26.5 | 140.30 | 0.162 |
| 25.5 | 137.65 | 0.166 |
| 24.5 | 135.10 | 0.170 |
| 23.5 | 132.75 | 0.174 |
| 22.5 | 130.55 | 0.178 |
| 21.5 | 128.50 | 0.182 |
Table H5. TZPILE output for Event 2.
| Depth [ft] | Load [tons] | Pile Settlement [in] |
| 70.5 | 61.55 | 0.070 |
| 69.5 | 64.30 | 0.072 |
| 68.5 | 67.10 | 0.074 |
| 67.5 | 70.00 | 0.076 |
| 66.5 | 73.00 | 0.078 |
| 65.5 | 76.05 | 0.080 |
| 64.5 | 79.15 | 0.082 |
| 63.5 | 82.35 | 0.084 |
| 62.5 | 85.60 | 0.087 |
| 61.5 | 88.95 | 0.089 |
| 60.5 | 92.35 | 0.092 |
| 59.5 | 95.85 | 0.095 |
| 58.5 | 99.45 | 0.098 |
| 57.5 | 103.05 | 0.101 |
| 56.5 | 106.70 | 0.104 |
| 55.5 | 110.45 | 0.107 |
| 54.5 | 114.25 | 0.110 |
| 53.5 | 118.05 | 0.114 |
| 52.5 | 121.95 | 0.117 |
| 51.5 | 125.95 | 0.121 |
| 50.5 | 129.95 | 0.124 |
| 49.5 | 134.00 | 0.128 |
| 48.5 | 138.10 | 0.132 |
| 47.5 | 141.85 | 0.136 |
| 46.5 | 145.30 | 0.140 |
| 45.5 | 148.80 | 0.145 |
| 44.5 | 152.45 | 0.149 |
| 43.5 | 156.10 | 0.154 |
| 42.5 | 159.85 | 0.158 |
| 41.5 | 163.60 | 0.163 |
| 40.5 | 167.30 | 0.168 |
| 39.5 | 170.85 | 0.173 |
| 38.5 | 173.90 | 0.178 |
| 37.5 | 176.15 | 0.183 |
| 36.5 | 175.60 | 0.188 |
| 35.5 | 172.05 | 0.193 |
| 34.5 | 167.90 | 0.198 |
| 33.5 | 163.95 | 0.203 |
| 32.5 | 160.15 | 0.207 |
| 31.5 | 156.50 | 0.212 |
| 30.5 | 153.05 | 0.217 |
| 29.5 | 149.70 | 0.221 |
| 28.5 | 146.55 | 0.225 |
| 27.5 | 143.55 | 0.229 |
| 26.5 | 140.70 | 0.234 |
| 25.5 | 138.00 | 0.238 |
| 24.5 | 135.50 | 0.242 |
| 23.5 | 133.15 | 0.246 |
| 22.5 | 130.95 | 0.249 |
| 21.5 | 128.90 | 0.253 |
| Depth [ft] | Load [tons] | Pile Settlement [in] |
| 20.5 | 126.65 | 0.185 |
| 19.5 | 124.90 | 0.189 |
| 18.5 | 123.25 | 0.193 |
| 17.5 | 121.65 | 0.196 |
| 16.5 | 120.15 | 0.200 |
| 15.5 | 118.70 | 0.203 |
| 14.5 | 117.30 | 0.207 |
| 13.5 | 116.00 | 0.210 |
| 12.5 | 114.75 | 0.213 |
| 11.5 | 113.55 | 0.217 |
| 10.5 | 112.45 | 0.220 |
| 9.5 | 111.45 | 0.223 |
| 8.5 | 110.60 | 0.227 |
| 7.5 | 109.80 | 0.230 |
| 6.5 | 109.10 | 0.233 |
| 5.5 | 108.45 | 0.236 |
| 4.5 | 107.85 | 0.239 |
| 3.5 | 107.35 | 0.242 |
| 2.5 | 106.95 | 0.246 |
| 1.5 | 106.60 | 0.249 |
| 0.5 | 106.30 | 0.252 |
| Depth [ft] | Load [tons] | Pile Settlement [in] |
| 20.5 | 127.00 | 0.257 |
| 19.5 | 125.25 | 0.261 |
| 18.5 | 123.60 | 0.264 |
| 17.5 | 122.05 | 0.268 |
| 16.5 | 120.50 | 0.271 |
| 15.5 | 119.05 | 0.275 |
| 14.5 | 117.70 | 0.278 |
| 13.5 | 116.35 | 0.282 |
| 12.5 | 115.15 | 0.285 |
| 11.5 | 113.95 | 0.288 |
| 10.5 | 112.85 | 0.292 |
| 9.5 | 111.85 | 0.295 |
| 8.5 | 111.00 | 0.298 |
| 7.5 | 110.20 | 0.301 |
| 6.5 | 109.50 | 0.305 |
| 5.5 | 108.85 | 0.308 |
| 4.5 | 108.25 | 0.311 |
| 3.5 | 107.75 | 0.314 |
| 2.5 | 107.30 | 0.317 |
| 1.5 | 106.95 | 0.320 |
| 0.5 | 106.70 | 0.323 |
Step 6: Develop the depth-dependent combined load is the pile
The depth-dependent load-resistance curves for the two events (Event 1 and Event 2) are presented as Figures H18 and H19. The maximum load in the pile from these two events was 153.3 tons and 176.5 tons. The increased soil settlement resulting from the larger earthquake event resulted in the larger maximum load in the pile occurring at a deeper depth.
Steps 7 and 8: Identify the location of the neutral plane and calculate the amount of drag load
As mentioned in Step 6, the increased soil settlement resulting from the larger earthquake event resulted in the maximum load in the pile occurring at a deeper depth (as shown in Figures H18 and H19 above). The location of the maximum load in the pile corresponded with the location of the neutral plane. The neutral plane locations for Events 1 and 2 were at depths of 32.5ft and 37.0ft, respectively. The drag loads calculated for Events 1 and 2 were 46.3tons and 69.5tons, respectively.
Step 9: Calculate the geotechnical resistance of the pile
The geotechnical resistance was determined in TZPILE by repeating Step 5 of the Method B flowchart. For these analyses, the soil settlement was neglected by turning off the Include Down-Drag (negative Skin Friction) toggle within TZPILE (Figure H20) and by also selecting the Load Method as User-Specified Tip Movements (Figure H21). Specifically, multiple toe movements (Figure H22) were evaluated to develop a load-settlement curve (Figure H23 and Table H6). This curve represents the pile head axial load and the pile head settlement. Two specific toe movements were included during the creation of the load-settlement curve; toe movements corresponding with a toe movement of 0.0118in, which was
calculated when the unfactored design load (214.3kips) was obtained at the top of the pile, and a toe movement of 0.05B (0.9in).


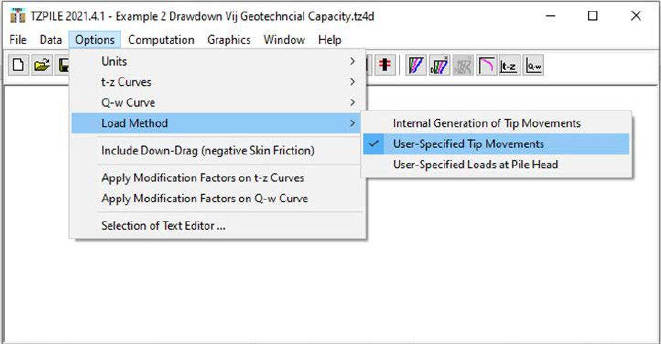
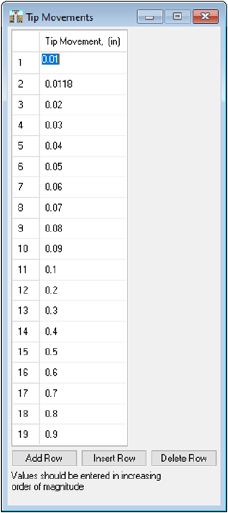
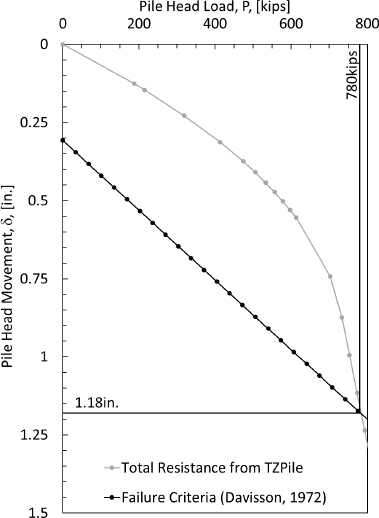
Table H6. TZPILE obtained load-settlement curve.
| Pile Head Load, P [kips] | Pile Head Movement, δ [in.] |
| 0.00 | 0.000 |
| 188.10 | 0.126 |
| 215.01 | 0.146 |
| 318.57 | 0.228 |
| 413.07 | 0.313 |
| 473.95 | 0.374 |
| 505.64 | 0.410 |
| 532.66 | 0.442 |
| 556.62 | 0.473 |
| 577.97 | 0.502 |
| 596.82 | 0.529 |
| 613.28 | 0.554 |
| 702.73 | 0.743 |
| 733.51 | 0.874 |
| 753.29 | 0.995 |
| 773.06 | 1.115 |
| 792.84 | 1.236 |
| 812.62 | 1.356 |
| 828.58 | 1.473 |
| 839.68 | 1.584 |
Step 10: Identify the location and settlement of the neutral plane (from the soil settlement-pilesettlement curve)
The amount of elastic compression within the pile was automatically calculated in the TZPILE software program. These automatically generated values simplify efforts compared to the hand calculation that was presented in Design Example 1. Just like Design Example 1, the TZPILE elastic compression calculations are based on the amount of calculated load within the pile at each incremental depth. The calculated pile settlement were tabulated and shown in Table H2 and Figure H2. From Figures H24 and H25, the neutral plane that was obtained from the soil settlement-pile settlement curves for Events 1 and 2 were 32ft and 37ft, respectively. The amount of settlement of the neutral plane (downdrag) for events 1 and 2 was 0.138in and 0.185in, respectively.
The differences between the neutral plane locations for Events 1 and 2, as obtained during Method B Step 7 and Step 10, were within the tolerable limits. For example, for Event 1, the neutral plane location calculated in Step 7 was 32.5ft and in Step 10 was 32ft. Likewise, for Event 2, the neutral plane location calculated in Step 7 was 37ft and in Step 10 was 37ft.


Step 11: Perform limit state checks
Limit state checks were performed to determine if the pile size was suitable for the design loads. For the structural strength limit state, the determined drag load associated with Event 1 (46.3tons) was multiplied by the drag load factor (γDR=1.1) to obtained a factored load of drag load 50.9tons. The unfactored top load (107tons) placed on the top of the pile was multiplied by the deadload factor (γD=1.25) to obtained a factored deadload of 134tons. The combined total factored load was 185tons. The concrete compressive strength for the concrete-filled steel pipe pile was assumed to be 5000psi resulting in a factored structural stress of 3750psi (0.75*5000psi) and a factored structural strength of 477tons when the stress was multiplied by the cross-sectional area of the pile (254.5in2). If a concrete compressive strength of 5000psi, was used for the concrete-filled steel pipe pile then the pile is adequately sized because the factored structural strength (477tons) was determined to be greater than the combined total factored load (185tons).
Conclusion:
The ALLCPT and TZPILE programs were used to identify the location of the neutral plane, the amount of drag load, and the amount of downdrag. The load and resistance curve that was developed using the ALLCPT program was for a fully-mobilized condition (full mobilization of side resistance and full mobilization of end bearing resistance). The influence of post-liquefaction reconsolidation settlement within the soil deposit was not accounted for when using the ALLCPT program. After accounting for the post-liquefaction reconsolidation settlement, using the TZPILE program, the neutral plane moved up
within the soil deposit. However, the neutral plane moved down within the soil deposit when the pile was subjected to additional downdrag from a larger earthquake event.
Specifically, the influence of mobilization was evident when considering the difference in responses between the Event 1 and Event 2. The additional soil settlement resulted in more mobilization of side and end bearing resistance and more load in the pile. The neutral plane lowered from a depth of 32 feet (Event 1) to 37 feet (Event 2) with the increased soil settlement from 2.465 inches at the ground surface (Event 1) to 12.23 inches at the ground surface (Event 2). The maximum load in the pile increased from 153.3 tons (Event 1) to 176.5 tons (Event 2). Therefore, the drag load increased from 46.3 tons (Event 1) to 69.5 tons (Event 2).
The piles were shown to be adequately designed for the geotechnical and structural strength limit states. The piles were also shown to be adequately designed for the geotechnical serviceability limit state. However, the large ground surface deformations in the soil surrounding the piles may led to a serviceability issues.
References
Boulanger, R.W. and Idriss, I.M. (2014). “CPT and SPT based liquefaction triggering procedures.” Report No. UCD/CGM.-14, University of California, Davis, California.
Bustamante, M., and Gianeselli, L. (1982). Pile bearing capacity predictions by means of static penetrometer CPT, Proceedings of the 2nd European Symposium on Penetration Testing, ESOPT II, Amsterdam, May 24–27, 1982. A.A. Balkema, Rotterdam, Vol. 2, 493–500.
Davisson, M.T. (1972) “High Capacity Piles” Proceedings, Lecture Series, Innovations in Foundation Construction, ASCE, Illinois Section, 52 pp.
Ensoft (2021). “TZPILE 2021 v4” TPile Computer Program. Austin, TX.
Fleming, W.G.K., (1992). “A new method for single pile settlement prediction and analysis.” Geotechnique, Vol. 42, (3): 411–425.
Innovative Geotechnics (2023). “CPT Data Interpretation Tool for Geotechnical Engineering.” ALLCPT 2.5 computer program. Perth, Western Australia.
Yoshimine, M., Nishizaki, H., Amano, K. and Hosono, Y. (2006). “Flow deformation of liquefied sand under constant shear load and its application to analysis of flow slide of infinite slope.” Soil Dynamics and Earthquake Engineering, 26(2-4): 253–264.


