Guide on Methods for Assigning Counts to Adjustment Factor Groups (2024)
Chapter: Appendix B: WSDOT Case Study: Development of Factor Groups Using Clustering

APPENDIX B
WSDOT Case Study: Development of Factor Groups Using Clustering
This case study describes how WSDOT uses clustering to develop seasonal adjustment factor groups. Washington is a mid-sized state in the West region. WSDOT’s traffic monitoring program includes 174 active permanent sites, all located on higher functional classes, and 5,785 short-term count sites, of which seven are on lower functional classes. The state conducts approximately 1,800 short-term counts each year. WSDOT generally performs 48- and 72-hour short-term counts from Tuesday to Thursday in March through November. Occasionally, 12-hour manual classification counts are performed if site conditions do not permit a mechanical classification count.
Background
Prior to 1999, WSDOT used eight seasonal adjustment factor groups based on functional class, rural/urban designation, and geography. These pre-1999 groups are listed below.
- GR-01: Interstate Urban.
- GR-02: Non-Interstate Urban.
- GR-03: Interstate Rural-West.
- GR-04: Interstate Rural-East.
- GR-05: Olympic Peninsula.
- GR-06: Rural West.
- GR-07: Rural East North-South Highways.
- GR-08: Rural East East-West Highways.
In 1999, WSDOT performed a cluster analysis using March to November monthly factors calculated for all permanent sites. Clustering was used as an initial screen to identify similar sites. The initial clusters were then reviewed by DOT staff and labeled in terms of known roadway attributes for ease of assignment. This process reduced the number of factor groups to seven, with the changes occurring primarily in rural areas. A new cluster of recreational sites was also identified. The seven 1999–2001 factor groups were:
- GR-01: Interstate Urban.
- GR-02: Non-Interstate Urban.
- GR-03: Interstate Rural.
- GR-04: Rural Central Mountain Recreational.
- GR-05: Rural Non-Interstate West of the Cascades.
- GR-06: Rural Non-Interstate Southeast of State.
- GR-07: Rural Non-Interstate Northeast of State.
WSDOT repeated the cluster analysis in 2002. Using one to three years of data per site (depending on availability), average monthly factors were calculated. Sites were then clustered based on their
monthly factors form March to November. This analysis produced similar groups to the 1999 analysis but recommended subdividing some groups, for a total of ten factor groups:
- GR-01: Urban Interstate.
- GR-02: Urban Non-Interstate.
- GR-03: Non-Recreational Rural Interstate.
- GR-04: Rural Central Mountain (Moderate Recreational Influence).
- GR-05: Non-Interstate, Non-Recreational Rural West.
- GR-06: Non-Interstate, Non-Recreational Rural SE (Central Locations).
- GR-07: Non-Interstate, Non-Recreational Rural NE.
- GR-08: Non-Interstate, Non-Recreational Rural SE (Border Crossing & Commute Routes).
- GR-09: Rural Central Mountain (Strong Recreational Influence).
- GR-10: Recreational West.
The 1999 analysis identified a cluster of sites with seasonal variations driven by recreational traffic. The 2002 analysis found that, within this cluster, a subset of sites experienced a much stronger seasonal pattern than the rest, as shown in Figure B-1. WSDOT decided to split the recreational cluster into two: Moderate and Strong Recreational Influence.
Both cluster analyses identified a rural interstate cluster. The 2002 analysis found that, while most rural interstates showed some seasonal variation, many sites on I-90 in eastern Washington more closely resembled the moderate recreational influence group. These three sites, shown in red in Figure B-2, were removed from the rural interstate group, and the group was renamed Non-Recreational Rural Interstate.
In the southeastern part of the state, the 2002 analysis found two clusters: one consisting of sites on commute routes and near the state border, and a second consisting of sites influenced by seasonal agricultural traffic. These groups are shown in Figure B-3.
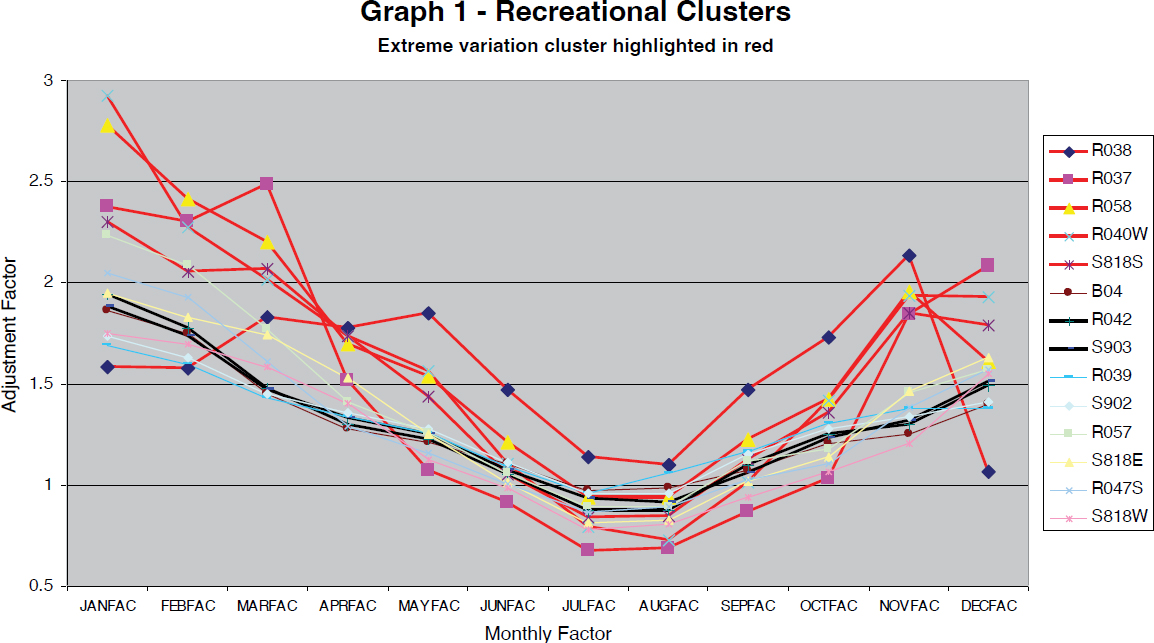
Figure B-1. Recreational clusters from 2002 analysis.
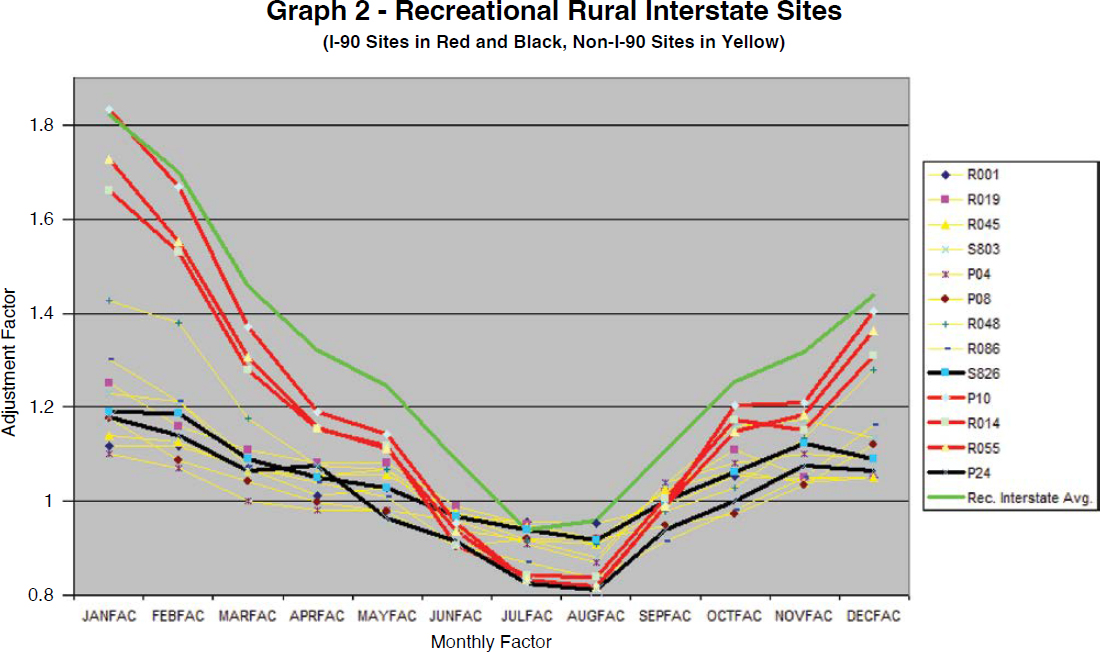
Figure B-2. Rural interstate sites from 2002 analysis.
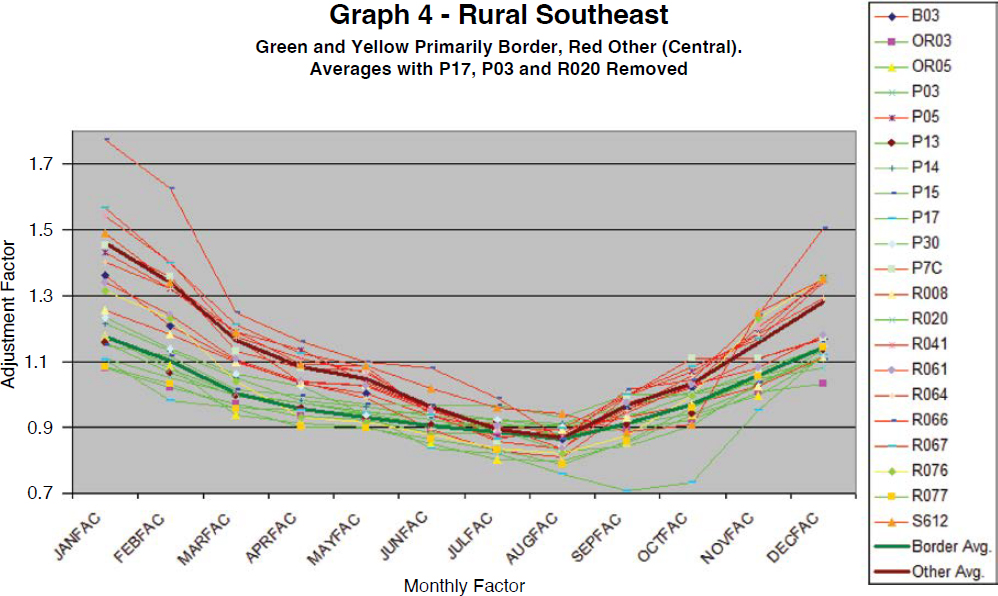
Figure B-3. Rural southeast sites from 2002 analysis.
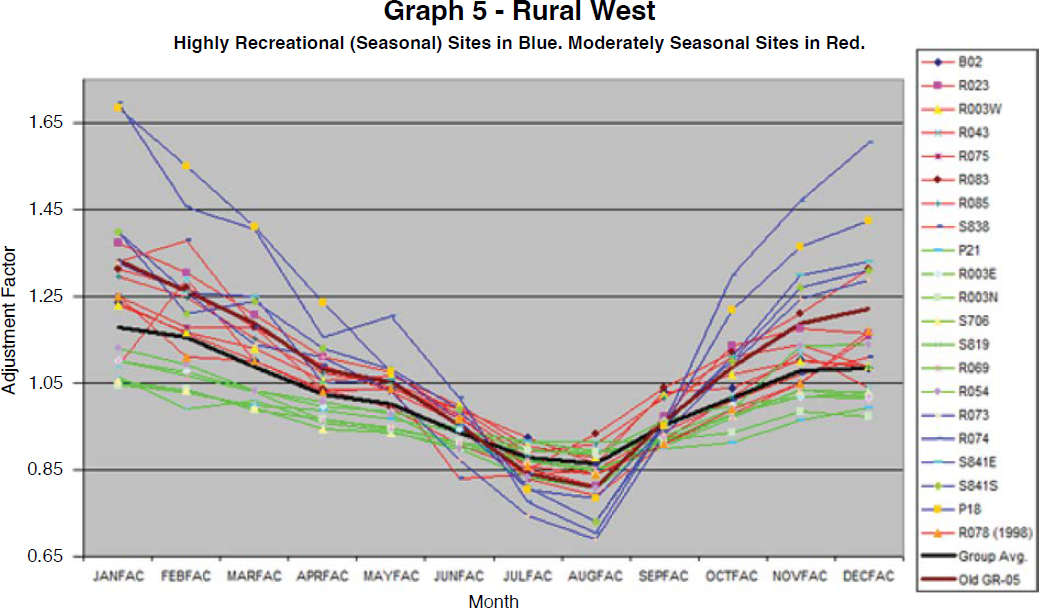
Figure B-4. Rural west sites from the 2002 analysis.
Lastly, the 2002 analysis added a Recreational West cluster. The minimum number of sites was met by incorporating 1997 data, the most recent available at the time, from two Puget Sound ferry terminal sites. This cluster is shown in Figure B-4.
Figure B-5 shows the trends for all 2002 factor groups.
Current Method
WSDOT has continued to use the seasonal adjustment factor groups developed in the 2002 cluster analysis, with reviews of the groupings performed in 2006 and 2014. The 2006 review was based on permanent site data from 2003–2005 and made minor changes to the composition of groups GR-06, GR-07, and GR-08. These groups were renamed to better reflect their current composition.
- GR-01: Urban Interstate.
- GR-02: Urban Non-Interstate.
- GR-03: Non-Recreational Rural Interstate.
- GR-04: Rural Central Mountain (Moderate Recreational Influence).
- GR-05: Non-Interstate, Non-Recreational Rural West.
- GR-06: Non-Interstate, Non-Recreational Rural East (Agricultural Influence).
- GR-07: Non-Interstate, Non-Recreational Rural Northeast.
- GR-08: Non-Interstate, Non-Recreational Rural Southeast.
- GR-09: Rural Central Mountain (Strong Recreational Influence).
- GR-10: Recreational West.
The most recent review was done in 2014 using permanent site data from 2013.
Group GR-01 covers urban interstates. Figure B-6 shows all sites classified as urban interstates, including three shown in red that were newly classified as urban based on the rural/urban boundaries from the 2010 Census.
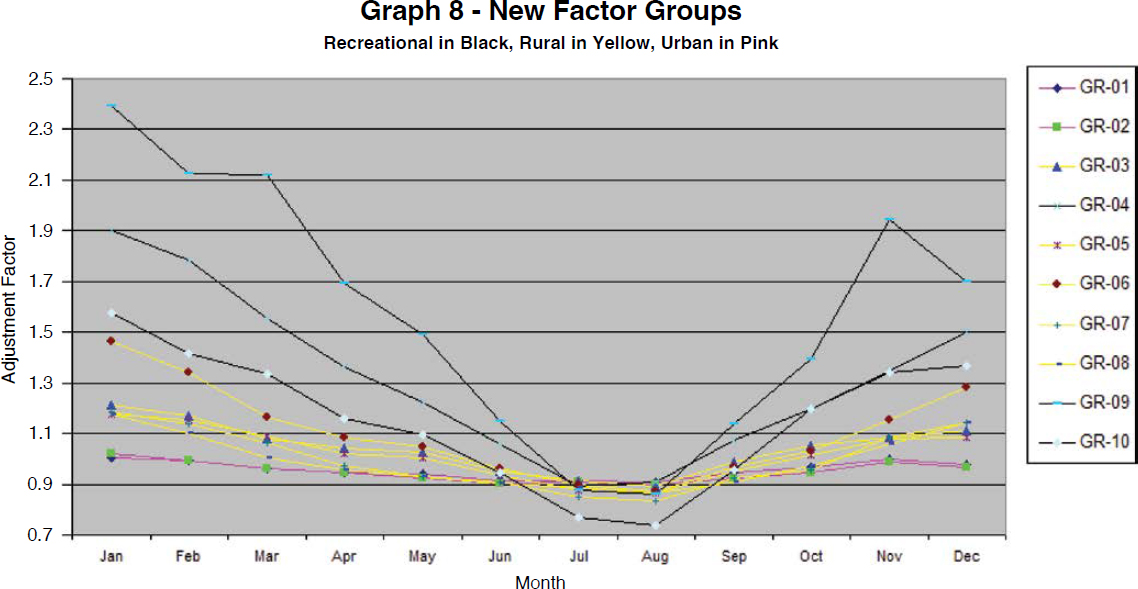
Figure B-5. Monthly factors from 2002 factor groups.
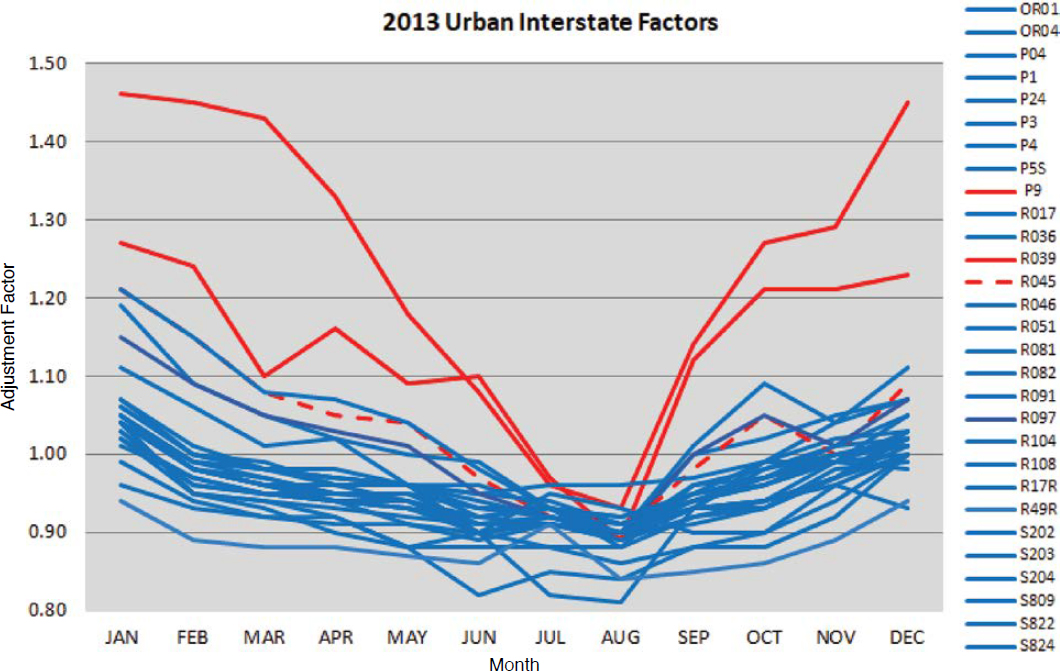
Figure B-6. All sites classified as urban interstates in 2013.
The three former rural sites now classified as urban were found to be outliers and removed. Two more culls were done, removing sites that now appeared to be outliers after the first round, along with traffic system management center locations that WSDOT had found to be unreliable. The final plot, Figure B-7, shows the updated GR-01 (Urban Interstate) cluster, including sites that were previously included (in yellow) and two new additions (in blue).
A similar process was followed for the Urban Non-Interstate group. Figure B-8 shows all sites that are eligible for inclusion in this group based on their urban designation and functional class. Sites currently in the cluster are shown in yellow, sites identified as outliers in red, and remaining sites in blue.
Figure B-9 shows the remaining sites after the outliers were removed. Site D10, shown as a yellow dashed line, was previously included in GR-02 but removed as an outlier in 2013.
The initial screening for outliers was done visually, using the plot of monthly factors. WSDOT then calculated the difference between the monthly factor for each site shown in Figure B-9 and the average monthly factor for the group. The results, shown in Table B-1, indicate that the sites with the smallest difference from the mean tend to be those already included in cluster GR-02. Sites R103 and R102 appear to be good candidates for inclusion, while site P6 may now be an outlier. After recalculating Table B-1 for 2012, WSDOT decided to include R102 (with R103 as an alternate because the two sites are near each other on the same road), retain P6, and drop D10.
The same process was followed for rural interstates. Figure B-10 shows all sites eligible for inclusion in this group. Two new CCSs (blue) were added to the cluster, and one site (yellow dashed) reclassified as urban after the 2010 Census was removed. Many of the sites in red are part of the Rural Central Mountain (Moderate Recreational Influence) cluster.

Figure B-7. Updated urban interstate cluster in 2013.
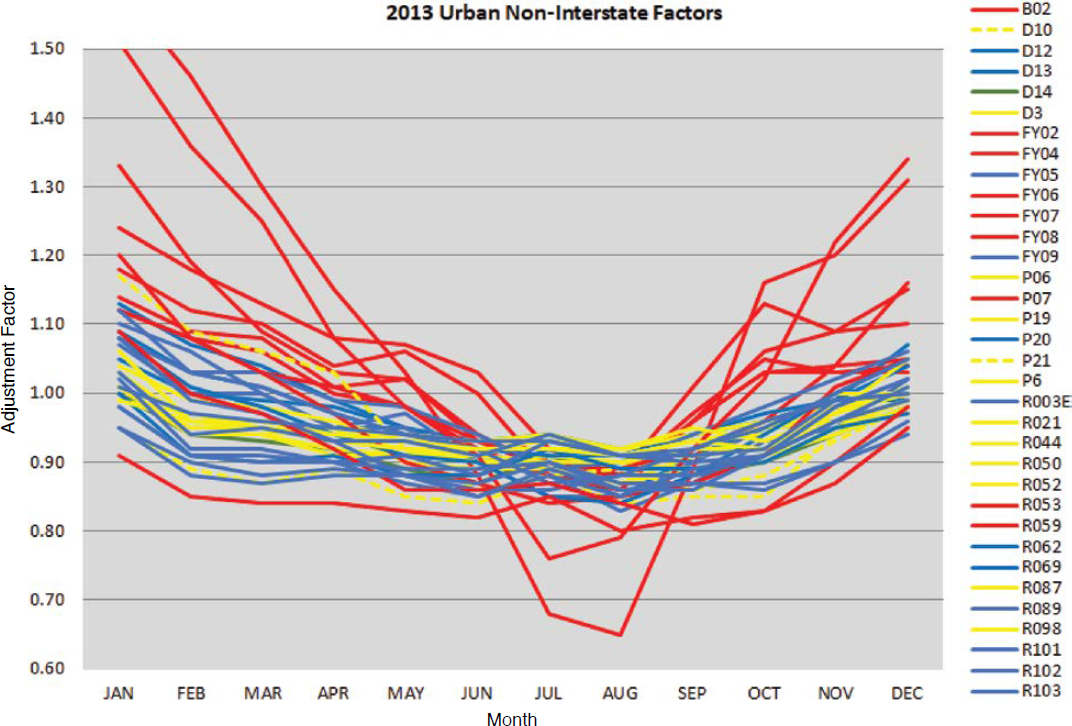
Figure B-8. All sites classified as urban non-interstate in 2013.
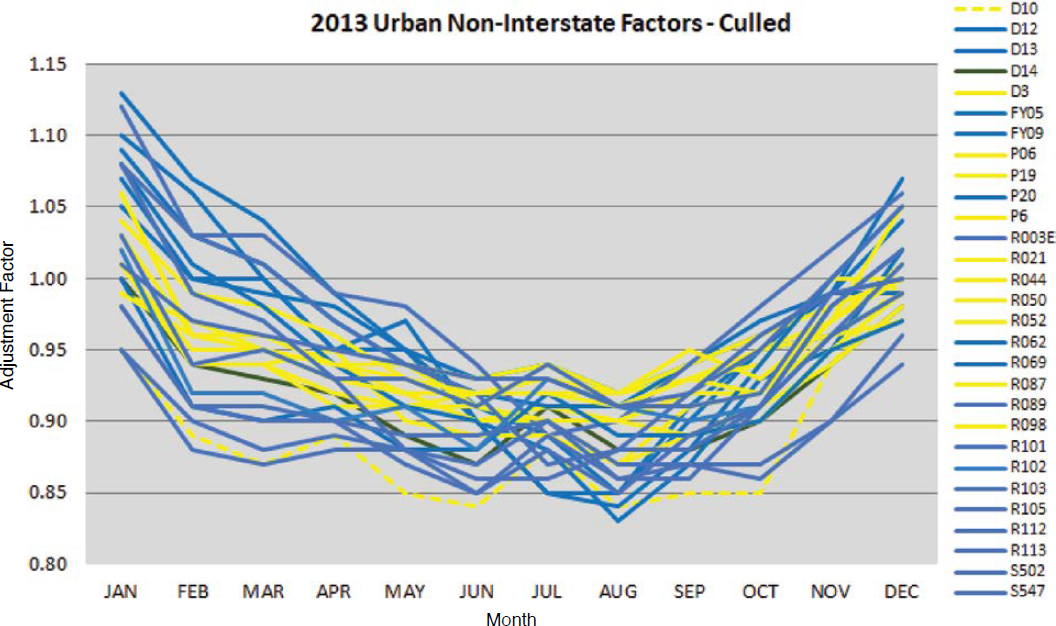
Figure B-9. Updated urban non-interstate cluster in 2013.
Table B-1. Difference from mean for March–November monthly factors in 2013, urban non-interstates.
| Site | Mar | Apr | May | Jun | Jul | Aug | Sep | Oct | Nov | Difference |
|---|---|---|---|---|---|---|---|---|---|---|
| P19 | 0.95 | 0.93 | 0.92 | 0.90 | 0.90 | 0.87 | 0.91 | 0.92 | 0.98 | 0.05 |
| R052 | 0.94 | 0.92 | 0.91 | 0.91 | 0.90 | 0.90 | 0.92 | 0.92 | 0.96 | 0.09 |
| P06 | 0.95 | 0.94 | 0.92 | 0.90 | 0.91 | 0.90 | 0.89 | 0.90 | 0.95 | 0.09 |
| R098 | 0.96 | 0.94 | 0.93 | 0.92 | 0.92 | 0.91 | 0.93 | 0.92 | 0.97 | 0.12 |
| R103 | 0.95 | 0.93 | 0.93 | 0.91 | 0.94 | 0.91 | 0.91 | 0.92 | 0.99 | 0.13 |
| R087 | 0.95 | 0.93 | 0.92 | 0.92 | 0.92 | 0.92 | 0.95 | 0.93 | 0.97 | 0.14 |
| R050 | 0.94 | 0.95 | 0.90 | 0.89 | 0.89 | 0.87 | 0.89 | 0.91 | 0.94 | 0.14 |
| R044 | 0.98 | 0.96 | 0.93 | 0.91 | 0.90 | 0.90 | 0.92 | 0.95 | 0.96 | 0.14 |
| R102 | 0.92 | 0.90 | 0.91 | 0.88 | 0.93 | 0.91 | 0.90 | 0.91 | 0.98 | 0.18 |
| R021 | 0.96 | 0.94 | 0.94 | 0.91 | 0.94 | 0.91 | 0.93 | 0.94 | 1.00 | 0.18 |
| D3 | 0.94 | 0.91 | 0.91 | 0.92 | 0.93 | 0.92 | 0.93 | 0.95 | 0.97 | 0.18 |
| D14 | 0.93 | 0.92 | 0.89 | 0.87 | 0.91 | 0.88 | 0.88 | 0.90 | 0.94 | 0.18 |
| R105 | 0.97 | 0.93 | 0.88 | 0.86 | 0.86 | 0.88 | 0.88 | 0.91 | 0.98 | 0.20 |
| R113 | 0.96 | 0.95 | 0.94 | 0.93 | 0.93 | 0.91 | 0.92 | 0.96 | 0.99 | 0.20 |
| R112 | 0.91 | 0.90 | 0.89 | 0.89 | 0.90 | 0.86 | 0.86 | 0.91 | 0.96 | 0.21 |
| R069 | 0.98 | 0.94 | 0.91 | 0.90 | 0.85 | 0.84 | 0.88 | 0.94 | 1.00 | 0.21 |
| R062 | 0.90 | 0.91 | 0.88 | 0.88 | 0.92 | 0.89 | 0.89 | 0.90 | 0.95 | 0.21 |
| P6 | 0.95 | 0.94 | 0.94 | 0.93 | 0.94 | 0.92 | 0.94 | 0.96 | 0.98 | 0.22 |
| FY05 | 1.00 | 0.95 | 0.95 | 0.90 | 0.88 | 0.83 | 0.87 | 0.93 | 0.95 | 0.23 |
| FY09 | 1.00 | 0.95 | 0.97 | 0.90 | 0.85 | 0.85 | 0.90 | 0.95 | 0.96 | 0.24 |
| R089 | 1.01 | 0.97 | 0.94 | 0.92 | 0.87 | 0.88 | 0.92 | 0.95 | 1.00 | 0.25 |
| P20 | 1.01 | 0.97 | 0.94 | 0.92 | 0.91 | 0.91 | 0.94 | 0.97 | 0.99 | 0.27 |
| R101 | 0.90 | 0.90 | 0.87 | 0.85 | 0.88 | 0.85 | 0.89 | 0.91 | 0.96 | 0.28 |
| D12 | 1.04 | 0.99 | 0.95 | 0.91 | 0.89 | 0.85 | 0.91 | 0.95 | 0.99 | 0.29 |
| D13 | 0.99 | 0.98 | 0.95 | 0.93 | 0.94 | 0.92 | 0.94 | 0.96 | 0.99 | 0.31 |
| S547 | 0.88 | 0.89 | 0.88 | 0.87 | 0.90 | 0.87 | 0.87 | 0.86 | 0.90 | 0.37 |
| R003E | 1.03 | 0.99 | 0.98 | 0.94 | 0.89 | 0.90 | 0.94 | 0.98 | 1.02 | 0.41 |
| S502 | 0.87 | 0.88 | 0.88 | 0.85 | 0.89 | 0.86 | 0.87 | 0.87 | 0.90 | 0.42 |
| D10 | 0.87 | 0.89 | 0.85 | 0.84 | 0.88 | 0.84 | 0.85 | 0.85 | 0.94 | 0.48 |
Source: WSDOT.

Figure B-10. All sites classified as rural interstate in 2013.
Rural non-interstate sites in the western part of the state were reviewed together. Figure B-11 shows all of these sites, with the existing clusters of Non-Interstate, Non-Recreational Rural West, and Recreational West shown in blue and yellow, respectively. Sites shown in red were classified as outliers and not included in either cluster. Based on this figure, WSDOT determined that the three unclassified sites (shown in black) were most similar to the nonrecreational cluster and evaluated their appropriateness for inclusion in this group. The changes to the group’s composition increased its CV from 3.95 to 4.17 and decreased its precision level from 2.83 to 2.80 in 2013.
Figure B-12 shows only the Non-Interstate Non-Recreational Rural West cluster with the three candidate sites. The lower two black lines were dropped from consideration because they did not show the same seasonal pattern. The top black line, site R023, had previously been included in the cluster until it was removed in the 2006 evaluation. A difference from mean calculation, similar to Table B-1, confirmed that site R023 was a good fit for the cluster and it was re-added. It is worth noting that three of the sites in this cluster have been reclassified as urban based on the Census 2010 boundaries. WSDOT decided to leave two of these sites in the cluster because their seasonal pattern still fit the trend, while the third site did not have complete data in 2013 and could not be evaluated.
The final part of the evaluation considered all remaining rural sites. Figure B-13 shows these sites, with Rural Central Mountain (Moderate Recreational Influence) shown in blue, Non-Interstate Non-Recreational Rural East (Agricultural Influence) in yellow, Non-Interstate Non-Recreational Rural Northeast in brown, Non-Interstate Non-Recreational Rural Southeast in green, and Rural Central Mountain (Strong Recreational Influence) in red. Unclassified sites are shown in black.
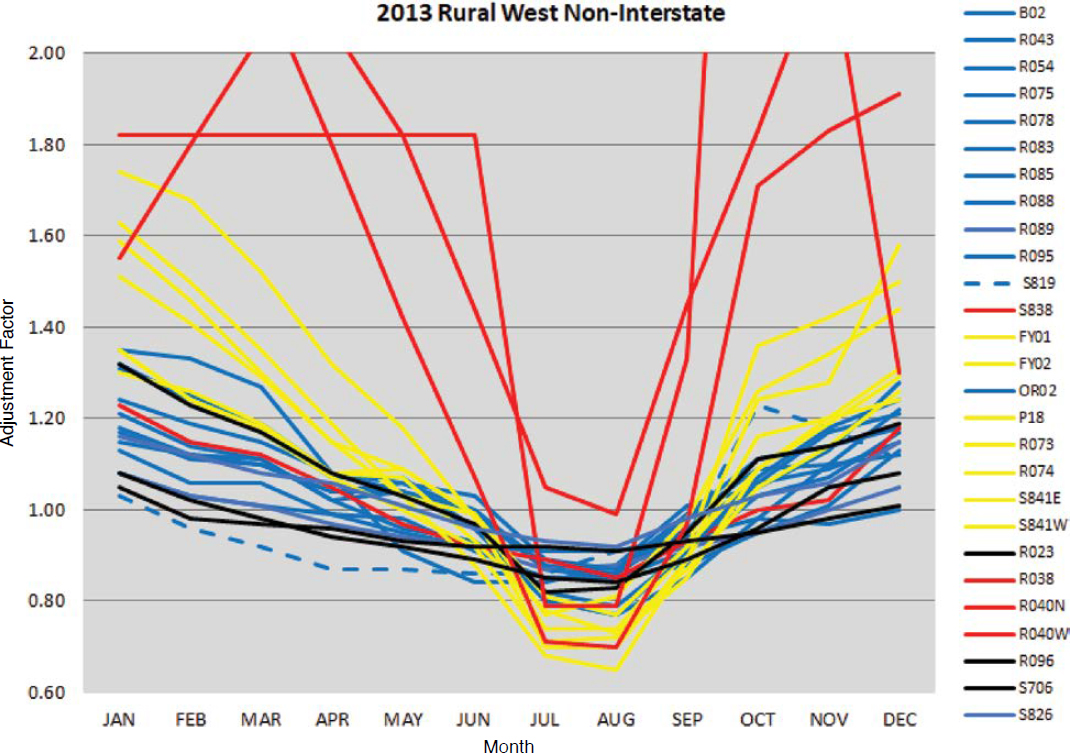
Figure B-11. All Rural west non-interstate sites in 2013.
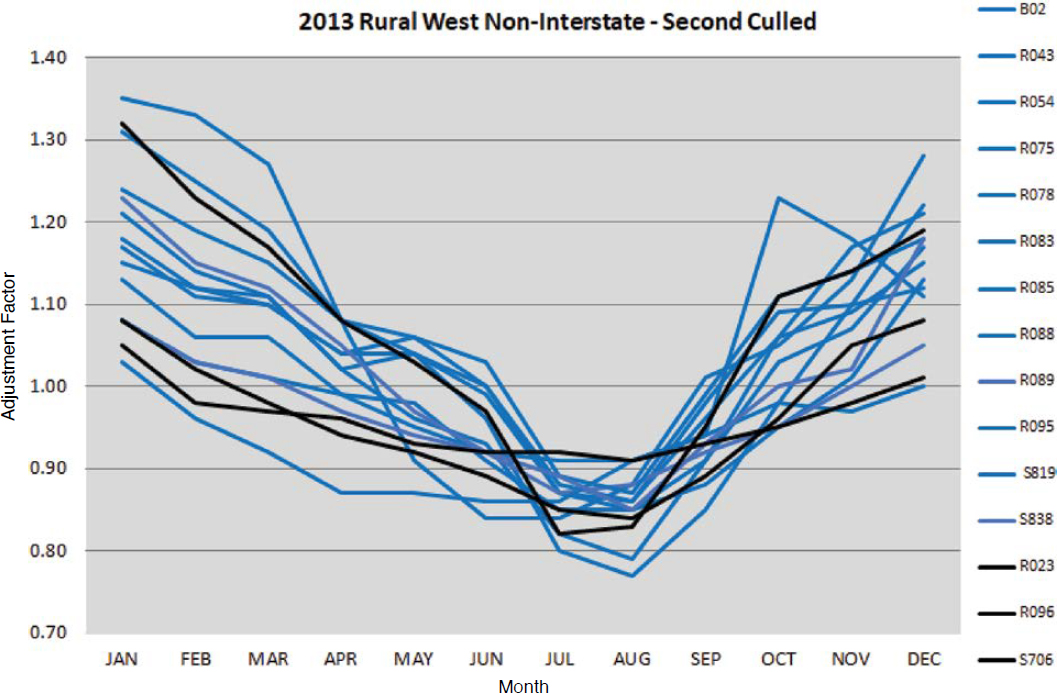
Figure B-12. Updated non-interstate nonrecreational rural west cluster in 2013.
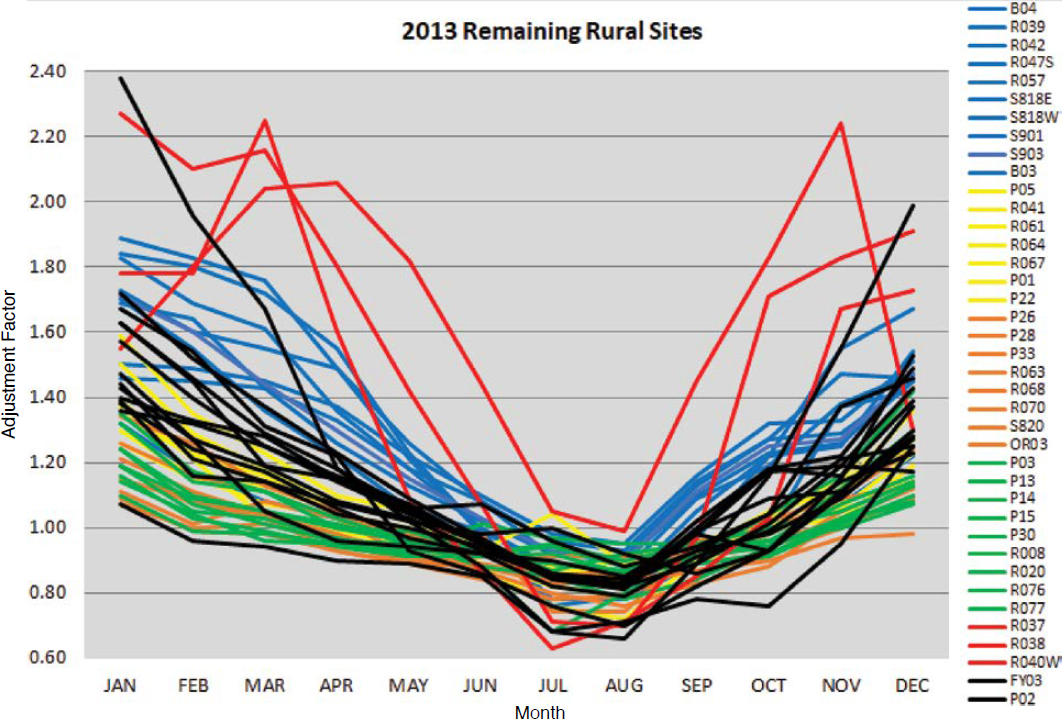
Figure B-13. All remaining rural sites in 2013.
One black line resembles the seasonal pattern of Rural Central Mountain (Strong Recreational Influence). However, it was not added because this site is located outside the Cascade mountain range. WSDOT desires to maintain the geographical aspect of the clusters for explainability and ease of assignment to roadway segments.
After removing the red cluster and the lowest black line, WSDOT performed a Ward’s cluster analysis on the remaining sites, grouping them into three, four, five, and six clusters. This analysis consistently reproduced the Rural Central Mountain (Moderate Recreational Influence) cluster.
The Ward’s cluster analysis sometimes combined the Non-Interstate Non-Recreational Rural Northeast and Southeast groups. Although these groups are very similar, WSDOT decided to maintain the distinction, which has value for calculating regional growth factors. Of the unclassified sites, P11 and R084 appeared to fit in the Northeast cluster. A review of previous years’ data determined that only P11 should be added. The change in composition increased the Northeast group’s CV from 5.19 to 5.20 and decreased its precision level from 4.34 to 4.00 in 2013.
The review of the Non-Interstate Non-Recreational Rural East (Agricultural Influence) cluster found that all of these sites had a high truck percentage. Two sites, R100 and S612, were considered for inclusion based on their high truck percentage but were not a good enough match to the cluster’s existing seasonal pattern. One site, R064, was dropped from the cluster because its truck percentage (11 percent) was significantly lower than the other sites (21–26 percent). This change improved the group’s CV from 3.37 to 3.08 but increased the precision level from 3.54 to 3.83.
Application
The clusters are defined in terms of functional class, rural/urban designation, geography, and demand generators. As a result, WSDOT is able to assign every segment in the highway network to one of the clusters described above. This process allows WSDOT to easily look up the appropriate factor for a short-term count, regardless of whether it is conducted at an established short-term count site or at a new location.
As described in the previous section, WSDOT uses the plots of monthly factors as a visual inspection for outliers. This high-level review is done every year, and any CCS that appears to be an outlier will be removed from the factor group calculation. WSDOT also calculates the precision of the factor groups every year to ensure that they meet the TMG requirements.
Every few years, WSDOT conducts an in-depth review of the factor groups. This review considers whether existing CCS sites are still a good fit for their assigned seasonal factor group, whether new or unassigned CCS sites should be added to a factor group, and whether the data support merging or adding a new factor group. The most recent review for which documentation was available was performed in 2014 and is described in the previous section.
Summary
WSDOT performed a cluster analysis in-house in 2002 and has maintained the resulting ten seasonal adjustment factor groups ever since with periodic adjustments based on changing traffic patterns and rural/urban designations. The clustering process is data-driven, but the results are manually adjusted to ensure that the cluster assignments are stable across multiple years of data and are clearly defined in terms of attributes that are known across the highway network (e.g., functional class, rural/urban designation, geographic region, and key demand generators).
This page intentionally left blank.


