Guide on Methods for Assigning Counts to Adjustment Factor Groups (2024)
Chapter: Appendix D: K-Prototypes Example

APPENDIX D
K-Prototypes Example
This appendix provides an example on how to apply the k-prototypes clustering algorithm in R, which is an open-source programming language that is mainly used for data processing and statistical analysis. The k-prototypes is a partitioning clustering algorithm that can handle both numerical and categorical variables. A step-by-step example of employing the k-prototypes algorithm to develop clusters of CCSs is presented below. In this example, the 12 monthly adjustment factors of each CCS are used as numerical variables, and the functional class combined with the rural/urban area type of each CCS is used as a categorical variable.
Step 1: Install and load packages in R.
R Code:
- install.packages(“data.table”)
- install.packages(“clustMixType”)
- library(data.table)
- library(clustMixType)
Line 1 installs package “data.table,” which is used to import data tables into R. Line 2 installs the “clustMixType” package, which is used to implement the k-prototypes algorithm. Line 3 and line 4 load these two packages in R.
Step 2: Prepare a CSV table containing the independent variables (12 monthly adjustment factors and the FC_RU code) and import it into R as a data frame.
The next step is to prepare a table (see Table D-1) that includes the 12 monthly adjustment factors and the FC_RU code of each CCS.
R Code:
- X = fread(“factor_file.csv”)
- X[, 2:13] = lapply(X[, 2:13], as.numeric)
- X$FC_RU = as.factor(X$FC_RU)
After preparing and saving the table “My_data” as a CSV file, import it into R as a data frame, denoted as X, using the code in line 5. Line 6 sets the columns corresponding to the 12 monthly factors as type “numeric.” Line 7 sets the attribute “FC_RU” as type “factor” (i.e., categorical variable).
Step 3: Use the k-prototypes to develop clusters based on data frame X.
R Code:
- X = X[,-c(“CCS #”)]
- kpres = kproto(X, k = 3, iter.max = 200, lambda)
Table D-1. Table containing independent numerical and categorical variables.
| CCS # | MF1 | MF2 | MF3 | MF4 | … | MF10 | MF11 | MF12 | FC_RU |
|---|---|---|---|---|---|---|---|---|---|
| 1 | 0.98 | 1.22 | 0.87 | 1.24 | … | 1.14 | 0.67 | 0.89 | 1R |
| 2 | 1.02 | 1.04 | 1.54 | 1.32 | … | 1.43 | 0.78 | 0.99 | 2U |
| 3 | 1.09 | 0.89 | 1.15 | 1.12 | … | 1.03 | 1.22 | 1.01 | 2R |
| 4 | 0.98 | 1.02 | 0.96 | 1.02 | … | 1.03 | 0.99 | 0.89 | 3U |
| … | … | … | … | … | … | … | … | … | … |
Before executing code line 9 to develop clusters using the k-prototypes algorithm, it is necessary to utilize code line 8 to remove the first column of the data frame because it is unrelated to the algorithm. Function “kpres” in code line 9 requires several arguments:
- X: The data frame containing both numerical and categorical attributes for clustering.
- clu: The total number of clusters, determined by the user based on how many CCS groups the algorithm should develop.
- iter.max: The total number of iterations. This argument sets the maximum number of iterations; if convergence is reached before reaching the maximum value, the algorithm will stop early.
- lambda: This argument serves as a tradeoff between the Euclidean distance of numeric variables and the simple matching coefficient between categorical variables. In other words, the lambda value determines the weight the algorithm should assign to the categorical attribute. A larger value of lambda indicates an emphasis on the categorical attribute, while a smaller value indicates a stronger focus on the numerical attribute. The equation for determining the value of lambda is:
(23) Where:
N = the number of numerical attributes (N = 12 in this example).
p = the weight (in percentage) that the k-prototypes algorithm assigns to the categorical attribute. For example, if p is equal to 30 percent, the algorithm develops the clusters by assigning 30 percent to the categorical attribute and the remaining 70 percent to the numerical attributes.
Step 4: Obtain the cluster assignment of each CCS from the output of the k-prototypes algorithm and bind them to data frame X.
R Code:
- cluster = kpres$cluster
- cluster = as.data.frame(cluster)
- X = cbind(X, cluster)
Line 10 extracts the clustering results from “kpres” and names them as “cluster.” Line 11 converts “cluster” into a data frame type. Line 12 adds the clustering results to the data frame X. As a result, the data frame X now resembles Table D-2.
Step 5: Present the results of the k-prototypes clustering algorithm.
In this example, the k-prototypes algorithm is executed twice using two different lambda values. The first lambda value is calculated, following Equation 23, as , indicating that the algorithm develops clusters by assigning 1 percent to the categorical attribute, FC_RU, and
99 percent to the 12 monthly factors, with each monthly factor having a weight of 8.25 percent (=99/12). The second lambda value is calculated as , indicating that the k-prototypes algorithm assigns 50 percent to the FC_RU code and another 50 percent to the 12 monthly factors.
Table D-2. Output table generated by the k-prototypes algorithm.
| CCS # | MF1 | MF2 | MF3 | MF4 | … | MF10 | MF11 | MF12 | FC_RU | Cluster |
|---|---|---|---|---|---|---|---|---|---|---|
| 1 | 0.98 | 1.22 | 0.87 | 1.24 | … | 1.14 | 0.67 | 0.89 | 1R | 1 |
| 2 | 1.02 | 1.04 | 1.54 | 1.32 | … | 1.43 | 0.78 | 0.99 | 2U | 2 |
| 3 | 1.09 | 0.89 | 1.15 | 1.12 | … | 1.03 | 1.22 | 1.01 | 2R | 2 |
| 4 | 0.98 | 1.02 | 0.96 | 1.02 | … | 1.03 | 0.99 | 0.89 | 3U | 3 |
| … | … | … | … | … | … | … | … | … | … |
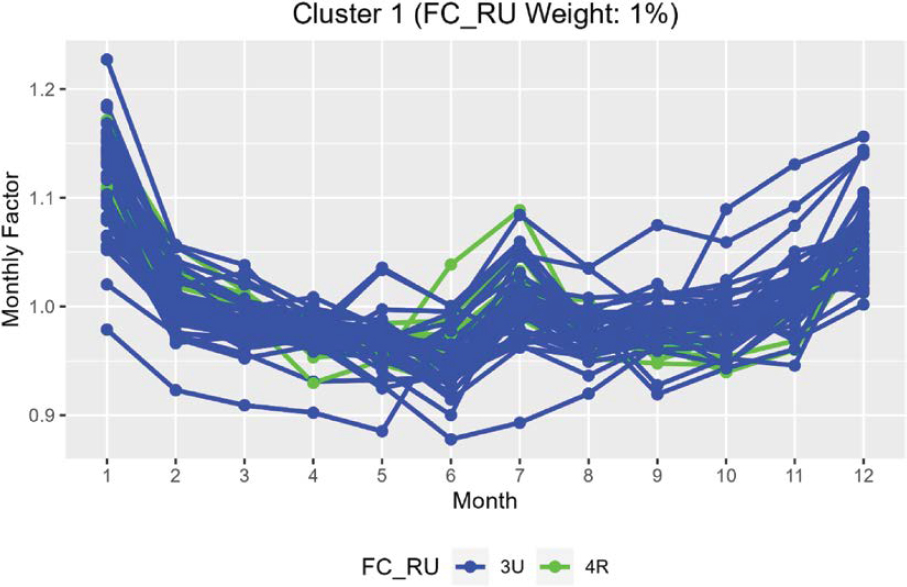
The first time clustering is executed, the lambda value in code line 9 is set to 0.12, and the k value is set to 2. The 12 monthly factors of CCSs in Clusters 1 and 2 are plotted in Figure D-1 and Figure D-2, respectively. Specifically, Cluster 1 includes CCSs from 3U and 4R, while Cluster 2 contains CCSs of all three functional classes (3U, 3R, 4R) included in this sample dataset. This indicates that the k-prototypes algorithm primarily develops clusters based on the 12 monthly factors with a slight dependence on the FC_RU code.
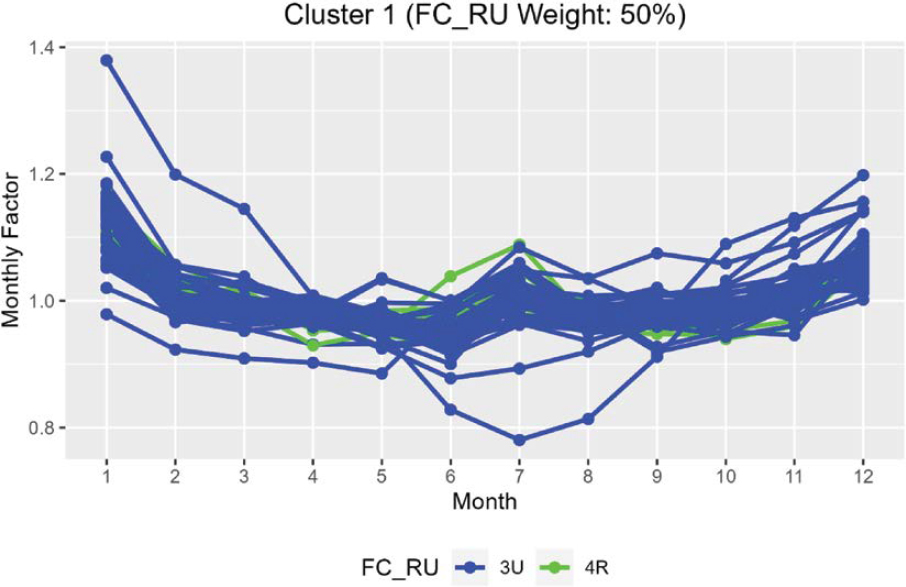
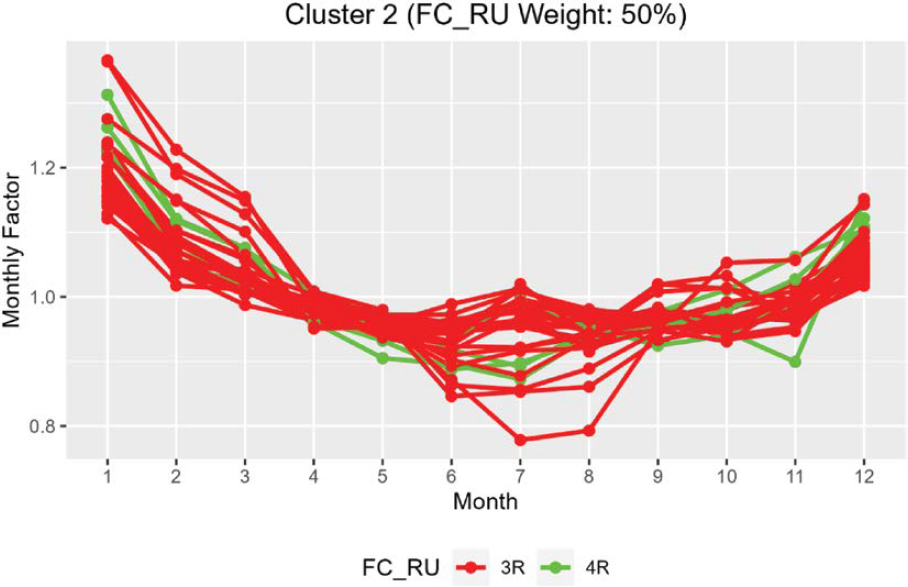
The second time clustering is executed, the lambda value in code line 9 is set to 12, and the k value is set to 2. The 12 monthly factors of CCSs in Clusters 1 and 2 are plotted in Figure D-3 and Figure D-4, respectively. Cluster 1 includes CCSs from 3U and 4R, but Cluster 2 contains CCSs from 3R and 4R. It is evident that after increasing the weight assigned to the FC_RU code, the latter played a more important role in the development of the two clusters.

This page intentionally left blank.
Abbreviations and acronyms used without definitions in TRB publications:
| A4A | Airlines for America |
| AAAE | American Association of Airport Executives |
| AASHO | American Association of State Highway Officials |
| AASHTO | American Association of State Highway and Transportation Officials |
| ACI–NA | Airports Council International–North America |
| ACRP | Airport Cooperative Research Program |
| ADA | Americans with Disabilities Act |
| APTA | American Public Transportation Association |
| ASCE | American Society of Civil Engineers |
| ASME | American Society of Mechanical Engineers |
| ASTM | American Society for Testing and Materials |
| ATA | American Trucking Associations |
| CTAA | Community Transportation Association of America |
| CTBSSP | Commercial Truck and Bus Safety Synthesis Program |
| DHS | Department of Homeland Security |
| DOE | Department of Energy |
| EPA | Environmental Protection Agency |
| FAA | Federal Aviation Administration |
| FAST | Fixing America’s Surface Transportation Act (2015) |
| FHWA | Federal Highway Administration |
| FMCSA | Federal Motor Carrier Safety Administration |
| FRA | Federal Railroad Administration |
| FTA | Federal Transit Administration |
| GHSA | Governors Highway Safety Association |
| HMCRP | Hazardous Materials Cooperative Research Program |
| IEEE | Institute of Electrical and Electronics Engineers |
| ISTEA | Intermodal Surface Transportation Efficiency Act of 1991 |
| ITE | Institute of Transportation Engineers |
| MAP-21 | Moving Ahead for Progress in the 21st Century Act (2012) |
| NASA | National Aeronautics and Space Administration |
| NASAO | National Association of State Aviation Officials |
| NCFRP | National Cooperative Freight Research Program |
| NCHRP | National Cooperative Highway Research Program |
| NHTSA | National Highway Traffic Safety Administration |
| NTSB | National Transportation Safety Board |
| PHMSA | Pipeline and Hazardous Materials Safety Administration |
| RITA | Research and Innovative Technology Administration |
| SAE | Society of Automotive Engineers |
| SAFETEA-LU | Safe, Accountable, Flexible, Efficient Transportation Equity Act: A Legacy for Users (2005) |
| TCRP | Transit Cooperative Research Program |
| TEA-21 | Transportation Equity Act for the 21st Century (1998) |
| TRB | Transportation Research Board |
| TSA | Transportation Security Administration |
| U.S. DOT | United States Department of Transportation |