LTPP Data Analysis: Improving Use of FWD and Longitudinal Profile Measurements (2024)
Chapter: Guidelines for Determining Impacts of Curl and Warp on Jointed Plain Concrete Pavements
Guidelines for Determining Impacts of Curl and Warp on Jointed Plain Concrete Pavements
1. | SCOPE |
1.1. | The following outlines an approach for quantifying the impacts of changes in jointed plain concrete pavement (JPCP) slab curvature and resulting curl and warp. Detailed specifications for equipment or instruments used to collect the longitudinal profile data are not included in this method. |
2. | TERMINOLOGY |
2.1. | 2GCI—Second Generation Curvature Index method. |
2.2. | Curl and warp—concrete slab distortion into an upward or downward curved shape due to changes in temperature and moisture gradients. |
2.3. | Inertial profiler—the combination of the profiling equipment and the host vehicle (AASHTO M 328). |
2.4. | International Roughness Index (IRI)—“The quarter-car vehicle filter calculates the suspension deflection of a simulated mechanical system with a response similar to a passenger car. The simulated suspension motion is accumulated and divided by the distance traveled to give an index with units of slope (e.g., in./mi) (Sayer and Karamihas 1998).” |
2.5. | Profile—two-dimensional slide of the roadway surface, taken along an imaginary line, such as the wheel path, in the longitudinal or travel direction. It represents the perpendicular deviations of the pavement surface from an established reference parallel to the horizontal (AASHTO M 328). |
2.6. | Pseudo strain gradient (PSG)—strain needed to deform a slab’s shape. |
2.7. | Temperature (or moisture) gradient—difference in temperature (or moisture) between the top and the bottom of a concrete slab. |
2.7.1. | Negative gradient—slab surface is colder (or wetter) than the bottom of the slab. |
2.7.2. | Positive gradient—slab surface is warmer (or drier) than the bottom of the slab. |
2.8. | Thermal expansion—change of length due to a change in temperature. Measured in accordance with the coefficient of thermal expansion (AASHTO T 336). |
3. | SIGNIFICANCE AND USE |
3.1. | Temperature gradient plays a significant role in the daily curl of a JPCP slab. During the warming period of the day, the top of the slab is warmer than the bottom, and the difference |
in thermal expansion causes the slab to curl downward. In contrast, during the cooling period of the day, the bottom of the concrete slab is warmer than the top, which causes the slab to curl upwards. The degree of curling and warping increases as the temperature gradient increases. Slab curling and warping can result in a loss of support at the slab corners and slab center, and when combined with the weight of the slab and traffic loading, can contribute to cracking or slab failure. | |
3.2. | A moisture gradient can also result in JPCP slab volume changes and cause curl and warp. Typically, the top of the JPCP slab is partially saturated while the bottom is close to saturation, which can result in cracking, especially when combined with a negative (daytime) temperature gradient. |
3.3. | Daily temperature variations of longitudinal profile measurements can significantly influence the computed IRI. For asphalt pavements, the daily and seasonal temperature changes can accelerate distress progression (e.g., rutting, thermal cracking, top-down cracking, bottom-up cracking, and IRI). For concrete pavements, high-temperature gradients can result in differential volume changes, and result in curl and warp, negatively impacting ride quality and potentially increasing slab cracking. |
4. | TESTING PLAN |
4.1. | Longitudinal profile testing should be conducted over a given day (or at different seasons) to capture changes in slab curvature associated with changes to temperature or moisture gradients. |
4.1.1. | At least four visits should be conducted over a given day, during different seasons, or both. |
5. | DATA COLLECTION |
5.1. | Each agency should designate the lane(s) and direction(s) of travel to be tested. |
5.1.1. | Determine applicable (e.g., tangent sections) and appropriate (e.g., typical existing pavement condition) location(s) for testing. |
5.1.2. | Accurately identify the location in the field. The same section location should be tested during each site visit and pass. |
5.2. | Test on a clear, sunny day followed by a clear night (attempting to obtain the maximum temperature gradient). |
5.2.1. | Note ambient and surface temperatures. |
5.2.2. | Conduct testing 2 to 3 hours before sunrise, and between 8 a.m. to 10 a.m., 1 p.m. to 3 p.m., and 5 p.m. to 7 p.m. |
5.3. | Longitudinal profile measurements—Conduct inertial profiler testing in accordance with AASHTO M 328, AASHTO PP 37, AASHTO R 43, AASHTO R 54, AASHTO R 56, AASHTO R 57, ASTM E950, ASTM E1926, and/or agency requirements. |
5.3.1. | Conduct five or more consecutive passes at a consistent and higher speed (e.g., posted speed limit). |
5.3.2. | Note non-typical pavement features or events (e.g., bridges, intersections, manholes, project start location, project stop location). |
5.3.3. | Store data from each pass in a separate data file. |
|
6. |
EVALUATE SLAB CURVATURE USING THE 2GCI METHOD |
||||||||||||
|
6.1. |
The details of this evaluation method can be found in Karamihas and Senn 2012 and Karamihas et al. 2023. |
||||||||||||
|
6.2. |
Identify the transverse joint locations. |
||||||||||||
|
6.2.1. |
For each profile pass conducted on each section, use a high-pass filter with normalized profile to identify joint locations (Figure 1). |
||||||||||||
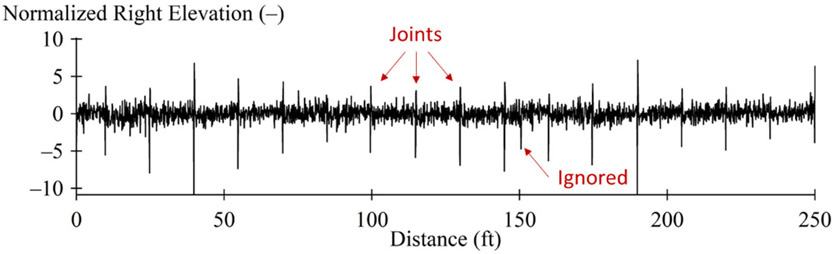
Note: In some cases, downward spikes that do not fit the expected joint spacing are ignored, such as the spike at 150 feet. |
|||||||||||||
|
6.3. |
Fit each slab profile to an assumed slab shape. |
||||||||||||
|
6.3.1. |
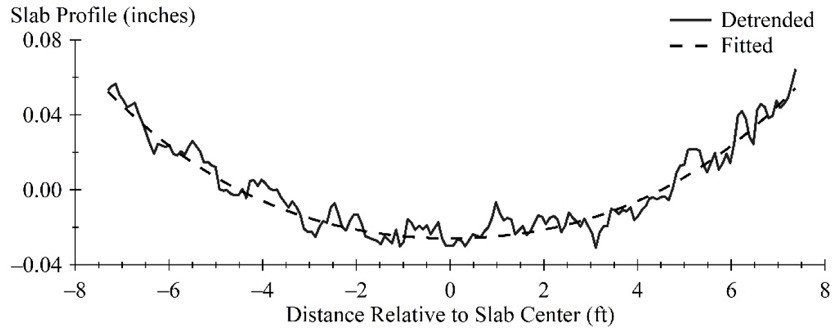
Extract the pavement profile for each slab. |
||||||||||||
|
6.3.2. |
Estimate the radius of relative stiffness value:
where,
|
||||||||||||
|
6.3.3. |
For each slab, detrend the profile, offset it vertically so the mean evaluation is zero, and apply a curve fitting procedure based on the Westergaard equation.
where,
The Westergaard equation results are shown as the “fitted” line in Figure 2. |
|
|||||||||||
|
6.4. |
Aggregate the PSG values for each profile measurement. |
||||||||||
|
6.4.1. |
Assemble a weighted average of the PSG values of individual slabs. Weight each PSG value by the portion of the slab length that appears within the test section boundaries. |
||||||||||
|
6.4.2. |
If repeated passes from each visit are available, average the segment-wide PSG values from each profile. |
||||||||||
|
6.5. |
Calculate the average IRI values for each wheel path for each visit. |
||||||||||
|
6.6. |
Establish the relationship between IRI and PSG. |
||||||||||
|
6.6.1. |
Relate changes in IRI to changes in PSG using passes collected over a short time interval under varying environmental conditions. Significant changes in curl and warp are needed to get useful information in this step. |
||||||||||
|
6.6.2. |
Fit the following equation to observations of IRI versus PSG:
where,
|
||||||||||
|
6.6.3. |
The dIRI/dPSG and IRIBack values are outputs of the fitting equation. The value of dIRI/dPSG is used to infer the value of IRIBack for other visits based on the PSG. Figure 3 illustrates the application of Equation 4 for the left and right wheel paths for seven visits to LTPP Section 39-0204 between November 12, 1998, and October 20, 1999. |
||||||||||

|
|||||||||||
|
6.7. |
Apply the IRI-PSG relationship to other visits. |
||||||||||
|
6.7.1. |
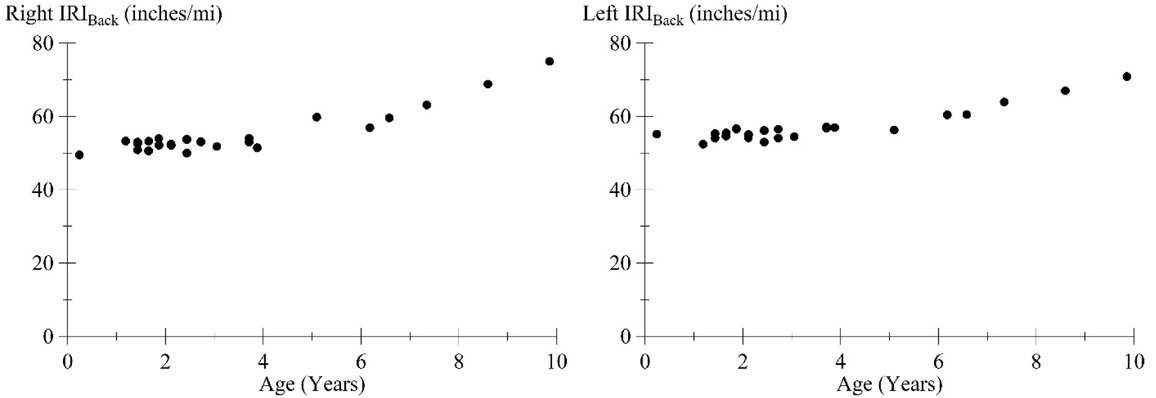
Once the estimate of dIRI/dPSG is obtained, it is used to remove the influence of curl and warp from the IRI measured in other visits. That is, the following equation is applied to obtain IRIBack from each visit:
where,
|
||||||||||
|
6.7.2. |
Figure 4 illustrates an example of the right IRIBack and left IRIBack wheel path values versus pavement age. This represents the long-term trend in roughness not associated with curl and warp. Examination of Figure 4 may reveal changes in roughness caused by distress more readily than examining overall IRI. |
||||||||||
 | |
7. | KEYWORDS |
7.1. | Curl and warp, IRI, longitudinal profile testing, JPCP, Second Generation Curvature Index, pseudo strain. |
8. | REFERENCED DOCUMENTS |
8.1. | AASHTO M 328, Standard Specification for Inertial Profiler. |
8.2. | AASHTO PP 37, Standard Practice for Determination of International Roughness Index (IRI) to Quantify Roughness of Pavements. |
8.3. | AASHTO R 43, Standard Practice for Quantifying Roughness of Pavements. |
8.4. | AASHTO R 54, Standard Practice for Accepting Pavement Ride Quality When Measured Using Inertial Profiling Systems. |
8.5. | AASHTO R 56, Standard Practice for Certification of Inertial Profiling Systems. |
8.6. | AASHTO R 57, Standard Practice for Operating Inertial Profiling Systems. |
8.7. | ASTM E950, Standard Test Method for Measuring the Longitudinal Profile of Traveled Surfaces. |
8.8. | ASTM E1926, Standard Practice for Computing International Roughness Index of Roads from Longitudinal Profile Measurements. |
8.9. | Karamihas, S. M. and K. Senn. Curl and Warp Analysis of the LTPP SPS-2 Site in Arizona. FHWA-HRT-12-068. Federal Highway Administration, McLean, VA, 2012. |
8.10. | Karamihas, S. M., T. Punnackal, N. Dufalla, and K. Senn. Advancement of Profile-Based Curl and Warp Analysis Using LTPP Profile Data. FHWA-HRT-20-066. Federal Highway Administration, McLean, VA, 2023. |
8.11. | Sayers M. W. and S. M. Karamihas. Little Book of Profiling. University of Michigan Transportation Research Institute, 1998. |


