Load Rating of Segmental Bridges (2024)
Chapter: Appendix A: Literature Review
APPENDIX A
Literature Review
A.1 Load Rating State-of-the-Art Review (AASHTO MBE)
Table A-1 contains insights and MBE articles on provisions for segmental bridges.
Table A-1. AASHTO MBE provisions regarding segmental bridges.
| Insights | MBE Articles |
|---|---|
| In the inspection of prestressed segmental bridges, AASHTO MBE Section 4.3.6.5 emphasizes a number of points to be examined closely. | Pay particular attention to the profile of the roadway surface, done by sighting the top of railing or edge of deck. Humps or sags of an entire span length are evidences of long-term creep of tendons or concrete not anticipated in the original design. Localized sags or humps are indications of problems deserving closer inspection to see if there has been a failure of prestressing units or their anchorages. Such an inspection requires entry into the box sections and examination of the interior anchorages. Prestressing tendons may also be susceptible to corrosion due to issues with moisture trapped within the tendon ducts. This requires specialized expertise and equipment to evaluate. Closely examine the areas around the keys in the girder stems and the slabs for cracks, particularly at interlocking corners. Inspect the deck soffit for cracks and spalls and for evidences of water leakage through cracks or joints. |
| In the evaluation of segmental bridges, temperature gradient, TG, may be considered. | C6A.2.3.6 Where temperature effects are considered, a reduced long-term modulus of elasticity for concrete maybe used in the analysis. Temperature gradient. TG, may be considered when evaluating segmental bridges. |
| In the rating of segmental concrete bridges, load rating capacity is checked in the longitudinal and transverse directions since the transverse effect may govern. | 6A.5.11.2―General Rating Requirements The load-rating capacity of post-tensioned concrete segmental bridges shall be checked in the longitudinal and transverse directions. |
| Insights | MBE Articles |
|---|---|
|
For the transverse operating load ratings, Section 6A.5.11.3 states that the factor of 1.20 specified in LRFD Design Table 3.6.1.1.2-1 for one loaded lane for the application of vehicular live load shall be limited to the maximum of 1.00.
Reason: Axle loads govern the transverse design of the slab for such bridges, and the amplification of individual axle load is not suitable for the single-lane condition. | 6A.5.11.3―Application of Vehicular Live Load For the transverse operating load ratings of the top slab of segmental concrete box girders, the factor of 1.20 specified in LRFD Design Table 3.6.1.1.2-1 for one loaded lane shall be limited to a maximum of 1.00. |
|
In the design load rating, the Strength I and both the Service I and Service III limit states shall be checked.
At service limit state, the number of striped lanes might be used as the number of live load lanes for operating rating of design load to calibrate the service limit states and differentiate the operating rating from the inventory rating. Principal tensile check shall be performed at Service III limit state to verify the adequacy of webs of segmental box girder bridges for longitudinal shear and torsion. | 6A.5.11.4―Design-Load Rating The Strength I and both the Service I and the Service III limit states shall be checked for the design-load rating of segmental concrete bridges. For operating rating of the design load at the service limit state, the number of live load lanes may be taken as the number of striped lanes. However_ loads shall be positioned so as to create maximum effects, for example. on shoulders if necessary. For segmental concrete bridges, the Service III limit state specifically includes the principal tensile stress check of LRFD Design Article 5.9.2.3.3. |
|
Similarly, both the Service I and Service III limit states are mandatory for legal and permit load rating.
At service limit state, the number of striped lanes might be used as the number of live load lanes for operating rating of design load to calibrate the service limit states and differentiate the operating rating from the inventory rating. Principal tensile check shall be performed at Service III limit state to verify the adequacy of webs of segmental box girder bridges for longitudinal shear and torsion. | 6A.5.11.5.1―Legal Load Rating Both the Service I and Service III limit states are mandatory for legal load rating of segmental concrete box girder bridges. For these service limit state checks. the number of live load lanes may be taken as the number of striped lanes. However. the loads shall be positioned so as to create maximum effects, for example. on shoulders if necessary. For segmental concrete box girder bridges, the Service HI limit state specifically includes the principal tensile stress check of LRFD Design Article 5.9.2.3.3. 6A.5.11.5.2―Permit Load Rating Both the Service I and Service HI limit states are mandatory for permit load rating of segmental concrete box girder bridges. For these service limit state checks, the number of live load lanes may be taken as the number of striped lanes. However, loads shall be positioned so as to create maximum effects, for example. on shoulders if necessary. For segmental concrete box girder bridges, the Service HI limit state specifically includes the principal tensile stress check of LRFD Design Article 5.9.2.3.3. |
|
AASHTO MBE Section 6A.5.11.6 provides Table 6A.5.11.6-1 for the system factors for post-tensioned segmental concrete box girder bridges.
The system factor shall be taken as 1.0 for the longitudinal shear and torsion, transverse flexure, and punching shear of segmental concrete box girder bridges. The longitudinal shear and torsion capacity shall be evaluated for design load, legal load, and permit load rating for post-tensioned segmental bridges. | See Table 2-1. |
A.2 Calibration of LRFD Concrete Design Service
Cracking of Reinforced Concrete Components Service I Limit State
The original service limit state from AASHTO’s Standard Specifications for Highway Bridges (AASHTO 2002) is to limit the concrete crack width, and there was no evidence to change these evaluation criteria. As a result, the study was based on keeping the present crack width data and calibrating the limit state to provide a uniform reliability index that was similar to the current average reliability index. The crack width is limited to 0.017 in. and 0.01275 in. for Class 1 and Class 2 exposure conditions, respectively.
To evaluate the safety level of the current LRFD, a set of bridge decks with varied girder spacings and deck thicknesses were designed using the AASHTO LRFD (2020a). The statistical parameters of variables included in the design were largely adopted from previous research (Naaman and Siriaksorn 1982; Nowak et al. 2008). In this study, the live load statistics were derived in terms of the axle weights. Extrapolations were performed for different ADTT and different return periods.
The concrete deck can be controlled by either strength limit state or Service I limit state. The Service I limit state is frequently controlling the negative moment region. As a result, the reliability indices for the negative moment region are thought to be typical of the real reliability indices that would be determined if all limit states, including Strength I, were considered in the design. The target reliability indices were chosen to be 1.6 and 1.0 for Class 1 and Class 2, respectively, based on the ADTT of 5,000.
The Monte Carlo simulation was used to generate thousands of iterations of each variable, and the final reliability index was calculated using Eq. (6-27), where β is reliability index, µR is the mean value of the resistance, µQ is the mean value of the applied loads, σR is the standard deviation of the resistance, and σQ is the standard deviation of the applied load. As the current LRFD specification produces uniform reliability indices around the target value, this study does not necessitate any revisions to the AASHTO LRFD related to the crack control limit state (i.e., Service I limit state).
Tension in Prestressed Concrete Beam Service III Limit State
The following three limit state functions were investigated:
- Decompression limit state: This limit state assumes that failure occurs when the stress in the concrete on the tension face computed based on the uncracked portion ceases to be compression due to the combined influence of factored dead load and live load.
- Stress limit state: This limit state assumes that failure occurs when the tensile stress in the concrete on the tension face calculated based on the uncracked section exceeds a certain tensile stress limit calculated based on the uncracked section properties under the combined effect of factored dead load and live load, regardless of whether the section has been previously cracked.
- Crack width limit state: This limit state assumes that failure occurs when a previously established crack in the concrete opens and reaches a pre-specified crack width.
To evaluate the safety level of the existing prestressed concrete element, the study referred to a database of existing prestressed concrete girder bridges from NCHRP Report 700: A Comparison of AASHTO Bridge Load Rating Methods (Mlynarski et al. 2011). The statistical parameters of variables included in the design were adopted from previous research (Gross 2000; Naaman and Siriaksorn 1982; Nowak et al. 2008; Tadros et al. 2003). The live load statistics were derived in terms of the live load moment on the girder. The bias factor is calculated by using the mean maximum load effect ratio increased by a 1.5 standard deviation to account for the loss of randomness of the WIM site selections.
Table A-2. Relation between limiting criteria and reliability index.
| Limiting Criteria | Live Load Required to Violate the Limiting Criterion | Frequency of Exceeding the Limiting Criterion | Reliability Index |
|---|---|---|---|
| Decompression | Lowest | Highest | Lowest |
| Maximum allowable tensile stress limit | Middle | Middle | Middle |
| Maximum allowable crack width limit state | Highest | Lowest | Highest |
Based on the existing bridge database, the study compared the required load and the corresponding reliability index for each limit state, as shown in Table A-2.
In addition to the existing bridge database, the study also designed for a series of new bridges in accordance with the two maximum concrete tensile stress limits. Various span lengths and girder spacings are enveloped by the database. These bridges were redesigned six times taking into account the following parameters:
- Live load factor = 0.8 or 1.0.
- Tensile strength limit .
The same methodology deployed by the Service I limit state was used here to compute the reliability indices. The reliability indices were computed for each design case. Despite the maximum tensile stress limit used in the design, the maximum tensile stress limiting criteria for calculating the reliability index was set at in ksi.
In all, the reliability indices revealed the following conclusions:
- The maximum level of uniformity was found in the decompression limit state, which is recommended to be used as the basis for the reliability analysis.
- The reliability indices are not sensitive to ADTT.
- The target reliability index is chosen to be similar to the average inherent reliability index of the existing bridges due to their satisfactory performance.
- It is recommended to use a live load factor of 1.0 for Service III limit state. The concrete tensile stress of and are recommended for bridges in severe corrosion conditions and for bridges in moderate corrosion conditions, respectively.
A.3 Deterioration of Segmental Bridges
Segmental and post-tensioned bridges most likely have high structural performance. Deterioration for such bridges have been mostly related to the corrosion of tendons, cracks due to temperature gradients, or early age failure of tendons (Roberts 1993; Trejo et al. 2009). Material-wise, it is known that concrete deterioration due to environmental conditions or time-dependent material behavior, such as creep, shrinkage, and relaxation, are widely seen in concrete bridges. Based on the response of the Wisconsin DOT to a questionnaire conducted to reveal common deterioration issues and repair techniques, concrete deterioration was reported as the major problem. Based on the survey, the top five types of concrete deterioration are cracking, delamination, spalling, rebar corrosion, and scaling (Ainge 2012). Furthermore, Virmani (2003)
stated that the major reason for concrete deterioration (i.e., cracking, delamination, and spalling) is the corrosion of embedded black steel reinforcing bars that results from the bars being exposed to chloride ions produced by moisture and oxygen. Also, Roelfstra et al. (2004) stated that by far the most common deterioration mechanism in Switzerland is chloride-induced corrosion of steel reinforcement. Similarly, post-tensioning tendon corrosions have been seen in North America, such as in several bridges in Florida (West et al. 2002). The Durability Survey of Segmental Concrete Bridges conducted by the ASBI (Pielstick and Offredi 2012) showed that about 2% of segmental bridges, located in Indiana, Minnesota, Florida, Connecticut, and other states, built after 1970, are structurally deficient. ASBI’s investigations revealed excessive chloride penetration with complete loss of rebar and post-tensioning when drainage systems failed in Indiana and Minnesota. Also, aggressive marine environmental conditions resulted in low condition ratings in Florida, and excessive deck cracking resulted in deterioration, and consequently, low condition ratings in Connecticut. Bridges such as the Newmark Viaduct in New Zealand, the Fourth Danube Bridge in Vienna, and the Jagst Bridge in Untergreisheim have cracked due to temperature gradient (Roberts 1993).
The deterioration of concrete bridges due to the corrosion of steel reinforcement or tendons is progressive and connected to concrete defects, such as concrete cracking or spalling. In prestressed concrete, the presence of high stresses in tendons alters the corrosion process, which is characterized by the coupling between conventional corrosion and steel microcracking (induced by high stress level and hydrogen embrittlement) (Coronelli et al. 2009). The reasons for post-tensioning corrosion might be voids and moisture between strands and between wires; water bleeding from grout; grout segregation; water penetration from anchorage pocket, joints, or cracks; water penetration due to floods; chloride-contaminated grout; soft grout and high corrosive ion concentration; and dissimilar types of grout in the same tendon (Haixue and Whitmore 2013). Grouting protects strands from harsh environmental conditions, such as rainwater, seawater, salt-fog, and deicing salt, and enhances the compatible strain between concrete and strand. In prestressed concrete precast post-tensioned segmental bridge decks, the voids and the water that often exist in the ducts result in local rusting of tendons (Kamaitis 2002). Corrosion of tendons might be crucial because it is a long-term problem that can cause a sudden failure. The collapse of the Bickton Meadows Bridge in the United Kingdom in 1967 was the first serious case of corrosion of a bonded post-tensioned bridge. The bridge was only 15 years old (Poston and Wouters 1998). Ynys-y-Gwas Bridge, which is a single-span segmental post-tensioned concrete bridge located in South Wales, collapsed in 1985 when the bridge was 32 years old. The failure was found to be corrosion of tendons that passed through the segmental joints. It was determined that tendons were not adequately protected at the joints, which resulted in exposure to chlorides. It was also supposed that dune sand had been included in the mortar filling the transverse joints (Woodward 1989). According to Poston and Wouters (1998), in the United States, the post-tensioned Walnut Lane Bridge was found to have corrosion problems due to improper grouting and detailing. However, it was stated that in North America, there have been no problems with the corrosion of precast segmental structures except for a few cases that had inadequate construction practices rather than intrinsic deficiencies. Powers et al. (2002) conducted a study about the failures of the Niles Channel Bridge and the Mid-Bay Bridge in Florida due to corrosion distress and post-tensioned tendon failure. They stated that the presence of grout voids and visual evidence of grout bleed water initiated the corrosion. Laboratory tests were conducted to examine the corrosion aspects of grout bleed water and recharge water that came in contact with dissimilar metals, including the tendon and anchorage system. Preliminary results indicate that high-strength post-tensioned strands become anodic relative to the anchorage system when exposed to either grout bleed water or recharge water. Another case was the failure of the Malle Bridge in Belgium without warning due to corrosion of post-tensioning through the hinged joint of the end tie-down member (Youn and Kim 2006).
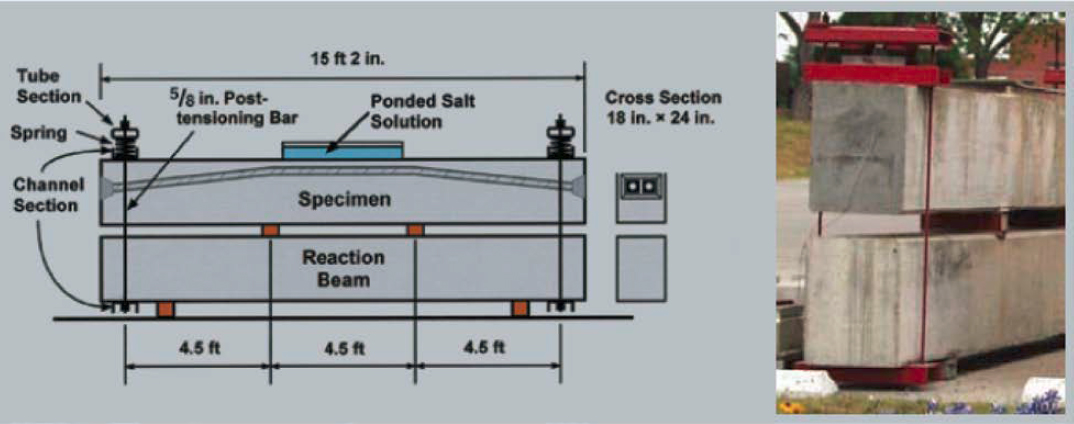
The effect of strand corrosion on structural behavior has been investigated by researchers through experimental testing and analytical models. Zhang et al. (2017) evaluated the behavior of locally ungrouted post-tensioned concrete beams after corrosion of strands by performing corroded strand tests for the constitutive law development and beam tests for the flexural behavior investigation. It was observed that the effect of corrosion loss on the yield strength and elastic modulus was less than that on the ultimate strain of strand. Salas et al. (2008) investigated the corrosion protection of internal tendons at segmental joints by using the testing method based on ASTM G109. They fabricated beam specimens to observe effects of post-tensioning and crack width on corrosion protection of internal tendons. The experimental setup is given in Figure A-1. In general, severe duct destruction and pitting were observed in most of the specimens with metal ducts. Haixue and Whitmore (2013) listed the methods in post-tensioning evaluation as visual inspection/test pits, PT corrosion evaluation by moisture testing, chloride analysis of PT grout, pH and chemical testing, petrographic analysis, scanning electron microscopy examination, and cable break detection.
Hatami et al. (2011) developed deterioration models for the three main bridge components (deck, superstructure, substructure) of Nebraska bridges by considering deterioration factors, such as the impact of structure type, deck type, wearing surface, deck protection, ADT, ADTT, and highway district, using visual inspection data from 1998 to 2010. Moomen et al. (2016) developed deterministic and probabilistic deterioration models (or curves) for bridge decks, superstructures, and substructures using the NBI database to support Indiana’s Bridge Management System. The climate variables of freeze index, number of freeze-thaw cycles, and average precipitation were found to be significant parameters for several deterioration models, and for deck and substructure especially. Purvis et al. (1992) developed various performance and deterioration models representing a numerical simulation of data collected on populations of bridges using NBI numerical condition ratings. However, it has been stated that because NBI condition ratings are generally based on a visual inspection, they would not detect a corrosion problem until significant concrete spalling could be seen. Naderimoghaddam (2018) stated that deterioration models are currently presented for a specific bridge component but not for the sufficiency rating. He introduced two models—the mixed logistics-gamma model and the Poisson model—to predict the change in the sufficiency rating of a bridge. The former one was found to be a better model.
The corrosion progress of steel wires in external tendons contaminated by water with high chloride content from the outside of a bridge was modeled by Yoo et al. (2018). Existing corrosion-progress models and proposed models were compared. In one of the existing corrosion-progress methods, the corrosion model for rebars introduced by Val and Melchers (1997) was modified to simulate pitting corrosion in wires since the shape of rebars and wires are similar (Darmawan and Stewart 2007; Guo et al. 2011). The model assumed that pits have a hemispherical form fixing at the top, and that corrosion progresses radially. In this model, the corroded area (ASL,1) can be calculated by using the maximum corrosion depth (p) as follows:
where r = radius of wire, p = maximum corrosion depth, and θ1 and θ2 = functions of p defined as:
In another corrosion model developed by Hartt and Lee (2016), it was assumed that corrosion progresses in a planar shape, and the shape of the corroded area is diffused over the entire surface of the wire. The corroded area (ASL,2) can be defined in terms of p as follows:
where r = radius of wire and θ1 = function of p defined as follows:
The model proposed by Yoo et al. (2018) provided a better estimate of section loss corresponding to the maximum corrosion depth. It assumed a rounded corrosion surface with the center fixed at the perimeter of the wire. The corroded area (ASL,3) can be defined in terms of p as follows.
where s = 2r-p and θ1 and θ2 = functions of s and r defined as:
Since reaching the maximum corrosion depth requires a large number of measurements, measuring the corrosion perimeter by inserting an endoscope or a borescope into the tendon might be an alternative (Yoo et al. 2018). Another model, identical to the first proposed model but which has different definitions for θ1, θ2, and s was proposed considering the relationship between the corrosion perimeter and the maximum corrosion depth as follows. It was shown
that the proposed methods are effective to estimate section losses based on measurements of maximum corrosion depth and perimeter.
Jeon et al. (2019) proposed the following equations to calculate the loss of sectional area for three different types of pit configurations, which were obtained from the observation of real corroded strands.
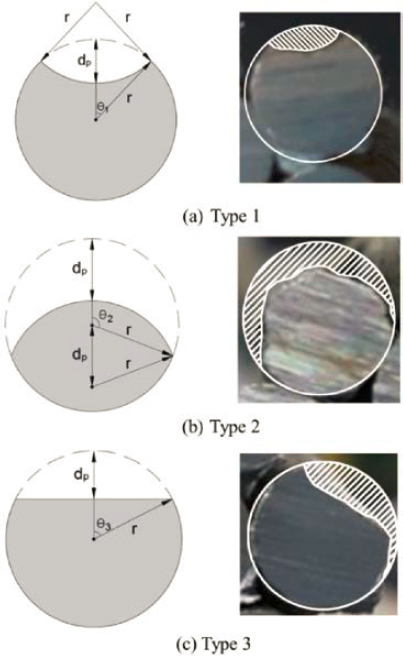
Where ASL,1–3 is the loss of sectional area according to the type of pit configuration, r is the radius of a wire, and dp is the pit depth measured by depth gauge at the deepest location.
Trejo et al. (2009) performed a 1-year-long strand corrosion test program to identify and quantify the factors affecting corrosion and tendon capacity of PT strands. The authors considered grout class, moisture content, chloride concentration, void type, and stress level. The results showed that the most severe corrosion existed at or near the grout-air-strand interface. Also, orthogonal, inclined, and bleedwater void conditions were more corrosive than parallel and no-void conditions. Salas et al. (2002) conducted research related to corrosion protection for bonded internal tendons in precast segmental construction. The researchers evaluated the effect of different parameters such as joint type, duct type, joint precompression, and grout type. Based on the experimental results, it was seen that the most significant effect is the joint type. The highest strand corrosion ratings, thus, the largest deterioration, were observed on dry joint specimens with normal grout and low-to-medium precompression. The epoxy joint specimen with the same grout type, duct, and precompression force had strand corrosion ratings on the order of 8 to 10 times smaller. Also, steel ducts showed a much higher corrosion rating than plastic ducts. The effect of grout type on strand corrosion is given in Figure A-2. Jeon et al. (2019) investigated corrosion of external tendons of two segmental bridges located on an urban arterial road. The location of the corrosion was mostly inside the duct, having voids not filled by the grout. Rafols et al. (2013) exemplify areas of anticipated corrosion susceptibility as the tendon high points, grout void locations, and other locations with grout deficiencies.


Corrosion Rate versus Time
Lee and Zielske (2014) conducted a 6-month accelerated corrosion testing program to determine chloride threshold(s) of post-tensioning strands exposed to chloride-contaminated grout. Chloride threshold values of 0.4% and 0.8% by weight of cement were obtained for corrosion initiation and corrosion propagation, respectively. It was seen that the corrosion rate with time for the single wires in pH 13.6 solutions was lower than 0.05 mil/year at chloride concentrations up to 0.6%. In another study conducted by FHWA, the relation of time to initial fracture/failure and mean corrosion rate is obtained from the experimental grout study of four standard deviation of corrosion rate/mean corrosion rate ratios [σ(CRE)/µ(CRE)] (see Figure A-3) (Hartt and Lee 2016). Mean and standard deviation of corrosion rates are given as the function of chloride concentration in physically sound grout, and time to failure (Tf) is given as the function of mean corrosion rate for four different σ(CRE)/µ(CRE) ratios.
A.4 Condition Factors
Resistance Statistical Parameters
The original calibration work for the load rating condition factor was done in NCHRP Project 12-28. The statistical parameters consist of a bias factor and a coefficient of variation (V), accounting for the uncertainties caused by material yield, fabrication, and accuracy of strength
prediction theories. For a steel beam without deterioration, Galambos (1978) recommended a bias of 1.1 based on a review of rolled beam sections and plate girders. Such a bias factor was adopted by the NCHRP Project 12-28 study. A 12% V was then derived from the V of other parameters (material, fabrication, and scatter) in prediction theory.
For the deteriorated member, the study obtained the test data from ASTM and other private and public agencies over a large period at sites all over the world. The authors have accounted for several main effects that contribute to the corrosion, including (1) initial climate, (2) sheltering, and (3) salt. The effects are summarized in the following paragraphs.
Initial Climate
The test specimens have been exposed to a variety of corrosive environments, broadly classified into three categories:
- Normal, good condition (rural atmospheres)
- Medium, slight corrosion (urban/industrial atmospheres)
- Severe corrosion (marine atmosphere).
Coupling Komp’s corrosion model with the test data, the authors obtain the regression equation for each climate region, which can be represented in Eq. (A-1). The detailed equations are shown in Column ① of Table A-3.
| (A-1) |
where C = Average corrosion penetration in µm determined from weight loss, t = Exposure time in years and A and B = Regression coefficient.
Sheltering
Referring to various previous research, the study roughly estimated the sheltering effects as shown in Column ② of Table A-3.
Salt
As noted by Albrecht and Naeemi (1984), the corrosion due to salt is approximately 2.75 times the corrosion in the absence of salt.
In a 2-year period, the amount of thickness losses was calculated as shown in Column ④ of Table A-3. Using these values, the mean amount of percent reduction in section modulus for a typical beam (i.e., W 27 × 94 in this study) is shown in Column ⑤ of Table A-3.
Because the bias for a good condition section is taken to be 1.1, the bias for slight corrosion and severe corrosion equals the remaining percentage of section multiplied by the original bias,
Table A-3. Calculation of average thickness loss for 2-year period.
| Column | ① | ② | ③ | ④ | ⑤ |
|---|---|---|---|---|---|
| Condition | Average corrosion under environment C = AtB/25.4 (mils) | Amount of thickness loss per side (mils) | W27 × 94 Section modulus % reduction | ||
| Good | C = 34(2)0.65/25.4 = 2.1 | 1.0 | 2.75 | 5.77≈6 | 1.8 |
| Medium | C = 65(2)0.5/25.4 = 3.6 | 1.7 | 2.75 | 16.9≈17 | 5.0 |
| Severe | C = 80(2)0.8/25.4 = 5.5 | 2.0 | 2.75 | 30.16≈30 | 9.0 |
Table A-4. Bias and coefficient of variation (V) of resistance.
| Bias Factor | V | |
| Good | 1.10 | 12% |
| Medium | 1.05 | 16% |
| Severe | 1.00 | 20% |
which is calculated as 0.95 × 1.1 = 1.05 and 0.91 × 1.1 = 1.0 respectively. Thus far, the statistical parameters were concluded as tabulated in Table A-4.
Resistance/Capacity Reduction Factor
Eq. (A-2), developed by the American Institute of Steel Construction (1986) and used in their Load and Resistance Factor Design Specification, gives an initial means of establishing the resistance factor φ.
| (A-2) |
Where:
| BR = | Resistance bias factor. |
| β = | Target reliability index. |
| VR = | Resistance V. |
For the target reliability level of β = 2.5, the initial means of φ and the final selected values are tabulated in Table A-5.
Moses (2001) followed the same recommendations derived in NCHRP Project 12-28(1) (Moses and Verma 1987). However, the author revisited the procedures and clarified that the initial study applied double penalties for both decreased capacity of the deteriorated members and increased resistance variability. These two parameters should be considered independently:
- The nominal resistance, Rn, should be the best estimate of component strength, including section loss and other strength deterioration.
- The resistance factor, φ, should decrease with larger component strength uncertainties. In addition to greater strength uncertainties, φc accounts for possible further deterioration that may occur over the next inspection cycle.
Data to support the recommended values of φc are given in NCHRP Report 301 (Moses and Verma 1987). Decoupling the section losses from the increased uncertainty associated with deterioration, the condition factors presented in NCHRP Report 454 (Moses 2001) are slightly higher than those in NCHRP Report 301 (Moses and Verma 1987), and the values are incorporated into MBE.
Table A-5. Calculation of resistance/capacity reduction factor.
| BR | β | VR | φ: initial mean | φ: selected | |
| Good | 1.10 | 2.5 | 12% | 0.93 | 0.95 |
| Medium | 1.05 | 2.5 | 16% | 0.85 | 0.85 |
| Severe | 1.00 | 2.5 | 20% | 0.76 | 0.75 |
Table A-6. Illustrative examples for φc.
| Segmental bridge designed and built strictly in accordance with the FDOT’s New Directions for Florida Post-Tensioned Bridges: | φc = 1.10 |
| Precast segmental balanced cantilever bridge with internal tendons, relatively new, completed using latest grouting criteria enforced via specifications and training, etc., not leaking, well-sealed epoxy joints, but without special duct connectors, for longitudinal evaluation: | φc = 1.00 |
| Precast segmental balanced cantilever bridge with internal tendons, relatively old, with no evidence of leaks at epoxy joints or any rust stains or efflorescence, generally in good or satisfactory condition, for longitudinal evaluation: | φc = 1.00 |
| Precast segmental balanced cantilever bridge with internal tendons, relatively old, with leaks at epoxy joints, with rust stains or efflorescence, and where inspections indicate evidence of corrosion of longitudinal tendons, and generally in poor condition, for a preliminary longitudinal evaluation: | φc = 0.85 |
| Same condition as the previous example but after an in-depth inspection reveals no pitting corrosion and less than 5% wire breaks: | φc = 0.90 |
| Precast span-by-span with external tendons inspected to reveal no corrosion to tendons and no evidence or indications of tendon loss or corrosion damage and generally in good or satisfactory condition, for longitudinal evaluation: | φc = 1.00 |
| Precast span-by-span with external tendons inspected to reveal corroded tendons or indications of section loss or damage: | φc = 0.85 |
| Same condition as the previous example but after an in-depth inspection reveals no pitting corrosion and less than 5% wire breaks: | φc = 0.90 |
| For transverse internal tendons in top slabs, diaphragms, or similar, where there is no visible evidence of corrosion damage, such as rust stains or efflorescence, coming from the tendons or other indications of distress, such as longitudinal flexural cracks in the top surface of cantilever wings or the underside middle portion of top slabs: | φc = 1.00 |
| For similar transverse internal tendons where there is evidence of rust efflorescence, possible corrosion damage, or cracks that have developed: | φc = 0.85 |
The FDOT (2002) conducted a study to recommend some improvements in the load rating of post-tensioned concrete segmental bridges. For the bridges built in accordance with the FDOT’s New Directions for Florida Post-Tensioned Bridges, a 1.10 condition factor might be used. The same study also presents illustrative examples for φc, as can be seen in Table A-6. It is proposed that the low value (0.85) might be applied to local corroded cross section(s) and a higher value to other satisfactory areas.


