Safety Evaluation of On-Street Bicycle Facility Design Features (2025)
Chapter: 2 Literature Review on Safety Effectiveness of Midblock Bicycle Treatments
CHAPTER 2. LITERATURE REVIEW ON SAFETY EFFECTIVENESS OF MIDBLOCK BICYCLE TREATMENTS
2.1 INTRODUCTION
The research team sought to provide an overview of bicycle safety relative to bicycle facilities by summarizing the relevant literature, highlighting key findings, and identifying gaps that the current study might fill. Per the objectives and goals of this task, the research team conducted a narrative review of the literature that provides an overview of the knowledge in the area of interest by summarizing what is known and highlighting key findings. The researchers first established a list of keywords and search terms to identify the relevant literature. The search terms included but were not limited to the following: bicyclist crash, bicycle collision, bicycle injury, bicycle injury risk factor, bicyclist crash analysis, bicyclist crash frequencies, bicyclist crash types, bicyclist safety, and bicyclist crash-contributing factors, as well as bikeway types like bike lane, bicycle lane, separated bike lane, buffered bike lane, and contraflow bike lane to identify the relevant literature studies. The following inclusion criteria were applied in this study:
- No duplicates.
- Date of publication: 20 years (2000–2020).
- Language of publication: English.
- Methodology: Quantitative evaluations.
The literature search was conducted by the librarian and the research team members who used the following databases to identify the relevant studies: Transport Research International Documentation (TRID), Scopus, Web of Science, and Google Scholar. The researchers used the Preferred Reporting Items for Systematic Reviews and Meta-Analyses (PRISMA) tool to establish the eligibility criteria as depicted in Figure 3.

To conduct the review process, the researchers created a data inventory and extracted the following information from each study: the subject area (e.g., safety, accessibility, equity, behavior, etc.); the bikeway type; the performance measure studied (e.g., safety, operations, mode choice, etc.); the location; the background of the study; the objective of the study; the methods used; the findings; and the conclusions and implications. Finally, the research team created an outline of the deliverable, selected the list of relevant studies from the data inventory, summarized the results, and presented them. This report highlights key findings from studies that helped direct and guide the research efforts of the NCHRP 15–74 project.
It is increasingly important to enhance qualitative safety assessment with a more robust data-driven quantitative safety approach, referred to as data-driven safety analysis (DDSA). A DDSA requires the use of predictive safety methods for assessing and evaluating the safety effectiveness of roadway design treatments. A key source for DDSA is the HSM, published by AASHTO, which recommends using historical crash-based predictive methods to assess and evaluate safety improvement effectiveness (AASHTO, 2010). The next edition of the HSM, anticipated to be published in the coming years, will include a new chapter on DDSA methods for improving bicyclist safety. This new chapter will be mainly based on the National Cooperative Highway Research Program (NCHRP) 17–84 project results, the findings of which are currently under a panel review for publication. The project and the subsequent HSM chapter will cover safety measures, safety performance functions (SPFs), and crash modification factors (CMFs) to improve bicyclist safety. Because the NCHRP 17–84 project findings were not yet accessible, the researchers conducted a literature review to identify the DDSA methods that have been implemented in bicyclist safety literature.
2.2 SAFETY EFFECTIVENESS OF BICYCLE TREATMENTS FOR MIDBLOCKS
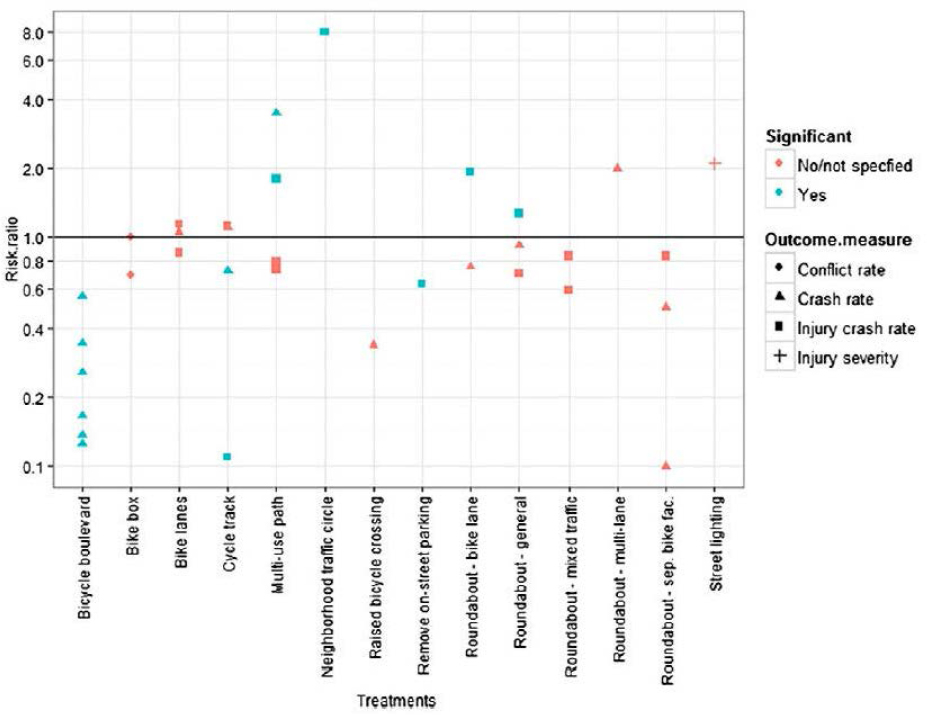
As early as 1976, bike lanes were estimated to reduce collision frequency by 53 percent (Lott and Lott, 1976). A review of studies prior to 2009 about the impact of roadway infrastructure on bicyclists’ safety found that, at midblock locations, the presence of bikeways was associated with the lowest risk (Reynolds et al., 2009). In general, the presence of bicycle-specific infrastructure was found to be associated with reduced injury risk at midblock locations (Harris et al., 2013; Klassen et al., 2014). Using several criteria to rank the studies, DiGiola et al. (2017) conducted a critical review of literature on the safety impacts of bicycle infrastructure installed both at bicycle corridors and intersections. As shown in Figure 4, bicycle facilities were found to affect bicyclist safety both positively and negatively. However, the study found that most previous studies did not account for bicyclist exposure, did not implement robust methods, and did not identify significant estimated impacts.
Bicycle treatments can include the installation of a new bikeway or the modification of an existing bikeway. Modification of an existing on-street bikeway includes, but is not limited to, widening the bicycle lane, changing the bikeway type, adding a separation element, and changing the accessibility and driveway density (i.e., access management). In the first case (i.e., installing a new bicycle lane), the facility’s base condition is to have no bikeway, while in the second case, the base condition is to have an existing bikeway. In addition to the presence of the bikeway, the second case’s base conditions include area type (urban/rural), roadway functional class, number of lanes, median presence and type, driveway density, median width, lane width, and shoulder width, as well as traffic volume, bicyclist and pedestrian activity, and speed limit. Due to the limited sample size of treated sites, the existing literature did not develop bicycle treatment CMFs for all base conditions.
To identify the relevant studies that have developed CMFs for bicycle treatments, the researchers assessed both the FHWA’s CMF Clearinghouse and literature search. The research team also identified some of the studies from the critical review results by DiGiola et al. (2017). The CMF Clearinghouse hosts CMFs for safety treatments that have been developed in the United States and
abroad. A query of bicyclist safety yielded 168 CMFs, out of which 46 were related to midblock treatments. These countermeasures were obtained from the following seven studies: Abdel-Aty et al. (2014), Alluri et al. (2017), Chen et al. (2012), Jensen (2008), Koorey and Parsons (2016), Nosal and Miranda-Moreno (2012), and Rothenberg et al., (2016). It is worth noting that only two of these studies were published in journals; the others were included as papers in the Transportation Research Board (TRB) Annual Meeting compendiums. The research team also identified the literature on bicyclist and pedestrian SPFs. However, after close inspection, we found that these studies did not account for the presence of the on-street bikeway; hence, they were not included in the review.
In the remainder of this chapter, the research team presents the findings of CMF studies per treatment type, with a focus on the results of quantitative studies that have used direct safety measures for developing the CMFs. Given the definition of CMFs, the research team did not include the results of the studies that used non-crash measures to evaluate safety.
2.2.1 Installing a New Bikeway
Among all bikeway treatments, the installation of a bicycle lane was the most researched topic. Reported CMFs for installing conventional bicycle lanes ranged from bicyclist crash decreases of 60 percent to increases of up to 124 percent, depending on the study and context. Reported CMFs for installing separated bicycle lanes were associated with a 13 to 63 percent decrease in bicyclist crashes. The research team found no quantitative study on buffered bicycle lanes and found only one study that assessed the impact of contraflow bicycle lanes, which reported that roadway segments with this type of treatment observed a 31 percent decrease in the number of bicyclist crashes.
In general, most studies developed CMFs for vehicle, bicyclist, and pedestrian crashes, although, in this chapter, the research team only describes the bicycle crash CMFs. Note that, due to the limitations of police-reported crashes, these studies developed CMFs for bicycle-vehicle or bicycle-moped crashes. Other crash types such as single-bicycle, bicycle-bicycle, and bicycle-pedestrian crashes were not included in these studies.
In addition, for the most part, these studies did not explicitly account for bicyclist exposure (e.g., number of bicyclists) due to difficulties obtaining bicyclist count data. Instead, they used other variables to measure bicyclist exposure. Park and Abdel-Aty (2016) state that several studies have associated sociodemographic parameters, such as population density and bike commuters, as
surrogates for bicyclist exposure. For example, a study by Chen et al. (2012) used the bike trip density variable, which is calculated as the number of bicycle commuters (from the American Community Survey [ACS]) divided by the census tract road length. Finally, these studies did not have the contextual factors and statistically meaningful sample sizes for developing bicycle crash CMFs. These limitations may explain why the reported CMF ranges were so wide and unstable (i.e., having both negative and positive impacts).
2.2.1.1 Conventional Bicycle Lanes
Jensen (2008) conducted a naïve before-after (B/A) analysis to evaluate the safety effectiveness of bicycle lanes in Copenhagen, Denmark. The author conducted an observational B/A analysis, where the crashes in the after period were estimated using the crash trend, traffic, and a regression to the mean (RTM) bias factor and then compared to the observed crashes. The CMFs were developed for various injury levels and property damage only (PDO) crashes involving vehicles, bicycles, and pedestrians. One of the facilities evaluated was the bicycle lane. The results of this study indicated that after installing bicycle lanes on segments (i.e., links), the number of injury crashes involving bicyclists and moped riders increased by 27 percent (CMF=1.27). However, the confidence interval of this estimate was between -48 and 207, indicating that the estimate was biased (possibly due to the small sample size) and not valid. Note that for the estimate to be unbiased, the confidence interval of the coefficient estimate has to be either negative or positive.
Turner et al. (2011) studied 102 sites in Adelaide, Australia, and Christchurch, New Zealand, to assess the safety effectiveness of various on-street bicycle facilities, including the installation of bicycle lanes. They conducted a before and after (B/A) control-impact analysis to develop SPFs for bicyclist crashes. They also used B/A analysis to address the site-selection bias (i.e., bicycle facilities applied at sites with higher crash numbers). The results of their analysis indicated a 20 percent increase (CMF=1.21) in bicyclist crashes after the installation of a bicycle lane. After applying the empirical Bayes (EB) method to the B/A analysis to account for potential RTM bias, they estimated a 10 percent reduction in bicyclist crashes.
Chen et al. (2012) used the data from New York to develop CMFs for installing bicycle lanes. In this study, the authors conducted a cross-sectional (C/S) analysis where they compared sites with and without bicycle lanes to develop the CMFs. The CMFs were developed for vehicle, bicycle, and pedestrian crashes. Although total, motor-vehicle, pedestrian, and fatal and injury crashes were observed to decrease, bicyclist crashes at bicycle lanes increased by 51 percent
(CMF=1.51). However, this result was not significant (the reason was not stated). This study used neighborhood-level variables such as daytime population density, retail density, and bicycle trip density to account for bicyclist exposure.
Abdel-Aty et al. (2014) developed Florida-based CMFs to evaluate the safety effectiveness of bicycle lanes for crashes involving bicyclists using the National Safety Council’s (NSC’s) KABCO and KABC injury classification scales. The study used both B/A and C/S analyses to calculate the CMFs for 17 treatments applied to roadway segments, including bicycle lanes. This study found that installing a bicycle lane on an urban roadway segment would reduce the KABCO and KABC crashes involving bicyclists by 58 (CMF=0.42) and 60 (CMF=0.4) percent, respectively.
Park et al. (2015) used 10 years of crash (2003–2012), roadway, and economic data to study a set of 227 road segments before and after bicycle lanes were installed in 2006. A total of 2,437 crashes were identified across this set of sites: 1,358 during the before period (prior to bicycle lane installation) and 1,079 during the after a period. The CMFs for total crashes, total KABC crashes, and bicyclist crashes were 0.829 (18 percent decrease), 0.804 (20 percent decrease), and 0.439 (57 percent decrease), respectively.
Koorey and Parsons (2016) evaluated the safety effectiveness of bicycle lanes in New Zealand. They conducted a B/A study of 12 sites in Christchurch to develop CMFs for bicycle lanes. This study found that the installation of bicycle lanes was associated with a 23 percent reduction (CMF=0.77) in bicyclist crashes.
Alluri et al. (2017) also developed CMFs for urban roadway segments in Florida. Three bicycle lane CMFs were developed for two- and four-lane divided and four-lane undivided urban segments. According to the results, a bicycle lane was associated with a 69 percent increase in total bicyclist crashes on two-lane divided segments, a 14 percent decrease on four-lane divided segments, and a 124 percent increase (CMF=2.24) on four-lane undivided roadways.
Raihan et al. (2019) estimated bicycle lane CMFs for urban two-lane divided segments where they assessed the impact of various factors affecting bicyclist crashes. In this study, the presence of a bicycle lane was found to be insignificant, and the CMF for this variable was not estimated.
A study by Geedipally et al. (2020) found that the presence of a bicycle lane on a one-way arterial was associated with more severe crashes. In this study, the authors developed a severity distribution function for one-way arterials. The authors estimated that the severity of crash increases
from 13 percent to 21 percent on one-way arterial segments with a bicycle lane. However, this study did not account for bicyclist exposure.
2.2.1.2 Buffered Bicycle Lanes
Some studies have tried to assess the behavior of bicyclists and drivers at midblock locations with buffered bicycle lanes; however, we found no quantitative study evaluating their safety effectiveness. An evaluation of buffered bike lanes in Portland, Oregon, showed that bicyclists chose to ride on the segment more often than before the lanes were installed; additionally, both bicyclists and drivers favored the additional separation provided by the buffer (McNeil et al., 2015; Monsere et al., 2012). However, the results also indicated confusion on when (or if) motor vehicles were allowed to use the buffered bike lane.
2.2.1.3 Contraflow Bicycle Lanes
Vandenbulcke et al. (2014) studied bicyclist crashes for the entire roadway network in Brussels, Belgium, using a case-control study design. In this study, the authors accounted for various control factors, one of which was contraflow bicycling. The estimation results suggest that the odds of being involved in a crash at locations where contraflow cycling was allowed was -0.69. These results indicated that bicyclists were less likely to be involved in a crash at contraflow bicycle facilities.
2.2.1.4 Separated Bicycle Lanes
Studies have consistently found that people prefer bike facilities that are separated from traffic with physical separation, such as a post or curb, that provides increased comfort (Dill and McNeil, 2016; Levinson and Krizek, 2007; McNeil et al., 2015; Sanders, 2016; Sanders and Judelman, 2018; Tilahun et al., 2007). The preference for these separated facilities appears to be greater among bicyclists who ride primarily for recreation (as opposed to for transportation) and among those who cycle less often (Sanders and Judelman, 2018), as well as among the subset of potential bicyclists who are classified as interested in cycling for transportation but concerned about safety and other issues (Dill and McNeil, 2016; McNeil et al., 2015). However, there is a lack of quantitative studies evaluating the safety effectiveness of separated bicycle lanes. This is mainly because these facilities have only been installed in the United States quite recently. Due to the limited number of treatment sites and short post-treatment evaluation period (less than 3 years), conducting a safety effectiveness evaluation study is not trivial. Comparable studies from Europe
and Canada lack adequate sample sizes and control factors (i.e., context), making it difficult to apply their conclusions to the United States confidently.
Jensen (2008) performed an observational B/A study to evaluate separated bicycle lanes’ safety effectiveness in Copenhagen, Denmark. According to this study, installing a separated bicycle lane at midblock locations was associated with a 13 percent decrease in the number of bicyclist and moped injury crashes. However, the study did not clarify whether the bicyclist and moped crashes were a crash between the bicyclist/moped user and vehicles or between the bicyclist and moped users.
Lusk et al. (2013) studied 19 separated bicycle lanes installed in the United States (in Florida, California, Minnesota, Colorado, Massachusetts, Vermont, Oregon, and New York). Using separated bicycle lane design (e.g., configuration and separation type and length), bicycle counts, and crash data, the authors concluded that the crash rate on separated bicycle lanes ranged from 3.75 to 54 per million bicycle kilometers traveled (BKT). The study found that in New York City, the injury crash rate decreased from 30 percent to 56 percent after installing a one-way separated bicycle lane. After the installation of a two-way separated bike lane in Prospect Park West, the injury crash rate decreased by 63 percent, while the number of bicyclists doubled.
Thomas and DeRobertis (2013) conducted a review of literature on the safety effectiveness of separated bicycle lanes based on the studies that considered data from Northern Europe (Denmark, Netherlands, Sweden, Germany, and Finland) and Canada. This review found that the construction of separated bicycle lanes on busy streets in urban areas would reduce the number of collisions and injuries. However, the authors mainly focused on intersections. Therefore, we did not include the CMFs from this review in this study.
Marshall and Ferenchak (2019) examined 13 years of crash data across 12 U.S. cities to assess the impact of the bicycle network on roadway safety. This was a macroscopic study, where the unit of analysis was the entire city. In this study, the authors evaluated the impact of the built environment and sociodemographic factors on the overall traffic safety of 12 cities. The authors used Google Earth satellite images and contacted city planners to develop bikeway data that included the type of facility and installation date. Some of the separated bike lanes were found to be built on existing bicycle facilities. The study found that the cities with higher separated bicycle lane densities observed fewer fatal and injury crashes. While the study cannot prove causality between the
separated bicycle facilities and the lower crash numbers, the findings have positive implications for this treatment type.
2.2.2 Converting/Modifying an Existing Bikeway
Treatments for modifying (i.e., adjusting or improving) a bikeway include, but may not be limited to, increasing the bikeway width, altering the separation type, changing from one facility type to another, or managing facility access. Although a relatively high number of studies have evaluated the safety effectiveness of installing a new bikeway, very few studies have tried to assess the safety effectiveness of modifying an existing facility. The research team did not find any existing bicycle safety studies examining access and driveway treatments.
2.2.2.1 Bicycle Lane Width
Park et al. (2015) conducted a C/S analysis of bicycle lanes with different widths. In this study, researchers developed CMFs for the total KABCO and KABC crashes for bicycle lanes that were 3–4 ft and 5–8 ft wide; they did not develop CMFs for bicyclist crashes. The results indicated that wider bike lanes (5–8 ft) were associated with 18 percent fewer crashes while 3–4 ft wide bicycle lanes were associated with 17 percent fewer crashes. Wider bicycle lanes (5–8 ft), however, were associated with relatively more crashes (15 percent decrease) compared to 3–4 ft wide bicycle lanes (23 percent decrease).
Park and Abdel-Aty (2016) developed crash modification functions or CMFunctions to evaluate the safety effectiveness of increasing bicycle lane width on various crash severities. In this study, researchers found that as the bicycle lane width increased up to 6 ft, the crash rate began to decrease. However, increasing the bicycle lane width over 6 ft was found to increase the crash rate (Figure 5). Table 2 presents the list of CMFunctions for this treatment.

Table 2. Bicycle Treatment CMFunctions (Park and Abdel-Aty, 2016).
| Crash Type | CMFunction |
|---|---|
| KAB Crashes | CMF = exp (0.1201 × (UBLW − BaseBLW) Where:
|
| KABC Crashes | CMF = exp (0.1155 × (UBLW − BaseBLW) Where: UBLW = ln [47.24 + 11.859(PBLW − 7) + 3.7(PBLW − 7)2] BaseBLW = ln [47.24 + 11.859(EBLW − 7) + 3.7(EBLW − 7)2] Where:
|
| KABCO Crashes | CMF = exp (0.1172 × (UBLW − BaseBLW) Where: UBLW = ln[47.24 + 11.859(PBLW − 7) + 3.7(PBLW − 7)2] BaseBLW = ln [47.24 + 11.859(EBLW − 7) + 3.7(EBLW − 7)2] Where:
|
In another study, Park and Abdel-Aty (2021) evaluated the impacts of bicycle lane width on both motorized and nonmotorized crashes, where nonmotorized crashes were defined as bicycle-vehicle and bicyclist–pedestrian crashes. In this C/S study, the researchers estimated that installing 5–6 ft for a bicycle lane had positive implications for reducing vehicle crashes, while 6–7 ft bicycle lanes were effective in reducing nonmotorized vehicle crashes (bicyclist and pedestrian).
2.2.2.2 Separation Type
A study by Rothenberg et al. (2016), developed as part of the FHWA’s Separated Bike Lane Planning and Design Guide (2015), conducted a naïve B/A analysis of 17 locations to develop CMFs for separated bike lanes with various types of separation elements and designs. The researchers used five years of before data and three years of after data. In this study, the researchers evaluated the safety impacts of bicycle facilities separated by parking, concrete curbs, and bollards. The researchers used the number of average annual bicyclist crashes without volume adjustment. The results indicated that the average annual bicyclist crashes after installing a parking separated bicycle lane increased by 51 percent. Along concrete curb separated bicycle lanes, the average bicyclist crashes decreased by 15 percent. Plastic bollard separated bicycle lanes observed a 144 percent increase in average annual bicyclist crashes.
Vandenbulcke et al. (2014) found that bikeways separated by parked cars presented a higher risk for bicyclists. One of the reasons is assumed to be suddenly opened car doors. The odds ratios for one-way and two-way parking separated bicycle lanes were estimated to be 1.28 and 2.07, respectively, indicating that the magnitude of the risk increased as the number of bicycle lanes increased.
2.2.2.3 Bikeway Type
The research team only identified one study that tried to develop a CMF for changing from one bikeway to another. Rothenberg et al. (2016) developed a CMF to evaluate the change from a conventional bicycle lane to a separated bicycle lane. The results indicated that average annual bicyclist crashes increased by 55 percent at sites where the bicycle lane was changed to a separated bicycle lane. As indicated earlier, this study does not account for changes in bicyclist volumes, which at the time was very challenging to obtain.
2.2.2.4 Access Management
Access management has been identified as one of the design considerations for installing bicycle facilities at midblock segments in AASHTO’s Bike Design Guide (AASHTO, 2021). The
research team identified two driveway treatment CMF studies that accounted for bicyclist crashes as a result of a change in: (1) driveway type, and (2) the number of driveways. Williamson et al. (2018) assessed the impact of driveway type on total crashes, including bicyclist crashes among other types of crashes (e.g., angle, fixed object, left-turn, right-turn, bicyclists, and pedestrian). In this study, the researchers developed 84 CMFs for changing from one driveway type to another, considering three types of driveways: commercial, industrial, and residential. The CMFs were developed for two-lane undivided, two-lane with a two-way left-turn lane (TWLTL), four-lane undivided, and four-lane with a TWLTL roadways. The results were mixed; the direction of the CMF changed based on the functional class type. A study by Oh et al. (2008) found that the number of driveways at and near unsignalized intersections was negatively correlated with bicyclist crashes. This study did not develop CMFs for bicyclist crashes at midblocks.
Other types of midblock driveway improvements include, but are not limited to, changing the driveway density (i.e., 10, 10–24, 26–48, and 48 driveways per mile); increasing the separation distance between a driveway exit and downstream U-turn by 10 percent; eliminating the presence of a horizontal curve, intersection, or driveway in a sight restricted area; changing driveway spacing; changing driveway width; changing the number of driveway entry lanes; changing the driveway class to high turnover/major; signalizing the driveway; changing the driveway type to full access; and increasing the density of the access points. Developed CMFs for these treatments have not accounted for bicyclist crashes. However, some of these treatments may impact bicyclist safety at midblocks and will be studied further.
One of the major limitations regarding bicyclist safety at midblock locations is the lack of studies on the effect of access management and driveways on bicyclist crashes. Although this factor has been found to be one of the major safety concerns and has been determined as one of the design considerations in AASHTO’s Bicycle Design Guide (AASHTO, 2021), the research team did not find any studies that have developed CMFs for driveway-related bicyclist crashes. The researchers assessed the CMF Clearinghouse to identify the list of CMFs developed for access management and driveway improvements; however, these CMFs do not explicitly address bicyclist crashes.
Table 3 presents a summary of some of the studies reviewed in this chapter. The table shows the bikeway type studied, state/country of study, type of roadway facility, existing bikeway, and severity and type of crash. In this table, the researchers did not include the base condition because not all the studies developed SPFs for estimating bikeway CMFs. The table also does not include the
list of other context-specific factors and exposure variables considered in the study. As discussed previously, the studies reviewed here did not include context-specific factors or used other surrogate variables to measure them. Finally, the table does not include a star rating because of the change in rating approach that was published February 15, 2021.
Table 3. Summary of Bicycle CMF Studies.
| Author (Year) | Bikeway Type | State/Country | Roadway Facility Type | Prior Bikeway | Study Design | Crash Type | Crash Severity | Bikeway Design Considerati ons | CMF | Star Rating |
|---|---|---|---|---|---|---|---|---|---|---|
| Jensen (2008) | Bicycle lane | Netherlands | Urban roadway | No bikeway | B/A | Bicycle & Moped | KABC | None | 1.27 | 1 |
| Separated bicycle lane | 0.87 | 1 | ||||||||
| Chen et al. (2012) | Bicycle lane | New York, United States | Urban roadway | No bikeway | C/S | Bicycle–Vehicle | KABCO | None | 1.50 | 2 |
| Abdel-Aty et al. (2014) | Bicycle lane | Florida, United States | Urban roadway | No bikeway | B/A & Cross-sectional | Bicycle–Vehicle | KABCO | None | 0.42 | 2 |
| KABC | None | 0.40 | 2 | |||||||
| Park et al. (2015) | Bicycle lane | Florida, United States | Urban roadway | No bikeway | B/A & C/S | Bicycle–Vehicle | KABCO | None | 0.42 | Not Assigned |
| KABC | None | 0.39 | ||||||||
| Bicycle lane | Vehicle | KABCO | 3–4 ft | 0.83 | ||||||
| KABC | 0.77 | |||||||||
| KABCO | 5–10 ft | 0.82 | ||||||||
| KABC | 0.85 | |||||||||
| Koorey and Parsons (2016) | Bicycle lane | New Zealand | Urban roadway | No bikeway | B/A | Bicycle–Vehicle | KABCO | None | 0.77 | 2 |
| Park and Abdel-Aty (2016) | Bicycle lane | Florida | Urban roadway | Bicycle lane | C/S | Bicycle–Vehicle | KABCO | Bike lane width | CMFunction | 3 |
| KABC | CMFunction | 3 | ||||||||
| KAB | CMFunction | 3 | ||||||||
| Rothenberg et al. (2016) | Separated bicycle lane | California, District of Columbia, Florida, Illinois, Montana, New York, Oregon, and Texas (United States) | Urban roadway | No bikeway | B/A | Bicycle–Vehicle | KABCO | Parking lane | 1.51 | 1 |
| Concrete | 0.84 | 1 | ||||||||
| Plastic bollards | 2.44 | 1 | ||||||||
| Other separation | 1.36 | 1 | ||||||||
| Bicycle lane | B/A | None | 1.55 | 1 | ||||||
| Contraflow bicycle lane | Brussels, Belgium | Urban network | N/A | Case-control | Vehicle–Bicycle | KABCO | None | 0.50 | Not Assigned |
| Author (Year) | Bikeway Type | State/Country | Roadway Facility Type | Prior Bikeway | Study Design | Crash Type | Crash Severity | Bikeway Design Considerati ons | CMF | Star Rating |
|---|---|---|---|---|---|---|---|---|---|---|
| Vandenbulc ke et al. (2014) | ||||||||||
| Separated bicycle lane | One-way, parking | 1.28 | ||||||||
| Two-way, parking | 2.07 | |||||||||
| Alluri et al. (2017) | Bicycle lane | Florida, United States | Urban, two-lane divided | No bikeway | C/S | Bicycle–Vehicle | KABCO | None | 1.69 | 3 |
| Urban, four-lane divided | 0.86 | 3 | ||||||||
| Urban, four-lane undivided | 2.24 | 3 | ||||||||
| Park and Abdel-Aty (2021) | Bicycle lane | Florida, United States | Urban arterials | No bikeway | C/S | Bicycle–Vehicle | KABCO | 5–6 ft to 6–7 ft | 0.10 | 3 |
| KABC | 0.52 | 3 |
2.3 PERFORMANCE MEASURES AND CONTEXTUAL FACTORS
It is increasingly important to enhance qualitative safety assessment with a more robust data-driven quantitative safety approach, referred to as DDSA. As noted previously, DDSA requires the use of predictive safety methods for assessing and evaluating the safety effectiveness of roadway design treatments. A key source for DDSA is AASHTO’s HSM, which recommends using historical crash-based predictive methods to assess and evaluate safety improvement effectiveness (AASHTO, 2010). The next edition of the HSM, anticipated to be published in the coming years, will include a chapter on DDSA methods for improving bicyclist safety. This new chapter will be mainly based on the NCHRP 17–84 project results, the findings of which are currently under panel review for publication. The project and the subsequent HSM chapter will cover safety measures, SPFs, and CMFs to improve bicyclist safety. Because the researchers for this study did not have access to the NCHRP 17–84 project findings, they conducted a literature review to identify the DDSA methods that have been implemented in bicyclist safety literature.
2.3.1 Bicyclist Safety Measures
Safety performance measures are divided into direct and indirect measures (AASHTO, 2010). Direct measures refer to crash frequency and severities. However, bicycle crash data are known to have some limitations. For example, transportation agencies do not consistently record crash locations. Some agencies record bicycle crash location in a manner similar to their method for reporting motor vehicle crashes (often, a motor vehicle is one of the parties involved in the bicycle crash). Other jurisdictions record the bicycle crash location as the closest intersection. Yet a third reporting approach is to record the crash location as either the closest intersection or the midblock point—whichever is nearest to the actual crash location. Additionally, police agencies differ regarding the monetary (with regard to damage to a vehicle) or injury (with regard to a victim) thresholds at which a bicycle crash is recorded, and some agencies require self-reporting of crashes.
Several studies have also proposed using indirect safety measures that are based on conflicts (i.e., surrogates or leading crash indicators) and vehicle operations (e.g., speed and lane position). These conflict-based safety indicators can reflect the collision risk, the injury risk, or both and are a more frequent than crash data, which is known to be rare. The most commonly used surrogate safety measures for bicyclists include the vehicle throughput, time-to-collision (TTC), the time-to-lane crossing (TTL), post-encroachment time (PET), and measures related to vehicle kinematics
(e.g., deceleration rate, jerk profile, or lateral position). These data have been collected from vehicle kinematics, naturalistic studies, and bicycle simulators.
Both direct and indirect measures are quantitative, in that the safety measure is quantified (e.g., number of crashes or number of encroachments.). In addition to these quantitative measures, bicycle safety literature has also considered qualitative measures, such as perceived safety and exploratory data analysis (e.g., descriptive statistics, collision diagrams, and other visualization tools). These measures can be used to conduct safety diagnoses and analyses as an approach to overcome the limitations pertaining to the rarity and randomness of crash data and the underreporting of vulnerable road user crashes.
2.3.1.1 Direct Safety Measures
The main sources for direct safety measures are local police reports and hospital records; state and national crash databases often lack important details of bicycle crashes, such as the sequence of events leading to the crashes. Bicyclist safety studies often use the number of bicycle-vehicle crashes, as well as the number of fatal and injury crashes, to assess bicyclist safety. One of the major concerns in this area is that bicycle crashes are underreported (Stutts and Hunter, 2006). For example, a study of long-term trends of bicycle fatalities in the Netherlands found that bicycle fatalities may not be fully reported (Schepers et al., 2017). This limitation also affects the crash typing of bicyclist crashes.
Bicyclist crash typing is often difficult due to very small sample sizes of crashes. However, a recent study by Thomas et al. (2019) tried to define top crash types involving bicyclists using national crash data from FARS, statewide data from North Carolina, and citywide data from Boulder, Colorado. This study found that the most common fatal bicycle crash types nationally in 2014–2016 were as follows:
- Motorists overtaking bicyclists (28.1 percent of fatalities).
- Bicyclists being struck by vehicles on a parallel path or other circumstances (8.6 percent).
- Bicyclists failing to yield midblock (7.4 percent).
- Bicyclists making a left turn or merging (7.3 percent, likely intersection-related).
- Bicyclists crossing paths or other circumstances (7.2 percent, likely intersection-related).
- Bicyclists failing to yield at a signalized intersection (6.9 percent).
- Bicyclists failing to yield at a sign-controlled intersection (6.8 percent).
As is evident from the list above, bicycle crashes along segments are much more likely to be fatal than those at intersections. Moreover, the deadliest crash type by far is the motorist overtaking the bicyclist, which accounted for nearly one-third of all fatalities. Yet bicycle-motor vehicle crashes at midblock locations, which include overtaking crashes, vehicles entering or exiting driveways, and drivers opening the door of a parked vehicle (i.e., dooring crashes) among others, have been relatively unexplored.
A study of 2011–2018 fatal and severe bicycle crashes in the Texas Department of Transportation’s (TxDOT’s) Austin District found that the top three bicyclist crash types involved motorists making a left turn or merging (20 percent), making a right turn or merging (13 percent), or overtaking a bicyclist (10 percent) (Dai and Hudson, 2019).
Pai (2011) studied various contributing factors affecting overtaking, rear-end, and door crashes at undivided roadways in the United Kingdom. This study found that the most common crash types were rear-end crashes (39.6 percent), followed by overtaking crashes (38.8 percent) and door crashes (21.6 percent). This study also found that larger vehicles, such as buses, were more likely to be involved in bicyclist-overtaking crashes mainly due to the less conspicuous bicyclist. Some studies have used naturalistic driving and driver simulators to explore bicyclist-overtaking crashes (Feng et al., 2018; Goddard et al., 2020). Yet, as discussed previously, most bicycle crash studies have emphasized intersection crash types by virtue of the fact that bicycle-motor vehicle crash types are more common at intersections (Abdel-Aty and Keller, 2005; Beck et al., 2016; Cai and Abdel-Aty, 2020; Schepers et al., 2011; Tuner et al., 2011).
In addition to police reports, two other types of records are often used: (1) injury records maintained by hospitals or other medical facilities and (2) self-reports of injuries by bicyclists1. These practices have been mainly implemented in European studies. For example, Sweden collects crash injury and fatality data from both police and hospital records. While a few U.S. studies have examined bicycle crashes from multiple sources in this manner, health data are rigorously protected in the United States. As a result, most studies rely on police-reported crash data because it is easier to access. Consequently, bicycle safety studies in the United States may rely on biased data due to
___________________
reporting thresholds, inexact or missing crash locations, and underreported crashes, which may present challenges for conducting the HSM-based predictive analysis.
The development of effective countermeasures to help prevent bicyclist crashes is also hindered by insufficient details. These details normally can be retrieved from the crash narratives of the police reports, but there has been a lack of time and effort to extract the information from the unstructured text. It is labor-intensive to manually identify the types of bicycle crashes from the crash narratives and classify different crash attributes from a police report’s textual content. Thus, to address the inefficiency of manually collecting crash details from narratives, studies have developed text mining algorithms to explore motor vehicle crash narratives (Arteaga et al., 2020; Das et al., 2020; Gao and Wu, 2013; Zhang et al., 2019). However, these techniques have not been explored in bicyclist safety research.
Because not all bicycle crashes are reported to the police and sometimes the police reports or crash databases have limited information, emergency medical services (EMS) data have been occasionally used to fill the gap. For example, Sandt et al. (2018) used FARS data to identify variables and key themes as possible contributors to the increasing pedestrian fatality trend and then developed a population-based linkage study of pedestrian and bicyclist crashes and emergency department visit data. Using this linked dataset, the research team was able to examine the relationship between vehicle, crash, roadway, and person-level factors and their association with injury outcomes.
Several traffic safety studies have used EMS data to assess bicyclist safety (Axelsson and Stigson, 2020; Gopinath et al., 2016; Hagel et al., 2014; Kim et al., 2017; Mitchell and Bambach, 2015; Papoutsi et al., 2014; Sanford et al., 2015). Most of these studies are from Europe. The U.S. studies often include the National Emergency Medical Services Information System (NEMSIS) data, which is the national database used to store EMS data from the United States and U.S. territories (McAdams et al., 2018; Sandt et al., 2020). Some studies have used hospital records (e.g., trauma registry, discharge register, etc.) rather than EMS data (Goldman et al., 2015; Mitra et al., 2017, Mjåland et al., 2019; Polinder et al., 2015; Rothman et al., 2010). Other studies have used a combined dataset of hospital records and police-reported crashes in traffic safety studies. For example, Schimek (2018) analyzed data from the U.S. national databases of emergency room visits and police-reported crashes to understand bicyclist injuries’ circumstances. When estimating an in-vehicle automatic collision notification system’s potential effectiveness in reducing all road crash
fatalities in South Australia, Ponte et al. (2015) matched and examined traffic accident reporting system data, EMS road crash dispatch data, and coroners’ reports. Sandt et al. (2020) compared crash and medical data to evaluate underreporting in crash reports, finding evidence that many pedestrian and bicyclist injuries might be missed in crash reports. This study aimed to provide a more accurate picture of California’s traffic injuries by utilizing medical data to fill in where police crash reports may not capture a crash or may have limited information.
2.3.1.2 Indirect Safety Measures
When crashes are relatively rare and random, a significant amount of historical data is required to generate meaningful conclusions. Meanwhile, not all crashes are reported, especially low-severity crashes involving vulnerable road users. Indirect safety measures make it possible to evaluate bicyclist safety in a proactive way and avoid crash data limitations. However, one of the drawbacks of using these metrics is that the linkage between these measures to actual bicycle-related crashes has yet to be fully established. According to Johnsson et al. (2018), any alternative safety indicator must be grounded in theory, have robust validity, and be based on reliable actions. Hence, as one element of this safety assessment effort, there was a need to appropriately define bicycle exposure and crash location. The indirect measures discussed below include surrogate safety measures, naturalistic bicycling data, and bicycle simulator data.
2.3.1.2.1 Surrogate Safety Data
Surrogate safety data or measures (SSMs) can be used to evaluate the probability for each traffic event to develop into a crash. While the model by Davis et al. (2011) suggests that SSMs should reflect both initial conditions and evasive actions, it is also possible for SSMs to be the outcomes of a traffic event (Johnsson et al., 2018). The most commonly used SSMs are the TTC, PET, and deceleration.
The TTC measures the time remaining before the collision if the involved road users continued with their respective speeds and trajectories (Johnsson et al., 2018). Laureshyn et al. (2017) indicated that the two most commonly used indicators based on the TTC are the TTCmin and the time-to-accident (TA). The TTCmin is the minimum TTC value calculated in an event. The TA is the TTC value at the moment an involved road user takes evasive action. Other indicators based on or similar to the TTC include, but are not limited to, the time-to-zebra (TTZ), the TTL, the reciprocal of the TTC (i.e., 1/TTC), the time-exposed TTC, and the time-integrated TTC.
The PET measures the time difference between a road user leaving the area of encroachment and a conflicting road user entering the same area (Johnsson, 2018). Indicators based on or similar to the PET include, but are not limited to, the gap time and encroachment time (Allen et al., 1978), the time advantage (Hansson, 1975, Laureshyn et al., 2010), and the conflict index (Alhajyaseen, 2015).
Deceleration is a common evasive action made to avoid a collision (Johnsson, 2018). The deceleration rate quantifies the magnitude of the deceleration action when the involved road user must make an evasive braking maneuver to avoid a collision. Additionally, the deceleration to safety time is necessary to reach a nonnegative PET value if the conflicting road users’ movements remain unchanged (Hupfer, 1997). The observation of the jerk profile is also a means to estimate the braking action’s intensity through the change in acceleration (Tageldin et al., 2015).
There are other SSMs that do not fit into the above three categories. Griselda et al. (2020) analyzed the objective and subjective risk of overtaking maneuvers to bicyclists’ groups. The surrogate measures used to analyze the objective risk are the motorized vehicle’s speed and lateral distance from the bicycle during the overtaking maneuver.
At least one major SSM or a set of SSMs is often used to measure bicyclist risk with certain traffic facilities or designs. For example, Stipancic et al. (2016) used the PET to evaluate the impact of different factors on bicyclist risk at urban intersections with separated bicycle lanes. Ledezma-Navarro et al. (2018) measured bicycle-vehicle conflicts using the PET when evaluating the impact of different traffic signal designs at intersections with bicycle facilities. Oh and Kwigizile (2018) used SSM conflicts to measure the safety impacts of bike boxes at protected intersections.
2.3.1.2.2 Naturalistic Bicycling Data
One of the most recognized tools to study traffic safety is naturalistic data (Dozza and Werneke, 2014). It can be used to answer questions that other data, such as data from crash databases, cannot answer (Campbell, 2013). In the past, naturalistic data were mainly collected from motorized vehicles for understanding motorists’ behavior and improving traffic safety (Hickman and Hanowski, 2011). When collected from bicycles, data used to be limited to global positioning systems (GPS) and/or videos in geographically restricted areas (Gustafsson and Archer, 2012; Johnson et al., 2010). For that reason, Dozza and Werneke (2014) proposed using instrumented bicycle data to collect analogous naturalistic cycling data that does not require bicyclists to follow specific roads at specific times. In this study, 16 bicyclists used an instrumented bicycle as a personal
bicycle during their daily activity, allowing for high-resolution, continuous data from cameras, GPS, inertial measurement units, and pressure sensors. Since then, many studies have used instrumented bicycles to collect cycling data in a similar naturalistic fashion (Dozza et al., 2016; Hamann and Peek-Asa, 2017; Schleinitz et al., 2017). To identify ways to improve bicyclist safety, Johnson et al. (2014) conducted a naturalistic cycling study using a helmet-mounted video camera with a GPS data logger to investigate bicyclists’ behaviors and interactions with drivers. Mackenzie et al. (2017) used naturalistic cycling data to evaluate Safe Cycle, a program that incorporates hazard and self-awareness training in Australia. Schleinitz et al. (2019) investigated the red-light-running behavior of three different bicycle types (bicycle, pedelec, S-pedelec) in Germany, focusing on various infrastructure characteristics.
Importantly, naturalistic bicycling data avoids police reports’ inherent biases, which often heavily lean toward on-road, bicycle-motor vehicle crashes (Schleinitz et al., 2015). Crashes that do not involve motorized vehicles or that occur on other types of infrastructure are often less represented in police reports. To gain a complete picture of cycling risks, Schleinitz et al. (2015) collected and analyzed naturalistic cycling data to identify and classify safety-critical cycling events involving a variety of conflict partners and covering all types of infrastructure. It should be noted that naturalistic bicycling data may reflect participation bias related to the willingness to participate in data collection and route choice. Moreover, they will have a small representative sample.
2.3.1.2.3 Bicycle Simulator Data
While automobile simulators have been an active tool for road safety research, bicycle simulator-based research has recently started gaining attention. O’Hern et al. (2017) found evidence suggesting that aspects of bicyclist behavior can be investigated using a bicycle simulator, such as lane position, passing distance, speed reduction on approach to the intersection, etc. Nazemi et al. (2020) investigated the combination of immersive virtual reality (VR) and an instrumented cycling simulator for in-depth cycling behavior studies to assess bicyclists’ perceived safety in five different environments. This study found that bicyclists felt safer when riding in separated bicycle lanes. Findings from these studies helped validate the use of bicycle simulators for road safety research.
Bicycle simulator data are useful in a wide range of safety research. For example, to evaluate roadway facilities, Brown et al. (2017) investigated alternative pavement markings for bicycle wayfinding and proper bicycle placement at signalized intersections in Columbia, Missouri. This evaluation was accomplished with a bicycle simulator study and post-simulator survey. O’Hern et al.
(2018) used a VR bicycle simulator to examine how bicycle lane width and perceptual countermeasures can influence bicyclist speed and position.
Bicycle simulator data can play an important role in the study of bicycle-vehicle crashes. Kwigizile et al. (2017) used a bicycle simulator to study bicyclists’ interactions with other roadway users. The rider’s perceptions and reactions to different situations were investigated based on their performance during four virtual simulation scenarios with an electroencephalogram reading.
Abadi et al. (2019) conducted a bicycling simulator experiment that examined bicycle and truck interactions. The bicycling simulator collected data from 48 participants regarding their velocity and lateral position, contributing to the research on the behavioral interaction between bicycle lanes and commercial vehicle loading zones in the United States.
2.3.2 Bicyclist Crash-Contributing Factors
The impact of on-street bikeway design on bicyclists and their overall safety at midblock locations is conditional on other factors. These factors, referred to as explanatory or context-specific factors, can affect the crash frequency and severity. These factors also help to determine the presence of a bicycling facility and subsequent bicyclist exposure.
In this section, the research team tried to identify the list of commonly used context-specific factors in safety studies (both quantitative and qualitative). First, the research team revised the set of relevant literature. Based on these studies, the findings were then categorized into the following factor groups: built environment (e.g., roadway design geometry, bikeway design, and land use and context), bicyclist exposure and speed limits, demographic and socioeconomic factors, behavioral factors, and meteorological factors. The categorical results were then summarized. For each group, a list of context-specific factors that were found to affect bicyclist safety at midblock sites was developed. Note that the research team did not include the direction and magnitude of effect (i.e., coefficient estimates); the estimate of a particular factor depends on the other factors considered in the study and sample size. The research team subsequently conducted a meta-analysis to summarize the estimates of context-specific factors on bicyclist safety.
2.3.2.1 Bikeway Design
In addition to the presence of the facility (discussed in 2.2 Safety Effectiveness of Bicycle Treatments), the design features of bicycle lanes can affect the bicyclist safety as well as their interactions with motor vehicles and other non-motorists. Existing studies have explored the effect
of bicycle lane width, colored bike lanes and separation elements on bicyclist safety using both qualitative and quantitative assessment. Table 4 presents the main findings of studies exploring the safety effects of different bicycle lane designs.
Table 4. Bikeway Design.
| Factors | Summary of Review Findings | References |
|---|---|---|
| Bike lane width |
| AASHTO (2012); Duthie et al. (2010); Greibe and Buch (2016); NACTO (2014); Park et al. (2014); Pulugurtha and Thakur (2015) |
| Bike lane color |
| Hunter et al. (2000); Hunter et al. (2008); LaMondia et al. (2019); Sadek (2007) |
| Type of separation |
| Cicchino et al. (2020); Mosereet et al. (2014); Zhang et al. (2015) |
In general, the presence of on-street bike facilities was found to be associated with reduced injury risk at midblock locations (Harris et al., 2013; Klassen et al., 2014). A review of studies prior to 2009 about the impact of roadway infrastructure on bicyclists’ safety found that at midblock locations, the presence of bicycle facilities was associated with the lowest risk (Reynolds et al., 2009). Many other crash analysis studies and behavioral studies also support those findings (Duthie et al., 2010; Mukoko and Pulugurtha, 2019; Pulugurtha and Thakur, 2015). The design of bicycle facilities also has a great impact on bicycle safety, such as the width of the bicycle lane and different pavement markings or colors, etc.
According to AASHTO’s Bike Guide (2012), the recommended width for bike lanes is 5 ft under most circumstances. The National Association of City Transportation Officials (NACTO) (2014) recommends a desirable bike lane width adjacent to a curb of 6 ft. Park et al. (2015) developed crash modification functions to assess the safety effects of adding bike lanes along urban
arterials. The results revealed that bike lane widths and other roadway characteristics caused significant variation in the safety effects of a new bike lane. The safety effects were higher for roadway segments with a 4–8 ft wide bike lane. The study by Pulugurtha and Thakur (2015) confirmed the positive safety impacts of installing wider on-street bicycle lanes. Few studies quantified the safety effects of bike lane width on cycling, but this literature review suggested bike lane width has an impact on bicyclists’ and drivers’ behaviors. Through the examination of the impact of design elements on the motorist and bicyclist behavior, including the type and width of the bikeway, Duthie et al. (2010) found that bike lane width affected the motorists’ position on the roadway during non-passing events. As bike lane width increased, the motor vehicle path shifted further from the road edge. Regarding separated bicycle lanes, Greibe and Buch (2016) discovered that in narrow separated bicycle lanes, bicyclists were riding closer to the footpath and closer to each other during overtaking compared to wider separated bicycle lanes.
Limited studies provided direct comparisons of how different types of separations between bike lanes and traffic lanes influenced bicyclist safety. In general, the physical separation could be via flexi-posts or bollards, parked cars, curbs, raised pavement, or other vertical physical barriers. Mosereet et al. (2014) conducted a survey to assess bicyclists’ perceptions of different buffer designs. The results suggested that any type of buffer with vertical physical objects was rated higher in self-reported comfort level than buffers created only with paint. The more physical separation a design has, the more preferable it was to bicyclists. In this case, flexi-posts buffers were rated very high, even though they offer little actual physical protection from vehicles. This perceived safety was relatively consistent with the findings from the study by Cicchino et al. (2020), which examined the infrastructure and risk of bicyclist collisions and falls leading to emergency department visits in three U.S. cities. It was found that separated bike lanes with heavy separation (e.g., tall, continuous barriers or grade and horizontal separation) were associated with lower risk, while those with lighter separation (e.g., parked cars, posts, or a low curb) had a similar risk on major one-way roads and a higher risk when the roads were two-way.
Findings for colored bike lanes were mixed. To determine whether the colored markings help improve safety at bicycle-motor vehicle crossings, the city of Portland, Oregon, studied the use of blue pavement markings and a novel signage system to delineate selected conflict areas (Hunter et al., 2000). The findings suggested that the blue pavement led to significantly more motorists yielding to bicyclists and slowing or stopping before entering the crossings, as well as more bicyclists
following the colored bike lane. The significant increase in motorists’ yielding behavior was also found in the evaluation of a green bike lane weaving area in St. Petersburg, Florida (Hunter et al., 2008). In addition, the Portland study revealed a reduced bicyclists’ safety alertness potentially due to an increased comfort level (this phenomenon was not observed in the St. Petersburg study). A more recent study adds to the findings of positive impacts of colored bike lanes on bicyclist–motorist interactions. After the introduction of green paint to existing bike lanes in a suburban area in Auburn, Alabama, motorists who were previously driving in or near the bike lane when bicyclists were not present moved further toward the center of the traffic lane (LaMondia et al., 2019). Not all studies identified a positive impact of colored bike lanes on motorists’ behavior. Sadek (2007) found that the green treatment increased the usage of the bike lane over the sidewalk or the road; however, it did not make motorists yield more often to bicyclists at the crossings.
2.3.2.2 Built Environment Factors Affecting Bicyclist Safety
The decision to install and convert a bicycle lane can be affected by various built environment factors such as roadway characteristics, land use, transit and accessibility. Table 5 presents the list of these factors followed by the discussions as well as their expected effects on bicyclist safety.
Table 5. Built Environment Factors Affecting Bicyclist Safety.
| Contextual Factors | Summary of Review Findings | References | |
|---|---|---|---|
| Roadway Design | Median type |
| Kim and Kim (2015); Raihan et al. (2017, 2019) |
| Number and width of traffic lanes |
| Klop and Khattak (1999); Petritsch et al. (2006); Raihan et al. (2019) | |
| Presence of a sidewalk and barrier |
| Raihan et al. (2017, 2019) | |
| Presence of street lighting |
| Kim et al. (2007); Klop and Khattak (1999) | |
| Contextual Factors | Summary of Review Findings | References | |
|---|---|---|---|
| Road curvature |
| Eluru et al. (2008); Pai (2011); Kim et al. (2007) | |
| Shoulder and Rumble Strips |
| Abdel-Rahim and Sonnen (2012); Hunter (1998); Klop and Khattak (1999) | |
| Road signals and street parking signs |
| Chen (2015) | |
| Land Use | Land and building use |
| Dixon et al. (2012); Greibe (2003); Haleem and Abdel-Aty (2010); Nordback et al. (2014) |
| Urban/rural |
| National Center for Statistics and Analysis (2019a, 2019b); Shaheen et al. (2018); Winters and Teschke (2010) | |
| Driveway and Parking | Loading/transit zone |
| Butrina et al. (2016); Mosereet et al. (2014) |
| Driveway and parking garage access points |
| Chen (2015); Dixon et al. (2009); Kim and Kim (2015); Ma et al. (2010); Pulugurtha and Thakur (2015) | |
| Presence and width of on-street parking |
| Duthie et al. (2010); Pai (2011); Schimek (2018); Vandenbulcke et al. (2014)DiGioia et al. (2017); Teschke et al. (2012) | |
| Contextual Factors | Summary of Review Findings | References | |
|---|---|---|---|
| Transit | Bus stop and bus route length |
| Feng et al. (2013); Kim et al. (2010); Kim and Kim (2015) |
2.3.2.2.1 Roadway and Roadside Design Geometry
Literature suggests that roadway geometry plays a significant role in bicycle collisions with motor vehicles. The associated factors include, but are not limited to, the number and width of traffic lanes, road curvature, shoulder width, median type, presence of street lighting, and presence of a sidewalk and barrier (Table 5).
Regarding the impact of the number of travel lanes and lane width on bicycle safety, Petritsch et al. (2006) developed a Sidepath Safety Model to predict the difference in bicycle-motor vehicle crash rates between sidepath (or separated bicycle lane) crashes and on-street crashes. The results suggested that the more lanes there are on the roadway, the more motorists appear to be focused on the opposing motor vehicle travel lanes and turning traffic as opposed to activity on the sidepath. Additionally, on wide streets with two lanes, motorists tend to focus less on the nonmotorized sidepath users, while sidepath users may only concern themselves with traffic in the nearest travel lanes. These behaviors contribute to the increased crash rates of sidepaths adjacent to wider, multilane roadways. When estimating the CMFs on urban facilities using four years (2011–2014) of crash data from Florida, Raihan et al. (2019) observed the positive impacts of lane width, speed limit, and grass in the median on reducing bicycle crashes.
Several studies have investigated the effect of curves on bicyclist safety. An empirical investigation conducted by Pai (2011) on overtaking, rear-end, and door crashes involving bicycles revealed that horizontal and vertical curves could contribute to bicycle crashes. Klop and Khattak (1999) found that straight grades and curved grades significantly increased injury severity on two-lane, undivided roadways in North Carolina, while the interaction of speed limit/shoulder width and dark condition/street lighting variables significantly lowered injury severity. Similarly, Kim et al. (2007) discovered that curves significantly increased the injury severity of bicyclist crashes. This finding is reasonable given that curves can decrease the visibility and maneuverability for both the driver and bicyclist and can affect injury severity due to less efficient evasive maneuvers. This finding is also supported by Eluru et al. (2008).
A few studies showed that shoulder width and color could impact bicyclist safety as well (Abdel-Rahim and Sonnen, 2012; Hunter, 1998; Klop and Khattak, 1999). Through a comprehensive evaluation of the relationship between crash rates and shoulder width for two-lane rural state highways in Idaho, Abdel-Rahim and Sonnen (2012) found that roadway sections with a right paved shoulder width of 4–6 ft had the lowest number of pedestrian and bicyclist crashes. The crash probability increased significantly with shoulder widths less than 3 ft. It also increased with shoulder widths of 8 ft or more. In the evaluation of red shoulders as a bicyclist and pedestrian facility, Hunter (1999) discovered that motor vehicles more frequently and severely encroached over the center line when passing a bicyclist at the site without red shoulders. Survey responses from bicyclists showed that almost 80 percent felt safer with red shoulders than ordinary, unpainted shoulders. In reality, there was more clearance between bicycles and motor vehicles on the roadway section without red shoulders. No studies have attempted to measure the safety effects of shoulder rumble strips on bicycle safety. However, the rumble strips appear to effectively warn drivers when encroaching on bicyclist space (Gårder, 1995).
Other roadways and roadside characteristics that have been found to have an influence on cycling safety include the type of roadway median, roadway lighting, and presence of a sidewalk, sidewalk barrier and markings and signs. Structured medians could contribute to a decrease in bicycle crashes (Kim and Kim, 2015), but other than the regular paved median, any variation of median type (e.g., raised traffic separator, curb, or grass median) could increase bicycle crash probability due to the reduction of the refuge area for bicyclists (Raihan et al., 2017, 2019). The presence of a sidewalk and sidewalk barrier was also associated with increased bicycle crash probabilities (Raihan et al., 2017, 2019). Conversely, roadway lighting appears to have a substantial positive effect on bicyclist safety at night (Kim et al., 2007; Klop and Khattak, 1999). Areas with more road signals, street parking signs, and automobile trips are more likely to increase bicycle crashes (Chen, 2015). The safety effects of roadway and pavement markings on bicyclist safety have not been evaluated in the literature.
2.3.2.2.2 Land Use and Context
The impacts of land use are not well detailed in the literature, but they are important to the overall safety of bicyclists because land use impacts the amount and type of traffic and facilities on the road. Common distinctions of land-use types and contexts are urban, rural, residential, industry, farmland, institutional, and commercial.
Greibe (2003) identified land use as one of the most important variables in the models generated. Additionally, the lower the building density, the lower the accident risk. Kim (2007) analyzed the descriptive statistics for land use data and found that higher severity crashes occurred outside of urban areas and at farm, wood, pasture, or residential areas. Dixon et al. (2012) found that land use was a key factor that affects driveway safety, and Schepers et al. (2014) stated that land use has an effect on the distribution of traffic (bicycles included) over time and space. Nordback et al. (2014) concluded that land use is a variable that might influence bicyclist safety and should be considered for SPFs. Bicyclist injury severity is negatively associated with employment density and land use mixture (Chen and Shen, 2016). In general, off-arterial bicycle routes are safer than on-arterial bicycle routes (Chen, 2015).
Research also indicated that urban routes were more popular for biking and associated with more bicyclist fatalities. In 2017, the majority of bicyclist fatalities occurred in urban areas (75 percent) in the United States (National Center for Statistics and Analysis, 2019a). While bicyclist fatalities in urban areas increased by 48 percent in 2018 compared to 2009, rural areas decreased by 8.9 percent (National Center for Statistics and Analysis, 2019b)—a drop likely due to the lower exposure of bicyclists in rural areas. Rural communities were identified as lacking accessibility, a key issue for transportation equity (Shaheen et al., 2018). A route preference survey for adults found that rural roads and routes on major streets were least likely to be chosen for cycling (Winters and Teschke, 2010).
2.3.2.2.3 Driveway and Parking
Though on-street parking may be beneficial for traffic calming (Ewing, 1999; Sisiopiku, 2001), it poses a potential danger to the bicyclists when vehicles cross the bicyclists’ path to park or leave, as well as open the door in a bicyclists’ path (Hunter et al., 1999, Johnson et al., 2013, Teschke et al., 2012). Striping a bike lane or properly marking a shared lane may help reduce the risks by guiding bicyclists farther from the dangerous door zone (DiGioia et al., 2017). Similarly, Furth et al. (2010) tested the hypothesis that marking narrower parking lanes can create additional operating space for bicyclists by inducing motorists to park closer to the curb.
The presence of on-street parking adjacent to the bike lanes also impacts cycling safety. Dooring crashes are one of the most common causes of the urban bicycle-motor vehicle collisions (Schimek, 2018). Parked vehicles increased the risk of conflict with car doors in the case of parallel or longitudinal parking facilities (Pai, 2011; Vandenbulcke et al., 2014). Duthie et al. (2010) suggested
that “the provision of a buffer between parked cars and bicycle lanes is the only reliable method for ensuring that bicyclists do not put themselves at risk of being hit by opening car doors.” After reviewing all available studies of bicyclist position in bike lanes adjacent to on-street parking, Schimek (2018) drew the same conclusion. The results suggested that almost all bicyclists were observed riding within range of opening doors when the bike lanes met minimum standards. However, providing an additional 3–4 ft buffer between the bike lane and parked cars could completely change the scenario. As Schimek (2018) pointed out, while all the design guides recently developed in North America for separated bike lanes include a buffer to account for the door zone, only the Ontario design guide has a similar requirement for standard bike lanes. He proposed that all design guidance should incorporate the buffer requirement for standard bike lanes adjacent to on-street parking.
Research has revealed that the risks of severe bicycle crashes tend to be positively associated with side-access densities (Ma et al., 2010). Hunter et al. (1996) and Hunter et al. (1999) observed that crashes and conflicts frequently occur at driveways and intersections. The location and design of driveways, together with parking and bicycle facilities, pose sight distance challenges to motorists and bicyclists (Dixon et al., 2009). Parking lot entranceways and parking lots with no physical barrier from sidewalks could cause bicycle crashes on sidewalks (Kim and Kim, 2015). Pulugurtha and Thakur (2015) found that limiting driveways to less than 50 per mile and unsignalized approaches to less than 10 per mile could help to reduce the occurrence of bicycle crashes and lower the risk to bicyclists on roads. Bicycle crash risks are also influenced by other land use-related factors. For instance, areas with higher numbers of road signals, street parking signs, and automobile trips are more likely to have higher numbers of bicycle crashes (Chen, 2015). Bicyclist injury severity is negatively associated with employment density and land use mixture (Chen and Shen, 2016). In general, off-arterial bicycle routes are safer than on-arterial bicycle routes (Chen, 2015).
2.3.2.2.4 Transit
When it comes to the transit zones, curbside stops and bus bays can reduce separated bicycle lane capacities (Yan et al., 2020). The curbside stops were found to have a more significant impact on separated bicycle lanes’ capacity than bus bays. Different types of bus stops could also have a distinct impact on bicycle speed (Zhang et al., 2015).
Kim et al. (2010) found that transit variables, such as the number of bus stops and the bus route length, were positively associated with bicycle collisions. Feng et al. (2013) also identified the
association between increased collisions and increased bus stops, consistent with Kim’s findings (2010). In addition, the longer distance between crosswalks and bus stops could be positively associated with bicyclist crashes (Kim and Kim, 2015).
Installing bike lanes adjacent to loading zones and transit zones poses challenging issues. Results from video analysis of a hotel loading zone in Washington, DC, showed that about one-third of motor vehicles entering the loading zone improperly blocked the through bike lane, which in turn forced bicyclists out of the bike lane (Mosereet et al., 2014). The danger increased when bicyclists were traveling downhill at higher speeds or down busy streets with loading zones (Butrina et al., 2016). However, the loading zone may still be an important element of roadway geometry. A study suggested that from the bicyclists’ perspectives, increasing the availability of commercial vehicle loading zones could positively affect bicyclist safety because illegally parked trucks were a more serious problem than the locations of commercial vehicle loading zones (Butrina et al., 2016).
2.3.2.3 Bicyclist Exposure and Speed Limits
Bicyclist exposure is a measure of the number of potential opportunities for a motor vehicle-involved crash to occur. Exposure has been defined based on direct counts (Ferguson et al., 2014; Fournier et al., 2019; Ohlms et al., 2019; Sayed et al., 2013), population (Alliance for Biking and Walking, 2016; Chu, 2003; Chu, 2009; National Complete Streets Coalition, 2014; Retting, 2019; Schneider et al., 2015), hours of travel (Blaizot et al., 2013; Chu, 2003; Chu, 2009; Guler and Grembek, 2016), miles of travel (City of Copenhagen, 2002; Blaizot et al., 2013; Kamel and Sayed, 2020; Salon, 2016; Schneider et al., 2015; Turner et al., 2017), and number of trips (Guler and Grembek, 2016; Lyons et al. 2014; Rasmussen et al. 2013; Schneider et al. 2015) (Table 6).
Table 6. Bicyclist Exposure and Speed Limits.
| Contextual Factors | Summary of Review Findings | References |
|---|---|---|
| Bicyclist counts |
| Dadashova and Griffin (2020); Dadashova et al. (2020); Ferguson et al. (2014); Fournier et al. (2019); Griffin and Jiao (2019); Ohlms et al. (2019); Sayed et al. (2013); Turner et al. (2017) |
| Distance traveled |
| City of Copenhagen (2002); Blaizot et al. (2013); Kamel and Sayed |
| Factors | Summary of Review Findings | References |
|---|---|---|
| (2020); Salon (2016); Schneider et al. (2015); Turner et al. (2017) | ||
| Effect of bicyclist exposure on conflict rates |
| City of Copenhagen (2002); Ekman (1996); Jacobsen (2003); Kaplan and Giacomo Prato (2015); Marshall and Garrick (2011); Nordback and Marshall (2011) |
| Number of trips |
| Blaizot et al. (2013); Guler and Grembek (2016); Lyons et al. (2014); Rasmussen et al. (2013) |
| Population |
| Alliance for Biking and Walking (2016); Chu (2003); Chu (2009); National Complete Streets Coalition (2014); Retting (2018); Schneider et al. (2015) |
| Speed limit |
| Abdel-Aty and Keller (2005); Chen and Shen, 2016; Kim et al. (2007); Leaf and Preusser (1999); Limpert (1994); Peden (2004); Renski et al. (1999) |
| Time traveled |
| Blaizot et al. (2013); Chu (2003); Chu (2009); Guler and Grembek (2016) |
| Traffic volume (e.g., annual average daily traffic [AADT], or annual average daily bicycles [AADB]) |
| Dixon et al. (2012); Kim et al. (2007); Nordback et al. (2014) |
The lack of readily available bicyclist exposure data has been a common barrier for accurately identifying and prioritizing high-crash (or high-risk) locations, interpreting year-to-year trends in crash statistics, or understanding bicyclist crash causation (Turner et al., 2017). The units of bicyclist exposure typically are a volume count for a specified period or distance traveled (calculated by multiplying a count by a street crossing width or road segment length) (Turner et al., 2017). When necessary, the units could also be based on time, trip, and population. An FHWA report
summarized the appropriate uses and the pros and cons of each bicyclist exposure to help practitioners choose the appropriate unit of exposure for nonmotorized travel modes (Turner et al., 2017).
Most of the facility-specific exposure analyses used bicyclist count data from one or both of the following sources: direct measurement and/or estimation and models (FHWA, 2017). Many cities are now directly collecting bicyclist count data on an annual basis, but at a very limited number of locations, often having the most bicyclist activity in the city. Various estimation and modeling methods are often used to provide count estimates for all locations within a city or other defined area to fill the gap. In recent years, some studies have also tried to use crowdsourced data to estimate the bicyclist counts (Dadashova et al., 2020; Dadashova and Griffin, 2020; Griffin and Jiao, 2019). The direct demand models have been the most widely used models for facility-specific exposure estimation thus far. Direct demand models are a form of travel demand models that use land use and form, street type, and other contextual factors to estimate bicyclist exposure (FHWA, 2017). In recent years, some studies have also tried to use emerging data sources to develop direct demand models to estimate bicyclist counts (Dadshova et al., 2020; Dadashova and Griffin, 2020; Lee and Sener, 2020; Sanders et al., 2017). Other types of modeling approaches include regional travel demand models, geographic information systems (GIS)-based models, trip generation and flow models, network analysis models, discrete choice models, and simulation-based traffic models (Turner et al., 2017).
The effect of bicyclist exposure on bicycle safety has been widely discussed in the literature. Many studies report a decreasing effect of bicyclist exposure on conflict rates. A study by Ekman (1996) determined that the conflict rate for an individual bicyclist was higher when the number of bicyclists was low, with this conflict rate decreasing as the flow of bicyclists increased. The City of Copenhagen revealed in their 2002–2012 Cycle Policy report that the risk of an individual bicyclist decreased significantly when the number of bicyclists increased; a 40 percent increase in bicycle kilometers traveled corresponded to a 50 percent decrease in seriously injured bicyclists (City of Copenhagen, 2002). Jacobsen (2003), Nordback and Marshall (2011), Kaplan and Giacomo Prato (2015), and others supported the conclusion that more bicyclists on the road can help reduce the crash risk for the individual bicyclist.
Studies generally attribute the bicyclist safety in numbers effect to changes in driver behavior and awareness. A study based on 11 years of road safety data (1997–2007) from 24 California cities
suggested that safety for all road users may result from reaching a threshold of bicyclist volumes that compels drivers to drive slower (Marshall and Garrick, 2011). It is also understood that the bicycle infrastructure itself might encourage traffic calming; the actual presence of many bicyclists induced by the existing bikeway can change the dynamics of the street enough to lower vehicle speeds.
Many researchers have discovered that traffic flow characteristics such as speed limit, peak-hour traffic, and traffic volumes like annual average daily traffic (AADT) and annual average daily bicycles (AADB) are risk factors for bicyclists. Dixon et al. (2012) found that AADT increased the risk for bicyclists in an urban environment. Nordback et al. (2014) discovered that bicycle collisions were equally sensitive to both AADT and AADB. Higher posted speeds increased the probability of a bicyclist fatality. Many studies concluded that reduced speeds would have been effective in reducing nonmotorized crashes and severities (Abdel-Aty and Keller, 2005; Leaf and Preusser, 1999; Limpert, 1994; Peden et al., 2004; Renski et al., 1999). Posted speed limit was positively associated with the probability of evident injury and severe injury or fatality (Chen and Shen, 2016). Kim et al. (2007) found that any speed greater than 20 mph and heavy vehicle traffic increased the risk of fatal injury. The study also considered the peak-hour effects and found an increased risk of fatal injuries for bicyclists during the a.m. peak (6:00 a.m.–9:59 a.m.).
2.3.2.4 Behavioral Factors
Driver and bicyclist behavior directly influences bicycling safety. Behavioral factors that may influence bicyclist crash frequency and severity include bicyclist/driver inattention and distraction, traffic rule violations, use of protective gear, and use of alcohol (Table 7).
Table 7. Behavioral Factors.
| Contextual Factors | Summary of Review Findings | References |
|---|---|---|
| Bicyclist inattention/distraction |
| Coleman and Mizenko (2018); Dai and Hudson (2019); Schroeder and Wilbur (2013a, 2013b) |
| Contextual Factors | Summary of Review Findings | References |
|---|---|---|
| Bicyclist traffic rule violation (e.g., RLV, FTYROW) |
| Coleman and Mizenko (2018); Guo et al. (2018); Johnson et al. (2011); National Survey of Bicyclist and Pedestrian Attitudes and Behavior (2012); Pai and Jou (2014); Schroeder and Wilbur (2013a, 2013b) |
| Use protective measures (e.g., a helmet, a bicycle light, and reflective clothes) |
| Andersson and Bunketorp (2002); Chen and Shen (2016); Høye (2017); Kullgren et al. (2019); MacAlister and Zuby (2015); Martínez-Ruiz et al. (2013); Moahn et al. (2006); Noland and Quddus (2004); Räsänen and Summala (1998); Schroeder and Wilbur (2013a); Tin Tin et al. (2013); Vanparijs et al. (2015); |
| Alcohol use |
| Andersson and Bunketorp (2002); Boufous et al. (2012); Eluru, Bhat and Hensher (2008); Haleem and Abdel-Aty (2010); Kim et al. (2007); Martínez-Ruiz et al. (2013); National Center for Statistics and Analysis (2019a); Noland and Quddus (2004); Olkkonen and Honkanen (1990); Robartes and Chen (2017); Rodgers (1995); Schepers and den Brinker (2011) |
| Drivers’ attitudes and behaviors |
| Beck et al. (2019); Goddard et.al (2020); Goddard (2017); Räsänen and Summala (1998); Rubie et al. (2020); Walker (2007) |
At the national level, the combined FARS dataset from 2010 to 2015 showed that bicyclists’ failure to yield right-of-way (FTYROW) to vehicles was the most common bicyclist action (35 percent) prior to bicyclist fatalities (Coleman and Mizenko, 2018). The next most common actions included no improper action (26 percent); not being visible (12 percent); failure to obey traffic signs, signals, or an officer present (12 percent); and wrong-way riding (8 percent). Inattentiveness accounted for 3 percent of bicyclist actions prior to bicyclist fatalities in this dataset.
Compared to other recent findings, these results may suggest that the inattentiveness of bicyclists may vary by context. A study of 2011–2018 fatal and severe bicycle crashes in TxDOT’s Austin District found that the top three bicyclist crash-contributing factors among drivers were driver inattention (22 percent), failure to yield right-of-way when turning left (21 percent), and failure to yield right-of-way to a bicyclist (8 percent) (Dai and Hudson, 2019). For bicyclists, the top three factors were other (17 percent), bicyclist inattention (13 percent), and failure to yield right-of-way to a vehicle (12 percent).
The safety concerns regarding inattention and traffic violations were also highlighted in the 2012 National Survey of Bicyclist and Pedestrian Attitudes and Behavior (NSBPAB) results. Drivers or riders who were distracted or not obeying traffic laws were among the five most frequently reported bicycling or driving behaviors that made respondents consider it dangerous to bicycle in their neighborhoods (Schroeder and Wilbur, 2013b). As a distraction for bicycling, one-fifth of the respondents who rode a bicycle within the year before the survey reported using electronic devices during at least some of their trips (Schroeder and Wilbur, 2013a). Regarding compliance with traffic laws, almost all respondents were aware that the rules that apply to motor vehicles regarding traffic lights and stop signs also apply to bicyclists (Schroeder and Wilbur, 2013a). However, awareness is not equal to compliance. Red light violation (RLV) is a frequent and typical bicyclist behavior (Pai and Jou, 2014), especially at signalized intersections, when bicycles are turning left, and for young bicyclists (Guo et al., 2018; Johnson et al., 2011).
The 2012 NSBPAB survey also assessed the awareness of helmet laws. Forty-three percent of the respondents believed their locality had such a law (Schroeder and Wilbur, 2013a). However, nearly half of the respondents hadn’t worn a helmet when bicycling in the past year. The rate of bicyclists wearing a helmet in crashes was found to be very low (MacAlister and Zuby, 2015). Although wearing a helmet would not reduce the crash risk (Vanparijs et al., 2015), it could halve the risk of serious head or brain injuries among crash-involved bicyclists (Høye, 2017). A recent study
estimated that almost half of nonhelmeted bicyclists who died would have survived with a helmet (Kullgren et al., 2019). When bicyclists were not wearing a helmet, they were at higher risk of injury (Andersson and Bunketorp, 2002; Martínez-Ruiz et al., 2013; Moahn et al., 2006; Noland and Quddus, 2004; Räsänen and Summala, 1998; Tin Tin et al., 2013). In addition to wearing a helmet, using bicycle lights and reflective clothes could also reduce bicyclists’ crash risk (Chen and Shen, 2016; Høye, 2017).
Driving or biking under the influence of alcohol is another serious risk factor for bicycle crashes, especially for fatal crashes (Andersson and Bunketorp, 2002; Boufous et al., 2012; Eluru et al., 2008; Haleem and Abdel-Aty, 2010; Kim et al., 2007; Martínez-Ruiz et al., 2013; Noland and Quddus, 2004; Olkkonen and Honkanen, 1990; Rodgers, 1995; Schepers and den Brinker, 2011). In 2017, alcohol involvement (blood alcohol content [BAC] of 0.1+ g/dl) was reported in 37 percent of the fatal bicyclist crashes in the United States (National Center for Statistics and Analysis, 2019a). A recent study found that driver intoxication could increase the probability of a bicyclist fatality sixfold and double the risk of a severe injury; bicyclist intoxication could increase the probability of a fatality by 36.7 percent and double the probability of severe injury (Robartes and Chen, 2017).
Although drivers’ attitudes and behaviors toward bicyclists significantly influence bicycle safety, there is not enough systematic study on this subject. Through the in-depth analysis of 188 bicycle-vehicle crashes in four cities, Räsänen and Summala (1998) revealed that drivers’ attention greatly influenced crashes. An improper allocation of attention may lead drivers to ignore a bicyclist who comes from an unexpected direction, such as drivers turning right hitting bicyclists coming from the left. Goddard et.al (2020) found that conscious attitudes affect how quickly and closely drivers overtake bicyclists, including drivers’ attitudes about bicyclists, self-identification, cycling frequency, and concerns about their knowledge or judgment about overtaking.
In addition, limited findings suggested that drivers do not treat all road users equally. Their behavior could change according to the visible features of other road users (Goddard, 2017). For instance, drivers may alter overtaking based on the bicyclist’s appearance during an encounter, using greater passing distance when the bicyclist was without a helmet or appeared female (Walker, 2007). Because of social dominance and implicit bias, drivers widely feel the perceived pressure to overtake bicyclists and fail to check for bicyclists before turning (Goddard, 2017).
A few studies have examined driver behavior and attitudes specifically regarding on-road bicycle facilities, with the evidence indicating a complex relationship. Bicycle facilities may encourage
drivers to look out for bicyclists and improve predictability. For example, in her research on drivers’ and bicyclists’ roadway design preferences, Sanders (2016) found that 94 and 85 percent of non-bicycling drivers agreed that bicycle lanes “tell drivers to expect bicyclists” and “make bicyclists more predictable on the roadway,” respectively. In contrast, just 9 percent agreed that bicycle lanes “encourage drivers to drive closer to bicyclists.” However, bicycle facilities may also communicate to drivers that bicyclists are provided for and no additional care is needed. In their study of driver passing events, Beck et al. (2016) found that drivers passed bicyclists with less distance when a bicycle lane was present. Despite a lane’s presence, close passes can still feel scary to bicyclists, particularly next to parking and particularly for less experienced bicyclists, underscoring a need to build adequate space into the facility via a wider lane or buffer. The inconsistent effects of on-road bicycle facilities on lateral passing distance when motor vehicles overtake bicycles was also confirmed by the meta-analyses conducted by Rubie et al. (2020).
2.3.2.5 Demographic and Socioeconomic Factors
Demographic and socioeconomic factors may influence the probability and severity of bicyclist crashes. Although these factors are not directly related to bikeway design, the demographic and economic characteristics of the location may, however, influence the presence of a bikeway and should be considered for developing the data-driven guidelines. The bicyclist safety literature has considered the following socioeconomic factors: age, disability, gender, income, and race/ethnicity (Table 8).
Table 8. Demographic and Socioeconomic Factors.
| Contextual Factors | Summary of Review Findings | References |
|---|---|---|
| Age |
| Boufous et al. (2012); Branion-Calles et al. (2019); Chen and Shen (2016); Kim et al. (2007); Kröyer and Väg (2015); Martínez-Ruiz et al. (2013); National Center for Statistics and Analysis (2019a); Noland and Quddus (2004); Schepers and den Brinker (2011); Tin Tin, Woodward and Ameratunga, (2013) |
| Disability |
| Clayton et al. (2017) |
| Gender |
| Boufous et al. (2012); Branion-Calles et al. (2019); Ekman et al. (2001); Eluru et al. (2008); Kim et al. (2007); National Center for Statistics and Analysis (2019a); Noland and Quddus (2004); |
| Schepers and den Brinker (2011); Tin Tin et al. (2013); Vanparijs et al. (2015) | |
| Income |
| Branion-Calles et al. (2019); Kim et al. (2010); Rebentisch et al. (2019) |
| Race/ethnicity |
| Marshall et al. (2018) |
Bicycle crash statistics have shown that bicyclists belonging to a certain age or gender were involved in more bicycle crashes than others. According to NHTSA, the average age of bicyclists killed in motor vehicle crashes has steadily increased from 41 to 47 over the past ten years (2008–2017) (National Center for Statistics and Analysis, 2019a). In 2017, the largest number of bicyclist fatalities was in the 50–54 age group. Studies suggest that age is positively related to increased crash severity. Some studies have found that older adult bicyclists have an elevated risk of serious or fatal injuries (Chen and Shen, 2016; Kröyer and Väg, 2015), while others have found that riders over age 45 are more likely to be involved in a more severe crash (Boufous et al., 2012; Kim et al., 2007; Noland and Quddus, 2004; Schepers and den Brinker, 2011; Tin Tin et al., 2013). Different from bicycle-vehicle crashes, one study found that bicyclists between the age of 10–19 were more likely to be involved in a higher severity crash (Martínez-Ruiz et al., 2013).
Males were more at risk for higher severity crashes (Boufous et al., 2012; Ekman et al., 2001; Eluru et al., 2008; Kim et al., 2007; Noland and Quddus, 2004; Schepers and den Brinker, 2011; Tin Tin et al., 2013). In 2017, 89 percent of bicyclists killed were males (National Center for Statistics and Analysis, 2019a), and the population-based bicyclist fatality rate was eight times higher for males than for females. Similar findings were also discovered in a review of 20 bicycle safety papers published prior to 2015 (Vanparijs et al., 2015). Because males tend to bicycle more than females, and may be more likely to bike in riskier contexts like along higher-speed roadways, these findings do not necessarily represent overall risk; additional research on gender-based exposure is needed to understand the degree to which males are actually more at risk or just more exposed, as well as the extent to which bicycle facilities attenuate risk for both males and females.
Besides age and gender, the impact of other demographic and socioeconomic factors like race, ethnicity, and income have also been discussed in bicycle safety and equity studies. Disparities were found in road fatalities along racial and ethnic lines, particularly for pedestrians and bicyclists in predominantly Black or Hispanic neighborhoods (Marshall et al., 2018). Kim et al. (2010) found that demographic variables, such as the number of people living below the poverty level, were significant and positively associated with bicycle collisions. Findings connecting income, race, ethnicity, and safety likely reflect the reality that higher-income and gentrified areas tend to have access to more and better bicycle infrastructure, while lower-income communities and communities of color have not historically had such access (Rebentisch et al., 2019). Irrespective of the presence of bicycle infrastructure, there may also be a connection between the types of roadways that surround lower-income communities and communities of color (e.g., higher-speed arterials) compared to higher-income neighborhoods.
Although bicycling can benefit and improve the health of people with disabilities, disability is under-researched in cycling studies. Many issues must be resolved before cycling infrastructure is accessible to (and usable by) people with disabilities (Clayton et al., 2017); additional research is needed to better understand these issues and potential solutions.
2.3.2.6 Meteorological Factors
Recent research revealed that while more bicycle crashes occurred in daylight (Beck et al., 2016; Kullgren et al., 2019), more bicyclist fatalities occurred at night (National Center for Statistics and Analysis, 2019a). Dividing the time of day into eight 3-hr intervals starting at midnight, the period with the highest frequency of bicyclist fatalities during weekdays was 6:00 p.m. to 8:59 p.m. (20 percent) (National Center for Statistics and Analysis, 2019b); the next highest frequency occurred between 3:00 p.m. and 5:59 p.m. (18 percent). On weekends, the period with the highest frequency of bicyclist fatalities was 9:00 p.m. to 11:59 p.m. (25 percent), followed by the period from 6:00 p.m. to 8:59 p.m. (22 percent).
Bicyclists have a higher probability of being in a fatal crash under poor lighting conditions. This finding was supported in several studies (Abdel-Aty, 2003; Aziz et al., 2013; Das and Sun 2015; Haleem et al., 2015; Hunter et al., 1996; Klop and Khattak, 1999; Sullivan and Flannagan, 2011; Sze and Wong, 2007; Ulfarsson et al., 2010). The odds of a fatal injury in daylight were reduced by 75 percent compared to dark conditions with no lighting. Street lighting reduced the same odds by
42 percent at midblock locations (Siddiqui et al., 2006). Klop and Khattak (1999) concluded that street lighting decreased the severity of injury compared to dark conditions in rural areas.
Weather, especially in winter, is often discussed as a cycling barrier. Kim et al. (2007) found that bad weather increased the fatality probability by 128 percent. December and January were found to have the highest bicycle incident rate (Hoffman et al., 2010). Bicyclists perceived a considerable increase in the incident risk during winter, mainly due to slipperiness and darkness (Niska, 2010). The incident rate for bicyclists when the roads were snowy or icy could be twice as high as the incident rate with dry surface conditions (Vanparijs et al., 2015).
Table 9. Meteorological Factors.
| Contextual Factors | Summary of Review Findings | References |
|---|---|---|
| Lighting condition |
| Abdel-Aty (2003); Aziz et al. (2013); Beck et al. (2016); Das and Sun (2015); Haleem et al. (2015); Hunter et al. (1996); Klop and Khattak (1999); Klop and Khattak (1999); Kullgren et al. (2019); Siddiqui et al. (2006); Sullivan and Flannagan (2011); Sze and Wong (2007); Ulfarsson et al. (2010) |
| Time of day |
| National Center for Statistics and Analysis (2019a, 2019b) |
| Weather condition |
| Hoffman et. al (2010); Kim et.al (2007); Niska (2010); Vanparijs et al. (2015) |
2.4 SAFETY EFFECTIVENESS EVALUATION METHODS AND MODELS
Safety analysis is conducted in two stages. In the first stage, the study design is determined, usually based on the availability of the data. Once the study design is selected, the appropriate regression model is applied to develop crash prediction models for estimating the effect of the on-street facility design and/or other crash-contributing factors on bicyclist crashes or incidents involving bicyclists. In the following sections, the research team discusses the study designs and statistical models used in bicyclist safety studies and lists some of the noteworthy practices. Note that all of the studies reviewed by the research team were quantitative studies. However, for the sake of brevity, the research team included only the most relevant studies. The objective of this section is to provide an overview of methodologies and modeling techniques.
2.4.1 Study Design
The HSM suggests using the following study designs to evaluate the safety effectiveness of a treatment or countermeasure that is applied to a site with base conditions (AASHTO, 2010):
- Observational B/A studies.
- Observational C/S studies.
- Experimental B/A studies.
Among the three study designs, observational B/A studies are most commonly used in highway safety analysis. In these studies, analysts gather and analyze data for two periods, before and after the implementation of a single or multiple safety treatments to a site with given base conditions. These studies use three years of before and after crash data to account for RTM bias observed in crash data. These analyses usually produce a CMF that is calculated as follows:
| (1) |
Where:
- CMFT is the safety effect of the treatment.
- Crash FrequencyAfter,Treated is the observed crash frequency after the installation of the treatment.
- Crash FrequencyBefore,Treated is the observed crash frequency before the installation of the treatment.
There are several methods that can be used in B/A studies to evaluate the safety effectiveness of a single treatment or group of treatments and countermeasures such as naïve B/A, nonlinear traffic volume correction, shifts in crash type proportions, comparison group method with and without traffic volume correction, EB, full Bayesian (FB), and other methods. Among these methods, the EB B/A method—proposed by Hauer (1997)—is preferred. However, the FB B/A method can also be applied if the sample size is very small. The EB method estimates the expected number of crashes that would have occurred had there been no treatment and compares it to the actual number of crashes in the after period. It accounts for RTM bias, changes in traffic volumes, and temporal effects, making it one of the most reliable methods for CMF development. The EB method is based on a weighted average principle. It uses a weight factor, w, to combine observed (CObserved) and predicted crash frequencies (CPredicted) to estimate the expected crash frequency (CExpected) as follows:
| CExpected = w ∙ CPredicted + (1 − w) ∙ CObserved | (2) |
Where:
- w is a weight factor, which depends on the overdispersion obtained from the SPF.
- CExpected is the expected crash frequency.
- CPredicted is the predicted crash frequency, usually calculated using the SPF and CMFs.
- CObserved is the observed crash frequency.
In C/S studies, data are gathered from treated sites only in the after period and from untreated sites in the same period. The two types of sites are similar in characteristics except for the treated feature. In these studies, analysts can develop CMFs using the crash frequency of the treated and the control sites as follows:
| (2) |
Where:
- CMFT is the safety effect of the treatment.
- Crash FrequencyAfter,Treated is the observed crash frequency after the installation of the treatment at the treated site.
- Crash FrequencyAfter,Control is the observed crash frequency at the control site in the after period.
The C/S method is appropriate when implementation dates of treatments are unknown, crash and volume data for the before period are not available, and there is a need to account for the effects of roadway geometric characteristics and other features by creating a CMF function rather than using a single CMF value. The C/S method has some disadvantages. First, it does not account for RTM effects. Second, it is difficult to assess whether the observed differences between treatment and control sites are due to the treatment or other external factors. These studies are also subject to selection bias. The treated sites usually experience a high number of crashes compared to the control sites. This implies that, even if the number of crashes decreases after the treatment, the number of crashes could still be higher compared to the crashes at the control sites, yielding biased results. One method that can be used to overcome this issue is propensity score matching (PSM) and/or propensity score weighting (PSW). The PSM/PSW methodology is based on the data matching principle, where the sites with treatment are matched with the sites without the treatment (i.e., the control sites). A ratio of 1:4 is recommended to match each single treated site with the control sites. The matching of sites is then based on the list of covariates (i.e., context-specific factors) that affect the presence of the treatment (i.e., the bikeway). These covariates are then used to calculate the conditional probability of receiving the treatment (i.e., propensity score) as follows:
| (3) |
Where:
- P(Ti|Xi) is the propensity score denoting the probability of the site i receiving the treatment T.
- Ti is the treatment status of the site i which takes binary values {0, 1}.
- Xi is the set of the covariates that vary with the treatment.
- αi is the coefficient of covariates estimated through binary logistic regression.
The distribution of propensity scores is expected to be similar for treated (P(TA|XA)) and control sites (P(TB|XB)). After sampling, the data regression models (discussed below) are applied to estimate the CMFs of the treatment as follows:
| CMFT = C × eβT | (4) |
Where:
- CMFT is the crash modification factor of the treatment T.
- βT is the effect of the treatment estimated from the regression model.
- C is the intercept parameter.
Finally, in experimental studies, comparable sites of similar traffic volume and geometric features are randomly assigned to a treatment or a nontreatment group. The treatment is then implemented at the sites in the treatment group, and crash and traffic volume data are obtained before and after implementing the treatment. Although these studies minimize RTM bias, they involve improvements at randomly selected sites, making transportation agencies reluctant to randomly allocate their limited safety funds for experimental purposes.
In addition to the study design methods included in the HSM, select studies on bicyclist safety have used other types of designs such as a case-control approach.
2.4.2 Statistical Models
The choice of regression model or any statistical model depends on the type of crash data. Two types of crash data are used in safety studies: aggregated and disaggregated. In this section, the researchers discuss the types of statistical models used to analyze each type of bicyclist crash data.
Note that not all the bicyclist crash data models include a bicycling facility, mainly because these data are not readily available and collecting it requires additional effort. However, this limitation does not impact the choice of statistical model and does not undermine the research findings.
2.4.2.1 Aggregated Crash Data Analysis
Aggregated crash data refer to the number (i.e., count data) of crashes that have been aggregated over a roadway segment or any other spatial unit, such as census tract, block group, or traffic analysis zone (TAZ). Normally, count data models are used to estimate the effects of the bikeway and other crash-contributing factors on the frequency of total or fatal and injury crashes, and the findings are interpreted in terms of percentage increase or decrease in the number of crashes. These models are based on a Poisson-based process, which evaluates the probability of a crash taking place under the given circumstances. However, due to rarity and small sample sizes, crash data do not always follow a Poisson distribution. Hence, negative binomial (NB) models, which better handle overdispersed data, have been implemented in safety literature. In its definition as a Poisson-Gamma mixture, the NB model takes the following form:
| λi = exp(βkXki + εi) | (5) |
Where:
- λi is the long-term expectation of crashes at segment i.
- exp(εt) is a gamma distributed error term with G(1, α2).
- α is a dispersion parameter.
To normalize the count data, the offset variable is used as follows:
| (6) |
| (7) |
Where:
- VMTi is vehicle miles traveled at segment i.
- Li is length of segment (miles) i.
- AADTi is AADT of segment i.
A few studies have used count data models to analyze the effects of crash-contributing factors on bicyclist crashes. Oh et al. (2008) used the Poisson distribution to analyze bicycle collisions at urban signalized intersections. Another study used the Poisson distribution to evaluate a large cycling event in New Zealand and determine what factors affected risk level for bicyclist incident rates (Tin Tin et al., 2013). The majority of bicyclist safety studies have used a NB model or some variation of it to study the effects of a bicyclist facility, as well as other crash-contributing factors, on bicyclist safety. Oh et al. (2008) used a NB model when analyzing bicycle collisions at signalized intersections in an urban area. In a study that considered crashes involving a bicycle and motor vehicle at a signalized intersection, Wang et al. (2004) used three different NB models to estimate the risk of such collisions. Noland and Quddus (2004) used a fixed-effect NB model to analyze the risk factors of pedestrian and bicycle casualties for various regions in England. Schepers et al. (2011) used a NB regression model to study various factors (both road and bicycle) that influenced bicycle risk factors at signalized intersections to prioritize their safety levels. Raihan et al. (2019) conducted a C/S analysis using zero-inflated NB (ZINB) models to develop bicycle crash CMFs associated with various roadway design elements (e.g., presence of bicycle lanes, speed limit, lane width, etc.).
In the HSM, NB models are used to develop SPFs—a form of a NB model that uses exposure as an explanatory factor to assess the safety of a facility with base conditions (i.e., the number of estimated total or fatal and injury crashes of a roadway segment that has the base conditions defined by the HSM). Dixon et al. (2012) developed SPFs and two types of linear regression models (urban and rural) to quantify SPFs of driveways on state highways; these SPFs were mainly focused on and applied to vehicles. Nordback et al. (2014) used Poisson modeling to develop SPFs for bicycles in U.S. cities. Park et al. (2015) developed Florida-specific SPFs for evaluating the impact of adding bicycle lanes on 227 roadway segments in Florida. Shirani-bidabadi (2020) developed bicycle-vehicle crash specific SPFs for Alabama using a Conway–Maxwell–Poisson (COM-Poisson) distribution and multiplicative adaptive regression splines models.
A few studies have tried to develop NB models to study bicyclist crashes at a macro level in recent years. Vandenbulcke et al. (2014) used a spatial Bayesian modeling approach with a binary dependent variable constructed from a case-control strategy to predict the cycling crash risk in the Brussels-Capital Region at the network level. Amoh-Gyimah et al. (2016) conducted a cross-comparison of various estimation methods (e.g., nonspatial NB, random parameter NB, and Poisson-Gamma conditional autoregressive [CAR]) for modeling bicyclist and pedestrian crashes that occurred at a Statistical Area Level 2 (SA2)—is a spatial unit defined by the Australian 2011 census classification. Wang et al. (2017) used NB and random parameter NB models to study the effect of zonal factors on bicyclist crash frequency at a TAZ level. Saha et al. (2018) also used CAR models within the Bayesian framework to evaluate Florida’s bicyclist crashes at a block group level. Guo et al. (2018) compared Poisson lognormal (PLN), random intercepts PLN, random parameters PLN, and spatial PLN models to explore bicyclist crashes at a TAZ level. Ding et al. (2020) used a panel mixed NB model to evaluate the role of infrastructure and land use on bicyclist crashes. As observed, the interest in macro-modeling of bicyclist crashes has been gaining momentum in recent years.
A limited number of studies have used other types of models and simple exploratory analysis tools to study aggregated bicyclist crash data. Exploratory data analysis methods were used to better understand various bicycle crash statistics (Bíl et al., 2010; de Geus et al., 2012; Räsänen and Summala, 1998; Summala et al., 1996). One study used basic statistical analysis tools as well as an incident rate method to study commuter bicyclists involved in minor accidents and determine
potential causes for these crashes (de Geus et al., 2012). Various models such as structural equation models were also considered in some studies (Bíl et al., 2010; Dolatsara, 2014).
2.4.2.2 Disaggregated Crash Data Analysis
In disaggregated crash data analysis, each crash is treated as an individual event, and its severity or type is analyzed as the function of various crash-contributing factors. Normally, discrete choice models, such as logistic regression, are used to estimate the impact of explanatory factors on the severity of crashes. In logistic regression, the outcome, or dependent variable, is a binary (fatal or injury) or dichotomous factor (various injury levels). Logit model estimates the probability (p(yi)) of a crash (Yi) resulting in either fatal or nonfatal injury crash given the values of the explanatory variables (X) as follows:
| (8) |
Where:
| (9) |
| β ∙ X = β0 + β1x1 + … + βkxk | (10) |
Where:
- p(Yi) is the probability of a crash taking place.
- xk is the crash-contributing factor.
- βk is the estimated impact of the crash-contributing factor.
- k is the number of crash-contributing factors.
Logit models were very commonly used in previous studies concerning bicycle-related crashes due to the models’ ability to discretely examine the various levels of crash severity. Eluru et al. (2008) created a variation of the logit model—a mixed generalized ordered response logit model—due to the limitations of a standard ordered response logit model to study pedestrian and bicyclist injury severities in crashes. Kim et al. (2007) used a multinomial logit model for predicting the probability of different severity levels for bicycle-vehicle crashes in North Carolina. Another study used a mixed multinomial model to investigate three different types of crashes and the factors involved in those crashes (Pai, 2011). Zahabi et al. (2011) used an ordered logit model to estimate the impact of various crash-contributing factors to the severity of bicyclist crashes in Montreal. Boufous et al. (2012) used a logit model to determine the risk factors for bicyclist injuries in Victoria, Australia.
Very few studies used random parameter or mixed-effects logistic models to identify the list of factors affecting bicyclist crash severity (Aziz et al., 2018; Behnood and Mannering, 2017; Ulak et al., 2018). One of these models’ limitations is that they are normally based on the crash data description collected by police officers and do not account for other contextual factors such as land use or socioeconomic characteristics of the area.
2.5 CHAPTER SUMMARY
This chapter presented a summary of existing literature on bicyclist safety and safety effectiveness of on-street bicycle designs installed at midblock locations. The research team found that bicycle fatalities have been steadily increasing as a percentage of U.S. traffic fatalities since 2010 (NHTSA, 2016). While bicycle volumes have increased dramatically in some places, this is not true nationwide and cannot be considered a justification for the increase in fatalities. As can be seen from the review, research on bicycling safety and bicycle facilities has increased significantly over the last two decades, including innovations in data sources (e.g., surrogate measures of safety) and methods (e.g., naturalistic bicycling). Yet important gaps in understanding remain.
First, the research on bicycle crashes indicated that despite a higher number of bicycle crashes at intersections, bicyclists are more likely to sustain a fatal or serious injury while riding on a segment. In fact, the deadliest crash type by far is a motorist overtaking a bicyclist (Thomas et al., 2019), a crash type that can be treated by the installation of bicycle facilities. Thus, while all crashes impact bicyclists’ lives and individual and community perceptions of safety, a tendency to focus on bicycle crashes at intersections has perhaps obscured the critical need for evaluation of bicyclist safety at midblock locations. This may be because measuring safety at midblocks is inherently more challenging than measuring safety at intersections, involving the need for potentially difficult-to-install video equipment. These challenges may also result from varying crash typing procedures that snap or assign crashes to the nearest intersection, rather than indicating when they occur at midblock locations. An accurate understanding of crash circumstances is critical to identifying appropriate countermeasures and to improving perceived and empirical safety for bicyclists.
The practice of assigning crashes to intersections has also hindered research on bicycle crash typing. Anecdotal evidence and case-control studies from the field have shown that a lot of crashes at midblock locations occurred at or near driveways, potentially indicating an important area of further research. However, the methodology used to report bicyclist crashes often obscures this factor and requires the tedious work of reading through police crash reports. Although big data and
text mining methods have been developed in recent years to address this concern, the researcher team did not find any study on text mining of bicyclist crashes. The findings lead them to conclude that the crash typing of bicyclist crashes at midblock segments will be challenging in this project. The expertise of the research team and collected data, as well as suggestions from the Project Panel, were used to address this limitation.
Relevant to this concern, researchers also identified two major limitations regarding surrogate safety measures. First, the measures used in the bicyclist safety literature tended to be related to intersection safety. Second, the relationship between such measures and bicyclist safety has not been proven. These two limitations make it challenging for the research team to select the appropriate surrogate safety measures when crash data were inadequate. The research team anticipated using encroachment data as a surrogate for overtaking crashes and PET and TTC as a surrogate for driveway crashes. However, the relationship between these measures and relevant crash types had to first be validated and confirmed.
The review of crash-contributing factors yielded a relatively long list of context-specific factors that have been used to assess bicyclist safety. However, there were also very important limitations concerning context; for example, the research team found that bicyclist exposure is missing for many studies, prohibiting a full understanding of certain bicycle facilities’ impact on crash rate. Additionally, we found limitations in terms of the types of context-specific factors, including a lack of understanding about how winter conditions may affect varying bikeway types’ performance. Information about relevant access management strategies and driveway configurations for improving bicyclist safety at these sites was also limited. This limitation also raises an important question regarding how to make bicycle facilities more accessible for users with disabilities. Narrowing down this list and adding new contextual factors to develop practical and implementable site selection guidelines was challenging. In Chapter 3, the research team proposes a prioritized list of factors to develop criteria for selecting midblock sites, using both the findings of the literature and the expertise of the research team to develop this list.
One of the major limitations researchers came across when reviewing the literature for identifying the study design and statistical method was that several studies used a naïve approach for evaluating the safety effectiveness of bicycle facilities. For example, it is known that sites are not usually randomly selected for improvement and that there is a significant selection bias in DDSA research. Epidemiology and safety literature proposed using EB and PSM to address these biases.
However, researchers were able to find one study that used the EB method and found no study that had implemented the PSM approach. The research team believes that some of the aforementioned limitations may be addressed by implementing more rigorous study and experimental design methods.
Lastly, the researcher team found many limitations in the safety literature concerning bikeway designs’ safety effectiveness. Very few studies of CMFs for separated bike lanes, no studies for buffered bike lanes, and one study on contraflow bicycle lanes were identified. Also, the safety implications of adjusting and improving an existing bikeway have not been studied. Few studies found that increasing bicycle lane width may increase safety risk; however, the induced demand due to the improved facility design was not considered due to the difficulty of obtaining bicyclist count data. Instead, the CMF studies have included other land use and socioeconomic factors as surrogates for bicyclist exposure. The research team previously explained why this approach is simplistic and may contribute to the low-quality of the CMFs found in the literature.
This study likely cannot address all of the gaps identified above. However, the research team worked with the Project Panel to identify sites, methodologies, and data to address as many gaps as possible through this research project. In particular, the researchers aimed to prioritize the collection of volume data for exposure, surrogate measures to enhance limited crash data, and crash data in geographically diverse locations to ensure the widespread application of the findings. They also explored new experimental design methods and modeling techniques to help to account for the data and sample size limitations.


