Safety Evaluation of On-Street Bicycle Facility Design Features (2025)
Chapter: 6 Safety Evaluation of Bicycle Treatments
CHAPTER 6. SAFETY EVALUATION OF BICYCLE TREATMENTS
6.1 METHODOLOGICAL APPROACH
In true experimental studies, comparable sites of similar traffic volume and geometric features are randomly assigned to a treatment or a nontreatment group. The treatment is then implemented at the sites in the treatment group, and crash and traffic volume data are obtained before and after implementing the treatment. Although these true experimental studies can minimize threats to the validity of studies including regression to the mean bias, randomization is almost never possible in reality, and true experiments such as randomized control group experiments are not feasible in safety evaluations. Available data in safety evaluations of on-street bicycle designs in this project were also observational.
6.1.1 Study Design
Various methodological choices are possible in terms of both study design and analysis for the safety evaluation of different treatments. Two types of data are frequently encountered in safety studies: before-after (B/A) and cross-sectional (C/S). Although before and after data are preferred, many jurisdictions do not inventory installation dates, and finding this information for a large sample of data is not feasible. Cross-sectional study design is therefore implemented in the absence of before and after data. Cross-sectional studies use statistical modeling techniques that consider the crash experience of sites with and without a particular treatment of interest (a bikeway facility in this case). In cross-sectional studies, analysts develop CMFs using the crash frequency of the treated and the comparison sites. The main drawback of cross-sectional analysis is the selection bias. The treated sites tend to experience a high number of crashes compared to the comparison sites. This implies that, even if the crash frequency at a treated site is lower after the treatment, the number of crashes will continue being higher compared to the number of crashes at the comparison sites. Therefore, comparing the crash frequency at the two sites might yield biased results.
One of the methods used to overcome selection bias in cross-sectional studies is the propensity score matching and weighting method. A propensity score represents the conditional probability of a facility receiving a treatment given the covariates and outcomes. It shows the relationship between treatment status (1=treated, 0=control) and covariates (i.e., variables that completely or partially account for the apparent association between an outcome and risk factor). Using this approach, the probability of treated and control sites being selected for treatment is nearly the same, and both treated and control sites have similar characteristics. The approach mimics
random selection and helps to avoid selection bias in the safety database. Using this method, the sites with treatment are matched to the sites without treatment (control sites) based on the propensity score. The propensity score, which imitates the random selection principle and indicates the probability of a site being selected, is formulated as follows:
| (13) |
Where:
- P(Ti|Xi) is the propensity score denoting the probability of the site i receiving the treatment T.
- Ti is the treatment status of the site i, which takes binary values {0, 1}.
- Xi is a vector of covariates that vary with the treatment.
- αi is the vector of coefficients through the binary logistic regression.
The propensity scores of the treatment and control sites are selected such that both groups have similar key characteristics. Propensity scores can be estimated using several parametric and nonparametric tools. In this project, the research team used logistic regression models to select the covariates and estimate propensity scores. The response variable was a binary variable with two potential values: 1=treated (i.e., bike lanes, buffered bike lane, and separated bike lane), and 0=control. Data matching was performed by randomly selecting the control sites. Additionally, site replacements were allowed to prevent the same control site from being selected multiple times, allowing for better matching. After matching the data based on the selected covariates, we conducted a quality check of the matched dataset and implement negative binomial models to evaluate the safety effectiveness of bicycle lanes.
6.1.2 Sample Size and Power Estimations
The sample size required to achieve significant results depends on the study design and the statistical model employed, as well as the anticipated effect of the estimate (the CMF, in this study). Table 56 shows the required sample sizes (number of midblock sites) to implement a cross-sectional design and apply generalized linear models (e.g., Poisson, overdispersed Poisson). The table shows the required sample sizes to ensure that the estimated CMF is statistically significant. For example, if the estimated CMF for the baseline crash rate of 1 (crashes/bicyclist volume) is found to be equal to 0.4 (60 percent decrease), then we would require 17 sites to ensure that the estimated CMF is significant (i.e., high quality). If the data are overdispersed (i.e., the variance of observed crash data is significantly higher than the mean), the required sample size would be 34. However, one of the
challenges is that bicyclist crashes are extremely rare events; therefore, the baseline crash rate will most likely be below 0.02. As observed, the number of midblock sites must range between 800–12,000 to ensure that the CMF developed for this baseline crash rate is significant enough. Obviously, identifying this many sites per CMF is very challenging. One of the potential approaches would be to identify enough control sites to increase the overall sample size of the available data. Moreover, statistical models such as negative binomial, zero-inflated Poisson, and Tobit models provided other potential approaches to ensure that the CMFs developed in this study were statistically significant.
Table 56. Sample Size Needed to Detect a Crash Reduction under Poisson Regression (Signorini, 1991).
| Baseline Crash Rate | CMF | Sample Size | |
|---|---|---|---|
| No Overdispersed Data | Overdispersed Data | ||
| 1 | 0.4 | 17 | 34 |
| 1 | 0.5 | 28 | 56 |
| 1 | 0.6 | 49 | 98 |
| 1 | 0.7 | 98 | 195 |
| 1 | 0.8 | 243 | 485 |
| 0.3 | 0.4 | 56 | 112 |
| 0.3 | 0.5 | 92 | 184 |
| 0.3 | 0.6 | 163 | 326 |
| 0.3 | 0.7 | 324 | 648 |
| 0.3 | 0.8 | 808 | 1,615 |
| 0.2 | 0.4 | 84 | 167 |
| 0.2 | 0.5 | 138 | 276 |
| 0.2 | 0.6 | 244 | 488 |
| 0.2 | 0.7 | 486 | 971 |
| 0.2 | 0.8 | 1,211 | 2,422 |
| 0.1 | 0.4 | 167 | 334 |
| 0.1 | 0.5 | 276 | 552 |
| 0.1 | 0.6 | 488 | 976 |
| 0.1 | 0.7 | 971 | 1,942 |
| 0.1 | 0.8 | 2,422 | 4,843 |
| 0.02 | 0.4 | 834 | 1,667 |
| 0.02 | 0.5 | 1,380 | 2,759 |
| 0.02 | 0.6 | 2,440 | 4,880 |
| 0.02 | 0.7 | 4,855 | 9,709 |
| 0.02 | 0.8 | 12,106 | 24,212 |
6.2 BIKE FACILITY AND CRASH DATA ASSESSMENT
The research team performed both cross-sectional (with PSM) and before-after analyses of the crash data based on the facility type. The B/A analysis conducted in this study did not utilize the empirical Bayes method, due to the lack of relevant SPFs. To perform the safety analysis, the team first conducted exploratory analyses of the crash data to assess the suitability of available data for
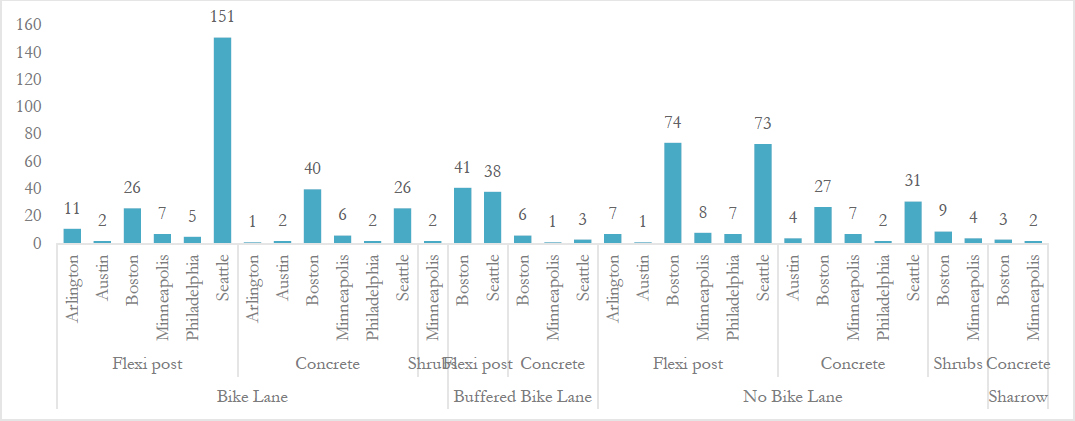
each analysis type. Figure 28 depicts the number of total and KABC (fatal and injury) bicyclist crashes that occurred in 2017–2020 (the evaluation period) per study site and facility type, together with the number of sites.
The number of sites indicates segments with each bikeway type. As discussed in Chapter 5, the research team used the segments from the roadway network data and conflated them with the bicycle network, where a segment was defined according to the roadway network database and stretched from one intersection to the next (see Figure 2 for the definition of a midblock segment). Because these segments were mainly located in dense urban areas, the segments were relatively short and had similar lengths in many cases. We used spatial join in ArcGIS to map each crash to the correct segment and reviewed the street names included in both the roadway network and crash database to ensure that each crash was assigned to the correct segment.
In 2017–2020, 54 bicyclist crashes occurred in Arlington County, Virginia, of which 38 occurred at sites with no bike lanes, 13 occurred in bike lanes, 1 occurred in buffered lanes, and 2 occurred in separated bike lanes. During this same period, Austin, Texas, experienced 905 bicyclist crashes, of which 704 occurred at sites with no bike lanes, 66 occurred in bike lanes, 9 occurred in buffered bike lanes, and 26 occurred in separated bike lanes. More than half of the SBL crashes in Austin occurred along two segments: Rio Grande and Guadalupe Streets. In Boston, Massachusetts, 79 bicyclist crashes occurred during the evaluation period; 73 of which occurred at sites with no bike lanes, while 4 occurred in bike lanes and 2 occurred in buffered bike lanes. In Dallas-Fort Worth, Texas, 821 bicyclist crashes occurred; of which 810 occurred at sites with no bike lanes, 5 occurred in bike lanes, and 6 occurred in buffered bike lanes. Of the 155 bicyclist crashes in Minneapolis, Minnesota, 87 occurred at sites with no bike lanes, 51 occurred in bike lanes, 7 occurred in buffered bike lanes, and 10 occurred in separated bike lanes. Of the 342 bicyclist crashes in Philadelphia, Pennsylvania, 213 occurred at sites with no bike lanes, 112 occurred in bike lanes, 14 occurred in buffered bike lanes, and 3 occurred in separated bike lanes. Finally, in Seattle, Washington, 510 bicyclist crashes occurred between 2017 and 2020, of which 323 occurred at sites with no bike lanes, 87 occurred in bike lanes, 10 occurred in buffered bike lanes, and 90 occurred in separated bike lanes. Most of the SBL crashes in Seattle (32 of the 90) occurred along three corridors: 2nd Street, Roosevelt Way, and Pine Street.
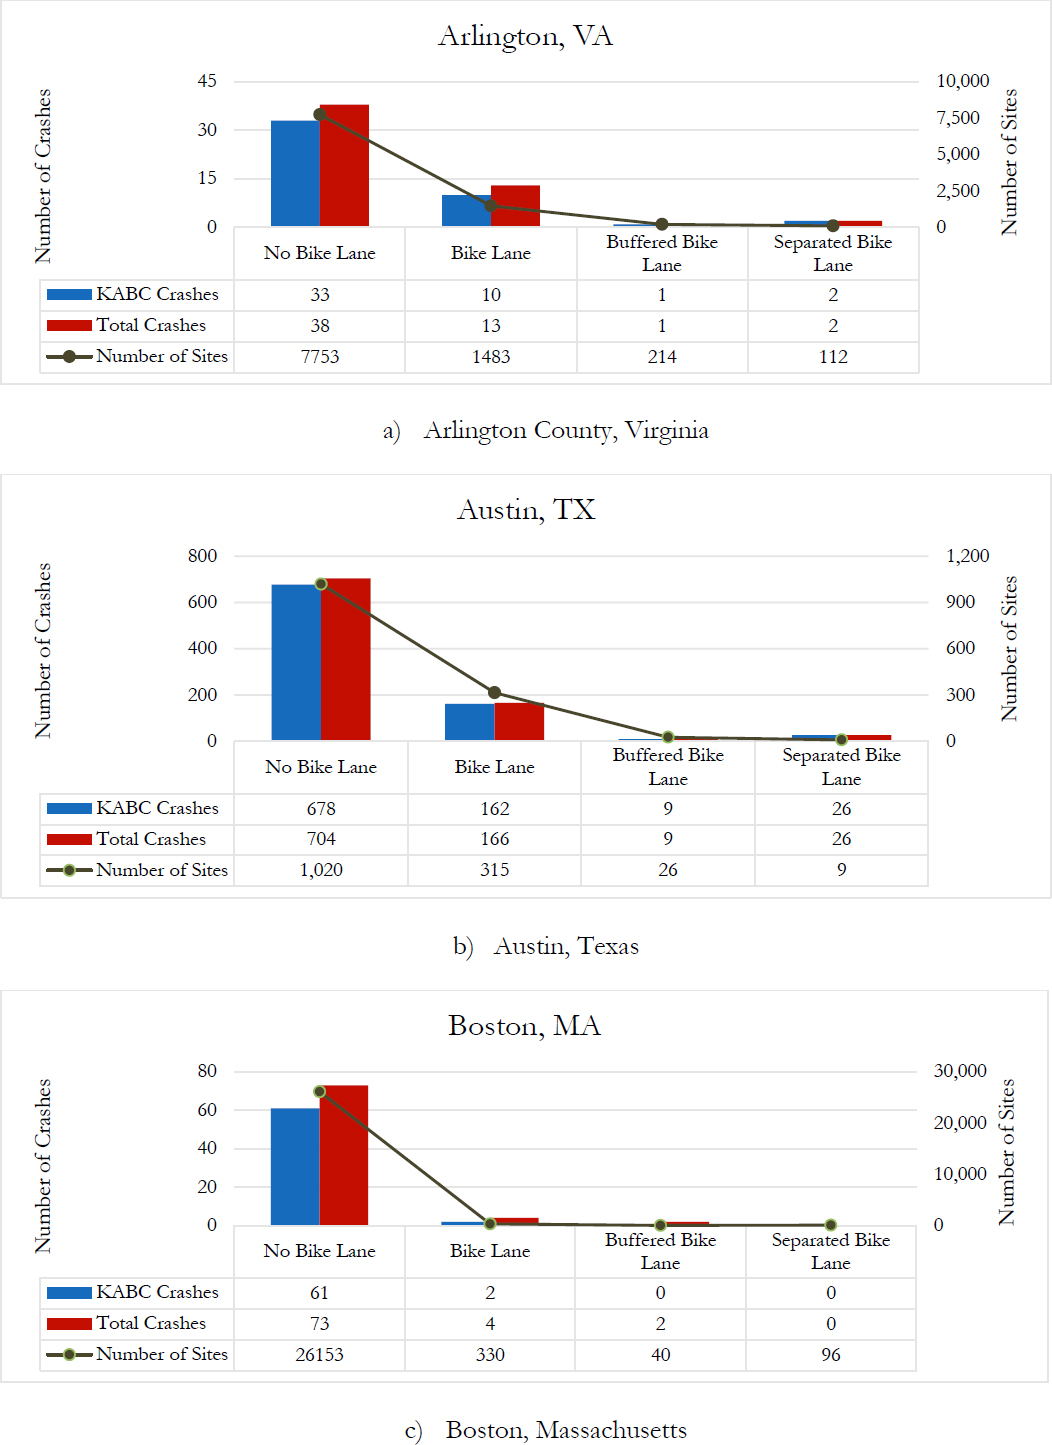
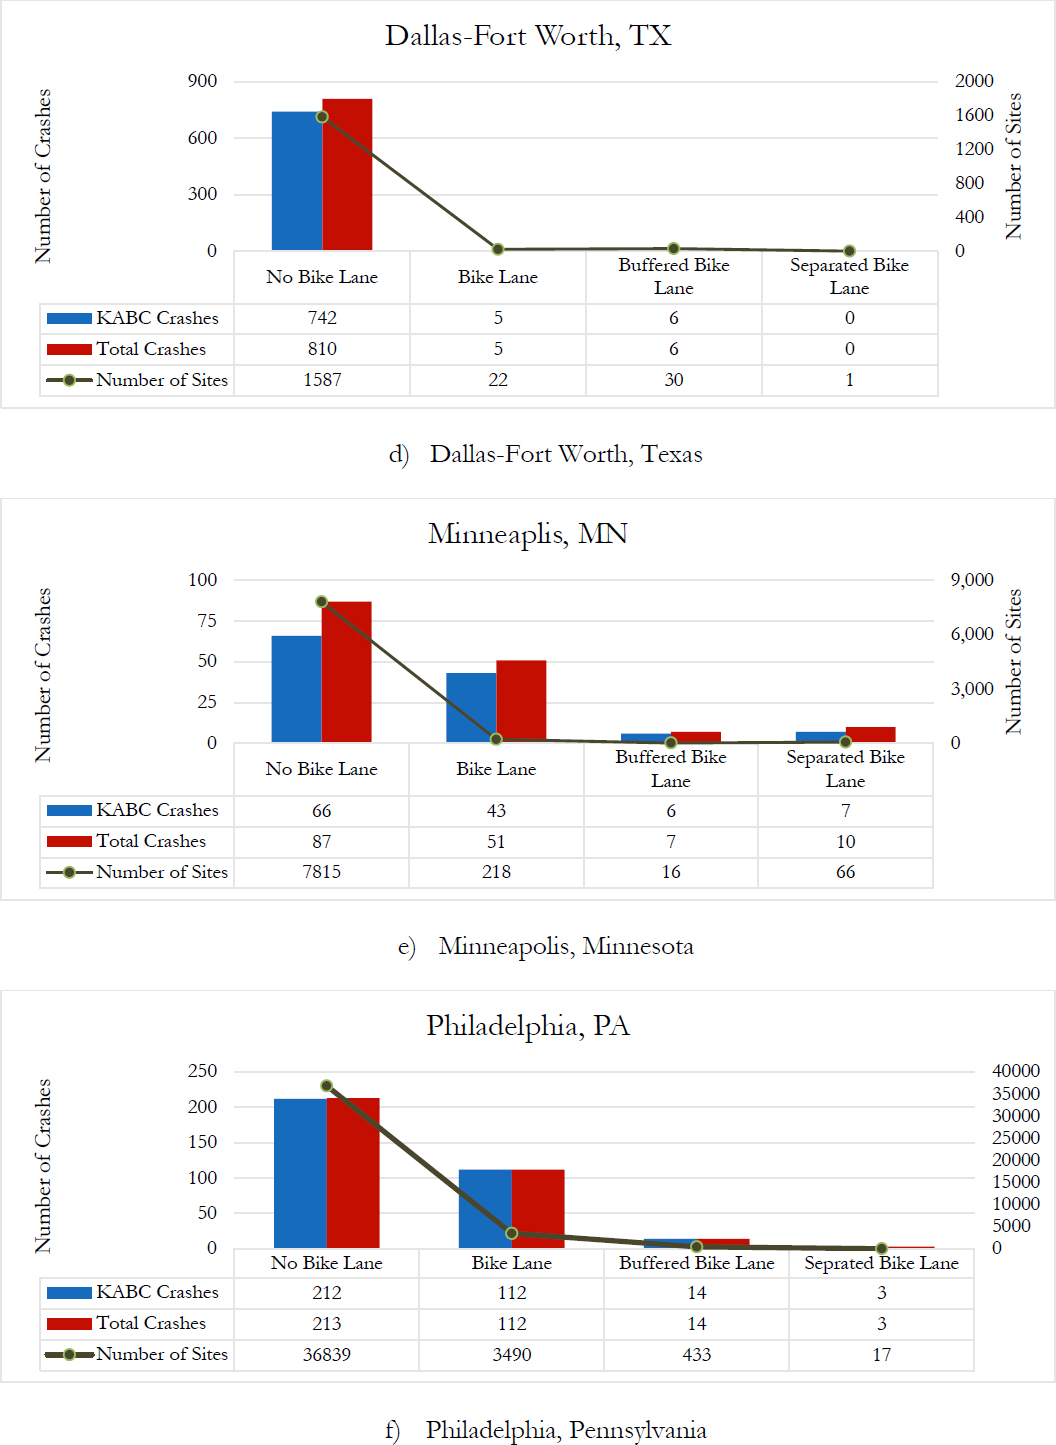
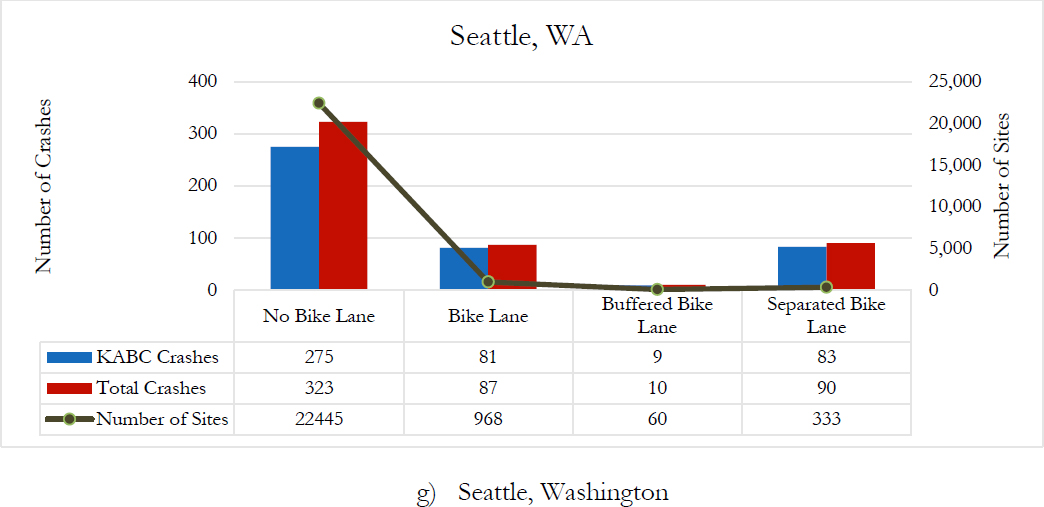
As observed, most of the bicyclist crashes occurred at sites with no bike lanes, however, the sample size of these sites was considerably larger because it included almost the entire roadway network. At nearly all study sites, most of the on-road bike facility crashes occurred along conventional bike lanes, while buffered and separated bike lanes experienced very few crashes. Based on this assessment, the research team used crash data from all study locations except for Boston when estimating the safety effectiveness of conventional bike lanes but used crash data from only Austin, DFW, and Philadelphia to evaluate the safety effectiveness of installing buffered bicycle lanes. Because the bike and buffered bike lanes were already in place during the evaluation period, the research team conducted cross-sectional analyses using the propensity score matching method to assess their safety effectiveness.
To evaluate the safety effectiveness of SBLs, the research team collected the date of installation and separation type manually using Google Earth. According to this assessment, 135 SBLs were implemented before the evaluation period (i.e., before 2017): 9 in Arlington County, 7 in Austin, 3 in Boston, 12 in Minneapolis, 5 in Philadelphia, and 99 in Seattle.(Figure 29).
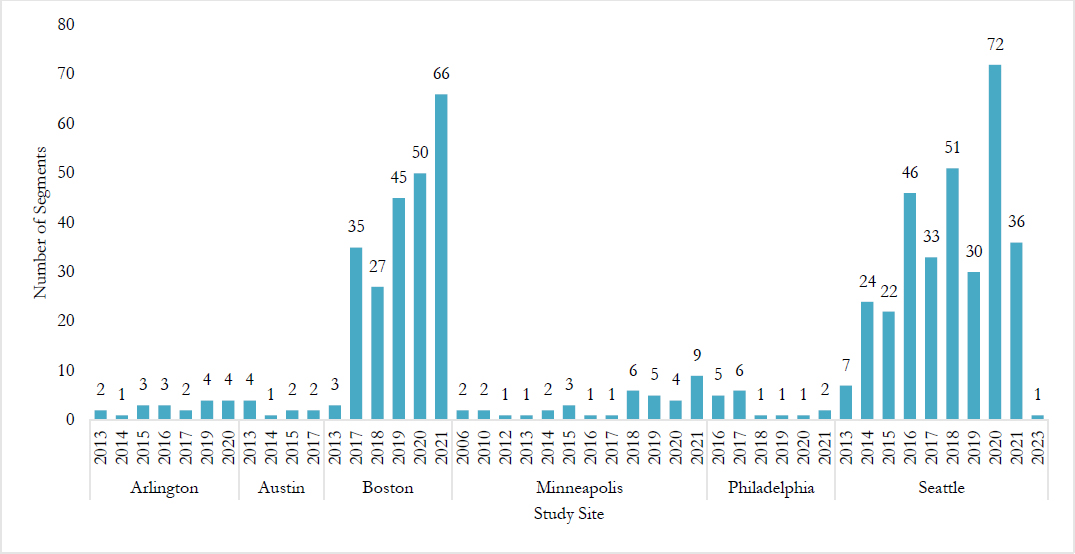
Figure 30 depicts the previous facility type where the SBLs were installed, together with the separation element. Among all study sites, Seattle had a reasonable sample size for conducting analysis. Therefore, the research team used the Seattle data for conducting a cross-sectional analysis. Conducting analyses for all SBLs across all study sites was not feasible due to inconsistencies in the data, particularly the roadway data, which was not collected consistently across all study sites.
Remaining SBLs were installed after the evaluation period (2017–2023). Overall, 170 SBLs were installed during this period across select study sites: 4 in Arlington County, 72 in Boston, 11 in Minneapolis, 2 in Philadelphia, and 81 in Seattle. As observed in Table 57, 1 crash occurred in Arlington County and Minneapolis before installing SBLs, and 1 crash occurred both before and after installing SBLs in Boston and Philadelphia. 28 crashes occurred in Seattle after installing SBLs, compared to 8 crashes before SBL installation. Note that the crash data for the before period may be incomplete, as the research team did not use the crash data before 2017. Based on this assessment, the research team used Seattle data for the before and after (B/A) analysis of SBLs. To ensure that there is adequate duration of crash data for both before and after periods, only the sites that were installed in 2018 and 2019 were considered. When considering the sites that were installed in 2018 and 2019, the average crashes at SBLs were 0.0833 in the before period and 0.0885 in the after period.
Table 57. Crashes Before and After Installing SBLs.
| Study Site | Previous Facility | Number of Sites | Total Before Crashes | Total After Crashes |
|---|---|---|---|---|
| Arlington County | Bike lane | 4 | 1 | 0 |
| Boston | Bike lane | 33 | 0 | 0 |
| Buffered bike lane | 6 | 1 | 1 | |
| No bike lane | 31 | 0 | 0 | |
| Sharrow | 2 | 0 | 0 | |
| Minneapolis | Bike lane | 5 | 1 | 0 |
| No bike lane | 6 | 0 | 0 | |
| Philadelphia | Bike lane | 1 | 1 | 1 |
| No bike lane | 1 | 0 | 0 | |
| Seattle | Bike lane | 43 | 3 | 20 |
| Buffered bike lane | 10 | 3 | 0 | |
| No bike lane | 28 | 2 | 8 |
6.3 EXPOSURE ESTIMATION
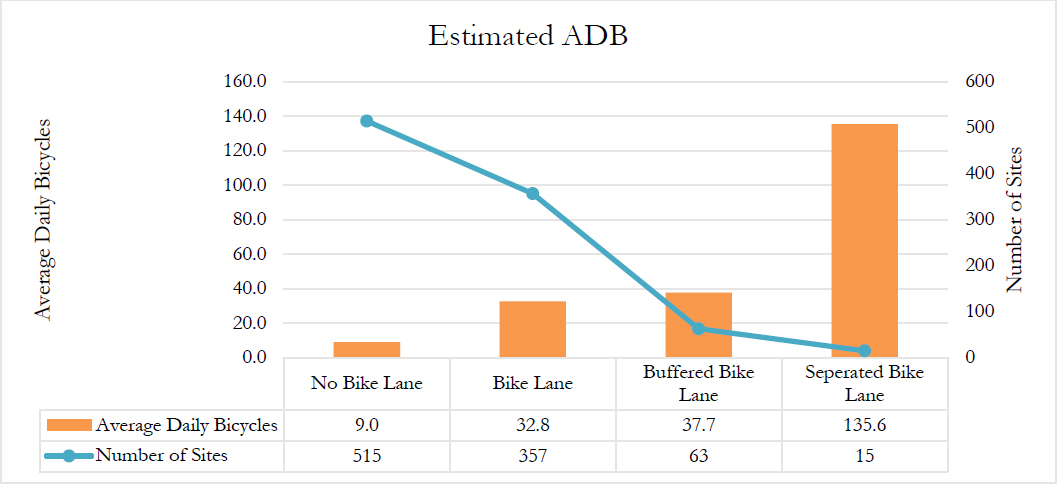
As discussed earlier in Chapter 5, bicycle count data were obtained from several study sites; however, the sample sizes of available bicyclist count data (collected from on-road bicycle facilities) were not sufficient to estimate the bicyclist counts per study site. Using count data from shared use paths (where most of the counters were located) could introduce bias. Shared use path users have a limited exposure to risk as they are physically separated from the traffic. Therefore, using these counts estimate the exposure for midblock sites may introduce bias. To improve the sample size, the research team also used the estimated bicyclist counts obtained from Philadelphia and Texas cities. Figure 31 presents the number of sites used for developing exposure models together with the bikeway type and average daily bicycles.
An exposure model was developed using roadway (lane width, number of lanes); exposure (AADT, speed limit); land use (civic, commercial, residential, industrial); transit (transit routes, bus stops); sociodemographic (race, ethnicity); housing (households, housing units); and economic (median income, labor force) factors. To improve model accuracy, data from all study sites were combined, and one model was developed using the entire dataset without differentiation between study sites. Since each study site had a different data collection period, we assume that the seasonality is somewhat is accounted for in aggregated data, however this needs to be confirmed through more rigorous exposure modeling approaches. There is also possibility that the COVID-19 pandemic may have had an impact on observed counts. Findings of the literature review study by Li et al. (2022) indicate that recreational bicycling had increased during the pandemic while bike share trips had dropped significantly. Because most of the recreational bicycling trips occur at trails and shared use paths, it is not clear how pandemic had affected the bicycling trips on bikeways (that are mostly used for commuting). The exposure model estimation results are presented in Table 58.
Estimation results indicated that increased AADT and speed limits decreased bicyclist counts, while these counts increased as surface width (calculated as the number of lanes × lane width) increased. This result might be counterintuitive since bicyclist do not prefer cycling in wider streets since number of lanes is correlated with the increasing AADT. The ADB increased in civic land use areas but decreased in commercial land use areas. Increased total population (males and females) of a block group decreased bike counts. This might be due to the fact that most cyclists
prefer riding in urban areas where the area size of block groups is smaller (hence less population), however population density was not significant in this model which would account both for population and size of the block groups. Block groups with a higher percentage of White population had higher bike counts, while block groups with higher percentages of Black, Hispanic, and Asian populations had a lower number of bicyclists. Finally, a higher number of households in a block group resulted in higher bike counts, which again may be indicative of highly dense housing in urban areas where there is more biking activity.
Table 58. Exposure Model Estimation Results.
| Parameter | Spatial Unit | Estimate | SD | P-value |
|---|---|---|---|---|
| (Intercept) | 5.223 | 0.535 | <0.0001 | |
| Bike facility: no bike lane | Segment | -1.804 | 0.231 | <0.0001 |
| Bike facility: bike lane | Segment | -0.909 | 0.249 | <0.0001 |
| Bike facility: buffered bike lane | Segment | -0.560 | 0.231 | <0.01 |
| Bike facility: separated bike lane | Segment | 0.861 | 0.324 | <0.001 |
| Speed limit (mpg) | Segment | -0.010 | 0.005 | <0.01 |
| Log (AADT) | Segment | -0.056 | 0.028 | <0.01 |
| Surface width (ft) | Segment | 0.007 | 0.002 | <0.001 |
| Civic land use | Parcel | 0.051 | 0.008 | <0.0001 |
| Commercial land use | Parcel | -0.012 | 0.004 | <0.001 |
| Log (Total population) | Block group | -0.114 | 0.077 | 0.140 |
| Percentage White population | Block group | 0.0002 | 0.0001 | <0.01 |
| Percentage Black population | Block group | -0.001 | 0.0001 | <0.0001 |
| Percentage Asian population | Block group | -0.001 | 0.0002 | <0.0001 |
| Percentage Hispanic population | Block group | -0.0001 | 0.0001 | <0.01 |
| Number of households | Block group | 0.0004 | 0.0002 | <0.05 |
| Overdispersion | 0.8 | |||
| Akaike information criterion (AIC) | 7,206 | |||
The following equations can be used to estimate the bicyclist counts at separated, buffered, conventional, and no bike lanes:
ADBSBL = 439 × (Speed Limit)−0.01 × (AADT)−0.056 × (Surface Width)−0.007 × (Civic LU)0.051 × (Commercial LU)−0.012 × (Total Popul.)−0.114 × (Perc. White P)0.0002 × (Perc. Black)−0.001 × (Perc. Asian)−0.001 × (Perc. Hispanic)−0.001 × (Num. Households)0.0004 | (12) |
ADBBBL = 106 × (Speed Limit)−0.01 × (AADT)−0.056 × (Surface Width)−0.007 × (Civic LU)0.051 × (Commercial LU)−0.012 × (Total Popul.)−0.114 × (Perc. White P)0.0002 × (Perc. Black)−0.001 × (Perc. Asian)−0.001 × (Perc. Hispanic)−0.001 × (Num. Households)0.0004 | (13) |
ADBBL = 75 × (Speed Limit)−0.01 × (AADT)−0.056 × (Surface Width)−0.007 × (Civic LU)0.051 × (Commercial LU)−0.012 × (Total Popul.)−0.114 × (Perc. White P)0.0002 × (Perc. Black)−0.001 × (Perc. Asian)−0.001 × (Perc. Hispanic)−0.001 × (Num. Households)0.0004 | (14) |
ADBNBL = 31 × (Speed Limit)−0.01 × (AADT)−0.056 × (Surface Width)−0.007 × (Civic LU)0.051 × (Commercial LU)−0.012 × (Total Popul.)−0.114 × (Perc. White P)0.0002 × (Perc. Black)−0.001 × (Perc. Asian)−0.001 × (Perc. Hispanic)−0.001 × (Num. Households)0.0004 | (15) |
In these equations, ADBSBL refers to estimated daily bicycle counts at separated bike lanes, ADBBBL refers to estimated daily bicycle counts at buffered bike lanes, ADBBL refers to estimated daily bicycle counts at bike lanes, and Total Popul. refers to the total population estimates obtained from the ACS database. Note that these models were developed for estimating bicyclist counts at midblocks and should not be used for estimating counts at intersections or along shared use paths.
6.4 SEPARATED BICYCLE LANES
To assess the safety effectiveness of SBLs, we performed a before-after analysis of facilities that were installed during 2018 and 2019. We selected 2018 and 2019 for the B/A analysis to ensure crash occurrence in both the before and after periods. However, because we did not use three years of before and after crash data, the B/A analysis had some limitations.
We then conducted a cross-sectional analysis using the facilities that were already in place during the evaluation period (i.e., installed before 2017). We looked at the safety effectiveness of both installing a new bike lane and converting an existing bike lane to a different facility type (i.e., converting a bike lane or buffered bike lane to a separated bicycle lane).
6.4.1 Before-After Analysis
In this analysis, the ADB at all facilities were estimated for both the before (using the previous facility type) and after periods, while average annual crashes before and after the installation was used as the response variable. In addition to the ADB, we also accounted for the previous facility type, separation type, and segment length. Note that because this was a before-after analysis, other contextual factors were not included in the model; the research team assumed that they were already accounted for. The model estimation results are presented in Table 59. Note that in this and following tables, the term CMF/CRF only apply to the treatment. The coefficients in this column
for other variables indicate the effect of the variable on total and KABC bicyclist crashes and should not be interpreted as a CMF.
The base condition of this model included no bike lane in the before period. Overall, the number of bicyclist crashes decreased slightly after SBL installation (intercept=0.002). After accounting for the increase in ADB (9.4 percent), estimation results indicated a nearly 99 percent reduction in bicyclist crashes (denoted by the crash reduction factor [CRF]) after the installation of SBLs at sites with no bike lanes (although this was not statistically significant). Other interesting observations in this model included the relative reduction in crashes based on the previous facility type. For example, installing SBLs along former bike lanes and along former BBLs could potentially decrease crashes by 90 and 97 percent, respectively, compared to having no bike facility. Both of these findings were estimated to be statistically significant. Although a reduction in crashes was observed after installing SBLs, the magnitude of the reduction was much higher for sites with no bike lanes. Additionally, with respect to separation barrier type, installing flexi-posts may be more beneficial than concrete barriers because this factor was associated with an 88 percent reduction in crashes. Concrete barriers are usually installed at high-speed locations where the exposure to safety risk might be higher. They are also installed at sites with inherently high safety concerns. Most of the model estimates were found to be statistically significant. However, this model used only 1–2 years of before and after crash data; more years of data, as well as more sites, are needed to confirm the model findings.
Table 59. SBL Effectiveness, Before and After Analysis
| Parameter | CMF (CRF) | Estimate | Std. Err. | p-value | |
|---|---|---|---|---|---|
| (Intercept) | 0.055 | -2.907 | 1.326 | 0.028 | |
| Period (0 = Before, No Bike Lane, 1 = After, SBL) | 0.007 (99% | -5.017 | 4.546 | 0.270 | |
| Average Daily Bicycles | 1.094 | 0.090 | 0.077 | 0.243 | |
| Segment Length | 1.004 | 0.004 | 0.003 | 0.113 | |
| Previous Bikeway Type | Bicycle Lane | 0.100 (90% | -2.301 | 0.988 | < 0.005 |
| Buffered Bicycle Lane | 0.030 (97% | -3.522 | 1.832 | <0.001 | |
| Separation Type (0 = Concrete, 1= Flexi Post) | 0.117 (88% | -2.144 | 0.709 | <0.005 | |
| Overdispersion | 0.575 | ||||
| AIC | 92 | ||||
6.4.2 Cross-Sectional Analysis
For this analysis, we considered facilities that were installed before the evaluation period (i.e., before 2017) to ensure that the control and treatment (SBL) sites were already in place during 2017–2020. For the purposes of these analysis, we considered all SBLs in Seattle, regardless of their previous condition, and compared them with similar sites having (1) NBLs, (2) BLs, and (3) BBLs. Overall, 99 SBLs were in place before 2017 and were considered in this cross-sectional analysis.
6.4.2.1 Separated vs. No Bike Lanes
To compare SBL and NBL sites, we first conducted logistic regression to estimate propensity scores (i.e., the probability of a site with no bike lane to be selected for an SBL installation). According to the results of the logistic regression, the decision to install SBLs at sites with no existing bikeway was significantly associated with speed limit, segment length, surface width, land use type, average number of bus stops, and sociodemographic and economic factors (Table 60).
Table 60. Impact of Selected Variables on Site Selection for SBLs vs. NBLs.
| Covariate | Estimate | SD | P-value |
|---|---|---|---|
| (Intercept) | -6.498 | 0.826 | <0.0001 |
| Speed limit | 0.108 | 0.029 | <0.0001 |
| Segment length | -0.002 | 0.001 | <0.001 |
| Surface width | 0.074 | 0.007 | <0.0001 |
| Civic land use | 0.463 | 0.096 | <0.0001 |
| Commercial land use | 0.237 | 0.073 | <0.001 |
| Residential land use | 0.254 | 0.082 | <0.001 |
| Industrial land use | -2.591 | 0.830 | <0.001 |
| Average daily transit | -0.062 | 0.036 | <0.05 |
| Percentage White population | -1.413 | 0.664 | <0.01 |
| Percentage Black population | -6.467 | 1.916 | <0.0001 |
| Percentage Hispanic population | -4.644 | 1.947 | <0.01 |
| Median Income | 0.001 | 0.001 | <0.001 |
After identifying these variables, the research team developed a dataset for cross-sectional analysis, where the sites with and without treatment were selected. Sites with and without treatment were expected to be identical to ensure that any changes in crashes are mostly due to the presence of the treatment. Additionally, the number of control sites was expected to be 2 to 4 times larger than the treatment sites to achieve meaningful results. We allowed replacement in the data (i.e., when one site was selected more than once). The caliper width was 0.2 (Wang et al., 2013), while the ratio of treated to control sites was 1:2 (i.e., one treated site was matched with two control sites).
A total of 258 sites were selected for the negative binomial regression analysis for estimating the safety effectiveness of SBLs compared to no bike lanes (Table 61). Because of the repetition, the number of matched treatments sites was higher than the actual (raw) number of sites.
Table 61. Number of Selected Sites for SBLs vs. NBLs.
| Sample | Treated | Control | Total |
|---|---|---|---|
| All | 99 | 4,085 | 4,184 |
| Matched | 111 | 147 | 258 |
Finally, we developed safety models to estimate the impact of SBLs on total and KABC bicyclist crashes at sites with no previous bike facility. For the safety analysis, we developed negative binomial regression models. These models included treatment type and ADB, as well as the list of variables that were selected for estimating the propensity scores in the logistic regression. After removing highly insignificant variables, the following contextual factors were retained in the model: segment length, surface width, land use, and percentage of White population. Table 62 present the estimation result for total and KABC crashes.
As observed, SBLs were associated with significantly less bicyclist crashes. Compared to sites with significantly similar characteristics, sites with SBLs were found to have 98 percent and almost 99 percent less total and KABC bicyclist crashes, with statistical significance in each case. The ADB at these sites was observed to increase bicyclist crashes by approximately 10 percent when the ADB is increased by 100 percent (10.3 percent and 9.6 percent for total and KABC crashes, respectively) and have a significant effect on crash frequency. In addition to the bike facility type and ADB, bicyclist crashes were also affected by the speed limit, segment length, surface width, commercial land use, residential land use, and percentage of White population in a block group. As observed, the effect of the speed limit on crashes was negative, which may seem counterintuitive but is likely due to the confounding effects of the roadway characteristics (i.e., SBLs may have been installed along high-speed roads). Commercial land use had a significantly increasing effect on bicyclist crashes, while bicyclist crashes were estimated to decrease by 0.86 (14 percent) in residential areas.
Table 62. Safety Effectiveness of SBLs vs. NBLs.
| Parameter | Total | KABC | ||||||
|---|---|---|---|---|---|---|---|---|
| CMF (CRF) | Estimate | SE | P-value | CMF (CRF) | Estimate | SE | P-value | |
| (Intercept) | 0.217 | -1.530 | 1.555 | 0.325 | 0.213 | -1.545 | 1.586 | 0.330 |
| Treated (0=NBL, 1=SBL) | 0.016 (98% | -4.115 | 3.238 | <0.01 | 0.001 (~99%â) | -6.583 | 3.170 | <0.05 |
| ADB | 1.103 | 0.098 | 0.045 | <0.05 | 1.096 | 0.091 | 0.044 | <0.05 |
| Parameter | Total | KABC | ||||||
|---|---|---|---|---|---|---|---|---|
| CMF (CRF) | Estimate | SE | P-value | CMF (CRF) | Estimate | SE | P-value | |
| Speed limit | 0.949 | -0.053 | 0.061 | 0.386 | 0.945 | -0.056 | 0.063 | 0.366 |
| Segment length | 1.002 | 0.002 | 0.001 | <0.001 | 1.002 | 0.002 | 0.001 | <0.01 |
| Surface width | 1.010 | 0.010 | 0.010 | 0.317 | 1.009 | 0.009 | 0.010 | 0.384 |
| Commercial land use | 1.196 | 0.179 | 0.084 | <0.01 | 1.194 | 0.177 | 0.084 | <0.05 |
| Residential land use | 0.860 | -0.151 | 0.100 | 0.130 | 0.875 | -0.134 | 0.099 | 0.175 |
| Percentage White population | 0.223 | -1.500 | 0.907 | <0.05 | 0.285 | -1.255 | 0.910 | 0.168 |
| Overdispersion | 0.740 | 0.822 | ||||||
| AIC | 316 | 305 | ||||||
6.4.2.2 Separated vs. Conventional Bike Lanes
Table 63 presents the list of contextual factors significantly associated with the probability of installing separated bicycle lanes along bike lanes, including surface width and various land use, transit, and sociodemographic factors. Based on these findings, 240 sites were selected for the safety analysis (Table 64).
Table 63. Impact of Selected Variables on Site Selection for SBLs vs. BLs.
| Covariate | Estimate | SD | P-value |
|---|---|---|---|
| (Intercept) | -2.231 | 3.035 | 0.462 |
| Surface width | 0.030 | 0.008 | <0.0001 |
| Civic land use | 0.274 | 0.085 | <0.001 |
| Commercial land use | 0.335 | 0.068 | <0.0001 |
| Residential land use | 0.232 | 0.084 | <0.001 |
| Average daily transit | 0.100 | 0.055 | <0.05 |
| Number of bus stops | -0.668 | 0.240 | <0.001 |
| Percentage White population | -1.790 | 0.626 | <0.001 |
| Percentage Black population | -8.574 | 1.952 | <0.0001 |
| Percentage Hispanic population | -5.056 | 1.738 | <0.001 |
| Median income | 0.001 | 0.001 | <0.01 |
Table 64. Number of Selected Sites for SBLs vs. BLs.
| Sample | Treated | Control | Total |
|---|---|---|---|
| All | 99 | 968 | 1,067 |
| Matched | 108 | 132 | 240 |
The estimation results of the safety models are presented in Table 65. As observed, converting bike lanes to SBLs reduced total crashes by 99 percent and KABC crashes by 98 percent. Both CMFs were statistically significant. Additionally, the ADB at sites with SBLs had a significant increasing effect on bicyclist crashes (by almost 10 percent). Among other covariates, residential land
use decreased bicyclist crashes, indicating that converting bike lanes to SBLs in residential areas may improve bicyclist safety significantly.
Table 65. Safety Effectiveness of SBLs vs. BLs.
| Parameter | Total | KABC | ||||||
|---|---|---|---|---|---|---|---|---|
| CMF (CRF) | Estimate | SE | P-value | CMF (CRF) | Estimate | SE | P-value | |
| (Intercept) | 0.022 | -3.796 | 0.513 | <0.0001 | 0.019 | -3.946 | 0.531 | <0.0001 |
| Treated (0=BL, 1=SBL) | 0.002 (99% | -6.068 | 3.298 | <0.05 | 0.004 (99%â) | -5.627 | 3.329 | <0.05 |
| ADB | 1.103 | 0.098 | 0.046 | <0.01 | 1.098 | 0.093 | 0.047 | <0.01 |
| Segment length | 1.004 | 0.004 | 0.001 | <0.0001 | 1.004 | 0.004 | 0.001 | <0.0001 |
| Residential land use | 0.556 | -0.587 | 0.186 | <0.001 | 0.583 | -0.540 | 0.187 | <0.001 |
| Overdispersion | 0.503 | 0.508 | ||||||
| AIC | 221 | 209 | ||||||
6.4.2.3 Separated vs. Buffered Bike Lanes
Finally, we compared SBLs with buffered bike lanes. Table 66 presents the list of contextual factors significantly associated with the probability of installing SBLs at former BBL sites. These factors include surface width and civic and commercial land use.
Table 66. Impact of Selected Variables on Site Selection for SBLs vs. BBLs.
| Covariate | Estimate | SD | P-value |
|---|---|---|---|
| (Intercept) | 1.210 | 0.641 | 0.059 |
| Surface width | -0.018 | 0.012 | 0.114 |
| Civic land use | 0.451 | 0.222 | < 0.1 |
| Commercial land use | 0.236 | 0.041 | <0.0001 |
Table 67 depicts the sample size of matched segments. There were more SBLs than buffered bike lanes in Seattle. Therefore, some of the treatment sites were dropped from the sample, and a total of 112 sites were selected for the safety assessment (reverse matching).
Table 67. Number of Selected Sites for SBLs vs. BBLs.
| Sample | Treated | Control | Total |
|---|---|---|---|
| All | 99 | 60 | 159 |
| Matched | 52 | 60 | 112 |
Table 68 presents the estimation results. All other covariates were dropped from the model because they were not significant and introduced bias. As observed, SBLs were associated with 84 percent and 85 percent less total and KABC crashes, respectively, compared to BBLs. Although this effect was not statistically significant, the p-values were relatively small (p-value=~0.15), indicating that 85 percent of the time, converting a BBL to an SBL will result in an over 80 percent reduction
in crashes. The ADB again had a significant increasing effect on crashes; increasing ADB was estimated to increase total and KABC crashes by 8 percent.
Table 68. Safety Effectiveness of SBLs vs. BBLs.
| Parameter | Total | KABC | ||||||
|---|---|---|---|---|---|---|---|---|
| CMF (CRF) | Estimate | SE | P-value | CMF (CRF) | Estimate | SE | P-value | |
| (Intercept) | 0.005 | -5.224 | 1.290 | <0.0001 | 0.003 | -5.699 | 1.334 | <0.0001 |
| Treated (0=BBL, 1=SBL) | 0.156 (84% | -1.855 | 1.276 | 0.1459 | 0.143 (85%â) | -1.942 | 1.318 | 0.141 |
| ADB | 1.083 | 0.080 | 0.032 | <0.01 | 1.090 | 0.087 | 0.032 | <0.0001 |
| Overdispersion | 0.146 | 0.145 | ||||||
| AIC | 415 | 391 | ||||||
6.5 BUFFERED BICYCLE LANES
To assess the safety effectiveness of buffered bike lanes, the research team used cross-sectional analysis to compare BBLs to: (1) no bike lanes and (2) bike lanes. As indicated earlier, these analyses were conducted using the crash data from three study sites: Austin, DFW, and Philadelphia. Because the data from Texas cities were collected consistently, Austin and DFW data were combined when performing this safety analysis. In Philadelphia, almost all bicyclist crashes resulted in fatalities or injuries. Therefore, we did not develop separate models for total and KABC crashes.
6.5.1 Buffered vs. No Bike Lanes
In this section, the research team estimated the safety effectiveness of installing buffered bicycle lanes compared to sites with no bike lanes.
6.5.1.1 Austin and Dallas-Fort Worth, Texas
Table 69 lists the significant factors (covariates) affecting the probability of installing buffered bike lanes at sites with no bike lanes in Austin and DFW. These factors included AADT, speed limit, lane width, and commercial land use. Increased AADT and lane width increased the probability of installing bike lanes, while increased speed limits and commercial land use decreased this probability.
Table 69. Impact of Selected Variables on Site Selection for BBLs vs. NBLs (Austin and Dallas-Fort Worth, Texas).
| Covariate | Estimate | SD | P-value |
|---|---|---|---|
| (Intercept) | 0.023 | -3.781 | <0.001 |
| Log (AADT) | 1.627 | 0.487 | <0.0001 |
| Speed limit | 0.878 | -0.130 | <0.0001 |
| Lane width (ft) | 1.091 | 0.087 | <0.001 |
| Commercial land use | 0.951 | -0.051 | <0.01 |
Based on the selected covariates, treated sites (BBLs) were then matched with the control sites (no bike lanes). The sample size of the selected segments with significantly similar characteristics was 158 (Table 70).
Table 70. Number of Selected Sites for BBLs vs. NBLs (Austin and Dallas-Fort Worth, Texas).
| Sample | Treated | Control | Total |
|---|---|---|---|
| All | 56 | 2,607 | 2,663 |
| Matched | 56 | 102 | 158 |
Table 71 presents the estimation results. Installing buffered bike lanes at sites with no bike facility significantly reduced total crashes by 54 percent and KABC crashes by 52 percent. Other factors affecting bicyclist safety at buffered bike lanes included ADB, AADT, and speed limit; however, their effects were not statistically significant.
Table 71. Safety Effectiveness of BBLs vs. NBLs (Austin and Dallas-Fort Worth, Texas).
| Parameter | Total | KABC | ||||||
|---|---|---|---|---|---|---|---|---|
| CMF (CRF) | Estimate | SE | P-value | CMF (CRF) | Estimat e | SE | P-value | |
| (Intercept) | 0.049 | -3.024 | 1.058 | <0.001 | 0.047 | -3.050 | 1.087 | <0.001 |
| Treated (0=NBL, 1=BBL) | 0.451 (54% | -0.796 | 0.311 | <0.01 | 0.478 (52%â) | -0.737 | 0.311 | <0.01 |
| ADB | 0.995 | -0.005 | 0.012 | 0.673 | 0.996 | -0.004 | 0.010 | 0.709 |
| Log (AADT) | 1.110 | 0.105 | 0.103 | 0.312 | 1.111 | 0.106 | 0.106 | 0.320 |
| Speed limit | 1.053 | 0.051 | 0.032 | 0.103 | 1.051 | 0.050 | 0.032 | 0.123 |
| Overdispersion | 0.180 | 0.186 | ||||||
| AIC | 295.000 | 298.000 | ||||||
6.5.1.2 Philadelphia, Pennsylvania
Table 72 shows lists the significant covariates affecting the probability of installing BBLs at sites with no bike lanes in Philadelphia. These factors included AADT, number of through lanes, lane width, residential land use, roadway class, daily transit, and population characteristics of the site.
Table 72. Impact of Selected Variables on Site Selection for BBLs vs. NBLs (Philadelphia, Pennsylvania).
| Covariate | Estimate | SD | P-value |
|---|---|---|---|
| (Intercept) | 0.907 | 0.222 | <0.0001 |
| AADT | 0.000 | 0.000 | 0.108 |
| Through lanes | -0.194 | 0.061 | <0.001 |
| Lane width | -0.105 | 0.040 | <0.001 |
| Residential | 0.018 | 0.003 | <0.0001 |
| Roadway class | -0.922 | 0.055 | <0.0001 |
| Average daily transit | 0.038 | 0.011 | <0.0001 |
| Percentage White population | 0.437 | 0.215 | <0.01 |
| Percentage Hispanic population | -2.014 | 0.504 | <0.0001 |
Based on these covariates, 961 sites were selected for analysis; 433 sites had buffered bike lanes, while 523 sites had no bike lanes (Table 73).
Table 73. Number of Selected Sites for BBLs vs. NBLs (Philadelphia, Pennsylvania).
| Sample | Treated | Control | Total |
|---|---|---|---|
| All | 433 | 36839 | 37,272 |
| Matched | 433 | 528 | 961 |
The estimation results of the safety analysis (Table 74) again show that installing buffered bike lanes at sites with no bike lanes was associated with a 77 percent significant reduction in bicyclist crashes. The ADB had an increasing effect on bicyclist crashes; however, this effect was highly insignificant, indicating that despite increasing exposure, crashes can be reduced by installing BBLs.
Table 74. Safety Effectiveness of BBLs vs. NBLs (Philadelphia, Pennsylvania).
| Parameter | CMF (CRF) | Estimate | SD | P-value |
|---|---|---|---|---|
| (Intercept) | 0.096 | -2.342 | 0.153 | <0.0001 |
| Treated (0=NBL, 1=BBL) | 0.228 (77% | -1.479 | 0.404 | <0.0001 |
| ADB | 1.002 | 0.002 | 0.006 | 0.758 |
| AADT | 1.000 | 0.000 | 0.000 | 0.416 |
| Through lanes | 0.939 | -0.063 | 0.134 | 0.639 |
| Average daily transit | 1.078 | 0.076 | 0.013 | <0.0001 |
| Overdispersion | 0.112 | |||
| AIC | 542 |
6.5.2 Buffered vs. Bike Lanes
In this section, the research team estimated the safety effectiveness of installing buffered bicycle lanes compared to sites with conventional bike lanes.
6.5.2.1 Austin and Dallas-Fort Worth, Texas
After identifying the covariates (Table 75) that significantly impacted the probability of installing buffered bike lanes along conventional bike lanes in Austin and DFW, the sample size of the matched dataset was determined (Table 76). A total of 128 sites were selected; 54 had a buffered bike lane, while 74 had a conventional bike lane. These sites had significantly similar characteristics in terms of AADT, number of lanes, land use type, and percentage of White and Hispanic populations.
Table 75. Impact of Selected Variables on Site Selection for BBLs vs. BLs (Austin and Dallas-Fort Worth, Texas).
| Covariate | Estimate | SD | P-value |
|---|---|---|---|
| (Intercept) | 5.621 | 1.628 | <0.0001 |
| Log (AADT) | -0.560 | 0.177 | <0.001 |
| Number of lanes | 0.416 | 0.147 | <0.001 |
| Civic land use | -0.122 | 0.060 | <0.01 |
| Percentage White population | -3.713 | 0.995 | <0.0001 |
| Percentage Hispanic population | -3.575 | 0.967 | <0.0001 |
Table 76. Number of Selected Sites for BBLs vs. BLs (Austin and Dallas-Fort Worth, Texas).
| Sample | Treated | Control | Total |
|---|---|---|---|
| All | 56 | 337 | 393 |
| Matched | 54 | 74 | 128 |
Table 77 presents the estimation results. The results indicated that BBLs were associated with relatively better safety outcomes, reducing bicyclist crashes by 25 percent when installed at former bike lanes. However, this outcome was not statistically significant. Other factors affecting bicyclist safety at the converted sites included the ADB, AADT, number of lanes, and civic land use. Overall, this model had a weaker performance, which may be due to the small sample size of the data, as well as the small number of average crashes at these sites.
Table 77. Safety Effectiveness of BBLs vs. BLs (Austin and Dallas-Fort Worth, Texas)
| Parameter | Total | KABC | ||||||
|---|---|---|---|---|---|---|---|---|
| CMF (CRF) | Estimate | SE | P-value | CMF (CRF) | Estimate | SE | P-value | |
| (Intercept) | 0.199 | -1.617 | 1.735 | 0.351 | 0.199 | -1.617 | 1.735 | 0.351 |
| Treated (0=BL, 1=BBL) | 0.750 (25% | -0.288 | 0.419 | 0.492 | 0.750 (25%â) | -0.288 | 0.419 | 0.492 |
| AADB | 0.985 | -0.015 | 0.015 | 0.315 | 0.985 | -0.015 | 0.015 | 0.315 |
| Log (AADT) | 1.143 | 0.134 | 0.222 | 0.547 | 1.143 | 0.134 | 0.222 | 0.547 |
| Number of lanes | 0.835 | -0.180 | 0.189 | 0.340 | 0.835 | -0.180 | 0.189 | 0.340 |
| Civic land use | 1.078 | 0.075 | 0.061 | 0.216 | 1.078 | 0.075 | 0.061 | 0.216 |
| Overdispersion | 1.028 | 0.834 | ||||||
| AIC | 189 | 190 | ||||||
6.5.2.2 Philadelphia, Pennsylvania
In Philadelphia, the probability of installing BBLs along former bike lanes was dependent upon the AADT, through lanes, lane width, residential land use, and percentages of Black and Hispanic populations (Table 78). Based on these covariates, 760 sites were selected for assessing the safety effects of installing BBLs along bike lanes (Table 79). Despite the higher number of sites with bike lanes, the number of control sites (BLs) was smaller than the number of the treatment sites.
This imbalance indicated that bike lanes and buffered bike lanes were not usually installed at similar sites in Philadelphia; therefore, comparing them may not yield meaningful results.
Table 78. Impact of Selected Variables on Site Selection for BBLs vs. BLs (Philadelphia, Pennsylvania).
| Covariate | Estimate | SD | P-value |
|---|---|---|---|
| (Intercept) | -1.202 | 0.084 | <0.0001 |
| AADT | 0.000 | 0.000 | <0.001 |
| Industrial land use | -0.120 | 0.055 | <0.01 |
| Percentage Black population | -1.393 | 0.149 | <0.0001 |
| Percentage Hispanic population | -3.650 | 0.480 | <0.0001 |
Table 79. Number of Selected Sites, BBL vs. BL (Philadelphia)
| Sample | Treated | Control | Total |
|---|---|---|---|
| All | 433 | 3,492 | 3,925 |
| Matched | 433 | 327 | 760 |
Results of the safety analysis indicated a relatively small decrease in crashes (4.8 percent) when comparing BBLs to BLs; however, this estimate was highly insignificant. As expected, this model had a weaker performance (overdispersion>1).
Table 80. Safety Effectiveness of BBLs vs. BLs (Philadelphia, Pennsylvania).
| Parameter | CMF (CRF) | Estimate | SE | P-value |
|---|---|---|---|---|
| (Intercept) | 0.041 | -3.199 | 0.458 | <0.0001 |
| Treated (0=BL, 1=BBL) | 0.952(4.8% | -0.049 | 0.400 | 0.792 |
| ADB | 1.002 | 0.002 | 0.006 | 0.755 |
| AADT | 1.000 | 0.000 | 0.000 | 0.181 |
| Through lanes | 0.721 | -0.327 | 0.318 | 0.304 |
| Overdispersion | 1.060 | |||
| AIC | 298.000 |
6.6 CONVENTIONAL BICYCLE LANES
Finally, the research team conducted safety analyses for installing conventional bike lanes at sites with no bike facilities. As indicated earlier, crash data from the following study sites were used to estimate the safety effect of conventional bike lanes: Arlington County, Austin and DFW (combined), Minneapolis, Philadelphia, and Seattle.
6.6.1 Arlington County, Virginia
Table 81 summarizes the logistic regression results indicating the probability of a site being selected for a conventional bike lane treatment. The selection of sites for installing bicycle lanes was significantly dependent on street operation (one-way or two-way), AADT, speed limit, segment length, and land use type.
Table 81. Impact of Selected Variables on Site Selection for BLs vs. NBLs (Arlington County, Virginia).
| Covariate | Estimate | SD | P-value |
|---|---|---|---|
| (Intercept) | -2.932 | 0.316 | <0.0001 |
| One-way street (0=one-way, 1=two-way) | 1.422 | 0.087 | <0.0001 |
| AADT | 1.528 | 0.093 | <0.0001 |
| Speed limit | 0.001 | 0.001 | <0.0001 |
| Segment length | 0.041 | 0.003 | <0.0001 |
| Civic land use | -0.004 | 0.001 | <0.0001 |
| Commercial land use | 0.216 | 0.065 | <0.0001 |
Table 82 indicates the number of selected control and treatment sites. A total of 9,236 segments (sites) were identified in the data; 1,483 segments that had bike lanes were matched with 1,876 segments that had no bike lanes.
Table 82. Number of Selected Sites for BLs vs. NBLs (Arlington County, Virginia).
| Sample | Control | Treated | Total |
|---|---|---|---|
| All | 1,483 | 7,753 | 9,236 |
| Matched | 1,483 | 1,876 | 3,359 |
Table 83 presents the estimation results for this model. Installing bicycle lanes at sites with no bicycle treatment resulted in a 44 percent reduction in total crashes and a 55 percent reduction in KABC crashes. However, this reduction was not statistically significant. At these sites, ADB had a significantly increasing effect on bicyclist crashes (5 percent).
Table 83. Safety Effectiveness of BLs vs. NBLs (Arlington County, Virginia).
| Parameter | Total | KABC | ||||||
|---|---|---|---|---|---|---|---|---|
| CMF (CRF) | Estimate | SE | P-value | CMF (CRF) | Estimate | SE | P-value | |
| (Intercept) | 0.002 | -6.308 | 0.490 | <0.0001 | 0.002 | -6.382 | 0.508 | <0.0001 |
| Treated (0=NBL, 1=BL) | 0.559 (44% | -0.582 | 0.547 | 0.287 | 0.450 (55%â) | -0.799 | 0.588 | 0.174 |
| ADB | 1.056 | 0.054 | 0.015 | <0.0001 | 1.052 | 0.051 | 0.016 | <0.001 |
| Segment length | 1.010 | 0.010 | 0.003 | <0.001 | 1.011 | 0.011 | 0.003 | <0.001 |
| Overdispersion | 0.049 | 0.045 | ||||||
| AIC | 275 | 233 | ||||||
6.6.2 Austin and Dallas-Fort Worth, Texas
Table 84 summarizes the logistic regression results indicating the probability of a site being selected for a conventional bike lane treatment in Austin and DFW. The selection of a site for a
bicycle lane was significantly dependent on AADT, speed limit, lane width, number of lanes, land use type, number of bus stops, and population density.
Table 84. Impact of Selected Variables on Site Selection for BLs vs. NBLs (Austin and Dallas-Fort Worth, Texas).
| Covariate | Estimate | SD | P-value |
|---|---|---|---|
| (Intercept) | -5.592 | 0.517 | <0.001 |
| Log (AADT) | 0.799 | 0.066 | <0.001 |
| Speed limit | -0.102 | 0.012 | <0.001 |
| Lane width | 0.088 | 0.016 | <0.001 |
| Number of lanes | -0.285 | 0.062 | <0.5 |
| Civic land use | 0.117 | 0.019 | <0.005 |
| Number of bus stops | -0.108 | 0.023 | <0.5 |
| Population density | -73.981 | 31.034 | <0.05 |
Table 85 lists the number of treatment, control, and total sites after implementing the PSM. A total of 336 bike lanes were matched with 472 control sites, resulting in 808 segments for analysis.
Table 85. Number of Selected Sites for BLs vs. NBLs (Austin and Dallas-Fort Worth, Texas).
| Sample | Control | Treated | Total |
|---|---|---|---|
| All | 337 | 2607 | 2,944 |
| Matched | 336 | 472 | 808 |
Results of the crash models are presented in Table 86. Installing bike lanes was associated with a 38 percent significant reduction in total crashes and a 36 percent reduction in KABC crashes in Texas cities. The ADB had an increasing effect; however, the magnitude of this effect was very small (1 percent). Other factors affecting bicyclist safety at bike lanes included AADT, speed limit, lane width, civic land use, and number of bus stops on the bike lane route, all of which had an increasing effect on bicyclist crashes.
Table 86. Safety Effectiveness of BLs vs. NBLs (Austin and Dallas-Fort Worth, Texas).
| Parameter | Total | KABC | ||||||
|---|---|---|---|---|---|---|---|---|
| CMF (CRF) | Estimate | SE | P-value | CMF (CRF) | Estimate | SE | P-value | |
| (Intercept) | 0.070 | -2.655 | 0.529 | <0.0001 | 0.070 | -2.664 | 0.542 | <0.0001 |
| Treatment (0=NBL, 1=BL) | 0.617 (38% | -0.483 | 0.121 | <0.0001 | 0.634 (36%â) | -0.455 | 0.124 | <0.0001 |
| ADB | 1.001 | 0.001 | 0.002 | 0.407 | 1.001 | 0.001 | 0.002 | 0.375 |
| Log (AADT) | 1.098 | 0.093 | 0.059 | 0.115 | 1.096 | 0.092 | 0.060 | 0.127 |
| Speed limit | 1.022 | 0.022 | 0.011 | * | 1.021 | 0.021 | 0.011 | . |
| Lane width | 1.015 | 0.015 | 0.012 | 0.232 | 1.015 | 0.015 | 0.013 | 0.234 |
| Civic land use | 1.080 | 0.077 | 0.014 | <0.0001 | 1.080 | 0.077 | 0.015 | <0.0001 |
| Number of bus stops | 1.070 | 0.068 | 0.019 | <0.0001 | 1.068 | 0.066 | 0.020 | <0.0001 |
| Overdispersion | 0.586 | 0.620 | ||||||
| AIC | 1703 | 1669 | ||||||
6.6.3 Minneapolis, Minnesota
Table 87 summarizes the logistic regression results indicating the contextual factors that affect the installation of conventional bicycle lanes in Minneapolis. The installation of bike lanes was significantly related to the number of through lanes, lane width, left shoulder width, land use type, and number of bus stops.
Table 87. Impact of Selected Variables on Site Selection for BLs vs. NBLs (Minneapolis, Minnesota).
| Covariate | Estimate | SD | P-value |
|---|---|---|---|
| (Intercept) | -6.480 | 0.436 | < 0.001 |
| Number of through lanes | -0.729 | 0.240 | < 0.001 |
| Lane width | 0.097 | 0.010 | < 0.001 |
| Left shoulder width | -0.899 | 0.355 | < 0.001 |
| Civic land use | 0.835 | 0.094 | < 0.001 |
| Commercial land use | 0.653 | 0.088 | 0.000 |
| Residential land use | 0.163 | 0.074 | 0.012 |
| Number of bus stops | 0.075 | 0.016 | < 0.001 |
After identifying the covariates associated with the probability of installing bike lanes, we selected the sites for safety analysis. Of the 218 segments with a bicycle lane, 207 were matched with 217 control sites (with no facility), resulting in 424 segments for safety analysis (Table 88).
Table 88. Number of Selected Sites for BLs vs. NBLs (Minneapolis, Minnesota).
| Sample | Treated | Control | Total |
|---|---|---|---|
| All | 218 | 7815 | 8033 |
| Matched | 207 | 217 | 424 |
The results of the safety analysis indicated that the installation of bike lanes was associated with a relatively small reduction (5–6 percent) in crashes in Minneapolis; however, this reduction was not statistically significant. The ADB, lane width, commercial land use type, and number of bus stops had an increasing effect on crashes.
Table 89. Safety Effectiveness of BLs vs. NBLs (Minneapolis, Minnesota).
| Parameter | Total | KABC | ||||||
|---|---|---|---|---|---|---|---|---|
| CMF (CRF) | Estimate | SE | P-value | CMF (CRF) | Estimate | SE | P-value | |
| (Intercept) | 0.008 | -4.883 | 0.761 | <0.0001 | 0.006 | -5.145 | 0.656 | <0.000 1 |
| Treatment (0=NBL, 1=BL) | 0.949 (5% | -0.052 | 0.547 | 0.2945 | 0.945 (6%â) | -0.057 | 0.525 | 0.194 |
| ADB | 1.031 | 0.031 | 0.024 | 0.1954 | 1.033 | 0.032 | 0.021 | 0.132 |
| Lane width | 1.046 | 0.045 | 0.014 | <0.001 | 1.042 | 0.042 | 0.014 | <0.001 |
| Commercial land use | 1.726 | 0.546 | 0.235 | * | 1.653 | 0.503 | 0.237 | * |
| Parameter | Total | KABC | ||||||
|---|---|---|---|---|---|---|---|---|
| CMF (CRF) | Estimate | SE | P-value | CMF (CRF) | Estimate | SE | P-value | |
| Number of bus stops | 1.069 | 0.066 | 0.020 | <0.0001 | 1.061 | 0.060 | 0.017 | <0.000 1 |
| Overdispersion | 0.275 | 0.344 | ||||||
| AIC | 295 | 262 | ||||||
6.6.4 Philadelphia, Pennsylvania
Table 90 summarizes the logistic regression results indicating the contextual factors that affect the installation of conventional bicycle lanes in Philadelphia. In Philadelphia, the AADT, number of through lanes, and lane width, as well as various land use, transit, sociodemographic, and economic factors, were significantly associated with the probability of installing bicycle lanes.
Table 90. Impact of Selected Variables on Site Selection for BLs vs. NBLs (Philadelphia, Pennsylvania).
| Covariate | Estimate | SD | P-value |
|---|---|---|---|
| (Intercept) | -0.836 | 0.068 | <0.001 |
| AADT | 0.000 | 0.000 | <0.001 |
| Number of through lanes | 0.048 | 0.026 | <0.001 |
| Lane width | 0.049 | 0.017 | <0.001 |
| Civic land use | 0.046 | 0.009 | <0.001 |
| Commercial land use | 0.078 | 0.007 | <0.001 |
| Residential land use | -0.024 | 0.002 | <0.001 |
| Industrial land use | -0.034 | 0.017 | <0.001 |
| Number of bus stops | 0.461 | 0.022 | <0.001 |
| Population density | 123.900 | 5.348 | <0.001 |
| Percentage White population | -2.857 | 0.096 | <0.001 |
After identifying these variables, the research team developed a dataset for cross-sectional analysis, where the sites with and without treatment were selected (Table 91). A total of 9,018 segments were selected for safety analysis.
Table 91. Number of Selected Sites for BLs vs. NBLs (Philadelphia, Pennsylvania).
| Sample | Treated | Control | Total |
|---|---|---|---|
| All | 3,492 | 36,839 | 40,331 |
| Matched | 3,492 | 5,526 | 9,018 |
Table 92 presents the estimation results for evaluating the safety effectiveness of bike lanes in Philadelphia. As mentioned earlier, almost all bicyclist crashes resulted in fatalities and injuries; we therefore developed only one model for this study site. According to the estimation results, bike lanes were associated with a 67 percent reduction in bicyclist crashes. This finding was statistically significant and very important for a city where bicyclist crashes tend to result in fatalities and
injuries. The ADB was associated with a significant increase in crashes; however, the magnitude of this increase was very small (2 percent). Other factors affecting bicyclist safety were lane width; speed limit; civic, commercial, and industrial land use; number of bus stops; average daily transit; and population density. Each of these factors, except lane width, was associated with a significant increase in bicyclist crashes.
Table 92. Safety Effectiveness of BLs vs. NBLs (Philadelphia, Pennsylvania).
| Parameter | CMF (CRF) | Estimate | SE | P-value |
|---|---|---|---|---|
| (Intercept) | 0.013 | -4.381 | 0.202 | <0.0001 |
| Treatment (0=NBL, 1=BL) | 0.321 (67% | -1.135 | 0.167 | <0.0001 |
| ADB | 1.019 | 0.018 | 0.005 | <0.0001 |
| Lane width | 0.864 | -0.146 | 0.089 | 0.101 |
| Speed limit | 1.029 | 0.028 | 0.021 | 0.174 |
| Civic land use | 1.099 | 0.095 | 0.018 | <0.0001 |
| Commercial land use | 1.037 | 0.036 | 0.008 | <0.0001 |
| Industrial land use | 1.102 | 0.097 | 0.032 | <0.001 |
| Number of bus stops | 1.173 | 0.159 | 0.067 | * |
| Average daily transit | 1.045 | 0.044 | 0.015 | <0.001 |
| Population density | 2.293 | 0.830 | 11.644 | <0.0001 |
| Overdispersion | 1.360 | |||
| AIC | 2073 |
6.6.5 Seattle, Washington
Table 93 lists the contextual factors significantly associated with the probability of installing bicycle lanes in Seattle, including speed limit, surface width, and land use types. After identifying the significant covariates, 2,461 sites were selected for safety analysis (Table 94).
Table 93. Impact of Selected Variables on Site Selection for BLs vs. NBLs (Seattle, Washington).
| Covariate | Estimate | SD | P-value |
|---|---|---|---|
| (Intercept) | -8.433 | 0.277 | <0.0001 |
| Speed limit | 0.105 | 0.007 | <0.0001 |
| Surface width | -0.001 | 0.000 | <0.0001 |
| Commercial land use | 0.227 | 0.046 | <0.0001 |
| Residential land use | 0.087 | 0.026 | <0.0001 |
Table 94. Number of Selected Sites for BLs vs. NBLs (Seattle, Washington).
| Sample | Treated | Control | Total |
|---|---|---|---|
| All | 968 | 22,445 | 23,413 |
| Matched | 968 | 1,493 | 2,461 |
Finally, we developed the safety models to estimate the impact of bicycle facilities on total and KABC bicyclist crashes. Similar to previous findings, these models showed that bike lanes were associated with less crashes, resulting in a 68 percent reduction in total crashes and a 65 percent reduction in KABC crashes. However, these results were not statistically significant. Other factors affecting bicyclist safety included speed limit, lane width, commercial land use, and residential land use. The directions of these effects were consistent with the SBL models that were developed using the Seattle crash data.
Table 95. Safety Effectiveness of BLs vs. NBLs (Seattle, Washington).
| Parameter | Total | KABC | ||||||
|---|---|---|---|---|---|---|---|---|
| CMF (CRF) | Estimate | SE | P-value | CMF (CRF) | Estimate | SE | P-value | |
| (Intercept) | 0.049 | -3.016 | 0.376 | <0.0001 | 0.041 | -3.20 | 0.40 | <0.0001 |
| Treatment (0=NBL, 1=BL) | 0.320 (68% | -1.139 | 1.113 | 0.306 | 0.342 (65%â) | -1.07 | 1.17 | 0.358 |
| ADB | 1.100 | 0.095 | 0.078 | 0.225 | 1.103 | 0.10 | 0.08 | 0.234 |
| Speed limit | 0.917 | -0.086 | 0.042 | * | 0.904 | -0.101 | 0.046 | * |
| Segment length | 1.001 | 0.001 | 0.000 | <0.0001 | 1.001 | 0.001 | 0.000 | <0.0001 |
| Surface width | 1.034 | 0.034 | 0.007 | <0.0001 | 1.034 | 0.033 | 0.007 | <0.0001 |
| Commercial land use | 1.262 | 0.233 | 0.050 | <0.0001 | 1.226 | 0.204 | 0.053 | <0.0001 |
| Residential land use | 0.780 | -0.248 | 0.083 | <0.001 | 0.784 | -0.243 | 0.086 | <0.001 |
| Overdispersion | 0.412 | 0.439 | ||||||
| AIC | 1,048 | 963 | ||||||
6.7 CHAPTER SUMMARY AND DISCUSSIONS
Based on the available data, the research team developed 27 models to assess the safety effects of installing and converting bicycle facilities on total and KABC bicyclist crashes. presents key study findings including sample size, CMF, crash reduction percentage, standard deviation, and p-value.
Overall, installing any type of bicycle facilities was expected to result in crash reduction. This reduction was not always statistically significant, particularly at study sites with smaller sample sizes of treatment sites. The significance of the model coefficient depends on several factors such as the number of sites, number of crashes, study design, and modeling approach. As the results indicated, study sites that had considerable numbers of sites with bicycle treatments showed a significant reduction in crashes. For example, installing conventional bicycle lanes in over 3,000 roadway segments resulted in a 68 percent statistically significant reduction in bicyclist crashes in Philadelphia; 5,526 similar sites with no bike lanes did not show this reduction. Similarly, over 900 segments with bicycle lanes in Seattle showed a 66 percent statistically significant reduction in bicyclist crashes, when compared to 1,493 sites with similar characteristics and no bike lanes.
We also observed that retrofitting an existing bicycle lane led to a considerable reduction in crashes. For example, converting a bike lane to a separated bicycle lane led to a 90 percent reduction in crashes, while converting a buffered bike lane to a separated bike lane resulted in a 97 percent reduction in bicyclist crashes. The main study findings are summarized as follows:
- Installing separated bicycle lanes at sites with:
- No bicycle facilities can potentially result in an over 98 percent reduction in bicyclist crashes.
- Bicycle lanes can potentially lead to a 90 percent reduction in total crashes and a near 100 percent significant reduction in KABC crashes.
- Buffered bicycle lanes can result in an 84–97 percent significant reduction in total crashes and an 86 percent reduction in KABC crashes.
- Installing buffered bicycle lanes at sites with:
- No bicycle facilities can potentially result in a 55–77 percent reduction in total crashes and a 52–77 percent significant reduction in KABC crashes.
- Bicycle lanes can potentially reduce the total and KABC bicyclist crashes by 5–25 percent. This CMF was not statistically significant. Overall, this CMF was weak due to the very small number of treatment and control sites selected for analysis, as well as the very small number of crashes at the selected sites.
- Installing conventional bicycle lanes at sites with no facilities can result in a 38–68 percent reduction in total crashes and a 37–68 percent reduction in KABC crashes. In Minneapolis, this reduction was only 5 percent; however, the p-value associated with this CMF was not statistically significant.
6.7.1 Bicycle Counts
Exposure had a considerable impact on bicyclist crashes. Moreover, the exposure changed based on the facility type. Sites with no bicycle lanes generally had a smaller number of bicyclists (9 per site). Bicyclist counts increased gradually at sites with conventional and buffered bicycle lanes (32 and 37 per site, respectively). However, the bicyclist counts increased substantially along separated bicycle lanes due to the comfort and perceived safety of these facilities (135 per site). Findings from the safety analyses indicated that the average daily bicyclists can potentially increase the exposure to safety concerns, hence increasing the crash frequency and severity. Generally, the ADB was associated with a 1–10 percent increase in bicyclist crashes based on the facility type; however, this effect was not always statistically significant due to limitations in the ADB estimation.
6.7.2 Other Contextual and Operational Factors
In addition to bikeway types and counts, the safety models included many contextual factors. The results of the cross-sectional safety analysis can be interpreted in two ways:
- Factors influencing the probability of installing bicycle lane types.
- Factors associated with the changes in safety outcomes.
When considering all variables across all the models, we observed that the decision to install a particular bikeway type was mainly affected by the AADT and speed limit, as well as various land use, transit, socioeconomic, and demographic factors. We then used all these important factors to assemble the dataset for analysis; thus, despite not being included in the individual safety models, all these factors were accounted for in the data that was used for the safety analysis.
Overall, the decision to install a bikeway and the consequential effects of a bikeway on bicyclist safety were affected by the following contextual factors:
- Roadway operations and design factors such as speed limit, number of lanes, and lane width were found to have a significant effect on both the selection of sites for installing bicycle lanes and bicyclist crashes. More lanes were found to be associated with less crashes. However, lane and surface width were found to have an increasing effect on bicyclist crashes in all cases (except in Philadelphia). Speed limit and AADT were also generally found to have a negative impact on bicyclist safety, but AADT was not a significant factor in most of the safety models. Although other factors such as median width, shoulder width, and parking type were considered in some of the models and were found to be significant factors in selecting sites for installing bicycle facilities, they were not found to be significant in the safety models and were thus removed. One explanation for this may be that in matched data (in cross-sectional analyses), sites with and without treatment are assumed to have very similar characteristics; therefore, the covariates affecting the site selection probability (i.e., propensity scores) are not significant because the data already accounts for their effect.
- Land use types such as civic (i.e., public and privately owned buildings for meeting and conventions), commercial, and residential had a significant effect in determining both the probability of a site being selected for a bike lane installation and safety outcomes. Overall, sites on commercial and civic lands (including gas stations, businesses, and
- parking lots) were associated with an increased number of crashes, while residential areas were mostly associated with a decreased number of bicyclist crashes.
- Transit variables such as transit routes and bus stops were also found to have a significant effect on the decision to install a bikeway. The findings from the safety analyses showed that the sites with higher numbers of bus stops had a negative impact on bicyclist safety.
Demographic and socioeconomic factors such as race, ethnicity, population density, median income, labor force, and housing units were also considered during modeling. Among these factors, the population density, percentage of different racial and ethnic groups, and median income were found to have a significant effect when selecting sites for installing bicycle facilities. However, these factors were ultimately removed from the safety models because they did not yield significant results.
Table 96. Summary of Bike Lane CMFs
| CMF Name | Prior Facility | Study Design | Crash Severity | City, State | Sample Size | CMF | Crash Reduction Percentage | SD | P-value | |
|---|---|---|---|---|---|---|---|---|---|---|
| Treatment | Control | |||||||||
| Install separated bicycle lane | No bike lane | B/A | Total | Seattle, WA | 99 | - | 0.007 | 99% | 4.546 | 0.270 |
| Bike lane | B/A | Total | 99 | - | 0.100 | 90% | 0.988 | < 0.005 | ||
| Buffered bike lane | B/A | Total | 99 | - | 0.030 | 97% | 1.832 | <0.001 | ||
| No bike lane | C/S | Total | 99 | 147 | 0.016 | 98% | 3.238 | <0.01 | ||
| KABC | 99 | 147 | 0.001 | 100% | 3.170 | <0.05 | ||||
| Bike lane | C/S | Total | 99 | 132 | 0.002 | 100% | 3.298 | < 0.1 | ||
| KABC | 99 | 132 | 0.004 | 100% | 3.329 | < 0.1 | ||||
| Buffered bike lane | C/S | Total | 52 | 60 | 0.156 | 84% | 1.276 | 0.1459 | ||
| KABC | 52 | 60 | 0.143 | 86% | 1.318 | 0.141 | ||||
| Install buffered bike lane | No bike lane | C/S | Total | Austin-DFW, TX | 56 | 102 | 0.451 | 55% | 0.311 | <0.05 |
| Philadelphia, PA | 433 | 528 | 0.228 | 77% | 0.404 | <0.0001 | ||||
| KABC | Austin-DFW, TX | 56 | 102 | 0.478 | 52% | 0.311 | <0.05 | |||
| Philadelphia, PA | 433 | 528 | 0.228 | 77% | 0.404 | <0.0001 | ||||
| Bike lane | C/S | Total | Austin-DFW, TX | 54 | 74 | 0.750 | 25% | 0.419 | 0.492 | |
| Philadelphia, PA | 433 | 327 | 0.952 | 5% | 0.400 | 0.792 | ||||
| KABC | TX | 54 | 74 | 0.750 | 25% | 0.419 | 0.492 | |||
| Philadelphia, PA | 433 | 327 | 0.952 | 5% | 0.400 | 0.792 | ||||
| Install bike lane | No bike lane | C/S | Total | Arlington County, VA | 1,483 | 1,876 | 0.559 | 44% | 0.547 | 0.287 |
| Austin-DFW, TX | 336 | 472 | 0.617 | 38% | 0.121 | <0.0001 | ||||
| Minneapolis, MN | 207 | 217 | 0.949 | 5% | 0.547 | 0.294 | ||||
| Philadelphia, PA | 3,492 | 5,526 | 0.321 | 68% | 0.167 | <0.0001 | ||||
| Seattle, WA | 968 | 1,493 | 0.320 | 68% | 1.113 | 0.306 | ||||
| KABC | Arlington County, VA | 1,483 | 1,876 | 0.450 | 55% | 0.588 | 0.174 | |||
| Austin-DFW, TX | 336 | 472 | 0.634 | 37% | 0.124 | <0.0001 | ||||
| Minneapolis, MN | 207 | 217 | 0.945 | 6% | 0.525 | 0.194 | ||||
| Philadelphia, PA | 3,492 | 5,526 | 0.321 | 68% | 0.167 | <0.0001 | ||||
| Seattle, WA | 968 | 1,493 | 0.342 | 66% | 1.17 | 0.358 | ||||


