Safety Evaluation of On-Street Bicycle Facility Design Features (2025)
Chapter: 4 Assessment of Available Data and Survey
CHAPTER 4. ASSESSMENT OF AVAILABLE DATA AND SURVEY
4.1 INVENTORY OF READILY AVAILABLE DATA SOURCES
A significant effort was made during this study to assess and compile available data for safety analysis. For each variable group, the research team listed potential sources, such as open data portals (ODPs) for state DOTs and metropolitan planning organizations (MPOs), U.S. Census data, crowdsourced data, and relevant projects (Table 16).
Table 16. Potential Data Sources by Data Category.
| Category | Subcategory | Availability | Source | |
|---|---|---|---|---|
| State | Spatial Coverage | |||
| Bikeway | Bicycle facilities (all) | MA, NC, WA | Cities | ODPs for state DOTs and MPOs |
| Bicycle facilities (all) | TX | Cities (e.g., Austin, Dallas, Houston, etc.) | TxDOT Project 0-7043 | |
| SBLs | 44 states | 124 cities | Green Lane Project | |
| Bicycle exposure | Bicycle count | MI, NC, TX, WS | Roadway segments in cities | ODPs for state DOTs and MPOs |
| Nonmotorized count | CA, CO, NM, OH, OR, TX, VA, WS | Roadway segments in cities (e.g., Austin, San Francisco, etc.) | BikePed Portal website | |
| Crowdsourced data | All states | Roadway segments and corridors | Strava Metro, Street Light | |
| Safety measure | Crash | All states | Point locations | State DOTs and the Highway Safety Information System |
| Medical records* | 47 states and territories | Individual person records | NEMSIS | |
| Other | Roadway type and design | All states | Roadway segments | ODPs for state DOTs |
| Land use | All states | Census tract and block groups | ODPs for state DOTs and MPOs | |
| Transit | All states | Point data with ½- and ¼-mile buffer | National Transit Map | |
| Parking | All states | Cities (e.g., Austin, New York, District of Columbia, etc.) | ODPs for cities and districts | |
| Socioeconomic | All states | Census tract and block groups | Decennial U.S. census, American Community Survey, and National Household Travel Survey | |
| Meteorological | All states | Cities | National Oceanic and Atmospheric Administration | |
| *Medical records cannot be linked to road segments. Hence, their usefulness for developing CMFs was questionable. The research team explored how else the medical records could be used for the purposes of this research. | ||||
4.1.1 Bikeway Data
Bikeway data included bikeway type, facility width, direction, and installation date. The bikeway data were obtained from transportation and planning agencies (via ODPs) and relevant projects and publications, such as the Green Lane Project (GLP), Denver Regional Council of Governments (DRCOG), Chicago Metropolitan Agency for Planning (CMAP), City of Boston, City of New York Department of Transportation (NYCDOT), Seattle Department of Transportation, Central Ohio Bikeways, State of Arizona, Florida Department of Transportation (FDOT), State of Hawaii, Massachusetts Department of Transportation (MassDOT), Southeast Michigan Council of Governments (SEMCOG), North Carolina Department of Transportation (NCDOT), TxDOT 0-7043 Project, and Virginia Department of Transportation (VDOT). Table 17 lists the data sources, number of states and cities, and data level and number of records. It also indicates which sources had additional information regarding the bike lane widths and installation dates.
Note that the number of records (i.e., the number observations found in the database) do not always coincide with the number of records for an existing facility. The research team combined the shapefiles obtained from these sources with the state and city boundary shapefiles to summarize the number of existing bicycle facilities and bikeway types. One of the challenges of developing an on-street bikeway inventory is that the agencies collecting the data do not use consistent definitions. For example, a separated bicycle lane can be recorded as a cycle track or protected bike lane. Moreover, these sources contain a lot of redundant information, and most records were found to be for off-street facilities, such as trails or shared use paths (SUPs). Most of the data sources were updated in 2020 and 2021 with two exceptions: Central Ohio Bikeways data, which was updated in 2018 and CMAP data, which was updated in 2019.
The research team also found many records classified as a bike route, which can refer to both on-street and off-street facilities2. For the purposes of this project, the research team used a standard definition for the bikeway types whenever applicable and summarized the results based on the facility types of interest. Table 18 shows the number of on- and off-street facility types per state. Note that these records only indicate information contained in the existing databases; they do not
___________________
2A roadway or bikeway designated by the jurisdiction having authority, either with a unique route designation or with Bike Route signs, along which bicycle guide signs may provide directional and distance information. Signs that provide directional, distance, and destination information for bicyclists do not necessarily establish a bicycle route. (AASHTO Guide for the Development of Bicycle Facilities, 4th Edition, 2012.)
imply that a city does not have a bikeway. States with notable data, including California, Colorado, Florida, Illinois, Massachusetts, Maine, New York, North Carolina, Texas, Virginia, and Washington, are highlighted in bold font.
Table 17. Bikeway Data Sources.
| Data Source | State | City | Data Level | Number of Records | Records with Existing Facility | Bicycle Lane Width | Bikeway Installation Date |
|---|---|---|---|---|---|---|---|
| Arizona Geographic Information Council | AZ | 113 cities | State | 32,906 | 9,732 | - | - |
| Central Ohio Bikeways | OH | 36 cities | Regional | 7,595 | 1,039 | X | X |
| Chicago Metropolitan Agency for Planning | IL | Chicago | City | 30,420 | 28,088 | X | - |
| City of Boston | MA | Boston | City | 2,871 | 2,871 | - | X |
| City of New York | NY | New York | City | 19,875 | 19,495 | - | - |
| Denver Regional Council of Governments | CO | Denver | Regional | 1,001 | 1,001 | - | - |
| Green Lanes Project | 43 states | 131 cities | National | 605 | - | - | |
| Florida Department of Transportation | FL | 529 cities | State | 14,288 | 14,288 | - | - |
| Honolulu Department of Transportation Service | HI | Honolulu | State | 212 | 212 | - | - |
| Massachusetts Department of Transportation | MA | 211 cities | State | 14,683 | 8,630 | - | - |
| North Carolina Department of Transportation | NC | 250 cities | State | 45,856 | 9,129 | - | - |
| Seattle Department of Transportation | WA | Seattle | City | 3,372 | 3,372 | - | X |
| Southeast Michigan Council of Governments | MI | 58 cities | Regional | 262,828 | 5,705 | - | - |
| TxDOT 0-7043 Project* | TX | 100 cities | State | 1,120 | X | - | |
| Virginia Department of Transportation | VA | 68 cities | State | 6,294 | 1,802 | - | - |
Table 18. Number of Records by Bikeway Type per State.
| State Name | Number of Cities | Number of On-Street Facility Records | Number of Off-Street Facility Record | ||||||
|---|---|---|---|---|---|---|---|---|---|
| BL | BBL | SBL | CBL | SUP | Trail | Bike Route | |||
| Alabama | 1 | 1 | |||||||
| Alaska | 1 | 1 | |||||||
| Arizona | 60 | 5 | 2,168 | 1,052 | 6,328 | ||||
| Arkansas | 3 | 4 | |||||||
| California | 23 | 78 | |||||||
| Colorado | 42 | 18 | 683 | ||||||
| Connecticut | 1 | 2 | |||||||
| Delaware | 1 | 1 | |||||||
| Florida | 530 | 245 | 12 | 3,045 | 4 | ||||
| Georgia | 1 | 8 | |||||||
| Hawaii | 31 | 6 | 50 | 70 | |||||
| Illinois | 273 | 273 | 256 | 18,183 | 5,395 | ||||
| Indiana | 2 | 10 | |||||||
| State Name | Number of Cities | Number of On-Street Facility Records | Number of Off-Street Facility Record | ||||||
|---|---|---|---|---|---|---|---|---|---|
| BL | BBL | SBL | CBL | SUP | Trail | Bike Route | |||
| Iowa | 5 | 5 | |||||||
| Kansas | 1 | 1 | |||||||
| Kentucky | 1 | 2 | |||||||
| Maine | 1 | 120 | 269 | 9 | 329 | ||||
| Maryland | 3 | 3 | |||||||
| Massachusetts | 213 | 350 | 4,422 | ||||||
| Michigan | 61 | 142 | 502 | ||||||
| Minnesota | 3 | 48 | |||||||
| Missouri | 3 | 3 | |||||||
| Montana | 1 | 3 | |||||||
| Nebraska | 1 | 1 | |||||||
| Nevada | 2 | 3 | |||||||
| New Hampshire | 1 | 1 | |||||||
| New Jersey | 4 | 21 | |||||||
| New Mexico | 1 | 1 | |||||||
| New York | 5 | 118 | 178 | 5,682 | 150 | 3,055 | |||
| North Carolina | 250 | 21 | 2 | 4,987 | |||||
| North Dakota | 1 | 1 | |||||||
| Ohio | 19 | 3 | 421 | 208 | |||||
| Oklahoma | 1 | 1 | |||||||
| Oregon | 7 | 30 | |||||||
| Pennsylvania | 5 | 21 | |||||||
| Rhode Island | 1 | 1 | |||||||
| Tennessee | 3 | 9 | |||||||
| Texas | 100 | 139 | 45 | 1 | 2,150 | 231 | 1 | ||
| Utah | 2 | 3 | |||||||
| Vermont | 1 | 1 | |||||||
| Virginia | 72 | 71 | 12 | 2 | 38 | 10 | 211 | ||
| Washington | 3 | 1,114 | 356 | 192 | |||||
| Wisconsin | 2 | 4 | |||||||
| Wyoming | 1 | 1 | |||||||
4.1.2 Bicycle Count Data
Count data are collected from permanent, short-term, and manual counters. The research team identified the following data sources with readily available count data: Bicycle Counts in Central Lane MPO Area, BikeArlington Counter Dashboard, BikePed Portal Map and Dashboard, City of New York, CMAP, Colorado DOT Nonmotorized Traffic Data, Delaware Valley Regional Planning Commission (DVRPC), Minnesota DOT (MnDOT), NCDOT Nonmotorized Volume Data Program, Northeast Ohio Areawide Coordinating Agency, Seattle DOT, Southern California Association of Governments (SCAG), Texas Bicycle and Pedestrian Count Exchange (BP|CX), and Washington State DOT (WSDOT).
Table 19 shows the number of identified count stations from each of these sources. This table indicates the total number of stations per state. The research team also identified the type of counter (permanent, short-term, or manual) and the sites/cities where they are located. Data from
permanent counters are collected for more than a year. Short-term counters are usually placed for more than two weeks. Manual counters usually collect data for only a few hours. In addition to readily available count data, the research team also used crowdsourced data from Strava; we coordinated with Strava Metro to obtain access to national Strava data for a limited time period to accomplish this effort. Identifying the facility type where the permanent and short-term counters were located was challenging because the count data did not include such information, and it therefore needed to be collected manually.
Table 19. Permanent and Short-Term Bicycle Count Data Sources.
| Count Data Source | State | City, County | Data Level | Total Count Stations | Permanent Count Sites | Short-Term Count Sites | ||
|---|---|---|---|---|---|---|---|---|
| Number of Sites | Number of On-Street Facilities | Number of Sites | Number of On-Street Facilities | |||||
| Central Lane Metropolitan Planning Organization Area | OR | Three cities | Regional | 76 | 8 | 1 | 161 | 50 |
| BikeArlington Counter Dashboard | VA | Arlington | County | 32 | 12 | 10 | N/A | N/A |
| BikePed Portal Map and Dashboard | 10 states | Multiple cities | City | 336 | 336 | <46 | N/A | N/A |
| City of New York | NY | New York | City | 23 | 23 | N/A | N/A | N/A |
| Chicago Metropolitan Agency for Planning | IL | Multiple cities | Regional | 155 | N/A | N/A | 146 | N/A |
| Colorado Department of Transportation Nonmotorized Traffic Data | CO | Multiple cities | State | 122 | 20 | 3 | 102 | 25 |
| Delaware Valley Regional Planning Commission | PA, NJ | Multiple cities | Regional | 1006 | 17 | 2 | 989 | 283 |
| Minnesota Department of Transportation | MN | Multiple cities | State | 68 | 25 | 6 | 43 | N/A |
| North Carolina Department of Transportation Nonmotorized Volume Data Program | NC | Multiple cities | State | 50 | 50 | 24 | N/A | N/A |
| Northeast Ohio Areawide Coordinating Agency | OH | Multiple cities | Regional | 41 | N/A | N/A | 172 | 22 |
| Seattle Department of Transportation | WA | Seattle | City | 129 | 12 | 1 | 117 | N/A |
| Count Data Source | State | City, County | Data Level | Total Count Stations | Permanent Count Sites | Short-Term Count Sites | ||
|---|---|---|---|---|---|---|---|---|
| Number of Sites | Number of On-Street Facilities | Number of Sites | Number of On-Street Facilities | |||||
| Southern California Association of Governments | CA | Multiple cities | Regional | 724 | N/A | 1 | 723 | 25 |
| Strava Metro | Various states | Multiple cities | National | |||||
| Texas Bicycle and Pedestrian Count Exchange | TX | Multiple cities | State | 192 | 91 | 16 | 101 | 93 |
| Washington State Department of Transportation | WA | Multiple cities | State | 464 | 61 | N/A | 403 | 109 |
Table 20 shows the number of total and permanent counters per state. Note that there were differences in the number of counters per state; some databases included count data from various states. Due to the time-consuming nature of the bicycle count data collection process, the research team only focused on states that had readily available counts. We favored states with at least a few permanent counters that allowed us to observe time series data. As shown in Table 20, the states of interest were California, Colorado, Illinois, Minnesota, New York, North Carolina, Ohio, Oregon, Pennsylvania, Texas, Virginia, and Washington. The research team also learned that Michigan could potentially have permanent counter data and reached out to SEMCOG. At the time of writing this report, the research team had not received a response.
Table 20. Number of Total and Permanent Bicycle Counters per State.
| State | Number of Cities | Total Number of Counters | Number of Permanent Counters | Number of Permanent Counters on On-Street Facilities |
|---|---|---|---|---|
| California | 40 | 799 | 1 | 0 |
| Colorado | 42 | 135 | 20 | 3 |
| Illinois | 4,948 | 241 | 0 | 0 |
| Minnesota | 40 | 68 | 25 | 6 |
| New York | 1 | 23 | 23 | 0 |
| North Carolina | 14 | 50 | 50 | 38 |
| Ohio | 30 | 105 | 0 | 0 |
| Oregon | 13 | 207 | 8 | 1 |
| Pennsylvania | 120 | 1006 | 17 | 0 |
| Texas | 18 | 192 | 91 | 16 |
| Virginia | 2 | 40 | 28 | 9 |
| Washington | 68 | 543 | 57 | 1 |
| Total | 428 | 3,409 | 320 | 74 |
4.1.3 Land Use and Access Data
The research team identified the list of land use and access data sources simultaneously. For the most part, we found that the land use, transit stops, and parking data were readily available from each potential state and city ODP. Driveway access data were not always readily available and was thus collected manually for each site. Based on the results from the bikeway and count data inventory, as well as the results of a survey, the research team explored the ODPs for potential states and cities included in the data collection. Table 21 lists the data sources and types of variables identified. The data were available in tabular and shapefile formats. The land use data were available for each parcel (lot), while transit stops and parking presence were provided as point data. After combining the bikeway and count data, the research team included the land use and access data elements from these data sources using ArcGIS tools and assigned the attributes to each midblock location.
Table 21. Data Sources for Land Use and Access Variables.
| State | City and County Name | Variable | Data Source |
|---|---|---|---|
| CA | Los Angeles | Parking presence and type Transit stops and headways | Los Angeles City GeoHub |
| San Francisco | Land use type Parking presence and type | San Francisco.Gov, San Francisco Municipal Transportation Agency | |
| CO | Statewide | Land use type Transit stops and headways | Colorado Information Marketplace, Real-Time Data Open GIS Data |
| Denver | Driveway access Land use type | DRCOG | |
| FL | Statewide | Parking presence and type | FDOT Open Data Hub, Florida Department of Environmental Protection Open Data |
| IL | Chicago | Parking presence and type Transit stops and headways | Chicago Data Portal |
| MA | Statewide | Land use type Transit stops and headways | MassDOT, Transit Data |
| Boston | Land use type | Oliver online mapping tool | |
| MN | Minneapolis | Land use type Parking presence and type | OpendataMIN, ParkingMeter |
| NY | New York City | Parking presence and type | Open Data |
| OR | Statewide | Transit stops and headways | Trimet, Oregon Spatial Data Library |
| Portland | Land use type Parking presence and type Transit stops and headways | City of Portland, Transportation Portland Maps-Open Data | |
| TX | Statewide | Land use type Parking and buffer width Parking width Transit stops and headways | Texas BP|CX |
| Austin | Land use type Loading zone Parking presence and type | City of Austin, Austin.Gov |
| State | City and County Name | Variable | Data Source |
|---|---|---|---|
| Dallas-Fort Worth | Driveway access Land use type Parking presence and type | North Central Texas Council of Governments GIS Data | |
| WA | Statewide | Parking presence and type Transit stops and headways | WSDOT, Washington Geospatial Open Data Portal |
| Seattle | Land use type Transit stops and headways | Seattle Geodata, Seattle City GIS |
4.1.4 Other Readily Available Data
In addition to the readily available bike facility, bicycle count, and land use data, the research team also collected crash, roadway inventory, socioeconomic, and meteorological data at the selected sites. The socioeconomic and meteorological data were available at the national level and did not require rigorous data collection. Crash and roadway inventory data were available from state DOTs. Although roadway inventory data were mostly open-source, crash data were not publicly available and were requested from state DOTs during the agency surveys (described later in this chapter). Moreover, not all crash data had the same level of detail; each state may have a different method for inventorying the crash data. Therefore, despite the data being available, the research team spent considerable time developing a consistent crash database for conducting safety analyses.
As part of the survey, the research team asked whether each agency had crash data and if they would share it with the research team. Based on the list of selected sites, the research team reached out to each state to request the bicyclist and vehicle crash data.
The research team also explored the potential of using hospital data. Hospital data includes all hospital discharges, emergency department visits, and observation stays for any reason. However, hospital data contain relatively little information about the crash and therefore require each case to be linked to a crash record. Two main barriers exist to linking hospital and crash data: (1) many injury cases related to crashes in hospital data are not reported to the police and therefore lack an external record for linkage, and (2) hospital data tends to be rigorously protected by Health Insurance Portability and Accountability Act (HIPAA) laws for patient privacy and is therefore difficult to access. The research team investigated the potential of using hospital data, but did not consider it a necessary data source for conducting safety analyses. The research team also did not see an immediate need for collecting encroachment data. However, this decision was not finalized until after the research team identified the exact locations of bicycle facilities and assessed the readily available crash data. Table 22 presents the number of all the data sources per criteria.
Table 22. Number of Data Sources per Criteria.
| Variable Category (Type) | Variable Name | Number of Data Sources per Data Level | ||||
|---|---|---|---|---|---|---|
| National | Regional | State | County | City | ||
| Bikeway design | Bikeway direction | 1 | 1 | 1 | ||
| Bikeway type | 1 | 7 | 14 | 14 | ||
| Bicycle lane buffer width | ||||||
| Bicycle lane width | 1 | 1 | ||||
| Bicycle network | ||||||
| Facility installation date | 1 | 2 | ||||
| Type of separation | ||||||
| Bicyclist exposure and speed limits | Bicyclist counts and count ranges | 5 | 8 | 2 | 5 | |
| Speed limit | 9 | 5 | ||||
| Traffic volumes | 11 | 2 | 12 | |||
| Demographic and socioeconomic | Average age per capita | 1 | ||||
| Income | 1 | |||||
| Demographics and employment | 1 | |||||
| Vehicles per household | 1 | |||||
| Land use and access | Driveway access | 1 | 1 | |||
| Land use type | 8 | 1 | 21 | |||
| Loading and transit zones | 1 | |||||
| Number of upstream and downstream intersections | ||||||
| Parking and buffer width | 2 | |||||
| Parking presence, type, and meter | 2 | 1 | 18 | |||
| Transit stops and headways | 1 | 21 | 8 | 11 | ||
| Meteorological and temporal | Weather conditions | 1 | ||||
| Daylight conditions | ||||||
| Roadway design elements | Lane width | 6 | ||||
| Median type | 3 | 1 | ||||
| Number of lanes | 3 | |||||
| Presence of curb and gutter | 1 | 2 | ||||
| Presence of street lighting | 1 | 1 | ||||
| Road alignment | ||||||
| Shoulder presence and width | 8 | |||||
| Safety measures | Bicyclist crashes | >1* | ||||
| Vehicle crashes | >1* | |||||
| Vehicle encroachment | ||||||
| Total | 6 | 13 | 100 | 14 | 93 | |
* Assumed to be available for most states and cities.
4.2 SURVEY METHODOLOGY AND RESULTS
4.2.1 Survey Design and Dissemination
A questionnaire was developed to identify candidate sites for assessing the safety performance of bicycle infrastructure along midblocks. The questionnaire sought to identify agencies and jurisdictions that had implemented various types of segment and intersection infrastructure and
to learn what types of data were available. The midblock facilities of interest included conventional bike lanes, buffered bike lanes, one-way and two-way separated bike lanes, and contraflow bike lanes. A key use for the survey was to identify and follow-up with jurisdictions that had sites and data that could be used for the safety analyses.
The first step in designing the survey was to develop a generic template. The images for the midblock and intersection facilities were sourced from the research team members. Team members tested a pilot survey and provided feedback for further improvements on the format and content of the survey questions. Once the research team was satisfied with the survey design, it was finalized and distributed. The survey (published at: https://portlandstate.qualtrics.com/jfe/form/SV_39SxIDp1VtZKjlA) was open to the public from May 6–27. The research team widely shared the survey using several email lists, including the Association of Pedestrian and Bicycle Professionals (APBP) listserv, TRB committee email lists, state DOT bike and pedestrian coordinators list. Researchers also conducted some targeted outreach to locations thought to have a variety of the target infrastructure.
The survey included a total of nine questions, primarily in multiple-choice format. First, the respondents were asked to indicate the type of organization that they worked for. Next, they were asked to indicate if their jurisdiction implemented any of the following midblock facility designs that was shown in the survey. The following question inquired if the respondents’ agencies had or planned to collect the data related to the facilities. The questionnaire’s specific data types included bicycle count data, bikeway data, bicyclist crash data, motor vehicle volume data, roadway inventory data, driveway location data, transit stop location data, parking data, and land use data. For each data source, respondents were asked to choose one of the following four options: (1)don’t have and don’t plan to collect, (2) don’t have but plan to collect, (3) have for some facilities, and (4) have for most/all facilities. If a respondent indicated that their agency either had count data or planned to collect it, the next question asked about the jurisdiction’s methods used (or planned) to collect the count data. Options included permanent counters, temporary counters, video data, manual counts, other, and not sure. Similarly, if the respondents indicated that their jurisdiction either had bikeway data or planned to collect it, they were asked to indicate the type of bikeway data that their jurisdiction collects. The options included all the midblock and intersection facility types of interest and included separate options for whether they had data on the facility location and installation date.
Respondents were then asked if they were able to share their data with the research team. Finally, they were asked to provide their contact information and any other thoughts that they would like to share with the research team.
4.2.2 Survey Response Summary
Agency Type
A total of 317 complete or partial responses were obtained for the survey; 164 respondents (52 percent) completed the survey, while 153 other respondents (48 percent) started and provided some responses but did not finish and submit the survey. Overall, 24 percent of the respondents worked for a research institute or university, while 19 percent worked for a consulting group, 18 percent worked at a state DOT, 12 percent worked at a city, 6 percent each worked at a Federal agency or MPO, and 4 percent worked for a county (Table 23).
Table 23. Number of Respondents by Organization Type and Survey Completion Status.
| Respondents | State DOT | MPO | Federal Agency | City | County | Consulting Group | Research Institute/University | Other | Total |
|---|---|---|---|---|---|---|---|---|---|
| Incomplete survey | 18 | 6 | 11 | 10 | 5 | 35 | 44 | 24 | 153 |
| Completed survey | 40 | 14 | 7 | 28 | 8 | 24 | 32 | 10 | 164 |
| Total | 58 (18%) | 20 (6%) | 18 (6%) | 38 (12%) | 13 (4%) | 59 (19%) | 76 (24%) | 34 (11%) | 317 |
4.2.2.1 Facility Type Installed
The respondents were shown an image of bikeway types installed on midblock facilities and were asked if their jurisdiction had implemented any (Figure 6).
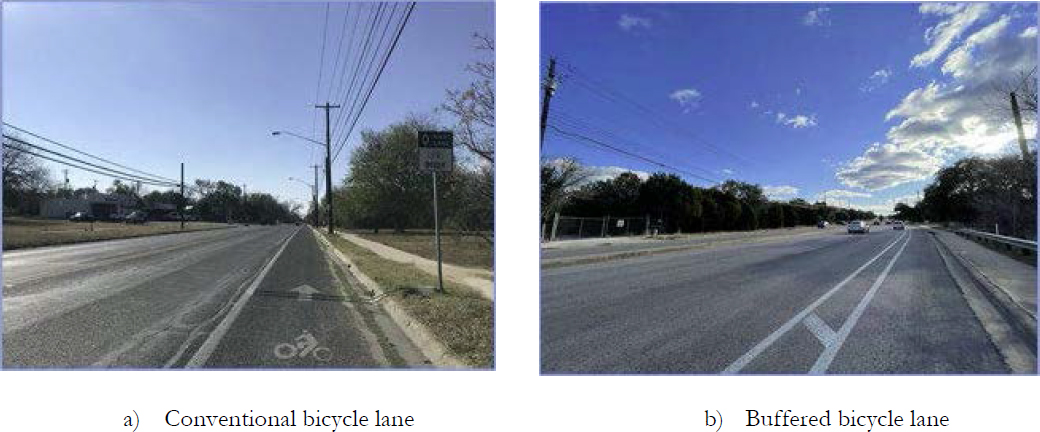
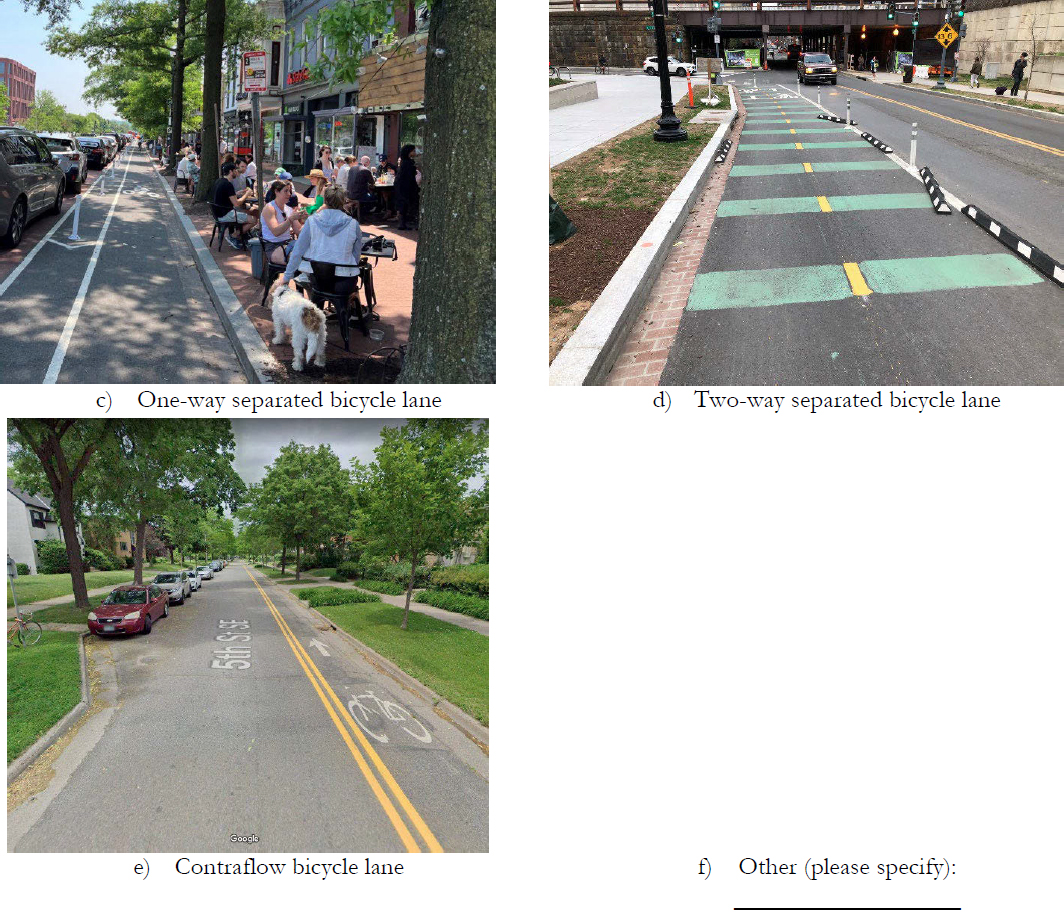
Figure 6. Midblock Facility Designs.
Table 24 shows responses to the type of midblock bikeway designs implemented in the jurisdiction by organization type. The percentages reflect the proportion of respondents from each organization type (among those who provided a response to this question) who indicated their jurisdiction had implemented each facility type. Hence, the proportions do not add up to a 100 percent. Not surprisingly, conventional bicycle lanes were reported as being present across all organization types (92–100 percent). Respondents also reported the presence of buffered bicycle lanes (64–94 percent) in their jurisdictions. Respondents reported the presence of more one-way (48–75 percent) than two-way (22–67percent) separated bicycle lanes. Contraflow bicycle lanes were rarer (8–58 percent) than the other midblock facility types.
Table 24. Existing Midblock Facility Type by Organization Type.
| Bikeway Type Installed | State DOT | MPO | Federal Agency | City | County | Consulting Group | Research Institute/University | Other |
|---|---|---|---|---|---|---|---|---|
| Conventional bicycle lane | 48 (96%) | 18 (100%) | 11 (92%) | 35 (97%) | 12 (100%) | 42 (98%) | 48 (98%) | 20 (100%) |
| Buffered bicycle lane | 32 (64%) | 17 (94%) | 9 (75%) | 30 (83%) | 10 (83%) | 36 (84%) | 34 (84%) | 15 (75%) |
| One-way separated bicycle lane | 24 (48%) | 13 (72%) | 9 (75%) | 22 (61%) | 8 (61%) | 31 (72%) | 24 (72%) | 13 (65%) |
| Two-way separated bicycle lane | 11 (22%) | 11 (61%) | 8 (67%) | 19 (53%) | 4 (53%) | 23 (53%) | 18 (53%) | 10 (50%) |
| Contraflow bicycle lane | 4 (8%) | 7 (39%) | 7 (58%) | 14 (39%) | 3 (39%) | 18 (42%) | 10 (42%) | 8 (40%) |
| Total respondents | 50 | 18 | 12 | 36 | 12 | 43 | 49 | 20 |
4.2.2.2 Data Type Collected
Table 25 shows the type of data collected. Most respondents reported having the various types of data for some facilities with bicycle count (60 percent) and crash (44 percent) data being the most common. Most agencies also reported having motor vehicle volumes (56 percent), transit stop data (58 percent), and roadway inventory data (64 percent) for most/all facilities. Of the data sources that respondents reported as not having and not planning to collect, driveway location data (37 percent) and parking data (30 percent) were most common. Bicycle count data (17 percent) was commonly reported by respondents who noted that they do not have the data but plan to collect it.
Table 25. Types of Data Collected.
| Type of Data | Don’t Have and Don’t Plan to Collect | Have for Some Facilities | Have for Most/All Facilities | Don’t Have but Plan to Collect | Total Respondents |
|---|---|---|---|---|---|
| Bicycle count | 28 (17%) | 98 (60%) | 9 (6%) | 27 (17%) | 162 |
| Bikeway | 25 (16%) | 65 (41%) | 56 (35%) | 14 (9%) | 160 |
| Bicyclist crash | 17 (10%) | 72 (44%) | 63 (39%) | 11 (7%) | 163 |
| Motor vehicle volume | 9 (5%) | 60 (36%) | 93 (56%) | 3 (2%) | 165 |
| Roadway inventory | 11 (7%) | 43 (26%) | 106 (64%) | 6 (4%) | 166 |
| Driveway location | 56 (37%) | 59 (39%) | 26 (17%) | 12 (8%) | 153 |
| Transit stop location | 23 (14%) | 39 (24%) | 94 (58%) | 5 (3%) | 161 |
| Parking (e.g., on-street parking, parking setbacks) | 47 (30%) | 65 (42%) | 26 (17%) | 18 (12%) | 156 |
| Land use | 27 (17%) | 53 (33%) | 73 (45%) | 8 (5%) | 161 |
4.2.2.3 Count Data Collection Method
Table 26 shows the methods used by agencies for bicyclist count data collection. This question was answered by respondents who noted that they collect these data on some facilities or did not collect these data yet but plan to. About two-thirds of respondents (67 percent) noted the use of temporary counters, while 56 percent reported the use of permanent counters, 45 percent reported using manual methods, and 39 percent noted the use of video data for counts.
Table 26. Bicyclist Count Data Collection Methods by Organization Type.
| Data Collection Method | State DOT | MPO | Federal Agency | City | County | Consulting Group | Research Institute/University | Other |
|---|---|---|---|---|---|---|---|---|
| Permanent counters | 17 (59%) | 7 (44%) | 2 (67%) | 18 (67%) | 3 (43%) | 10 (63%) | 12 (50%) | 1 (50%) |
| Temporary counters | 23 (79%) | 12 (75%) | 1 (33%) | 16 (59%) | 5 (71%) | 10 (63%) | 14 (58%) | 2 (100%) |
| Video data | 12 (41%) | 5 (31%) | 1 (33%) | 17 (63%) | 2 (29%) | 6 (38%) | 5 (21%) | 0 (0%) |
| Manual | 12 (41%) | 5 (31%) | 0 (0%) | 17 (63%) | 2 (29%) | 8 (50%) | 10 (42%) | 2 (100%) |
| Other (please specify) | 5 (17%) | 0 (0%) | 0 (0%) | 2 (7%) | 2 (29%) | 0 (0%) | 1 (4%) | 1 (50%) |
| Not sure | 5 (17%) | 3 (19%) | 1 (33%) | 0 (0%) | 0 (0%) | 1 (6%) | 6 (25%) | 0 (0%) |
| Total Respondents | 29 | 16 | 3 | 27 | 7 | 16 | 24 | 2 |
4.2.2.4 Other Bikeway Data
Table 27 shows the type of other data available (e.g., location, installation date) for the midblock and intersection facility types. Overall, respondents reported knowing the locations of the conventional bike lanes (97 percent), buffered bike lanes (74 percent), separated bike lanes (69 percent), and shared bike lanes (66 percent). Across all facility types, information on the installation date was not as readily available as the location.
Table 27. Types of Other Bikeway Data Available.
| Bikeway Type | Location | Installation Date | Total Respondents |
|---|---|---|---|
| Conventional bike lane | 105 (97%) | 46 (43%) | 108 |
| Buffered bike lane | 80 (74%) | 39 (36%) | 108 |
| Separated bike lane | 74 (69%) | 36 (33%) | 108 |
| Contraflow bike lane | 33 (31%) | 17 (16%) | 108 |
4.2.2.5 Data Sharing
As shown in Table 28, 13 percent of the respondents indicated that they were willing to share their data, while 20 percent noted that they might be able to share their data. Another 16 percent declined to share their data, while 51 percent did not provide an answer to this question (most of the respondents who did not provide an answer also provided incomplete surveys).
Table 28. Data Sharing.
| Are You Able to Share Your Data? | Frequency | Percent |
|---|---|---|
| Yes | 41 | 13% |
| Maybe | 63 | 20% |
| No | 52 | 16% |
| Subtotal | 156 | 49% |
| No response provided | 161 | 51% |
| Total | 317 | 100% |
4.3 CHAPTER SUMMARY
We explored data sources on bicycle facilities, bicycle counts, and land use and access data. Findings of this assessment indicated that sites within the following states could potentially be included for data collection: California, Colorado, Illinois, Michigan, Minnesota, New York, North Carolina, Ohio, Oregon, Pennsylvania, Texas, Virginia, and Washington. While exploring the data for each state, the research team also identified the list of cities and counties with the most facility and count records. The agency survey provided critical information on the presence of midblock and intersection facilities of interest within jurisdictions, as well as various data sources.


