Safety Evaluation of On-Street Bicycle Facility Design Features (2025)
Chapter: 5 Site Selection and Data Collection
CHAPTER 5. SITE SELECTION AND DATA COLLECTION
5.1 PRELIMINARY SITE SELECTION APPROACH
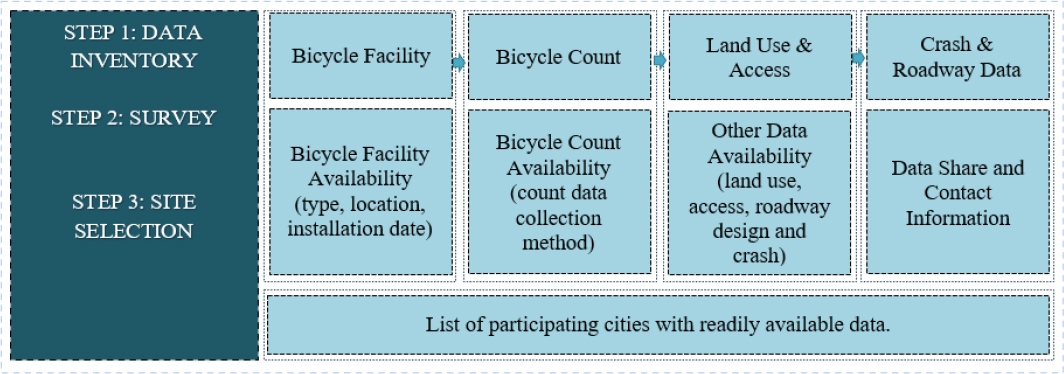
Figure 7 presents the site selection approach. First, the research team assessed the readily available data on bicycle facilities and bicycle counts, which were most critical to collect. Once the bikeway and count data identification step was finalized, we identified the land use and access data for potential sites, which was another challenging data type that needed to be collected. The research team was aware that some data elements such as crash and roadway information are usually readily available from state DOTs and local agencies. Therefore, collecting these types of data did not require a rigorous search. The research team also conducted a survey to identify the potential list of agencies that could provide readily available data on bicycle facilities (e.g., type, location, and installation date), bicycle counts (including availability and type of count), and other data types related to land use and access (e.g., type of land use, parking presence, transit stops, driveway locations), roadway inventory characteristics, and crashes. After collecting all the required information and exploring the data sources identified during this process, the research team combined the readily available data and survey results to select the list of cities with potential sites for data collection. Based on the preliminary assessment, the research team then established a data collection plan.
Eleven cities and one county were selected for data collection, with five cities proposed as alternative sites (Figure 8).
Table 29 depicts the number of bikeway records and counters per site together with the data availability.
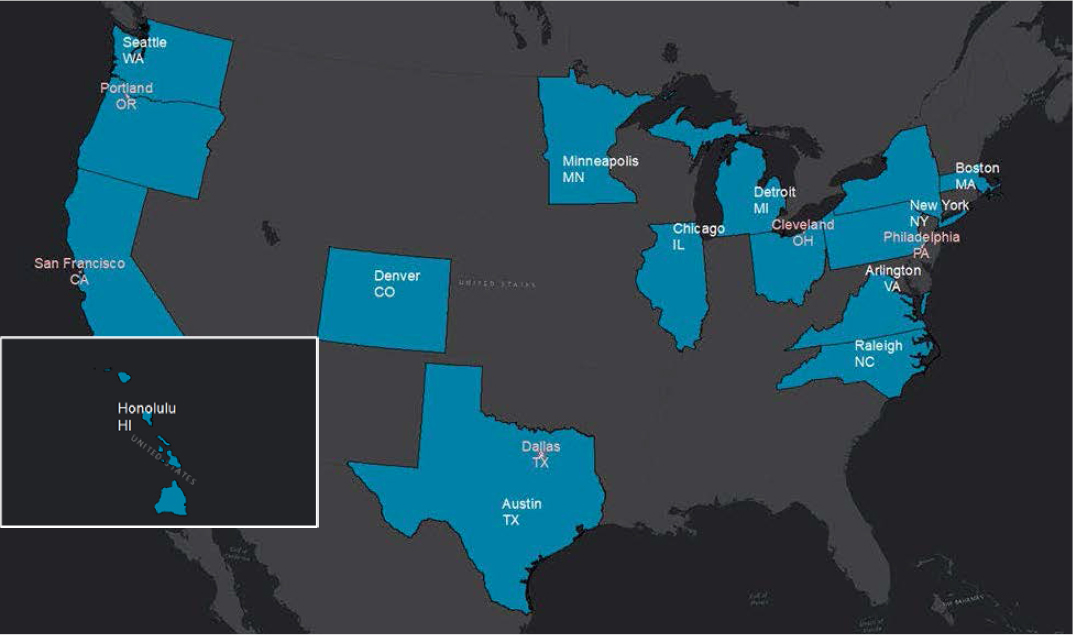
Table 29. Number of Bikeway Records and Counters per Selected Site.
| City or County, State | Number of On-Street Facility Records | Number of Counters | |||||
|---|---|---|---|---|---|---|---|
| BL | BBL | SBL | CBL | Total Counters | Permanent Counters | Permanent Counters on On-Street Facility | |
| Arlington County, VA | 160 | 17 | 28 | 28 | 9 | ||
| Austin, TX | 322 | 27 | 26 | 48 | 26 | 14 | |
| Boston, MA | 1,250 | 120 | 269 | 9 | |||
| Chicago, IL | 235 | 208 | 139 | 44 | |||
| Cleveland, OH | 42 | 0 | 0 | ||||
| Dallas, TX | 9 | 13 | 7 | 36 | 36 | 0 | |
| Denver, CO | 8 | 11 | 22 | 1 | 0 | ||
| Detroit, MI | 901 | 52 | 428 | ||||
| Honolulu, HI | 43 | 3 | |||||
| Los Angeles, CA | < 200 | 7 | 231 | 0 | 0 | ||
| Minneapolis, MN | 38 | 5 | 4 | 3 | |||
| New York, NY | 6,305 | 118 | 3,076 | 23 | 23 | 0 | |
| Philadelphia, PA | 9 | 574 | 5 | 0 | |||
| Portland, OR | |||||||
| Raleigh, NC | 34 | 2 | 1 | 14 | 14 | 13 | |
| San Francisco, CA | 39 | ||||||
| Seattle, WA | 1,114 | 356 | 129 | 12 | 1 | ||
5.2 SELECTED SITES AND DATA COLLECTION METHODOLOGY
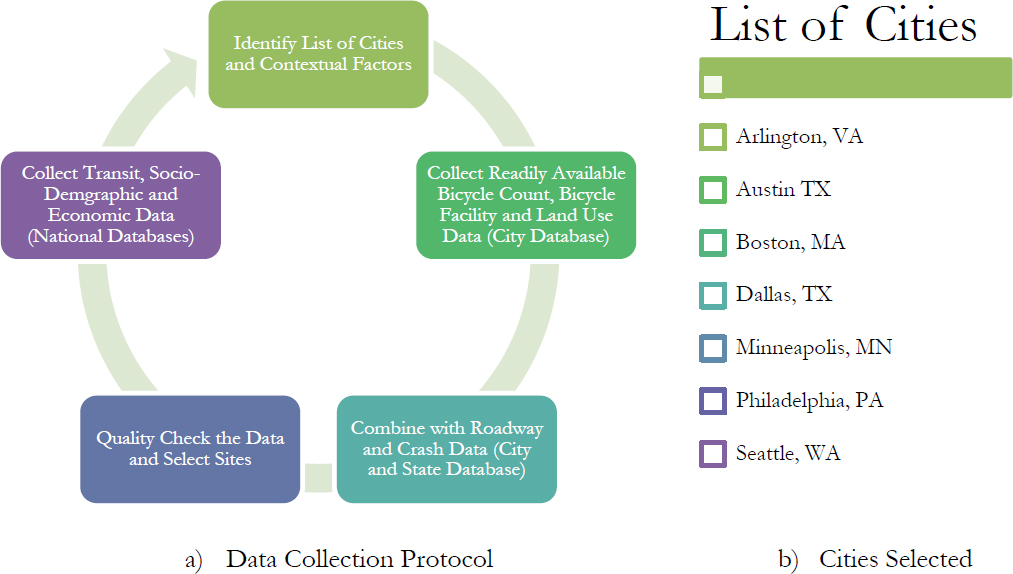
Figure 9 depicts the data collection protocol together with the list of cities included in the data collection based on the availability required data. As observed, data was collected from city, state, regional and national databases (Figure 9(a)). After the in-depth assessment of collected database and controlling for the inconsistencies in the data, on-street facilities from following cities were included in the database: Arlington VA, Austin TX, Boston MA, Dallas TX, Minneapolis MN, Philadelphia PA and Seattle WA (Figure 9(b)).
To prepare the database for safety analysis, the research team collected readily available count, roadway and bikeway facility design, land use and access, and crash data, and reached out to agencies that had agreed to provide the data for the purposes of this project. One major challenge faced by the research team was inconsistencies in the data. To address this challenge, we ensured that at least one researcher or graduate research assistant was involved in the data collection process
for a single category, thus minimizing the inconsistencies across the databases collected from diverse sources.
5.2.1 Bicycle Count Data Collection
After identifying the criteria and potential list of cities, we first identified the existing permanent and short-term bicycle count data in each cities’ open data portals. Most of the permanent counters were placed on shared use paths and therefore were not included in the database. The bicyclist counts along on-street bicycle facilities were collected mostly from short-duration counters; however, a few cities did have permanent count data. We then summarized all the counts to obtain the average daily bicycle (ADB) counts. The bicycle count data were available in hourly and daily units and were summarized accordingly to obtain the ADB. For the hourly counts, we first grouped the counts by day, summing up the count for each day using R software. We then summed these daily counts for the entire year (for permanent counts) or for the total number of days (for short-term counts). We then divided the resulting counts by the total number of days counted to obtain a daily average of counts. We finally divided this number by the number of sites per on-street bikeway type to estimate the average daily bicycles per facility type. Equations (11) and (12) describe the ADB computation process as follows:
| (11) |
| (12) |
After thorough consideration and based on the team’s subject matter expertise, we decided to use the ADB instead of estimating the AADB to minimize the uncertainty associated with the bicycle count data. To ensure this outcome, we removed all the imputed, scaled, or estimated counts from the databases and only used the raw bicycle counts.
5.2.2 Bikeway Data Collection
Simultaneously, we collected bikeway inventory data. Most of the selected cities had bikeway inventory data. However, there were inconsistencies regarding the name of the facility. Due to data collection methodologies, the available data from each city and state were not consistent. The research team spent extensive time validating and quality checking the bikeway data. We then imported the segments—named bike lane, shared lane, protected lane, separated bike lane, major/minor
separation, and contraflow bike lane into Google Earth Pro. The imported shapefiles were then: (1) cross-checked to confirm that they matched the existing facility’s name, and (2) assigned the correct facility name as defined in this project.
5.2.3 Roadway Data Collection
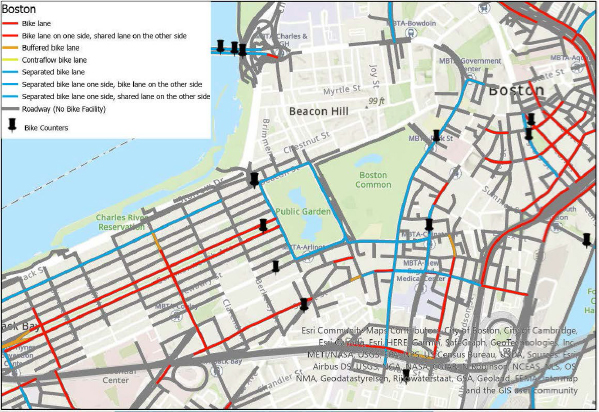
The resulting bikeway inventory data were then combined with the roadway inventory obtained from the city or state ODPs. When combining the two files, the research team also identified the surrounding streets to ensure that the database included control sites without bicycle facilities (these data were used when conducting the safety analyses). The final database used the roadway segments as the baseline to ensure that all the roadway elements were attributed to the correct segment. Figure 10 displays an example of this process for the City of Boston. As observed, the colored segments indicate different types of on-street bikeway facilities, while the gray contiguous and/or intersecting segments indicate roadway segments without a facility. The pins indicate the locations of bicycle counters found in readily available datasets.
5.2.4 Land Use Data Collection
Land use data are generally structured in two datasets: appraisal data and geographic data. Appraisal data contain real property value, land use, development status, and acreage information. Geographic data contain information that identifies the location of the properties. Geographic information system tools are required to join these datasets. For example, the City of Austin’s Land Use Inventory dataset provided merged spatial information taken from appraisal district parcel layers. This dataset classifies the land according to a coding system that reflects the primary
improvements made on each parcel. The City of Austin classified 15 different land uses (Table 30). The classifications may seem generic; other cities may have a different number of classifications. The research team followed the classifications provided by each city.
Table 30. Land Use Classifications (Austin, Texas).
| Code | Classification | Additional Information |
|---|---|---|
| 100 | Single family | One dwelling or duplex structures in detached buildings |
| 113 | Mobile homes | Buildings designed to be mobile |
| 200 | Multifamily | Triplexes and fourplexes, group housing, or retirement housing |
| 300 | Commercial | Wholesale and retail trade services |
| 330 | Mixed use | One building containing both commercial and residential uses |
| 400 | Office | Includes all kinds of office space, and other research and development services |
| 500 | Industrial | Basic, light, and custom industry and manufacturing |
| 600 | Civic | Public building or institution owned and operated by governmental agencies |
| 700 | Open space and parks | Open spaces and parks set aside for environmental protection, recreation, or drainage for common use |
| 800 | Transportation | Railroad stations and right-of-way, bus stations and other transportation facilities, parking facilities |
| 860 | Right-of-way | Public and private areas mainly containing roadways, railways, and miscellaneous infrastructure |
| 870 | Utilities | Electric, water, and wastewater utilities |
| 900 | Undeveloped | Parcels without structures or improvements, parcels that are predominantly used for either crops, livestock, animal husbandry, or other farmland |
| 940 | Water | Areas permanently submerged in water |
| 999 | Unknown | Parcels where the land use cannot be determined from available sources |
The resulting land use dataset allowed the research team to characterize parcels that intersect with on-street bicycle facilities. Using GIS tools, each bikeway segment was spatially joined with the land use dataset and was assigned a number reflecting the adjacent land use classification. Figure 11 demonstrates an example of how a bike lane segment was assigned to multiple land uses. A buffer for each bike lane segment (red rectangle) was created to capture the parcels. The parcels intersecting the buffer area were filtered and assigned to the bike lane. For example, the bike lane segment (yellow line) in Figure 11 serves 19 parcels (white polygons) in total. Using the classification codes defined by City of Austin (Table 30), the research team managed to identify all land uses. Some examples demonstrated in Figure 11 include civic, commercial, industrial, residential, and undeveloped parcels.

5.2.5 Parking Data Collection
Very few cities keep records of their parking information. The research team had to collect these data manually, which was a time-consuming effort. Therefore, to increase the efficiency and reduce the data collection time, the research team collected the parking data at the end after selecting the final list of cities. The parking data were collected by visualizing Google Street View (GSV) images and determining whether (1) the street had on-street parking and (2) whether the on-street parking was metered.
5.2.6 Transit Data Collection
The General Transit Feed Specification (GTFS) is one of the most popular nationwide data formats for transit service information. The main goal of creating the GTFS was to provide freely available transit trip planner applications to transit users. The GTFS provides fixed-routes schedule, route, bus stop, and trip data in a series of comma-delimited text files. All files are compressed into a ZIP file. Many transit agencies have developed and shared GTFS data openly with the public. Table 31 shows the contents of a GTFS ZIP file from the Capital Metropolitan Transportation Authority in Austin, Texas (https://openmobilitydata.org/p/capital-metro/24).
Table 31. General Transit Feed Specification Dataset Files.
| File name | |
| Agency | General information about a transit agency, including name, website, and contact information |
| Calendar | Service date information using a weekly schedule |
| Calendar dates | Exceptions for services defined in the calendar dataset |
| Fare attributes | Fare information with routes |
| Fare rules | Rules that apply to the fares |
| Feed info | Dataset publisher, feed address, version, and expiration of the feed |
| Frequencies | Trip frequencies for fixed-schedule services |
| Routes | Transit routes including name, identification, and color |
| Shapes | Route alignments with travel paths |
| Stop times | Times that transit arrives at and departs from stops for each trip |
| Stops | Exact locations of stops where transit picks up or drops off users |
| Transfers | Information of connections at transfer points between routes |
| Trips | Trip information for each route |
The stops.txt file provides information about the name, identification, and exact location of every bus stop. Using GIS tools, the research team managed to locate the bus stops on the bike lane segment layer. Therefore, each segment could be assigned the number of the bus stops it was overlapping with (Figure 12).

5.2.7 Crash Data Collection
Most city ODPs provided crash data that could be easily downloaded. For the purposes of this project, the research team used bicyclist crash data from 2017 to 2020.
5.2.8 Socioeconomic and Demographic Data Collection
Finally, the research team collected socioeconomic and demographic data from the ACS. To ensure that the socioeconomic and demographic characteristics of census tract and block group were consistent with the exposure and crash period, the research team used the ACS 5-Year Data (2016–2020). Various attributes of these data were released only recently, in March and April 2022.
5.3 DATA SUMMARY
5.3.1 Arlington County, Virginia
Table 32 lists the data attributes and corresponding sources that were explored by the research team for developing the safety database for Arlington County, Virginia. Data was collected from the Bike Arlington Dashboard, VDOT, and Arlington County Open GIS Data portal, as well as national sources.
Table 32. Data Sources (Arlington County, Virginia).
| Data Category | Attribute | Source | Link |
|---|---|---|---|
| Socioeconomic and demographic factors | Average age per capita | ACS 5-Year Data (2016–2020) | https://www.census.gov/programs-surveys/acs/news/data-releases/2020/release-schedule.html |
| Median household income |
5.3.1.1 Count Data
The data for Arlington County, Virginia, was obtained from the Bike Arlington Dashboard. Figure 13 depicts the dashboard overview.

The database dashboard is user-friendly, allowing for all counts to be separated between bicycles and pedestrians. It also has the capability to filter and aggregate the data by year. Count data were collected from each location for every year and were aggregated on an annual basis. Not all the counters collected data every year; some therefore returned zero trips when downloading the data. The counters were also identified as points in Google Maps, which was used to identify the latitude and longitude of each counter. The on-street bikeway type was identified manually using GSV images. Some locations had two counters based on direction, allowing for separate travel bound counts. These counts were then aggregated to obtain the total count per location. All the counters in the Arlington County database were placed on segments (i.e., midblocks).
The dashboard had data from 28 counter locations in the Arlington area to gauge and monitor usage and demand. The bicycle count data were available from 2016 to October 2021. Table 2 summarizes the count data from Arlington County, Virginia. Count data were collected from five to six conventional bike lanes, three buffered bike lanes, and two separated bike lanes depending upon the year in which it was collected. The SBL counts started in 2019. The separation element on these facilities was a flexpost (or plastic bollards). As observed, BLs use had the highest annual average count of around 91 per year. Among the other facilities, BBLs had the second highest annual average count of 87 per year, followed by SBLs with an average annual count of 48 per year. Regarding the annual trend, the number of bicyclists on BLs did not significantly change year to year. The counts on BBLs decreased from 141 in 2016 to 60 in 2021, while the counts on SBLs increased from 53 in 2019 to 57 in 2020 but decreased to 35 in 2021.
Table 33. Average Daily Bicycles per Facility Type (Arlington County, Virginia).
| Facility Type | Counters | Average Daily Bicycles per Year | |||||
|---|---|---|---|---|---|---|---|
| 2016 | 2017 | 2018 | 2019 | 2020 | 2021 | ||
| BL | 5 to 6 | 92 | 106 | 92 | 88 | 89 | 76 |
| BBL | 3 | 141 | 100 | 82 | 83 | 55 | 60 |
| SBL | 2 | N/A | N/A | N/A | 53 | 57 | 35 |
5.3.1.2 Bikeway, Roadway, and Land Use Data
Bikeway, roadway, and parking data were obtained from Arlington County Open GIS Data portal (https://gisdata-arlgis.opendata.arcgis.com/). Figure 14 depicts the combined bikeway, roadway, and land use data.
Table 34 summarizes the contextual data elements found in this database. The roadway data are based on OpenStreetMap (OSM) and uses some of the classifications that can be used to extract information about the number of lanes and median presence. Other factors such as the speed limit, parking and land use type were also found in the dataset. The AADT data were not found in the city shapefiles and were instead obtained from the state DOT’s crash database. For the sake of simplicity in the summary table, we have only included the qualitative data categories (e.g., divided/undivided median) and the sums or averages of numerical data (e.g., total number of commercial zones on a bike lane). The land use data combined different zoning types into single categories of residential, industrial, commercial, and mixed use. We could not obtain direct driveway data and instead proxied these data using land use variables. Finally, transit and socioeconomic data were obtained from
national databases. As discussed earlier, the research team obtained these data attributes only after selecting the final list of segments for safety analysis.
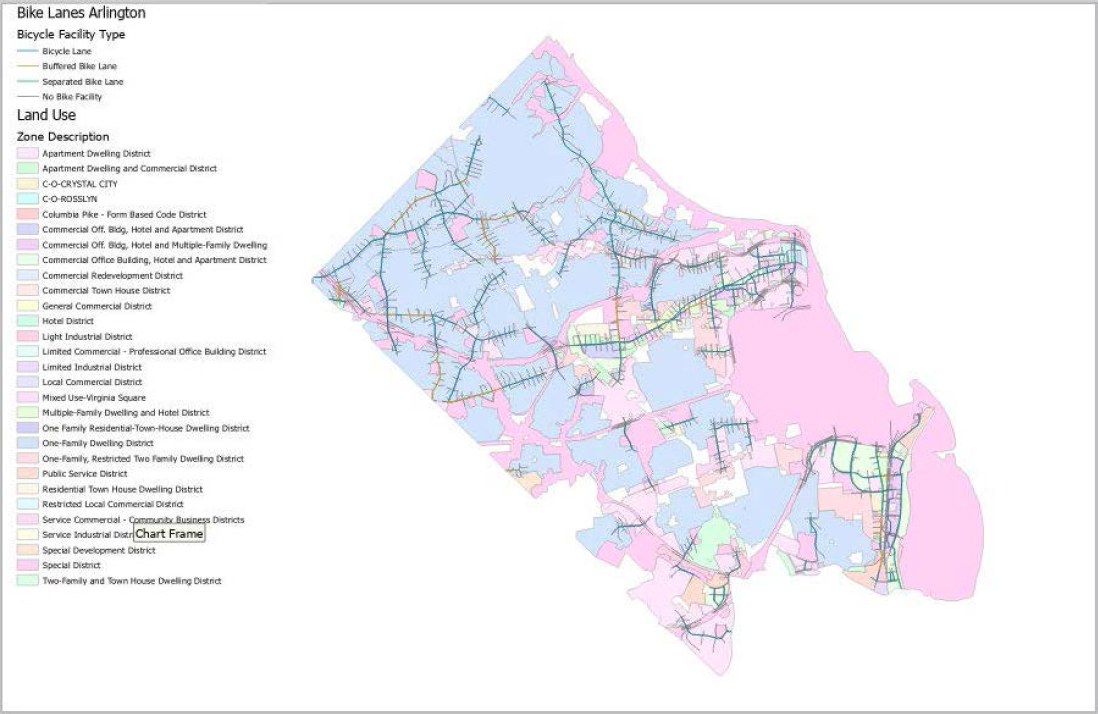
Table 34. Contextual Data Summary (Arlington County, Virginia).
| Data Category | Attribute Name and Measure | BL | BBL | SBL | |
|---|---|---|---|---|---|
| Bikeway | Number of segments with facility type | 189 | 32 | 21 | |
| Segment length | Total (mi) | 32.4 | 5.9 | 3.7 | |
| Bikeway network | (mi per sq mi) | Calculated using segment length | |||
| Roadway facility and exposure | Number of lanes | One-way (Both, in digitized direction [TF], against digitized direction [FT]) | |||
| Median | Divided (yes, no) | ||||
| Roadbed width | Average (ft) | 33 | 33 | 39 | |
| Speed limit | Average (mph) | 27 | 28 | 27 | |
| Land use and access | Industrial | Total | 59 | 23 | 7 |
| Residential (one, two and multifamily) | Total | 1,152 | 237 | 47 | |
| Commercial | Total | 474 | 29 | 98 | |
| Mixed use | Total | 7 | 0 | 0 | |
| Number of driveways | Total | Calculated using land use data | |||
| Parking | On-street | Yes, no | |||
| Metered | Yes, no | ||||
5.3.1.3 Crash Data
According to the Arlington County Crash Analysis portal, 23 fatal and serious injury bicyclist crashes occurred from 2017 to 2020 (Figure 15). However, this source does not provide the nonserious and noninjury crashes. The research team obtained full crash data from the VDOT (https://bit.ly/VDOTCrashTool_Public) after identifying the final list of segments for analysis. Table 35 provides descriptive statistics (mean, standard error [SE], and minimum [min] and maximum [max] values) for the data attributes included in the Arlington County, Virginia, database for BL, BBL, and SBL facilities, as well as locations where no bicycle lane (NBL) was present.
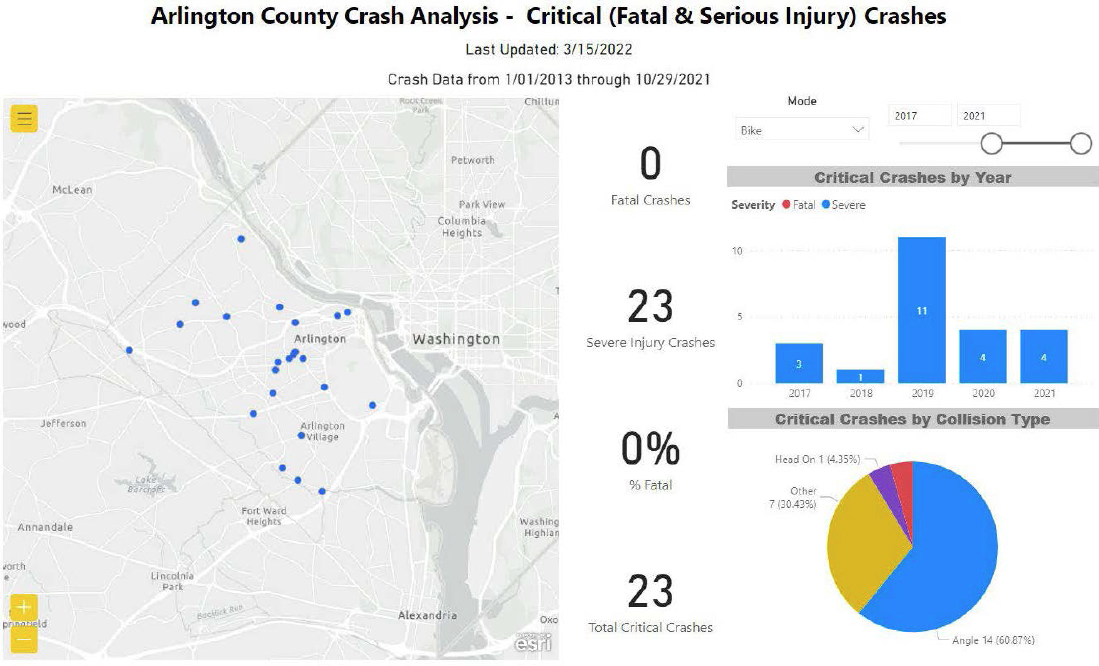
Table 35. Descriptive Statistics for Safety Data (Arlington County, Virginia).
| Contextual Factors | BL (n=1,483) | BBL (n=214) | SBL (n=112) | NBL (n=7,753) | ||||||||||||
|---|---|---|---|---|---|---|---|---|---|---|---|---|---|---|---|---|
| Mean | SE | Min | Max | Mean | SE | Min | Max | Mean | SE | Min | Max | Mean | SE | Min | Max | |
| KABC crashes (2017–2020) | 0.0 | 0.1 | 0.0 | 1.0 | 0.0 | 0.1 | 0.0 | 1.0 | 0.0 | 0.1 | 0.0 | 1.0 | 0.0 | 0.1 | 0.0 | 4.0 |
| PDO crashes (2017–2020) | 0.0 | 0.0 | 0.0 | 1.0 | 0.0 | 0.0 | 0.0 | 0.0 | 0.0 | 0.0 | 0.0 | 0.0 | 0.0 | 0.0 | 0.0 | 1.0 |
| Total crashes (2017–2020) | 0.0 | 0.1 | 0.0 | 1.0 | 0.0 | 0.1 | 0.0 | 1.0 | 0.0 | 0.1 | 0.0 | 1.0 | 0.0 | 0.1 | 0.0 | 4.0 |
| Civic | 0 | 1 | 0 | 2 | 0 | 0 | 0 | 2 | 0 | 0 | 0 | 1 | 0 | 1 | 0 | 3 |
| Commercial | 1 | 1 | 0 | 6 | 0 | 1 | 0 | 4 | 1 | 1 | 0 | 4 | 0 | 1 | 0 | 6 |
| Industrial | 0 | 0 | 0 | 2 | 0 | 0 | 0 | 2 | 0 | 0 | 0 | 1 | 0 | 0 | 0 | 3 |
| Residential | 1 | 1 | 0 | 5 | 1 | 1 | 0 | 4 | 1 | 1 | 0 | 4 | 1 | 1 | 0 | 6 |
| Speed (mph) | 27 | 5 | 3 | 65 | 28 | 5 | 25 | 55 | 26 | 4 | 15 | 45 | 28 | 8 | 3 | 65 |
| AADT | 6,099 | 12,898 | 0 | 193,000 | 5,476 | 10,989 | 0 | 99,000 | 6,948 | 10,522 | 0 | 54,000 | 11,515 | 31,134 | 0 | 193,000 |
| ADB (2017–2020) | 0 | 6 | 0 | 154 | 0 | 2 | 0 | 30 | 10 | 81 | 0 | 816 | 0 | 0 | 0 | 0 |
| Length (ft) | 283 | 199 | 17 | 1,486 | 275 | 180 | 18 | 1,129 | 300 | 178 | 25 | 818 | 337 | 272 | 10 | 4,210 |
| Width (ft) | 34 | 11 | 0 | 75 | 34 | 11 | 16 | 68 | 39 | 18 | 0 | 75 | 29 | 11 | 0 | 92 |
| Number of bus stops | 0 | 1 | 0 | 3 | 0 | 0 | 0 | 2 | 0 | 0 | 0 | 2 | 0 | 0 | 0 | 4 |
| Average daily transit | 0 | 1 | 0 | 8 | 0 | 1 | 0 | 4 | 0 | 1 | 0 | 6 | 0 | 1 | 0 | 9 |
| Population density | 0% | 1% | 0% | 6% | 0% | 0% | 0% | 2% | 1% | 1% | 0% | 5% | 0% | 0% | 0% | 7% |
| Percentage White | 73% | 19% | 0% | 97% | 78% | 13% | 28% | 97% | 65% | 18% | 0% | 90% | 64% | 30% | 0% | 100% |
| Percentage Black | 6% | 9% | 0% | 57% | 4% | 8% | 0% | 57% | 13% | 12% | 0% | 57% | 6% | 10% | 0% | 57% |
| Percentage Hispanic | 11% | 10% | 0% | 76% | 8% | 5% | 0% | 26% | 8% | 7% | 0% | 40% | 12% | 12% | 0% | 76% |
| Median income (U.S. dollars) | 153,895 | 68,802 | 0 | 250,000 | 182,951 | 54,569 | 0 | 250,000 | 95,540 | 57,142 | 0 | 221,905 | 133,353 | 79,533 | 0 | 250,000 |
5.3.2 Austin and Dallas-Fort Worth, Texas
The data for the two Texas cities (Austin and Dallas-Fort Worth [DFW]) was obtained from the finalized TxDOT Project 0-7043. The data included bicycle counts, average daily bicycle counts, estimated exposure (e.g., AADB), roadway and bikeway information, and crash data. The research team added land use and parking data to complete the database for the current project (the data collection process for this was presented in Chapter 4). More information about the data collection process can be found in the TxDOT Project 0-7043 final report (https://rip.trb.org/view/1716486).
5.3.2.1 Count Data
Austin count data were collected from 20 on-street bike facilities from December 2020 to February 2021, while DFW count data were collected from 10 on-street facilities from April to May 2021. Figure 16 depicts the counter locations along with the count summaries.
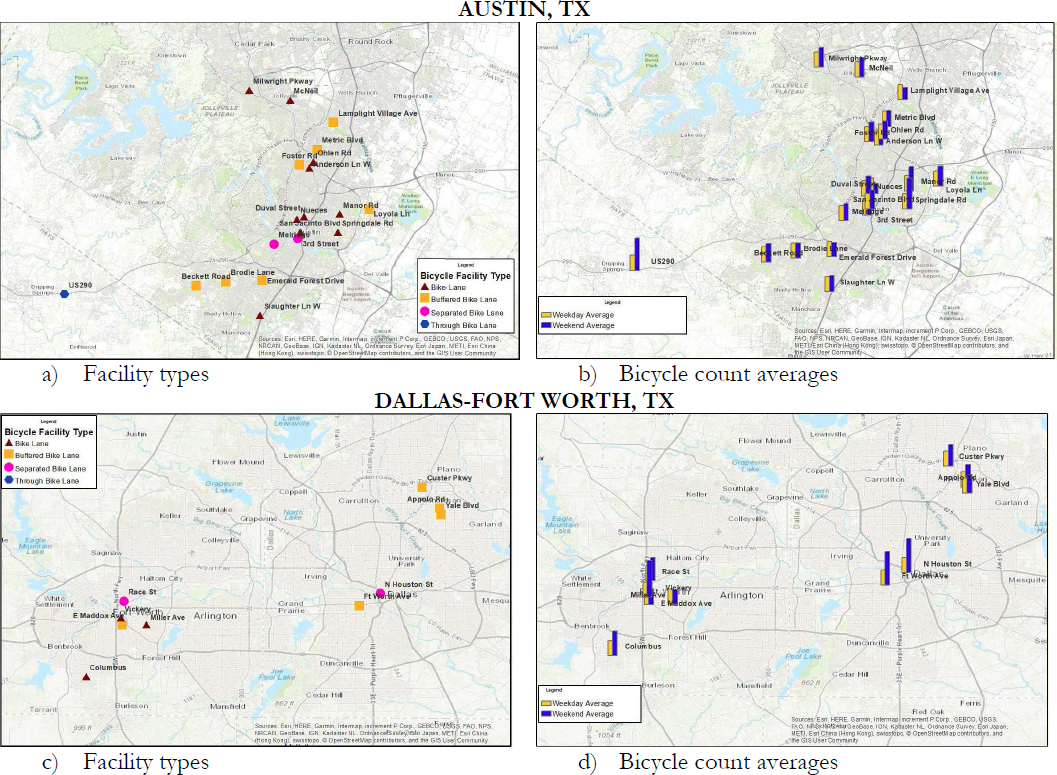
Table 36 presents the ADB summary for the two cities. As observed, during the data collection period 30, 24, and 124 average daily bicycles were on the bicycle lanes, buffered bicycle lanes and separated bicycle lanes, respectively, in Austin. The average bicycle counts in the DFW area were 100, 51, and 78 for bicycle lanes, buffered bicycle lanes and separated bicycle lanes, respectively.
Table 36. Average Daily Bicycles per Facility Type (Austin and Dallas-Fort Worth, Texas).
| Bikeway Type | Austin | Dallas-Fort Worth | ||||||
|---|---|---|---|---|---|---|---|---|
| Number of Sites | Weekday ADB | Weekend ADB | Total ADB | Number of Sites | Weekday ADB | Weekend ADB | Total ADB | |
| BL | 10 | 28 | 32 | 30 | 3 | 63 | 137 | 100 |
| BBL | 7 | 26 | 30 | 28 | 5 | 41 | 60 | 51 |
| SBL | 2 | 112 | 137 | 124 | 2 | 51 | 104 | 78 |
5.3.2.2 Bikeway, Roadway, and Crash Data
The data for the bikeway facilities was obtained from local agencies in Texas. After an intensive validation process, the research team compiled the bikeway inventory dataset using a consistent language. After validating the bikeway types, the research team conflated the resulting shapefile with roadway and crash data obtained from TxDOT’s roadway inventory and Crash Record Information System (CRIS) databases. The final safety database was publicly available at https://storymaps.arcgis.com/stories/628ba9f7dc1e4f18b643204b13385115. Figure 17 depicts the bikeway and crash heatmap that was visualized using the website.
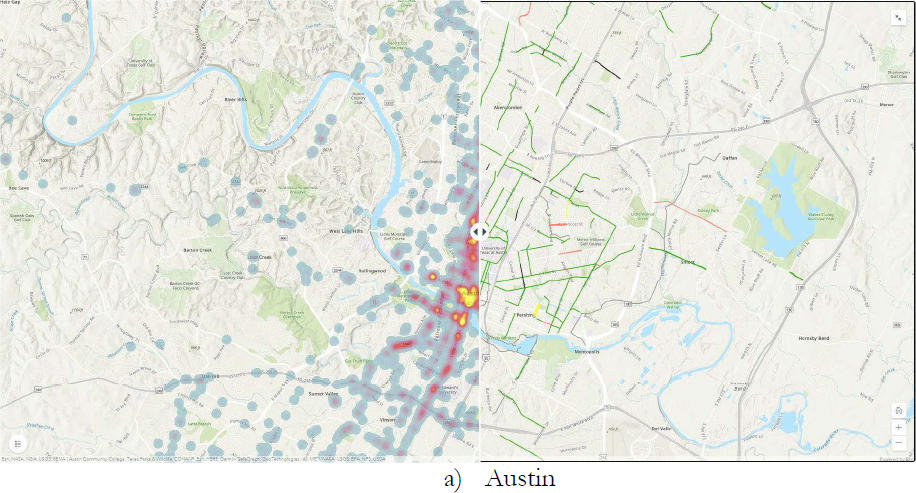

The summary of contextual and crash data is presented in Table 37, while the descriptive statistics are presented in Table 38 and Table 39. As observed, there were 339 bike lanes, 27 buffered bike lanes, and 9 separated bike lanes in Austin, with total lengths of 153, 8, and 3 miles, respectively. From 2017 and 2020, there were 174, 9, and 26 bicyclist crashes on these bike lanes, buffered bike lanes, and separated bike lanes, respectively. The Dallas-Fort Worth area had 105 bike lane segments with a total length of 83 miles, 59 buffered bike lanes with a total length of 41 miles, and 3 separated bike lanes with a total length of 2 miles. These facilities observed a total of 25 bicyclist crashes, 23 of which were fatal and injury crashes.
Table 37. Contextual and Crash Data Summary (Austin and Dallas-Fort Worth, Texas).
| Data Category | Attribute Name and Measure | Austin | Dallas-Fort Worth | |||||
|---|---|---|---|---|---|---|---|---|
| BL | BBL | SBL | BL | BBL | SBL | |||
| Bikeway | Number of segments with facility type | 339 | 27 | 9 | 105 | 59 | 3 | |
| Segment length | Total (mi) | 153 | 8 | 3 | 83 | 41 | 2 | |
| Roadway facility and exposure | Number of lanes | Average | 3 | 3 | 2 | 3 | 3 | 3 |
| Lane width | Average (ft) | 13 | 11 | 15 | 12 | 13 | 10 | |
| Median width | Average (ft) | 2 | 5 | 0 | 0 | 1 | 0 | |
| Shoulder width | Average (ft) | 0.3 | 0 | 0 | 0 | 0 | 0 | |
| AADT | Average (2017–2020) | 13,505 | 14,415 | 9,327 | 8,229 | 5,821 | 2,222 | |
| Speed limit | Average (mph) | 33 | 32 | 31 | 33 | 30 | 32 | |
| Bicyclist crashes | KABC (fatal and injury) | Total (2017–2020) | 170 | 9 | 26 | 16 | 7 | 0 |
| Total | 174 | 9 | 26 | 18 | 7 | 0 | ||
Table 38. Descriptive Statistics for Safety Data (Austin, Texas).
| Contextual Factors | BL (n=315) | BBL (n=26) | SBL (n=9) | NBL (n=1,020) | ||||||||||||
|---|---|---|---|---|---|---|---|---|---|---|---|---|---|---|---|---|
| Mean | SE | Min | Max | Mean | SE | Min | Max | Mean | SE | Min | Max | Mean | SE | Min | Max | |
| Population density | 0% | 0% | 0% | 0% | 0% | 0% | 2% | 1% | 0% | 0% | 0% | 1% | 0% | 0% | 0% | 1% |
| Percentage White | 72% | 17% | 30% | 73% | 17% | 0% | 100% | 100% | 63% | 18% | 35% | 100% | 72% | 16% | 44% | 92% |
| Percentage Black | 9% | 11% | 0% | 8% | 10% | 0% | 50% | 50% | 13% | 11% | 0% | 33% | 4% | 6% | 0% | 20% |
| Percentage Hispanic | 30% | 21% | 0% | 29% | 21% | 0% | 92% | 86% | 29% | 21% | 5% | 83% | 26% | 22% | 2% | 81% |
| Median income (U.S. dollars) | 71,519 | 40,062 | 0 | 72,136 | 43,552 | 0 | 231,528 | 228,125 | 64,401 | 39,195 | 0 | 130,565 | 50,721 | 55,496 | 0 | 152,054 |
| KABC crashes (2017–2020) | 0.0 | 0.1 | 0.0 | 1.0 | 0.0 | 0.1 | 0.0 | 1.0 | 0.0 | 0.1 | 0.0 | 1.0 | 0.0 | 0.1 | 0.0 | 4.0 |
| PDO crashes (2017–2020) | 0.0 | 0.0 | 0.0 | 1.0 | 0.0 | 0.0 | 0.0 | 0.0 | 0.0 | 0.0 | 0.0 | 0.0 | 0.0 | 0.0 | 0.0 | 1.0 |
| Total crashes (2017–2020) | 0.0 | 0.1 | 0.0 | 1.0 | 0.0 | 0.1 | 0.0 | 1.0 | 0.0 | 0.1 | 0.0 | 1.0 | 0.0 | 0.1 | 0.0 | 4.0 |
| Civic | 3 | 3 | 0 | 2 | 3 | 0 | 49 | 21 | 3 | 4 | 0 | 14 | 3 | 3 | 0 | 8 |
| Commercial | 6 | 10 | 0 | 5 | 8 | 0 | 96 | 70 | 2 | 2 | 0 | 9 | 7 | 5 | 0 | 18 |
| Industrial | 1 | 3 | 0 | 1 | 2 | 0 | 37 | 40 | 1 | 3 | 0 | 10 | 1 | 2 | 0 | 7 |
| Residential | 19 | 25 | 0 | 23 | 32 | 0 | 210 | 156 | 15 | 24 | 0 | 106 | 23 | 23 | 0 | 63 |
| Undeveloped | 1 | 3 | 0 | 1 | 7 | 0 | 162 | 26 | 1 | 2 | 0 | 7 | 1 | 1 | 0 | 3 |
| Speed limit | 32 | 6 | 25 | 35 | 10 | 20 | 75 | 60 | 32 | 5 | 30 | 45 | 31 | 2 | 30 | 35 |
| ADB (2017–2020) | 32 | 51 | 11 | 4 | 11 | 0 | 136 | 532 | 24 | 62 | 7 | 324 | 76 | 58 | 19 | 207 |
| AADT | 12,602 | 10,752 | 240 | 16,293 | 26,771 | 91 | 153,681 | 69,119 | 13,982 | 9,034 | 2,591 | 33,070 | 9,327 | 9,815 | 413 | 26,120 |
| Segment length | 0.4 | 0.4 | 0.0 | 0.4 | 0.4 | 0.0 | 2.9 | 2.6 | 0.3 | 0.3 | 0.0 | 1.5 | 0.4 | 0.3 | 0.2 | 0.9 |
| Median width | 1.6 | 6.4 | 0.0 | 4.3 | 20.6 | 0.0 | 325.0 | 48.0 | 5.7 | 9.5 | 0.0 | 35.0 | 0.0 | 0.0 | 0.0 | 0.0 |
| Number of lanes | 3 | 1 | 2 | 3 | 1 | 1 | 9 | 6 | 3 | 1 | 2 | 4 | 2 | 0 | 2 | 2 |
| Surface width | 40.2 | 15.1 | 20.0 | 35.6 | 19.9 | 0.0 | 108.0 | 90.0 | 42.4 | 14.1 | 20.0 | 58.0 | 29.8 | 9.8 | 20.0 | 40.0 |
| Lane width | 13.1 | 4.4 | 4.0 | 11.4 | 3.2 | 0.0 | 33.0 | 30.0 | 11.2 | 3.2 | 10.0 | 22.0 | 14.9 | 4.9 | 10.0 | 20.0 |
| Number of bus stops | 1 | 2 | 0 | 1 | 2 | 0 | 15 | 11 | 1 | 1 | 0 | 4 | 1 | 1 | 0 | 3 |
Table 39. Descriptive Statistics for Safety Data (Dallas-Fort Worth, Texas).
| Contextual Factors | BL (n=22) | BBL (n=30) | NBL (n=1,587) | |||||||||
|---|---|---|---|---|---|---|---|---|---|---|---|---|
| Mean | SE | Min | Max | Mean | SE | Min | Max | Mean | SE | Min | Max | |
| Population density | 0% | 0% | 0% | 1% | 0% | 0% | 0% | 1% | 0% | 0% | 0% | 2% |
| Percentage White | 68% | 20% | 29% | 93% | 69% | 16% | 35% | 97% | 59% | 23% | 0% | 100% |
| Percentage Black | 13% | 14% | 0% | 45% | 11% | 12% | 0% | 51% | 21% | 23% | 0% | 100% |
| Percentage Hispanic | 29% | 26% | 4% | 91% | 14% | 11% | 0% | 55% | 39% | 28% | 0% | 100% |
| Median income (U.S. dollars) | 94,838 | 37,942 | 45,036 | 200,848 | 88,117 | 33,538 | 6,935 | 191,563 | 70,088 | 42,498 | 0 | 250,000 |
| KABC crashes (2017–2020) | 0.2 | 0.5 | 0.0 | 2.0 | 0.2 | 0.5 | 0.0 | 2.0 | 0.5 | 0.7 | 0.0 | 10.0 |
| PDO crashes (2017–2020) | 0.0 | 0.0 | 0.0 | 0.0 | 0.0 | 0.0 | 0.0 | 0.0 | 0.0 | 0.2 | 0.0 | 1.0 |
| Total crashes (2017–2020) | 0.2 | 0.5 | 0.0 | 2.0 | 0.2 | 0.5 | 0.0 | 2.0 | 0.5 | 0.7 | 0.0 | 10.0 |
| Civic | 1 | 1 | 0 | 4 | 1 | 1 | 0 | 4 | 1 | 2 | 0 | 15 |
| Commercial | 2 | 4 | 0 | 19 | 5 | 10 | 0 | 39 | 4 | 7 | 0 | 58 |
| Industrial | 0 | 0 | 0 | 0 | 0 | 0 | 0 | 1 | 0 | 0 | 0 | 4 |
| Residential | 22 | 28 | 0 | 73 | 23 | 37 | 0 | 139 | 27 | 39 | 0 | 349 |
| Undeveloped | 2 | 3 | 0 | 12 | 3 | 4 | 0 | 18 | 3 | 6 | 0 | 61 |
| Speed limit | 32 | 5 | 30 | 45 | 31 | 2 | 30 | 40 | 33 | 7 | 20 | 70 |
| ADB (2017–2020) | 20 | 18 | 11 | 98 | 9 | 2 | 7 | 15 | 1 | 11 | 0 | 358 |
| AADT | 6,348 | 5,021 | 357 | 17,501 | 6,696 | 6,321 | 201 | 24,474 | 10,088 | 22,026 | 48 | 234,371 |
| Segment length | 0.8 | 0.5 | 0.0 | 1.8 | 0.7 | 0.5 | 0.0 | 2.0 | 0.7 | 0.6 | 0.0 | 5.3 |
| Median width | 0.0 | 0.0 | 0.0 | 0.0 | 0.7 | 2.8 | 0.0 | 12.0 | 2.3 | 20.7 | 0.0 | 770.0 |
| Number of lanes | 3.2 | 1.5 | 2.0 | 6.0 | 3.4 | 1.8 | 2.0 | 6.0 | 3.0 | 1.6 | 1.0 | 8.0 |
| Surface width | 42.9 | 17.0 | 20.0 | 75.0 | 43.9 | 18.8 | 20.0 | 80.0 | 33.3 | 18.3 | 14.0 | 96.0 |
| Lane width | 14.0 | 5.1 | 10.0 | 22.0 | 13.9 | 5.2 | 9.0 | 22.0 | 10.8 | 2.0 | 4.0 | 33.0 |
| Number of bus stops | 1 | 3 | 0 | 14 | 3 | 5 | 0 | 17 | 2 | 5 | 0 | 36 |
| Average daily transit | 2 | 4 | 0 | 14 | 6 | 10 | 0 | 33 | 5 | 12 | 0 | 107 |
5.3.3 Boston, Massachusetts
Table 40 shows the list of data attributes and corresponding sources that were explored by the research team for developing the safety database for Boston, Massachusetts. Data for Boston was obtained from the Boston Region MPO, MassDOT, and Boston Maps Open Data, as well as national sources.
Table 40. Data Sources (Boston, Massachusetts).
5.3.3.1 Count Data
The bicycle count data for Boston, Massachusetts was obtained from the Boston Region MPO database. Figure 18 depicts the dashboard overview. The dashboard contains data from 1975 to 2019 and is user-friendly, allowing users to simply view the municipality, date, and count type of interest (bicycle and pedestrians). Additionally, the dashboard is linked with GSV, which allows users to identify the facility type. Once downloaded, the data even allows the user to get a better understanding of the count location by giving the segment or intersection type where the count was conducted along with the dates.

The data collection process for Boston took longer than the process for other sites because all data files first had to be manually located and downloaded for 2009–2017. Once downloaded, all counts had to be filtered for only bicyclists and facility types of interest. Next, all latitudes and longitudes were manually found based on points on GSV. Finally, using this information, the on-street bikeway types were identified. Table 41 summarizes the count data from Boston. Count data were collected from 40 different bike lanes, 4 buffered bike lanes, and 12 different separated bike lanes. The separated bike lanes earliest counts were in 2010, and all locations showed some variation in separation elements (e.g., flexposts, curbs, and cones). The highest usage was observed on bike lanes in 2010, with a peak daily average of 413 bicycles. The next highest usages were observed on separated bike lanes in 2016, with a peak of 347 average daily bicycles, and on buffer bike lanes in 2016, with 209 average daily bicyclists. One thing to note about these averages—the buffered bike lane was only counted for two years (2016 and 2019), producing the smallest sample size and average counts. Bike lanes were counted for three years, while separated bike lanes were counted for five years.
Table 41. Average Daily Count per Facility Type (Boston, Massachusetts).
| Facility Type | Counters | Days and Counts | Average Daily Bicycles per Year | ||||
|---|---|---|---|---|---|---|---|
| 2010 | 2011 | 2016 | 2017 | 2019 | |||
| BL | 40 | Count | 313 | 413 | N/A | N/A | 48 |
| No. of days | 6 | 1 | N/A | N/A | 2 | ||
| BBL | 4 | Count | 209 | N/A | N/A | N/A | 30 |
| No. of days | 3 | N/A | N/A | N/A | 1 | ||
| SBL | 12 | Count | 278 | 156 | 264 | 347 | 71 |
| No. of days | 4 | 1 | 1 | 4 | 1 | ||
5.3.3.2 Bikeway, Roadway, and Land Use Data
Bikeway and roadway data were obtained from the City of Boston’s ODP (https://bostonopendata-boston.opendata.arcgis.com/). Figure 19 depicts the combined bikeway, roadway, and land use data for Boston. Table 41 summarizes this database.
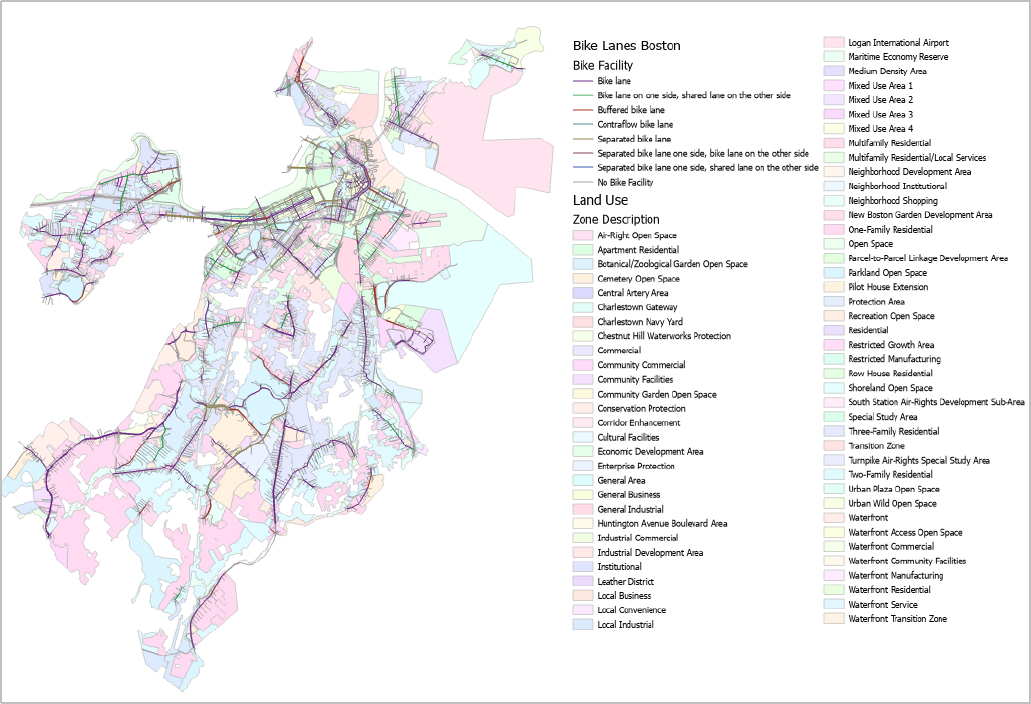
Table 42. Contextual Data Summary (Boston, Massachusetts).
| Data Category | Attribute Nam | and Measure | BL | BBL | SBL | CBL |
|---|---|---|---|---|---|---|
| Bikeway | Number of segments with facility type | 3,572 | 442 | 37 | 770 | |
| Segment length | Total (mi) | 66.0 | 11.5 | 0.9 | 13.8 | |
| Bikeway network | (mi per sq mi) | Calculated using segment length | ||||
| Roadway facility and exposure | Number of lanes | 1-4 | 1-4 | 1-4 | 2-3 | |
| Median width | Average (ft) | 5 | 10 | 0 | 0 | |
| Shoulder width (right and left) | Average (ft) | 0.24 | 0.47 | 0.22 | 0 | |
| Surface width | Average (ft) | 28 | 30 | 28 | 31 | |
| Curb width | Average (ft) | 2.6 | 2.5 | 2.5 | 2.8 | |
| Speed limit | Average (mph) | 35 | 34 | 28 | 56 | |
| AADT | Average (vehicles) | 14,425 | 21,106 | 20,060 | 6,409 | |
| Land use and access | Industrial | Total | 221 | 260 | 73 | 75 |
| Residential | Total | 1,547 | 2,977 | 307 | 397 | |
| Commercial | Total | 182 | 297 | 13 | 84 | |
| Mixed use | Total | 743 | 993 | 157 | 446 | |
| Number of driveways | Total | Calculated using land use data | ||||
| Parking | On-street | Yes, no | ||||
| Metered | Yes, no | |||||
Boston provided one of the most complete databases available to the research team, which also included data for contraflow bike lanes. The database included information about the bikeway type and length (miles), which was used to estimate the bikeway network density. Overall, there were 3,572 bike lanes, 442 buffered bike lanes, 37 separated bike lanes, and 770 contraflow segments with total lengths of 66, 11.5, 0.9, and 13.8 miles, respectively. Because most of the roadway segments were along urban midblocks (between intersections), the overall mileage of a facility in the network was relatively short. Roadway data included the number of lanes, median type and width, shoulder type and width, curb width, and surface width. Additionally, the roadway inventory included speed limit and AADT information. The complementary zoning shapefiles were summarized to extract the land use type information (i.e., number of commercial, industrial, residential, and mixed-use zones along a bike facility). However, as expected, the data did not include driveway data. To estimate the driveways and driveway density, the research team used the land use variables. Finally, the parking data showed if there was parking along a segment and whether the parking was metered.
5.3.3.3 Crash Data
For visualizing crash data, MassDOT developed an interactive data dashboard (https://apps.impact.dot.state.ma.us/cdp/home). The data can be queried and extracted by municipality and date range in several formats. Figure 20 depicts the queried crash data from 2017 to 2021. As observed, there were 389 bicyclist crashes in Boston during this period. The research team combined the extracted crash shapefile with the selected locations and aggregated the bicyclist crashes per severity and per segment for subsequent safety analysis. Descriptive statistics for all data attributes are presented in Table 43.

Table 43. Descriptive Statistics for Safety Data (Boston, Massachusetts).
| Contextual Factors | BL (n=330) | BBL (n=40) | SBL (n=96) | NBL (n=6,153) | ||||||||||||
|---|---|---|---|---|---|---|---|---|---|---|---|---|---|---|---|---|
| Mean | SE | Min | Max | Mean | SE | Min | Max | Mean | SE | Min | Max | Mean | SE | Min | Max | |
| Population density | 1% | 1% | 0% | 4% | 0% | 0% | 0% | 2% | 1% | 1% | 0% | 3% | 1% | 1% | 0% | 7% |
| Percentage White | 53% | 30% | 0% | 100% | 43% | 36% | 0% | 83% | 53% | 28% | 0% | 94% | 53% | 31% | 0% | 100% |
| Percentage Black | 23% | 29% | 0% | 96% | 9% | 15% | 0% | 60% | 14% | 17% | 0% | 72% | 21% | 26% | 0% | 100% |
| Percentage Hispanic | 13% | 15% | 0% | 82% | 8% | 10% | 0% | 32% | 11% | 10% | 0% | 40% | 15% | 17% | 0% | 86% |
| Median income (U.S. dollars) | 76,772 | 70,005 | 0 | 250,000 | 58,829 | 81,812 | 0 | 250,000 | 65,891 | 65,656 | 0 | 250,000 | 75,712 | 58,812 | 0 | 250,000 |
| KABC crashes (2017–2020) | 0.0 | 0.1 | 0.0 | 1.0 | 0.0 | 0.0 | 0.0 | 0.0 | 0.0 | 0.0 | 0.0 | 0.0 | 0.0 | 0.1 | 0.0 | 2.0 |
| PDO crashes (2017–2020) | 0.0 | 0.1 | 0.0 | 1.0 | 0.1 | 0.2 | 0.0 | 1.0 | 0.0 | 0.0 | 0.0 | 0.0 | 0.0 | 0.0 | 0.0 | 1.0 |
| Total crashes (2017–2020) | 0.0 | 0.1 | 0.0 | 1.0 | 0.1 | 0.2 | 0.0 | 1.0 | 0.0 | 0.0 | 0.0 | 0.0 | 0.0 | 0.1 | 0.0 | 2.0 |
| Civic | 1 | 1 | 0 | 5 | 1 | 1 | 0 | 6 | 1 | 1 | 0 | 5 | 0 | 1 | 0 | 5 |
| Commercial | 2 | 3 | 0 | 21 | 1 | 2 | 0 | 7 | 2 | 2 | 0 | 7 | 1 | 1 | 0 | 11 |
| Industrial | 0 | 0 | 0 | 3 | 0 | 1 | 0 | 4 | 0 | 1 | 0 | 3 | 0 | 0 | 0 | 5 |
| Residential | 1 | 1 | 0 | 5 | 1 | 1 | 0 | 5 | 1 | 1 | 0 | 4 | 1 | 1 | 0 | 7 |
| AADT | 18,668 | 31,055 | 0 | 224,366 | 20,122 | 28,362 | 0 | 136,467 | 17,680 | 25,204 | 0 | 112,869 | 9,686 | 20,199 | 0 | 228,709 |
| ADB (2017–2020) | 0 | 1 | 0 | 17 | 0 | 1 | 0 | 8 | 2 | 18 | 0 | 173 | 0 | 0 | 0 | 0 |
| Number of lanes | 2 | 1 | 0 | 4 | 1 | 1 | 0 | 4 | 2 | 1 | 0 | 4 | 2 | 1 | 0 | 5 |
| Surface width (ft) | 21.7 | 15.2 | 0.0 | 80.0 | 18.5 | 16.6 | 0.0 | 65.0 | 20.1 | 14.2 | 0.0 | 55.0 | 24.5 | 14.0 | 0.0 | 80.0 |
| Left Shoulder width (ft) | 0.1 | 0.3 | 0.0 | 4.0 | 0.1 | 0.2 | 0.0 | 1.0 | 0.0 | 0.0 | 0.0 | 0.0 | 0.0 | 0.2 | 0.0 | 8.0 |
| Right shoulder width (ft) | 0.3 | 1.0 | 0.0 | 8.0 | 0.5 | 1.8 | 0.0 | 8.0 | 0.0 | 0.2 | 0.0 | 2.0 | 0.2 | 1.0 | 0.0 | 25.0 |
| Median width (ft) | 7.9 | 19.2 | 0.0 | 240.0 | 13.3 | 41.7 | 0.0 | 240.0 | 3.7 | 7.2 | 0.0 | 33.0 | 1.9 | 11.9 | 0.0 | 240.0 |
| Length (ml) | 0.2 | 0.2 | 0.0 | 2.5 | 0.2 | 0.2 | 0.0 | 1.2 | 0.1 | 0.2 | 0.0 | 1.4 | 0.1 | 0.1 | 0.0 | 2.8 |
| Number of bus stops | 1 | 1 | 0 | 12 | 0 | 0 | 0 | 1 | 1 | 1 | 0 | 5 | 0 | 1 | 0 | 21 |
| Average daily transit | 4 | 10 | 0 | 96 | 1 | 2 | 0 | 7 | 2 | 6 | 0 | 38 | 1 | 4 | 0 | 161 |
5.3.4 Minneapolis, Minnesota
Table 44 lists the data attributes and corresponding sources that were explored by the research team for developing the safety database for Minneapolis, Minnesota. Data were collected from the Minneapolis Public Works Department, Minnesota Geospatial Commons, and Open Minneapolis data portal, as well as national sources.
Table 44. Data Sources (Minneapolis, Minnesota).
5.3.4.1 Count Data
The bicycle count data for Minneapolis, Minnesota, was obtained from Minneapolis Public Works Department. Figure 21 depicts the dashboard, which includes data from 2007 to 2020. Pedestrian and bicyclist counts were conducted each year at various locations including bicycle paths, pedestrian shortcuts, local streets, downtown streets, on bridges, in parks, near schools, and at transit stations.

Table 45 summarizes bicycle counts from 2017 to 2020. For the purposes of this project, we removed the imputed counts to compute the ADB. The ADB was calculated by summing up the entire year and then dividing this sum by the number of days counted. The highest ADB of 730 was observed on separated bike lanes in 2017, followed by 278 ADB on buffered bike lanes in 2018 and 65 ADB on bicycle lanes in 2017. Note that not every year was counted for a full 365 days; some averages were based on a fewer number of days.
Table 45. Average Daily Bicycles per Facility Type (Minneapolis, Minnesota).
| Facility Type | Counters | Average Daily Bicycles | |||
|---|---|---|---|---|---|
| 2017 | 2018 | 2019 | 2020 | ||
| BL | 1 | 65 | 56 | 58 | 45 |
| BBL | 2 | 257 | 278 | 246 | 145 |
| SBL | 1 | 730 | 704 | 707 | 631 |
5.3.4.2 Bikeway, Roadway, and Land Use Data
Bikeway, roadway, and parking data were obtained from the Minnesota Geospatial Commons, while land use data were obtained from the City of Minneapolis. The regional bikeway system inventory in the state uses different definitions to label the bicycle lane types. Among these definitions, the following three types matched the bikeway types selected in this study:
- Category 3-striped bicycle lanes
- Category 4-on-street protected bicycle facilities (below curb)
- Category 5-adjacent street protected bicycle facilities (above curb)
The roadway design (e.g., number and width of through lanes, number and type of left/right turn lanes, shoulder type and width, curb presence and type, parking on the side of the street, etc.), speed limit, and AADT data were available in multiple shapefiles. The research team combined the shapefiles using ArcGIS Spatial Join. Figure 22 depicts the map of the combined bikeway, roadway, and land use data. Table 45 presents the data summary of combined files. Overall, there were 573 bike lanes, 100 buffered bike lanes, and 18 separated bike lanes, with total lengths of 86.9, 19.3, and 4 miles, respectively. The table also presents the summary of other roadway design, land use and access, and exposure variables obtained from the aforementioned sources.
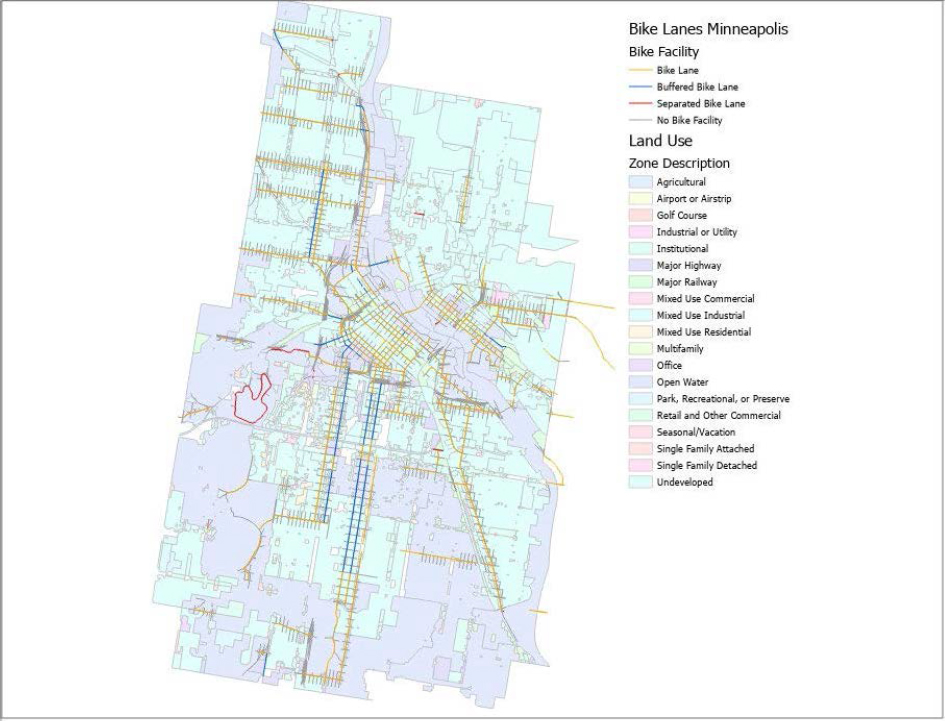
Table 46. Contextual Data Summary (Minneapolis, Minnesota).
| Data Category | Attribute Name and Measure | BL | BBL | SBL | |
|---|---|---|---|---|---|
| Bikeway | Number of segments with facility type | 573 | 100 | 18 | |
| Segment length | Total (mi) | 86.9 | 19.3 | 4 | |
| Bikeway network | (mi per sq mi) | Calculated using segment length | |||
| Roadway facility and exposure | Number of through lanes | 1-6 | 1-4 | 1-2 | |
| Left/right turn lanes | Exclusive, permitted | ||||
| Through lane width (ft, does not account for turn lanes) | ~18 | ~20 | ~13 | ||
| Shoulder type | Paved, unpaved | ||||
| Shoulder width (ft) | ~0-6 | ~0-6 | ~0-6 | ||
| Curb presence | Left, right, both | ||||
| Curb type | Barrier, unknown | ||||
| Speed limit | Average (mph) | 35 | 34 | 28 | |
| AADT | Average (vehicles) | 14,425 | 21,106 | 20,060 | |
| Land use and access | Industrial | Total | 221 | 260 | 73 |
| Residential | Total | 1,547 | 2,977 | 307 | |
| Commercial | Total | 182 | 297 | 13 | |
| Mixed use | Total | 743 | 993 | 157 | |
| Number of driveways | Total | Calculated using land use data | |||
| Parking | Left, right, both | ||||
5.3.4.3 Crash Data
Crash data for Minneapolis was obtained from MnDOT. The descriptive statistics for all data attributes are presented in Table 48.
5.3.5 Philadelphia, Pennsylvania
Table 47 lists the data attributes and corresponding sources that were explored by the research team for developing the safety database for Philadelphia, Pennsylvania. The data were obtained from Delaware Valley Regional Planning Commission, Open Data Philly portal, the Pennsylvania DOT (PennDOT), and the Second Strategic Highway Research Program’s Roadway Information Database (SHRP 2-RID), as well as other national sources.
Table 47. Data Sources (Philadelphia, Pennsylvania).
5.3.5.1 Count Data
The count data for Philadelphia, Pennsylvania, was obtained from the DVRPC GIS map. Figure 23 depicts the locations of traffic counters; the DVRPC covers 5,000 locations each year. The data were collected using pneumatic tubes across the road. The DVRPC also obtains traffic data collected by other entities and includes that data in the database.
Table 48. Descriptive Statistics for Safety Data (Minneapolis, Minnesota).
| Contextual Factors | BL (n=218) | BBL (n=16) | SBL (n=66) | NBL (n=7,815) | ||||||||||||
|---|---|---|---|---|---|---|---|---|---|---|---|---|---|---|---|---|
| Mean | SE | Min | Max | Mean | SE | Min | Max | Mean | SE | Min | Max | Mean | SE | Min | Max | |
| Population density | 65% | 25% | 0% | 100% | 40% | 26% | 0% | 85% | 58% | 27% | 11% | 95% | 65% | 28% | 0% | 100% |
| Percentage White | 19% | 20% | 0% | 70% | 32% | 26% | 0% | 70% | 23% | 21% | 0% | 69% | 18% | 21% | 0% | 88% |
| Percentage Black | 6% | 8% | 0% | 43% | 11% | 16% | 0% | 51% | 7% | 8% | 0% | 31% | 8% | 10% | 0% | 57% |
| Median income (U.S. dollars) | 66,674 | 37,140 | 0 | 173,750 | 42,885 | 29,704 | 0 | 95,250 | 53,470 | 33,785 | 0 | 138,625 | 76,559 | 48,253 | 0 | 250,000 |
| KABC crashes (2017–2020) | 0.20 | 0.62 | 0.00 | 4.00 | 0.38 | 0.62 | 0.00 | 2.00 | 0.11 | 0.36 | 0.00 | 2.00 | 0.01 | 0.13 | 0.00 | 7.00 |
| PDO crashes (2017–2020) | 0.04 | 0.23 | 0.00 | 2.00 | 0.06 | 0.25 | 0.00 | 1.00 | 0.05 | 0.21 | 0.00 | 1.00 | 0.00 | 0.06 | 0.00 | 4.00 |
| Total crashes (2017–2020) | 0.23 | 0.73 | 0.00 | 4.00 | 0.44 | 0.63 | 0.00 | 2.00 | 0.15 | 0.40 | 0.00 | 2.00 | 0.01 | 0.18 | 0.00 | 11.00 |
| Civic | 2 | 1 | 0 | 4 | 2 | 1 | 0 | 4 | 2 | 1 | 0 | 4 | 1 | 1 | 0 | 5 |
| Commercial | 2 | 1 | 0 | 4 | 2 | 1 | 0 | 3 | 1 | 1 | 0 | 3 | 1 | 1 | 0 | 4 |
| Industrial | 0 | 1 | 0 | 2 | 1 | 1 | 0 | 2 | 0 | 1 | 0 | 2 | 0 | 1 | 0 | 2 |
| Residential | 3 | 1 | 0 | 5 | 3 | 1 | 0 | 4 | 3 | 1 | 0 | 4 | 2 | 1 | 0 | 5 |
| ADB (2017–2020) | 1 | 5 | 0 | 56 | 14 | 58 | 0 | 232 | 0 | 0 | 0 | 0 | 0 | 0 | 0 | 0 |
| Number of through lanes | 1 | 1 | 1 | 3 | 1 | 1 | 1 | 3 | 1 | 1 | 1 | 3 | 1 | 0 | 1 | 6 |
| Travel lane width (ft) | 23.3 | 11.9 | 0.0 | 73.0 | 27.9 | 16.2 | 10.0 | 56.0 | 22.1 | 10.1 | 10.0 | 56.0 | 9.0 | 9.7 | 0.0 | 76.0 |
| Right shoulder width | 0.3 | 1.6 | 0.0 | 11.0 | 0.0 | 0.0 | 0.0 | 0.0 | 0.7 | 2.6 | 0.0 | 11.0 | 0.1 | 0.9 | 0.0 | 13.0 |
| Left shoulder width | 0.0 | 0.3 | 0.0 | 4.0 | 0.0 | 0.0 | 0.0 | 0.0 | 0.1 | 0.7 | 0.0 | 4.0 | 0.1 | 0.8 | 0.0 | 13.0 |
| Number of bus stops | 6 | 9 | 0 | 58 | 10 | 12 | 0 | 38 | 7 | 15 | 0 | 78 | 0 | 2 | 0 | 65 |
| Average daily transit | 84 | 173 | 0 | 1,155 | 94 | 102 | 0 | 288 | 107 | 312 | 0 | 1,808 | 5 | 31 | 0 | 1,481 |

The data collection process was complex given the way the data were displayed. The database contained most key variables needed for the modeling process, however, it contained estimated AADB rather than raw counts. Thus, after downloading the shapefile, filtering any unwanted data points, and then converting the file to a comma separated values (CSV) file, the research team manually checked each location for the 6–8 days of counts from the counters and manually input the data from portable document format (PDF) files to the CSV file because no count data were downloadable from the DVRPC. The count data were then organized into the correct order of days to compute the average daily bicycles per facility type. Because the data file used counters for both directions of a street, the research team matched the streets and dates and summed the counts. Table 11 shows the summary of the count data from Philadelphia. Note that the number of counters per facility type changed every year. Count data were mainly collected along bicycle lanes; count data along buffered bike lanes were collected in 2017–2018 and along separated bike lanes in 2017.
Table 49. Average Daily Bicycle per Facility Type (Philadelphia, Pennsylvania).
| Facility Type | Counts | 2017 | 2018 | 2019 | 2020 |
|---|---|---|---|---|---|
| BL | ADB | 483 | 364 | 842 | 353 |
| No. of counters | 14 | 21 | 6 | 3 | |
| BBL | ADB | 406 | 186 | N/A | N/A |
| No. of counters | 8 | 3 | N/A | N/A | |
| SBL | ADB | 238 | N/A | N/A | N/A |
| No. of counters | 2 | N/A | N/A | N/A |
5.3.5.2 Bikeway, Roadway, and Land Use Data
Data regarding bike facilities were obtained from Philadelphia’s bike networks. The roadway data were obtained from both regional and state databases. The DVRPC maintains the roadway centerline data, however, other roadway attributes were not readily available and had to be obtained from PennDOT. Additionally, the research team used the SHRP 2-RID, which contains the roadway design characteristics of state roadways. The research team obtained transit data from the GTFS. Figure 24 depicts the combined map of bikeway, roadway, and land use data.
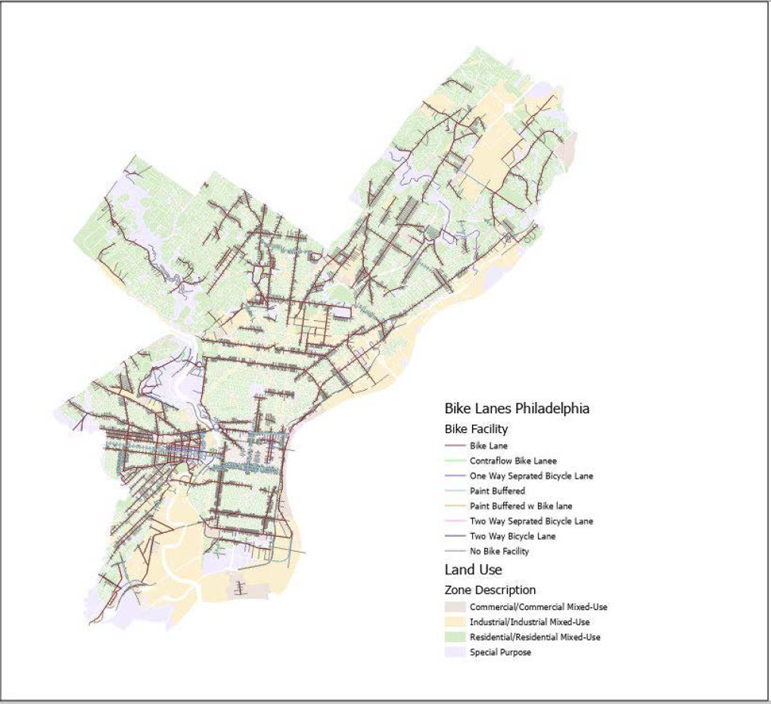
Table 50 presents the data summary of combined attributes. As observed, the Philadelphia bike network included 3,428 bike lane, 420 buffered bike lane, 18 separated bike lane, and 7 contraflow bike lane segments with total lengths of 223, 25, 1.1, and 0.5 miles, respectively. Additionally, the data attributes included the number of lanes and lane, median, and shoulder widths as roadway design elements, and AADT and speed limit as exposure variables. The land use data included the total number of industrial, residential, and commercial units along the bike network.
The number of driveways was calculated using the land use data. The parking data indicated the presence of on-street and meter parking on the street.
Table 50. Contextual Data Summary (Philadelphia, Pennsylvania).
| Data Category | Attribute Name and Measure | BL | BBL | SBL | CBL | |
|---|---|---|---|---|---|---|
| Bikeway | Number of segments with facility type | 3,428 | 420 | 18 | 7 | |
| Segment length | Total (mi) | 223 | 25 | 1.1 | 0.5 | |
| Bikeway network | (mi per sq mi) | Calculated using segment length | ||||
| Roadway facility and exposure | Number of through lanes | 1-5 | 1-7 | 2-6 | 1 | |
| Through lane width | Average (ft) | 14 | 12 | 12 | 12 | |
| Median width | Average (ft) | 0.2 | 0.8 | 0 | 0 | |
| Shoulder width | Average (ft) | 0.2 | 2 | 0 | 0 | |
| Speed limit | Average (mph) | 25 | 30 | 25 | 25 | |
| AADT | Average (vehicles) | 15,340 | 46,096 | 16,123 | NA | |
| Land use and access | Industrial | Total | 1,985 | 182 | 2 | 5 |
| Residential | Total | 14,567 | 1,498 | 11 | - | |
| Commercial | Total | 8,136 | 1,040 | 61 | 9 | |
| Number of driveways | Total | Calculated using land use data | ||||
| Parking | On-street | Yes no | ||||
| Metered | Yes, no | |||||
5.3.5.3 Crash Data
The DVRPC maintained vehicular crash data from 2016 to 2020, which was provided by PennDOT. Figure 25 depicts the location of bicyclist crashes, along with the annual trends from 2016 to 2020. Although the overall number of bicyclist crashes have been decreasing, the number of fatal bicyclist crashes have been increasing during this period, with 2020 being the deadliest year. In 2020, more than 70 percent of bicyclist crashes resulted in a fatality. The descriptive statistics for all data attributes are presented in Table 51.

Table 51. Descriptive Statistics for Safety Data (Philadelphia, Pennsylvania).
| Contextual Factors | BL (n=3,492) | BBL (n=437) | SBL (n=17) | NBL (n=36,839) | ||||||||||||
|---|---|---|---|---|---|---|---|---|---|---|---|---|---|---|---|---|
| Mean | SE | Min | Max | Mean | SE | Min | Max | Mean | SE | Min | Max | Mean | SE | Min | Max | |
| Percentage White | 34% | 31% | 0% | 100% | 46% | 34% | 0% | 98% | 52% | 19% | 21% | 82% | 41% | 33% | 0% | 100% |
| Percentage Black | 44% | 37% | 0% | 100% | 29% | 35% | 0% | 100% | 25% | 17% | 0% | 53% | 39% | 36% | 0% | 100% |
| Percentage Hispanic | 14% | 21% | 0% | 98% | 7% | 8% | 0% | 64% | 10% | 8% | 4% | 26% | 14% | 20% | 0% | 100% |
| Median income (U.S. dollars) | 42,032 | 34,953 | 0 | 250,000 | 58,973 | 48,631 | 0 | 239,231 | 61,877 | 61,058 | 0 | 155,000 | 50,523 | 38,210 | 0 | 250,000 |
| KABC crashes (2017–2020) | 0.0 | 0.2 | 0.0 | 5.0 | 0.0 | 0.2 | 0.0 | 1.0 | 0.2 | 0.4 | 0.0 | 1.0 | 0.0 | 0.1 | 0.0 | 2.0 |
| PDO crashes (2017–2020) | 0.0 | 0.0 | 0.0 | 0.0 | 0.0 | 0.0 | 0.0 | 0.0 | 0.0 | 0.0 | 0.0 | 0.0 | 0.0 | 0.0 | 0.0 | 1.0 |
| Total crashes (2017–2020) | 0.0 | 0.2 | 0.0 | 5.0 | 0.0 | 0.2 | 0.0 | 1.0 | 0.2 | 0.4 | 0.0 | 1.0 | 0.0 | 0.1 | 0.0 | 2.0 |
| Civic | 3 | 2 | 1 | 25 | 4 | 5 | 1 | 44 | 5 | 2 | 1 | 10 | 3 | 3 | 0 | 55 |
| Commercial | 4 | 6 | 0 | 58 | 3 | 4 | 0 | 28 | 5 | 5 | 0 | 16 | 2 | 4 | 0 | 62 |
| Industrial | 0 | 1 | 0 | 21 | 0 | 1 | 0 | 6 | 0 | 1 | 0 | 3 | 0 | 1 | 0 | 29 |
| Residential | 14 | 15 | 0 | 148 | 15 | 16 | 0 | 82 | 5 | 8 | 0 | 28 | 28 | 26 | 0 | 305 |
| ADB (2017–2020) | 0 | 7 | 0 | 218 | 12 | 66 | 0 | 608 | 7 | 20 | 0 | 74 | 0 | 0 | 0 | 0 |
| AADT | 15,266 | 19,336 | 1,976 | 174,342 | 37,047 | 47,709 | 3,310 | 168,111 | 16,602 | 1,492 | 15,212 | 18,161 | 19,150 | 27,621 | 1,191 | 179,487 |
| Speed limit (mph) | 2 | 8 | 0 | 55 | 5 | 16 | 0 | 55 | 0 | 0 | 0 | 0 | 2 | 10 | 0 | 55 |
| Number of through lanes | 3 | 1 | 1 | 10 | 4 | 2 | 1 | 8 | 5 | 1 | 2 | 6 | 3 | 2 | 1 | 10 |
| Lane width (ft) | 9.6 | 2.5 | 10 | 14.0 | 12 | 3.7 | 10 | 12.0 | 0.0 | 0.0 | 0.0 | 0.0 | 8 | 2.5 | 10 | 14.0 |
| Median width (ft) | 0.6 | 5.6 | 0.0 | 99.0 | 2.9 | 12.9 | 0.0 | 75.0 | 0.0 | 0.0 | 0.0 | 0.0 | 1.3 | 8.9 | 0.0 | 99.0 |
| Right shoulder width (ft) | 0.2 | 1.2 | 0.0 | 14.0 | 0.9 | 2.6 | 0.0 | 10.0 | 0.0 | 0.0 | 0.0 | 0.0 | 0.3 | 1.6 | 0.0 | 20.0 |
| Left shoulder width (ft) | 0.1 | 0.8 | 0.0 | 12.0 | 0.3 | 0.9 | 0.0 | 3.0 | 0.0 | 0.0 | 0.0 | 0.0 | 0.2 | 1.1 | 0.0 | 12.0 |
| Length (ft) | 357 | 326 | 16 | 4,199 | 355 | 338 | 29 | 3,097 | 414 | 210 | 68 | 764 | 371 | 395 | 3 | 14,527 |
| Average daily transit | 4 | 5 | 0 | 35 | 3 | 5 | 0 | 38 | 4 | 3 | 0 | 10 | 1 | 3 | 0 | 66 |
5.3.6 Seattle, Washington
Table 52 lists the data attributes and corresponding sources that were explored by the research team for developing the safety database for Seattle, Washington. The required data for Seattle was obtained from Seattle Open Data, the Seattle DOT, WSDOT, and SHRP 2-RID, as well as other national sources.
Table 52. Data Sources (Seattle, Washington).
5.3.6.1 Count Data
Count data were obtained from WSDOT’s Pedestrian and Bicycle Count Portal and the Seattle DOT’s open data portal. The Seattle bicycle count data were collected and provided to the research team on an hourly basis. Most of the counters were placed on shared use paths or trails. One permanent counter was placed along a separated bike lane, while two permanent counters were placed along sharrows. Although not included in the scope of the original research, we decided to use the count data collected from the sharrows as well, given the limited number of on-street sites. These data were used as a proxy to estimate the counts on bike and buffered bike lanes.
Table 53. Average Daily Bicycle per Facility Type (Seattle, Washington).
| Facility Type | Number of Sites | 2017 | 2018 | 2019 | 2020 |
|---|---|---|---|---|---|
| Separated Bike Lane | 1 | 277 | 297 | 349 | 196 |
| Sharrow | 2 | 128 | 77 | 118 | 93 |
5.3.6.2 Bikeway, Roadway, and Land Use Data
Contextual data for Seattle was obtained from various sources such as Seattle Open Data, the Seattle DOT, and SHRP 2-RID (originally provided by WSDOT). Bikeway inventories classified bicycle facilities as having minor or major separation. However, this classification did not correspond to any particular bike facility type. Therefore, the research team had to review each site one-by-one to assign the correct facility type. After this, the reclassified shapefile was combined with roadway and land use data. The parking data were obtained manually for each location. Figure 26 depicts the map of combined bikeway, roadway, and land use data for Seattle.
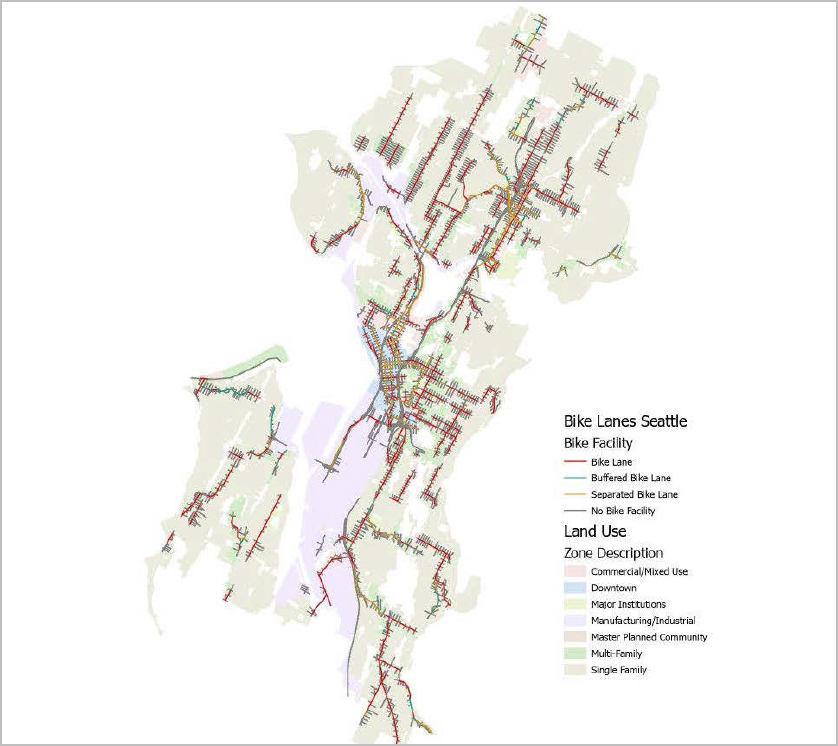
Table 54 summarizes the contextual data elements found in the combined databases. There were 421 bike lane, 29 buffered bike lane, and 165 separated bike lane segments, with total lengths of 70, 6, and 26 miles, respectively.
Table 54. Contextual Data Summary (Seattle, Washington).
| Data Category | Attribute Name and Measure | Bicycle Lane | Buffered Bike Lane | Separated Bike Lane | |
|---|---|---|---|---|---|
| Bikeway | Number of segments with facility type | 421 | 29 | 165 | |
| Segment length | Total (mi) | 70 | 6 | 26 | |
| Bikeway network | (mi per sq mi) | Calculated using segment length | |||
| Roadway facility and exposure | Number of through lanes | Range (min–max) | 1–5 | 2–4 | 1–5 |
| Through lane width | Average (ft) | 14 | 12 | 12 | |
| Speed limit | Average (mph) | 25 | 25 | 25 | |
| AADT | Average (vehicles) | 12,776 | 10,671 | 19,100 | |
| Land use and access | Industrial | Total | 83 | 99 | 7 |
| Residential | Total | 439 | 1,384 | 90 | |
| Commercial | Total | 448 | 751 | 49 | |
| Number of driveways | Total | Calculated using land use data | |||
| Parking | On-street | Yes, no | |||
| Metered | Yes, no | ||||
5.3.6.3 Crash Data
Finally, the crash data were obtained from the Seattle DOT (Figure 27). A total of 1,349 bicyclist crashes occurred in Seattle from 2017 to 2020, 21 of which were fatal crashes. The crash database assigned each crash to a junction type, indicating whether the crash occurred at a midblock or intersection location. The descriptive statistics for all data attributes are presented in Table 55.
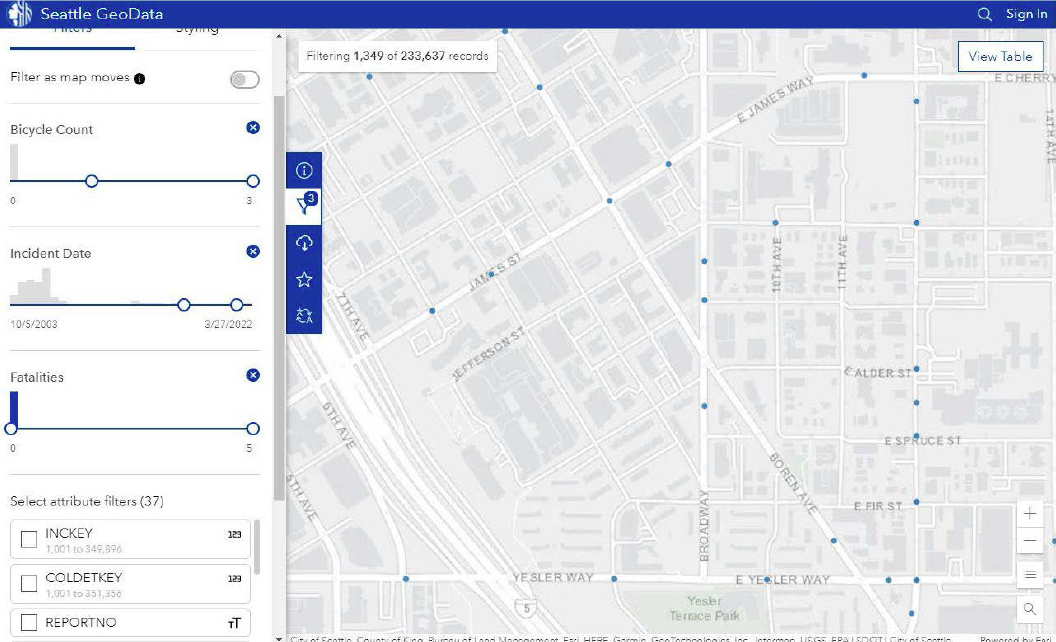
Table 55. Descriptive Statistics for Safety Data (Seattle, Washington).
| Contextual Factors | BL (n=968) | BBL=60 | SBL=333 | NBL=4,085 | ||||||||||||
|---|---|---|---|---|---|---|---|---|---|---|---|---|---|---|---|---|
| Mean | SE | Min | Max | Mean | SE | Min | Max | Mean | SE | Min | Max | Mean | SE | Min | Max | |
| Population density | 1% | 0% | 0% | 5% | 0% | 0% | 0% | 1% | 1% | 1% | 0% | 5% | 0% | 0% | 0% | 6% |
| Percentage White | 65% | 22% | 8% | 100% | 63% | 21% | 14% | 100% | 61% | 22% | 10% | 96% | 67% | 21% | 6% | 100% |
| Percentage Black | 8% | 12% | 0% | 70% | 8% | 11% | 0% | 50% | 6% | 10% | 0% | 61% | 6% | 10% | 0% | 70% |
| Percentage Hispanic | 8% | 7% | 0% | 54% | 8% | 7% | 0% | 29% | 6% | 5% | 0% | 24% | 7% | 7% | 0% | 54% |
| Median income (U.S. dollars) | 96,973 | 46,328 | 0 | 250,000 | 88,582 | 49,789 | 0 | 180,152 | 87,474 | 44,234 | 0 | 250,000 | 108,760 | 50,344 | 0 | 250,000 |
| KABC crashes (2017–2020) | 0.08 | 0.34 | 0.00 | 4.00 | 0.15 | 0.68 | 0.00 | 5.00 | 0.24 | 0.98 | 0.00 | 9.00 | 0.06 | 0.12 | 0.00 | 3.00 |
| PDO crashes (2017–2020) | 0.01 | 0.08 | 0.00 | 1.00 | 0.02 | 0.13 | 0.00 | 1.00 | 0.02 | 0.14 | 0.00 | 1.00 | 0.00 | 0.05 | 0.00 | 1.00 |
| Total crashes (2017–2020) | 0.01 | 0.35 | 0.00 | 4.00 | 0.17 | 0.69 | 0.00 | 5.00 | 0.04 | 1.03 | 0.00 | 10.00 | 0.01 | 0.13 | 0.00 | 3.00 |
| Civic | 0 | 1 | 0 | 8 | 0.03 | 1 | 0 | 5 | 0 | 1 | 0 | 9 | 0 | 0 | 0 | 12 |
| Commercial | 1 | 1 | 0 | 9 | 1 | 1 | 0 | 6 | 1 | 2 | 0 | 10 | 1 | 1 | 0 | 14 |
| Industrial | 0 | 1 | 0 | 6 | 0 | 1 | 0 | 4 | 0 | 1 | 0 | 6 | 0 | 1 | 0 | 11 |
| Residential | 1 | 1 | 0 | 9 | 2 | 1 | 0 | 7 | 1 | 1 | 0 | 8 | 1 | 1 | 0 | 18 |
| Speed limit (mph) | 25 | 1 | 20 | 30 | 25 | 0 | 25 | 25 | 25 | 1 | 20 | 30 | 22 | 4 | 0 | 60 |
| ADB (2017–2020) | 0 | 0 | 0 | 0 | 0 | 0 | 0 | 0 | 1 | 15 | 0 | 280 | 0 | 0 | 0 | 0 |
| AADT | 15,643 | 23,820 | 1,191 | 168,111 | 10,230 | 11,591 | 3,223 | 27,508 | 12,494 | 9,093 | 3,526 | 49,646 | 15,325 | 23,179 | 1,191 | 179,487 |
| Segment length (ft) | 381.84 | 252.43 | 19 | 2,623 | 449.62 | 262.12 | 78 | 1,583 | 374 | 231.15 | 24 | 2,284 | 425.64 | 440.57 | 0 | 15,035 |
| Number of through lanes | 3.01 | 1.56 | 1 | 8 | 3.5 | 1.91 | 2 | 6 | 2.75 | 1.31 | 1 | 6 | 2.82 | 1.46 | 1 | 10 |
| Lane width (ft) | 10.6 | 2.69 | 10 | 12 | 0 | 0 | 0 | 0 | 0 | 0 | 0 | 0 | 9.9 | 2.06 | 10 | 12 |
| Median width (ft) | 1.22 | 7.9 | 0 | 75 | 0 | 0 | 0 | 0 | 0 | 0 | 0 | 0 | 0.74 | 6.92 | 0 | 99 |
| Right shoulder width (ft) | 0.24 | 1.41 | 0 | 10 | 0 | 0 | 0 | 0 | 0 | 0 | 0 | 0 | 0.14 | 1.18 | 0 | 14 |
| Left shoulder width (ft) | 0.09 | 0.44 | 0 | 3 | 0 | 0 | 0 | 0 | 0 | 0 | 0 | 0 | 0.08 | 0.76 | 0 | 12 |
5.4 CHAPTER SUMMARY
This chapter presents the results of data collection and site selection activities. The research team compiled both the readily available and other data provided by the agencies, to select the sites for safety evaluation. As the result following cities were considered for the safety analysis: Arlington VA, Austin, TX, Boston MA, Dallas-Fort Worth TX, Minneapolis MN, Philadelphia PA and Seattle WA. We ensured that the available data was complete enough for the analysis.
The selected cities have a combined 714 miles of bicycle lanes, 117 miles of buffered bicycle lanes, 41 miles of separated bicycle lanes and 14 miles of contraflow bike lanes. The average daily counts were collected from 106 bike lanes, 34 buffered bike lanes and 22 separated bike lanes. In addition to these, we also summarized the ADB data for some of the other cities that are used for estimating the bike counts for sites without exposure data (discussed in Chapter 6).
Among the contextual factors, we also collected AADT, sped limits, roadway design, land use, parking, transit and socioeconomic and demographic data. To ensure the consistency and reduce the manual data collection and wrangling process we use the transit data from GTFS and socioeconomic data from ACS to complete the final database. Obtaining driveway data was not trivial, therefore this data was not considered for safety analysis of all sites. The driveway and access considerations when installing bikeways are discussed in the Guidance Report.


