Delineation of Linear Roadside Hardware Systems and Roadside Obstacles (2026)
Chapter: 4 Human Factors Study and Findings

CHAPTER 4
Human Factors Study and Findings
A human factors study evaluated the effectiveness of four concrete barrier delineation practices, four guardrail delineation practices, and two roadside object (culvert) practices. In addition, combinations of the practices and variations in delineator spacing were evaluated.
Two separate but related studies were conducted to evaluate these practices. The first study was a closed-course study in which participants drove an instrumented vehicle and viewed the various delineation practices in dry nighttime conditions. The second study was a computer-based survey in which participants viewed videos and images of the delineation practices. Video footage of the delineation practices was collected in dry daytime and nighttime conditions. The delineation practices for the concrete barrier and guardrail were focused on a curved roadway application, while the culvert delineation practices were focused on a straight roadway application. The methodology and findings for these two studies are described in this chapter.
Methodology
This section presents the methodology for evaluating concrete barrier, guardrail, and culvert delineation practices through closed-course and computer-based studies.
Closed-Course Study
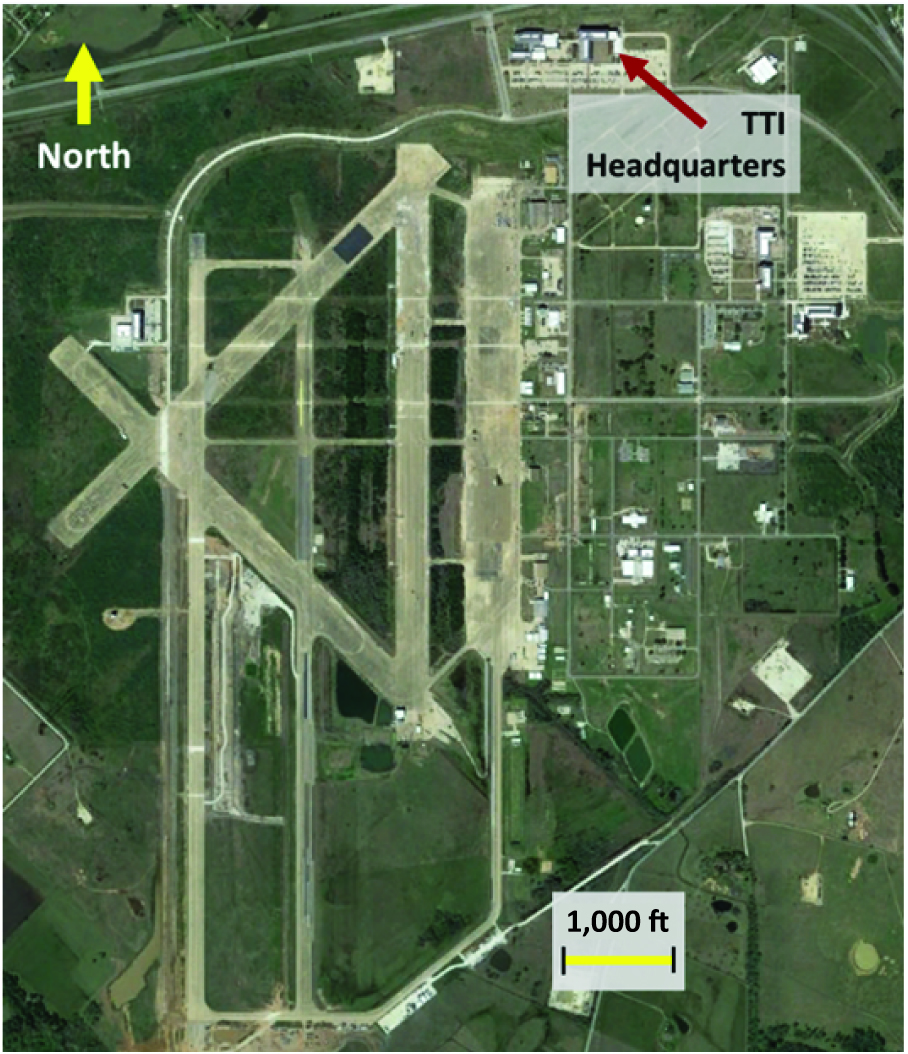
A closed-course study was conducted at the Texas A&M University System RELLIS Campus, as seen in Figure 2. The RELLIS Campus offered open runways configured to represent curved roadway sections with roadside hardware systems and roadside objects.
Three concrete barrier delineation practices, three guardrail delineation practices, and two roadside culvert delineation practices were evaluated as part of the closed-course study. The concrete barrier delineation practices included top-mounted delineators, side-mounted delineators, continuous retroreflective paint stripes, and combinations of these three practices. The guardrail delineation practices included w-beam–mounted delineators, post-mounted delineators, yellow rubrail, and combinations of these three practices. The roadside culvert practices included one delineator post and two delineator posts installed next to the culvert and one object marker and two object markers installed next to the culvert. In addition, a no-delineation practice (i.e., delineation was absent) for the concrete barrier and guardrail was included as a baseline for comparison and evaluation.
Course Layout
The test course was set up on the paved areas of the closed course of the Texas A&M–RELLIS Campus. Two curves were set up on the course to represent a curved roadway with a concrete
Long Description.
The view shows a large airfield with several runways crossing each other in the left half of the picture. On the right side, there are many buildings and roads arranged in a grid pattern. At the top right, a red arrow points to the Texas A and M Transportation Institute Headquarters. An upward yellow arrow in the top left corner shows the direction of north. At the bottom right, there is a scale bar marking 1,000 feet for reference.
barrier and guardrail system on the roadside. The roadway section simulated a two-lane, two-way road so that data could be collected in each direction around the curve. A tangent section of the course was set up to represent a roadside object area. This test area was used to simulate the delineation of a roadside culvert.
The concrete barrier location had a 600-ft curve radius and a 455-ft total curve length. The curved section had solid white edge lines and a double yellow centerline. An additional 575 ft of tangent striping was applied to each end of the curve. The first 120 ft of the tangent sections were striped with solid white edge lines and a double yellow centerline. The remaining tangent sections were striped with solid white edge lines and a broken yellow centerline. Nineteen 30-ft-long, 32-in-tall temporary F-shape concrete barriers were placed along the outside part of the curve. The concrete barriers were offset 4 ft from the outer white solid edge line.
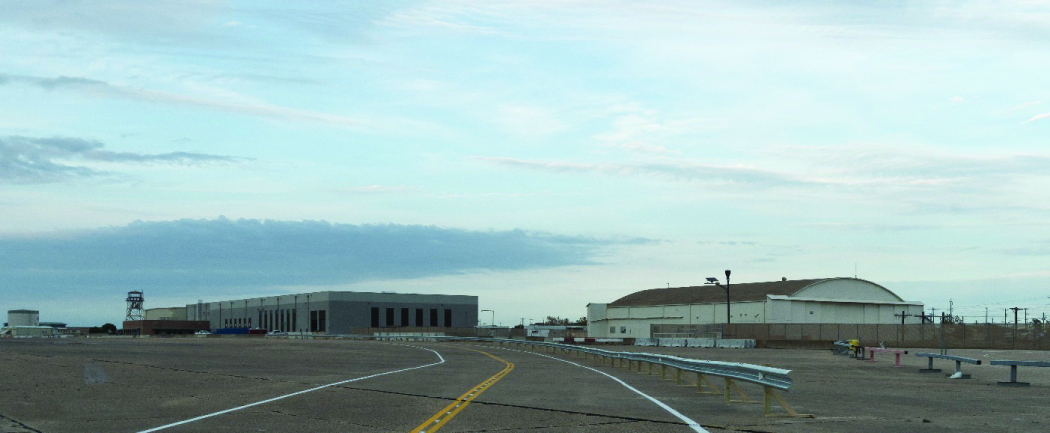
Figure 3 shows the concrete barrier setup at the start of the curve. The guardrail location consisted of a 600-ft curve radius with 380-ft total curve length. The curved section had solid white edge lines and a double yellow centerline. An additional 605 ft of tangent striping was
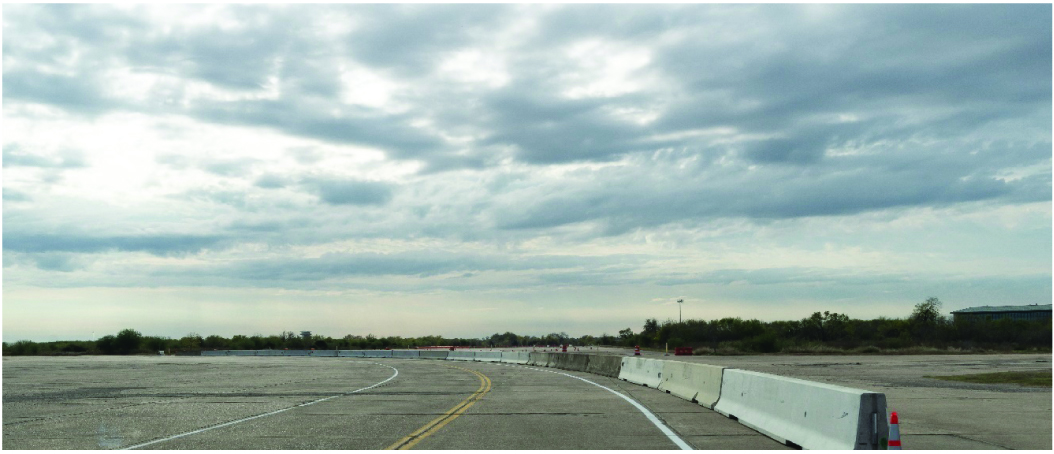
applied on each end of the curve. The first 105 ft of the tangent sections were striped with solid white edge lines and a double yellow centerline. The remaining tangent sections were striped with solid white edge lines and a broken yellow centerline. The guardrail consisted of a w-beam guardrail with wood posts. The posts were spaced at 12.5 ft. The mounting height for the guardrail was 31 in. The front face of the guardrail was offset 4 ft from the outer white solid edge line. Figure 4 shows the guardrail setup at the start of the curve.
The 600-ft curve radius for the concrete barrier and guardrail was selected because it aligned with a design speed of 42.5 mi/h. This speed reflected the upper limit of safe operating speeds anticipated for the course. The driving path, roadside hardware, and delineation were set up so that participants drove through the curve as a left turn with the delineation on the right. The participants also navigated the course in the reverse direction, resulting in right-turn curves being delineated on the left side. For some participants, the delineation was the same in both curve directions. For other participants, the delineation was different in each curve direction. The delineation practices were modified after participants drove through the course in both directions. Participants then drove through the course a second time in both directions.
Thus, some participants witnessed up to four different delineation practices at the concrete barrier and guardrail curve sites. Half the participants began their first lap driving through the course with left-turn curves. The other half began their first lap driving through the course with right-turn curves. This approach was used to increase randomness in the viewing order of the delineation practices. The object marker was set up so that participants could drive past in only one direction on each lap. Thus, participants would only view two total roadside object delineation practices during the closed-course study.
The course setup presented a limitation: The driverʼs eye distance to the delineation practice varied by approximately 12 ft between right- and left-turn curves. As a result, delineation practices evaluated on only one curve direction may have been influenced by the driverʼs lateral positioning. The purpose of setting up the course with this known limitation was to increase the number of delineation practices that could be evaluated in the study. If all the delineation practices were analyzed in a single curve direction, only half of them could have been evaluated. This lateral offset factor was analyzed in the Findings section to assess its potential impact.
Figure 5 displays the course layout, delineation sites, and driving route. The red arrows indicate the direction of the driverʼs path for participants who began the course with the left-turn curves. For participants who began the course with right-turn curves, the starting and turnaround points were switched (i.e., drivers started facing the concrete barrier site and drove in that direction first).
The delineation practices were set up to maximize the number of practices viewed by the participants. Thus, as mentioned previously, participants often viewed different delineation

Long Description.
The view displays a large testing or driving area with marked routes. Red arrows show the driving route starting from the Starting Location at the bottom, going straight up past a Roadside Object, then alongside a Guardrail, continuing further, turning left near a Concrete Barrier, and looping back around. A Turnaround Location is also marked near the starting point. The area includes open paved runways, buildings, and green fields around it. The route looks like an elongated oval-shaped route.
practices in both directions and for each lap. In addition, the closed-course driver study was conducted in two parts. Approximately half the total number of drivers participated in both parts. Significant changes were made to the course setup between Parts I and II of the driver study. For example, in Part I, a yellow rubrail was attached to the guardrail system, and in Part II, no yellow rubrail was attached to the guardrail system. The purpose of dividing the study into two parts was to increase the number of delineation practices that could be evaluated.
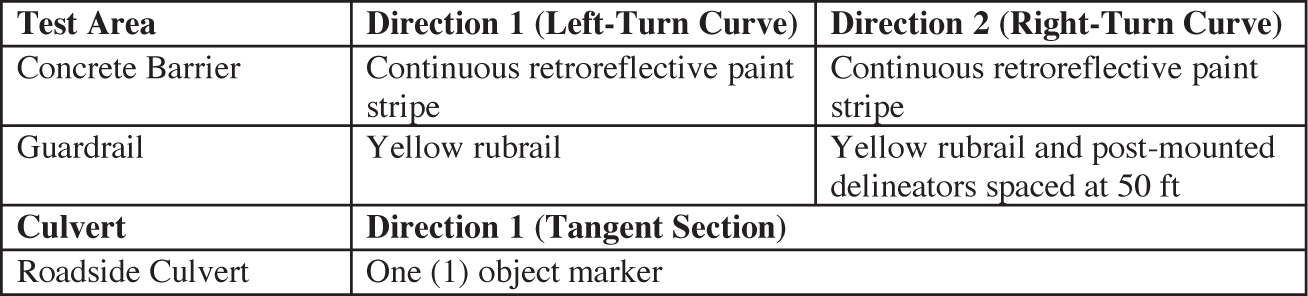
Tables 18 through 21 present the delineation practices the participants observed. In Part I, 19 participants drove through the closed course. In Part II, 22 participants drove through the closed course. Between Parts I and II, the concrete barriers were flipped around (i.e., to show the non-painted side of the barrier), and the yellow rubrail was removed. No other changes were made to the overall course layout between Parts I and II.
Long Description.
The table is separated into two sections. The first section contains three columns and two rows. The column headers of the first section are Test Area, Direction 1 (Left-Turn Curve), and Direction 2 (Right-Turn Curve). The data provided row-wise are as follows:
Concrete Barrier; Continuous retroreflective paint stripe; Continuous retroreflective paint stripe
Guardrail; Yellow rubrail; Yellow rubrail and post-mounted delineators spaced at 50 feet
The second section contains two columns and one row. The column headers of the second section are Culvert and Direction 1 (Tangent Section). The data provided row-wise are as follows:
Roadside Culvert; One (1) object marker

Long Description.
The table is separated into two sections. The first section contains three columns and two rows. The column headers of the first section are Test Area, Direction 1 (Left-Turn Curve), and Direction 2 (Right-Turn Curve). The data provided row-wise are as follows:
Concrete Barrier; Continuous retroreflective paint stripe and top-mounted delineators spaced at 25 feet; Continuous retroreflective paint stripe and top-mounted delineators spaced at 50 feet.
Guardrail; Yellow rubrail and w-beam-mounted delineators spaced at 50 feet; Yellow rubrail, w-beam-mounted, and post-mounted delineators spaced at 50 feet.
The second section contains two columns and one row. The column headers of the second section are Culvert and Direction 1 (Tangent Section). The data provided row-wise are as follows:
Roadside Culvert; Two (2) object markers
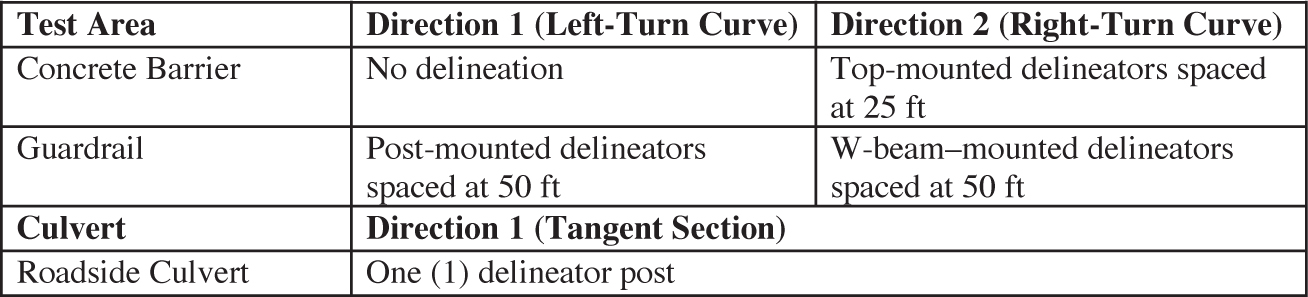
Long Description.
The table is separated into two sections. The first section contains three columns and two rows. The column headers of the first section are Test Area, Direction 1 (Left-Turn Curve), and Direction 2 (Right-Turn Curve). The data provided row-wise are as follows:
Concrete Barrier; No delineation; Top-mounted delineators spaced at 25 feet
Guardrail; Post-mounted delineators spaced at 50 feet; W-beam-mounted delineators spaced at 50 feet
The second section contains two columns and one row. The column headers of the second section are Culvert and Direction 1 (Tangent Section). The data provided row-wise are as follows:
Roadside Culvert; One (1) delineator post
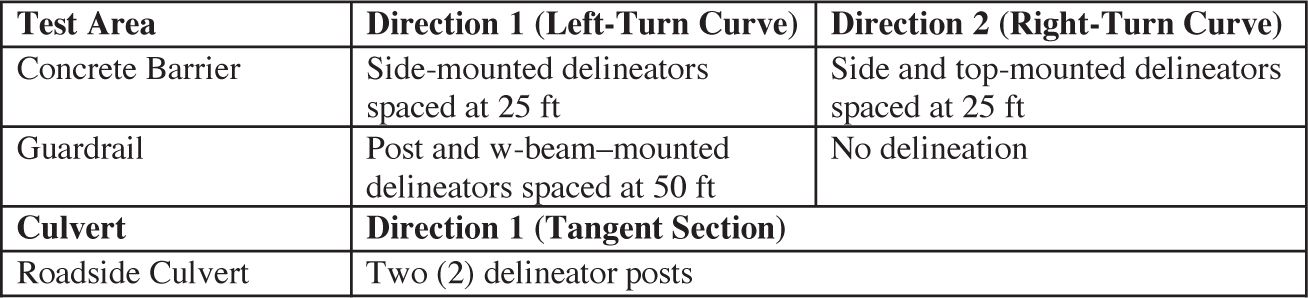
Long Description.
The table is separated into two sections. The first section contains three columns and two rows. The column headers of the first section are Test Area, Direction 1 (Left-Turn Curve), and Direction 2 (Right-Turn Curve). The data provided row-wise are as follows:
Concrete Barrier; Side-mounted delineators spaced at 25 feet; Side and top-mounted delineators spaced at 25 feet
Guardrail; Post and w-beam-mounted delineators spaced at 50 feet; No delineation
The second section contains two columns and one row. The column headers of the second section are Culvert and Direction 1 (Tangent Section). The data provided row-wise are as follows:
Roadside Culvert; Two (2) delineator posts
Vehicle Setup
The participants drove through the course in an instrumented vehicle to observe the delineation practices, as shown in Figure 6. The instrumented vehicle monitored the driverʼs performance by logging the vehicleʼs speed, position, accelerations, brake pressure, throttle pressure, and steering.
Driver behavior was also monitored using an eye-tracking system. It was continually monitored to observe the driverʼs reaction to the delineation practices at the different site locations. In addition to observing the driverʼs performance, photometric equipment in the instrumented vehicle was used to document the nighttime performance of the practices. These measurements were made using standard ASTM measurements and measurements from the driverʼs perspective. The luminance of the devices from the driverʼs perspective was evaluated using an imaging photometer, which documents the brightness and color of every pixel it captures.
Performance Metrics
Various performance metrics were measured during the closed-course study to evaluate the effect of each delineation practice on driver behavior. These metrics focused on different aspects of driver performance, such as speed, reaction, visual detection, and cognitive processing. Other aspects focused on driver preference and subjective opinion.
The driver performance metrics were separated into two categories: driver behavior prior to entering and in the curve. These categories examined how drivers anticipated the curve, adjusted
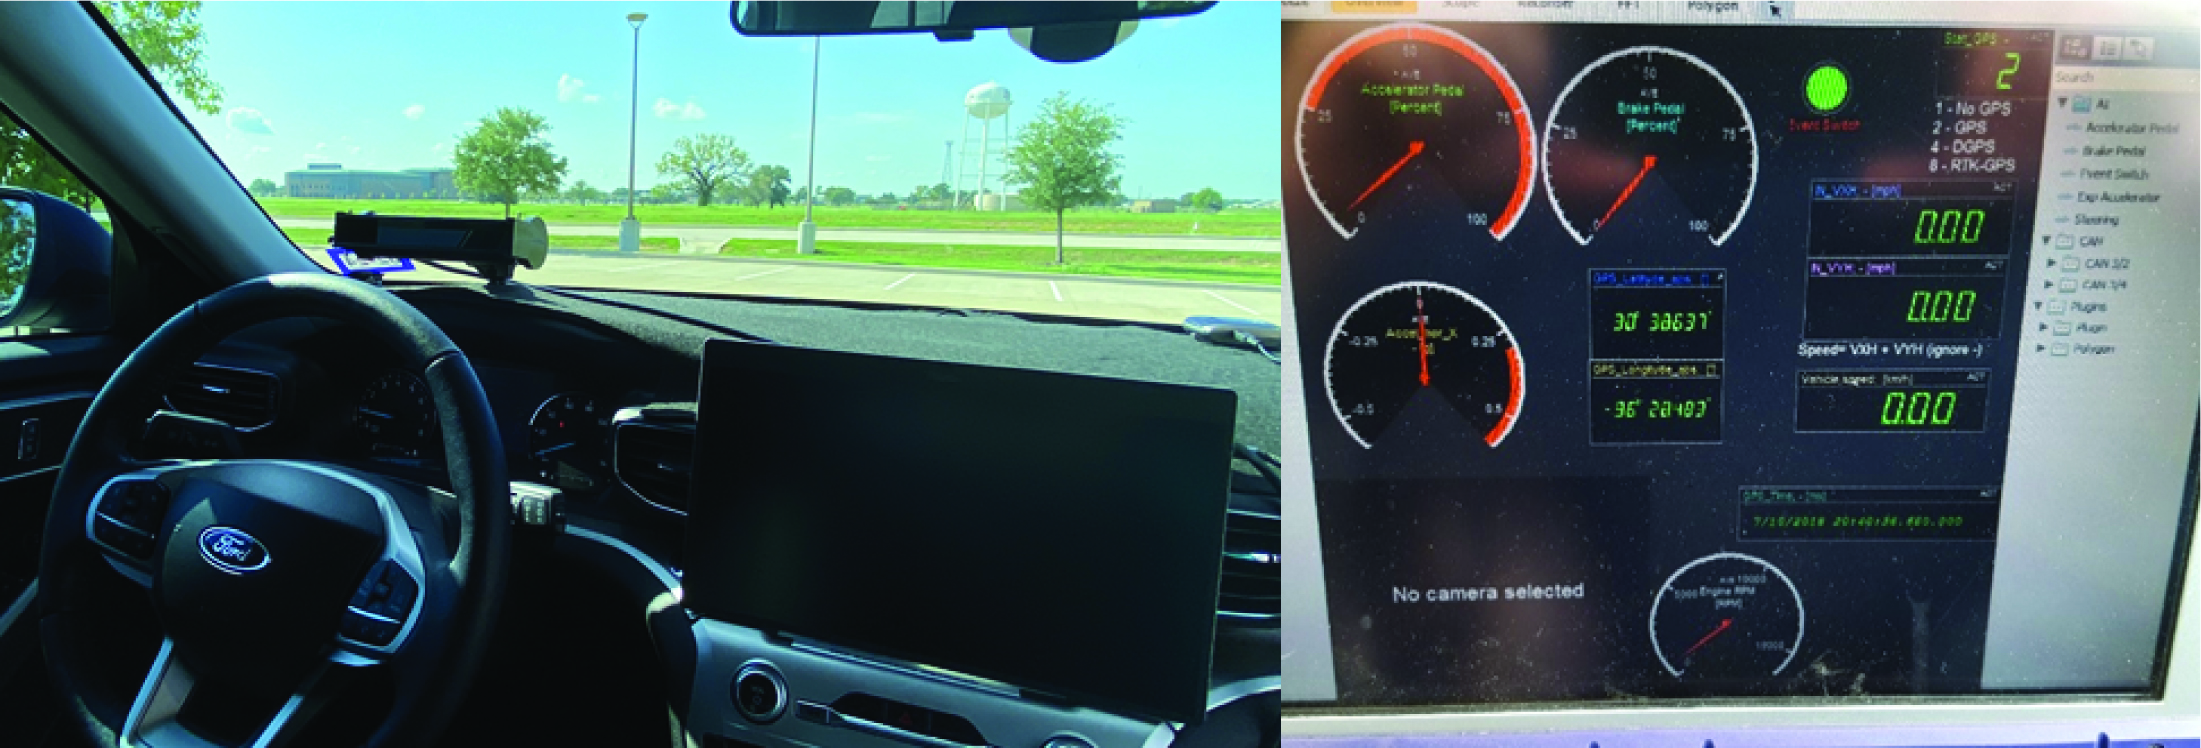
Long Description.
The first view is seen from the passenger side of the car. It shows the steering wheel and a small screen beside it. The second photo shows a computer screen displaying a vehicle monitoring dashboard. The monitor shows circular gauge meters, brake pedal percent, steering wheel angle, and engine speed (RPM). Digital readouts show GPS latitude, GPS longitude, speed, vehicle usage, and time or date.
their behavior before entering it, and maneuvered through it. Three performance metrics were measured for driver behavior prior to entering the curve. These metrics included detection distance (i.e., curve or culvert), throttle release distance, and braking distance. The detection distance was measured by the driver manually pressing a button when they identified an upcoming curve or culvert. This button press was matched to a time and location stamp that could be converted to a distance ahead of the curve or culvert. The throttle release distance was the location at which the driver last released throttle pressure (i.e., took their foot completely off the gas) prior to the curve. The brake distance was the location at which the driver first applied the brakes after identifying the upcoming curve. The throttle release distance and brake distance metrics were only measured for the two curve locations, not the culvert location.
Five performance metrics were measured for driver behavior in the curve. Four metrics focused on vehicle characteristics: speed, throttle pressure, brake pressure, and steering angle averaged along the length of the curve. Thus, these metrics were only focused on two curve locations (i.e., concrete barrier and guardrail delineation practices). The fifth and remaining metric focused on the driverʼs cognitive processing through eye gaze. Specifically, two components were measured: dwell count and dwell time. Dwell count refers to the number of times drivers shifted their gaze from the roadway to the delineation practice. Dwell time refers to the number of times participants shifted their gaze from the roadway to the delineation practice. Both eye gaze components were measured while drivers traversed through the two curve locations.
In addition to these performance metrics, subjective opinion was also part of the driverʼs participation in the study. After completing the closed-course study, drivers completed a close-out survey that requested responses to specific questions about the delineation practices and allowed drivers to rate each delineation practice. The specific questions and survey layout were identical to those in the computer-based study section presented later in this chapter.
Participant Recruitment
Participants were recruited in the Bryan/College Station area following Institutional Review Board protocols. The aim was to have 40 total participants for the closed-course study, with half of them in each part of the study. All participants were required to have a valid driverʼs license and 20/40 vision or better.
Computer-Based Study
The other part of the human factors study was conducted using a computer-based study. The threefold purpose of the computer-based study was to evaluate additional delineation practices, evaluate daytime conditions, and gather data from a large and geographically diverse set of participants. The computer-based survey gave participants the flexibility to travel to different regions and offer their feedback on various delineation practices.
Setup
The computer-based study consisted of participants viewing videos and photos and providing quantitative and qualitative feedback. It comprised two portions: a series of videos viewed by the participants in a software program called SuperLab and a survey questionnaire. Using SuperLab allowed for timed video to be synced with participantsʼ inputs. While viewing each video clip, participants pressed either the left or right button when they could detect a curve in the roadway (for videos with curved roadway and barrier delineation) or when they could detect a roadside object (for videos with culvert delineation). The data indicated how early participants identified the direction of the curve and detected a roadside object at the culvert location.
The survey questionnaire asked participants about the delineation practices they viewed in the videos. Some questions were formatted to allow open-ended responses and focused on the participantʼs understanding of the delineation practice and any perceived advantages or disadvantages. The open-ended questions consisted of the following:
- What do you think this delineation practice means?
- How would this delineation practice impact your driving?
- What do you think the spacing of the delineation practice means?
- Do you have any concerns with any of these delineation practices?
- Do you see any advantages of these delineation practices?
Participants were also asked to rate each delineation practice. Specifically, participants rated each delineation practice on a scale of 1 to 10 for the following categories:
- Rate this delineation practice based on how it stands out.
- Rate this delineation practice based on how it would help you identify the roadway curve.
- Rate this delineation practice based on how it would help you traverse the roadway curve.
Location
Each participant completed the computer-based study with a single monitor screen connected to a laptop. A keyboard and mouse were available for each participant to use. The monitor settings (e.g., brightness, resolution) were set to be the same for each participant. The computer-based study was conducted in four cities: (1) Boston, MA, from AASHTO Northeastern Region 1; (2) Houston, TX, from AASHTO Southern Region 2; (3) Des Moines, IA, from AASHTO Mid-America Region 3; and (4) San Diego, CA, from AASHTO West Region 4. The selection of these cities allowed for a mix of urban and rural drivers. The aim was to collect data from 30 participants in each city. The demographics aimed to have an equal split by gender and a wide range of the driver population by age. All participants were required to have a valid driverʼs license. As mentioned previously, participants who completed the closed-course study also completed the computer-based study. This approach allowed for some understanding of how drivers viewed the delineation practices in person versus on a monitor screen.
Video Collection
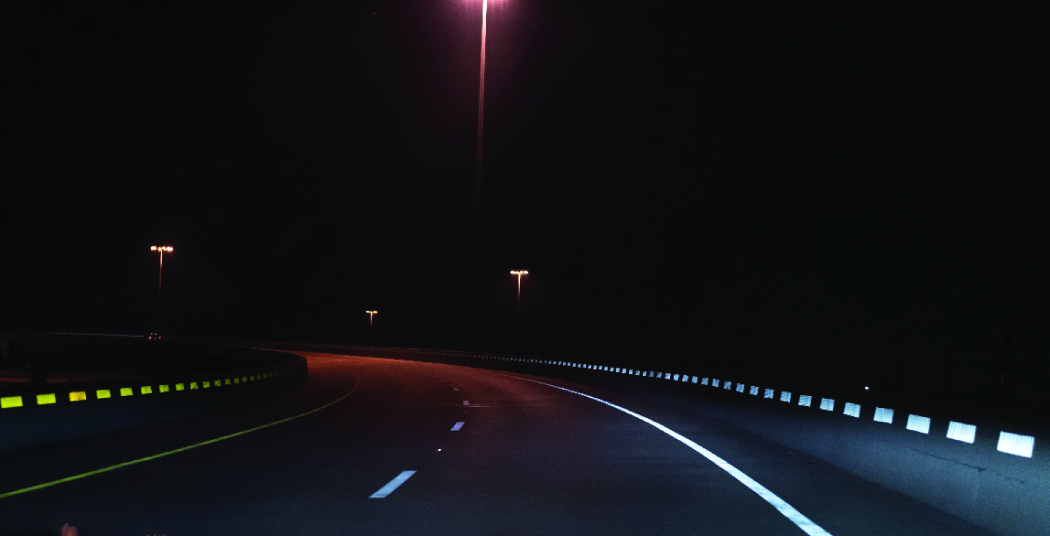
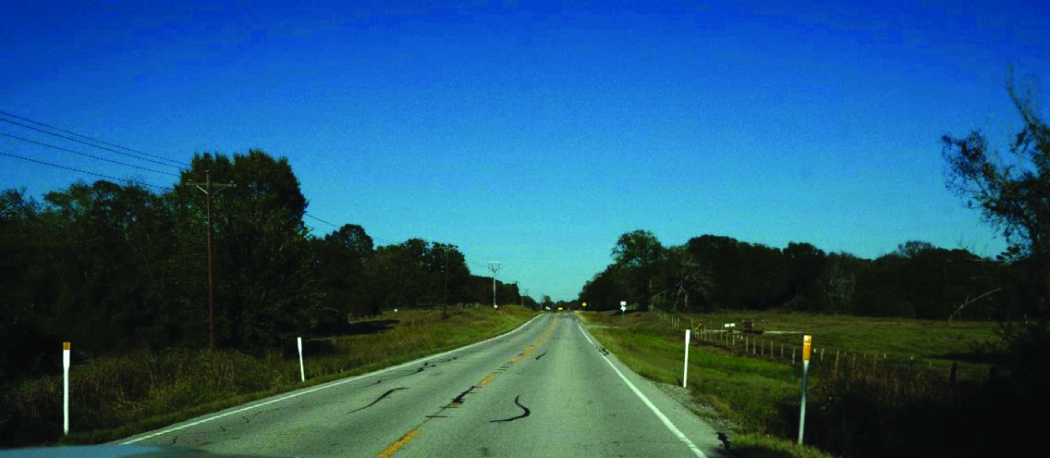
The video clips viewed by participants in the computer-based study were developed as part of this research project. Video cameras were placed in the instrumented vehicle to collect footage of delineation practices from different vantage points. Video footage of the delineation practices at the closed-course study sites on RELLIS Campus and two field sites in Texas was collected. The first field site was located in Fort Worth, TX, and the second field site was located in Bryan, TX. Two flyover interchanges at the field site in Fort Worth, TX, had a concrete barrier with a continuous paint stripe, as shown in Figure 7, and delineator panels, as shown in Figure 8. A culvert offset 2 ft from the roadway edge at the field site in Bryan, TX, was used to collect videos of various roadside object delineation practices. Figure 9 shows the field site with delineator posts on both sides of the culvert.
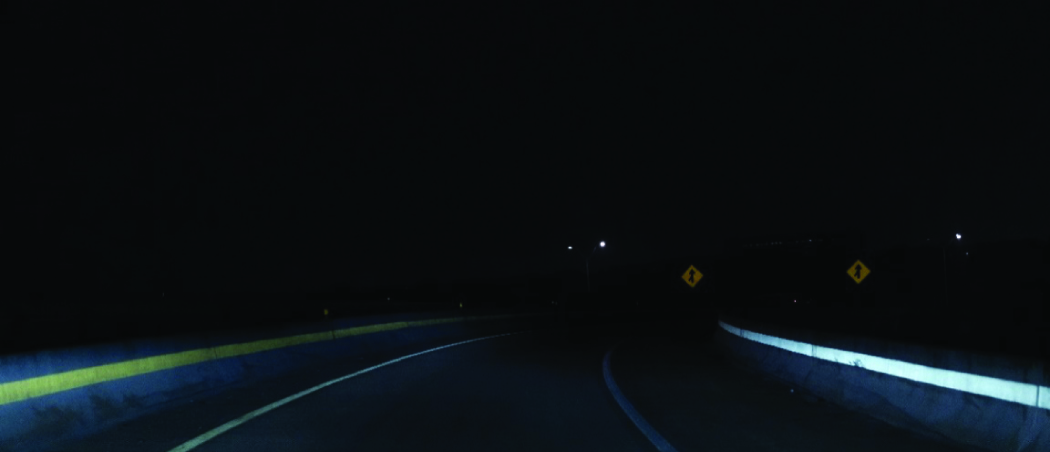
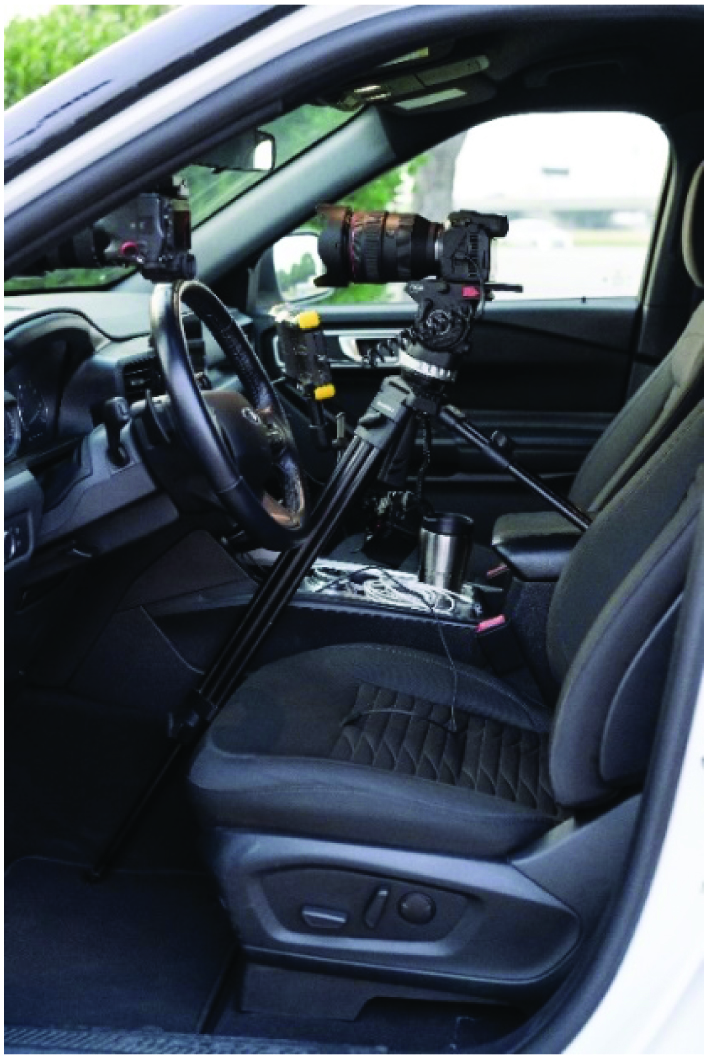
Daytime and nighttime video footage was collected at each site. The instrumented vehicle drove through the delineation practices at a speed of 40 mi/h, similar to the speed drivers were instructed to drive at through the closed-course environment. The camera locations and settings were set up to be identical at each site and to collect footage for each video. Figure 10 shows the camera locations and setup inside the vehicle.
The delineation practices that the video cameras collected footage of are listed here. Each of these practices was included in the SuperLab and survey questionnaire portions of the computer-based study.
- Roadside object (culvert)
- One, two, and three delineator posts
- One, two, and three object markers
- No delineation
- All videos collected at the field site in Bryan, TX
- Daytime and nighttime video collection for each delineation practice
- Concrete barrier
- Delineator panels
- Video footage collected at the field site in Fort Worth, TX – daytime and nighttime
- Continuous retroreflective paint stripe
- Video footage collected at the field site in Fort Worth, TX, and RELLIS Campus – daytime and nighttime
- Top-mounted and side-mounted delineators – 25- and 50-ft spacing
- Video footage collected at RELLIS Campus – daytime and nighttime
- Chevron panels (white and yellow color)
- Video footage collected at RELLIS Campus – daytime and nighttime
- No delineation
- Video footage collected at RELLIS Campus – daytime and nighttime
- Delineator panels
- Guardrail
- Delineator panels
- W-beam–mounted delineators – 25- and 50-ft spacing
- Post-mounted delineators – 25- and 50-ft spacing
- Yellow rubrail
- No delineation
- All videos collected at the RELLIS Campus
- Daytime and nighttime video collection for each delineation practice
Findings
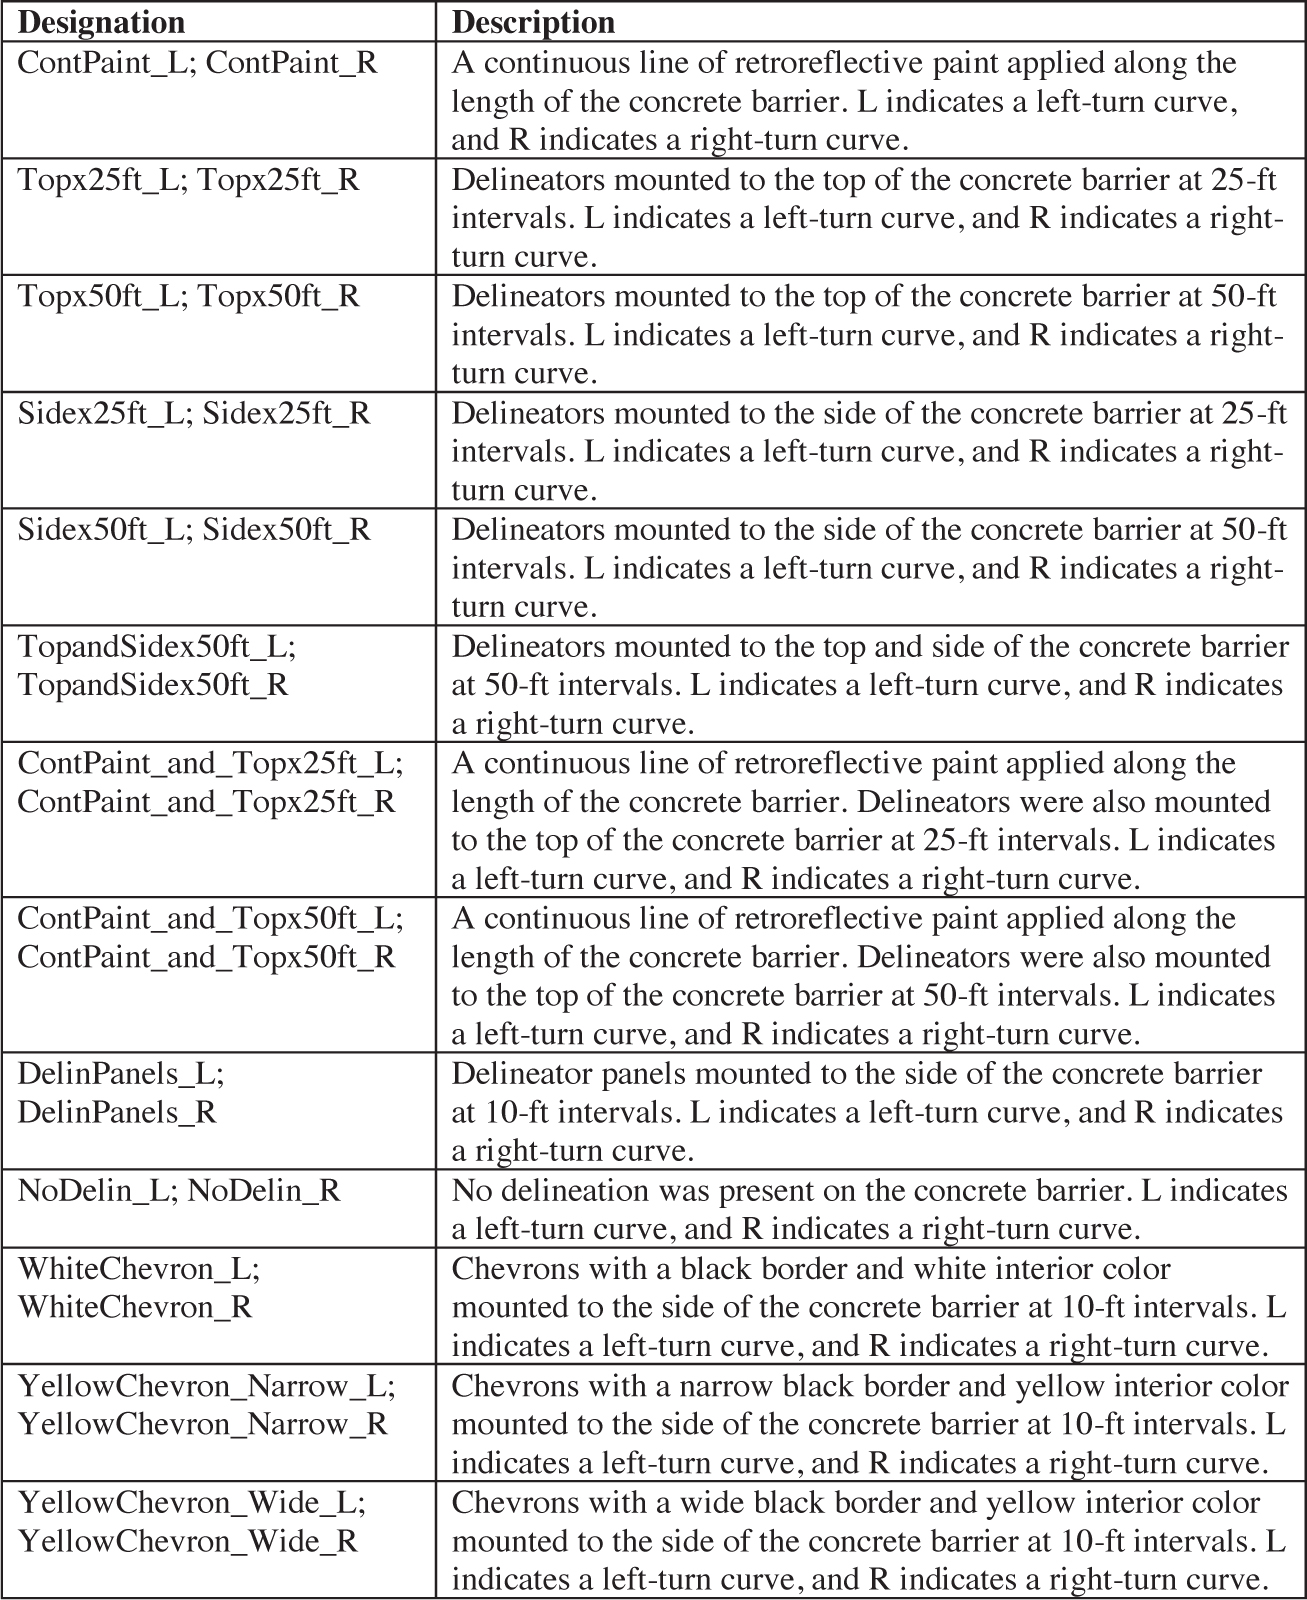
The results of the closed-course and computer-based studies are presented in this section. In total, 29 delineation practices were evaluated. For the closed-course study, 19 delineation practices were evaluated. For the computer-based study, 29 delineation practices were evaluated. Appendix C presents a description and image of each delineation practice and its evaluation method (i.e., closed-course study, computer-based study, or both). In addition, Tables 22 through 24 present abbreviated nomenclature for the delineation practices that will be referenced throughout this section.
Long Description.
The table shows two columns and 13 rows. The column headers are Designation and Description. The data given are as follows: Row 1: ContPaint_L and ContPaint_R: A continuous line of retroreflective paint applied along the length of the concrete barrier. L indicates a left turn curve, and R indicates a right turn curve. Row 2: Topx25ft_L and Topx25ft_R: Delineators mounted to the top of the concrete barrier at 25-foot intervals. L indicates a left turn curve, and R indicates a right turn curve. Row 3: Topx50ft_L and Topx50ft_R: Delineators mounted to the top of the concrete barrier at 50-foot intervals. L indicates a left turn curve, and R indicates a right turn curve. Row 4: Sidex25ft_L and Sidex25ft_R: Delineators mounted to the side of the concrete barrier at 25-foot intervals. L indicates a left turn curve, and R indicates a right turn curve. Row 5: Sidex50ft_L and Sidex50ft_R: Delineators mounted to the side of the concrete barrier at 50-foot intervals. L indicates a left turn curve, and R indicates a right turn curve. Row 6: TopandSidex50ft_L and TopandSidex50ft_R: Delineators mounted to the top and the side of the concrete barrier at 50-foot intervals. L indicates a left turn curve, and R indicates a right turn curve. Row 7: ContPaint_and_Topx25ft_L and ContPaint_and_Topx25ft_R: A continuous line of retroreflective paint applied along the length of the concrete barrier. Delineators were also mounted to the top of the concrete barrier at 25-foot intervals. L indicates a left turn curve, and R indicates a right turn curve. Row 8: ContPaint_and_Topx50ft_L and ContPaint_and_Topx50ft_R: A continuous line of retroreflective paint applied along the length of the concrete barrier. Delineators were also mounted to the top of the concrete barrier at 50-foot intervals. L indicates a left turn curve, and R indicates a right turn curve. Row 9: DelinPanels_L and DelinPanels_R: Delineator panels mounted to the side of the concrete barrier at 10-foot intervals. L indicates a left turn curve, and R indicates a right turn curve. Row 10: NoDelin_L and NoDelin_R: No delineation was present on the concrete barrier. L indicates a left turn curve, and R indicates a right turn curve. Row 11: WhiteChevron_L and WhiteChevron_R: Chevrons with a black border and white interior color mounted to the side of the concrete barrier at 10-foot intervals. L indicates a left turn curve, and R indicates a right turn curve. Row 12: YellowChevron_Narrow_L and YellowChevron_Narrow_R: Chevrons with a narrow black border and yellow interior color mounted to the side of the concrete barrier at 10-foot intervals. L indicates a left turn curve, and R indicates a right turn curve. Row 13: YellowChevron_Wide_L and YellowChevron_Wide_R: Chevrons with a wide black border and yellow interior color mounted to the side of the concrete barrier at 10-foot intervals. L indicates a left turn curve, and R indicates a right turn curve.
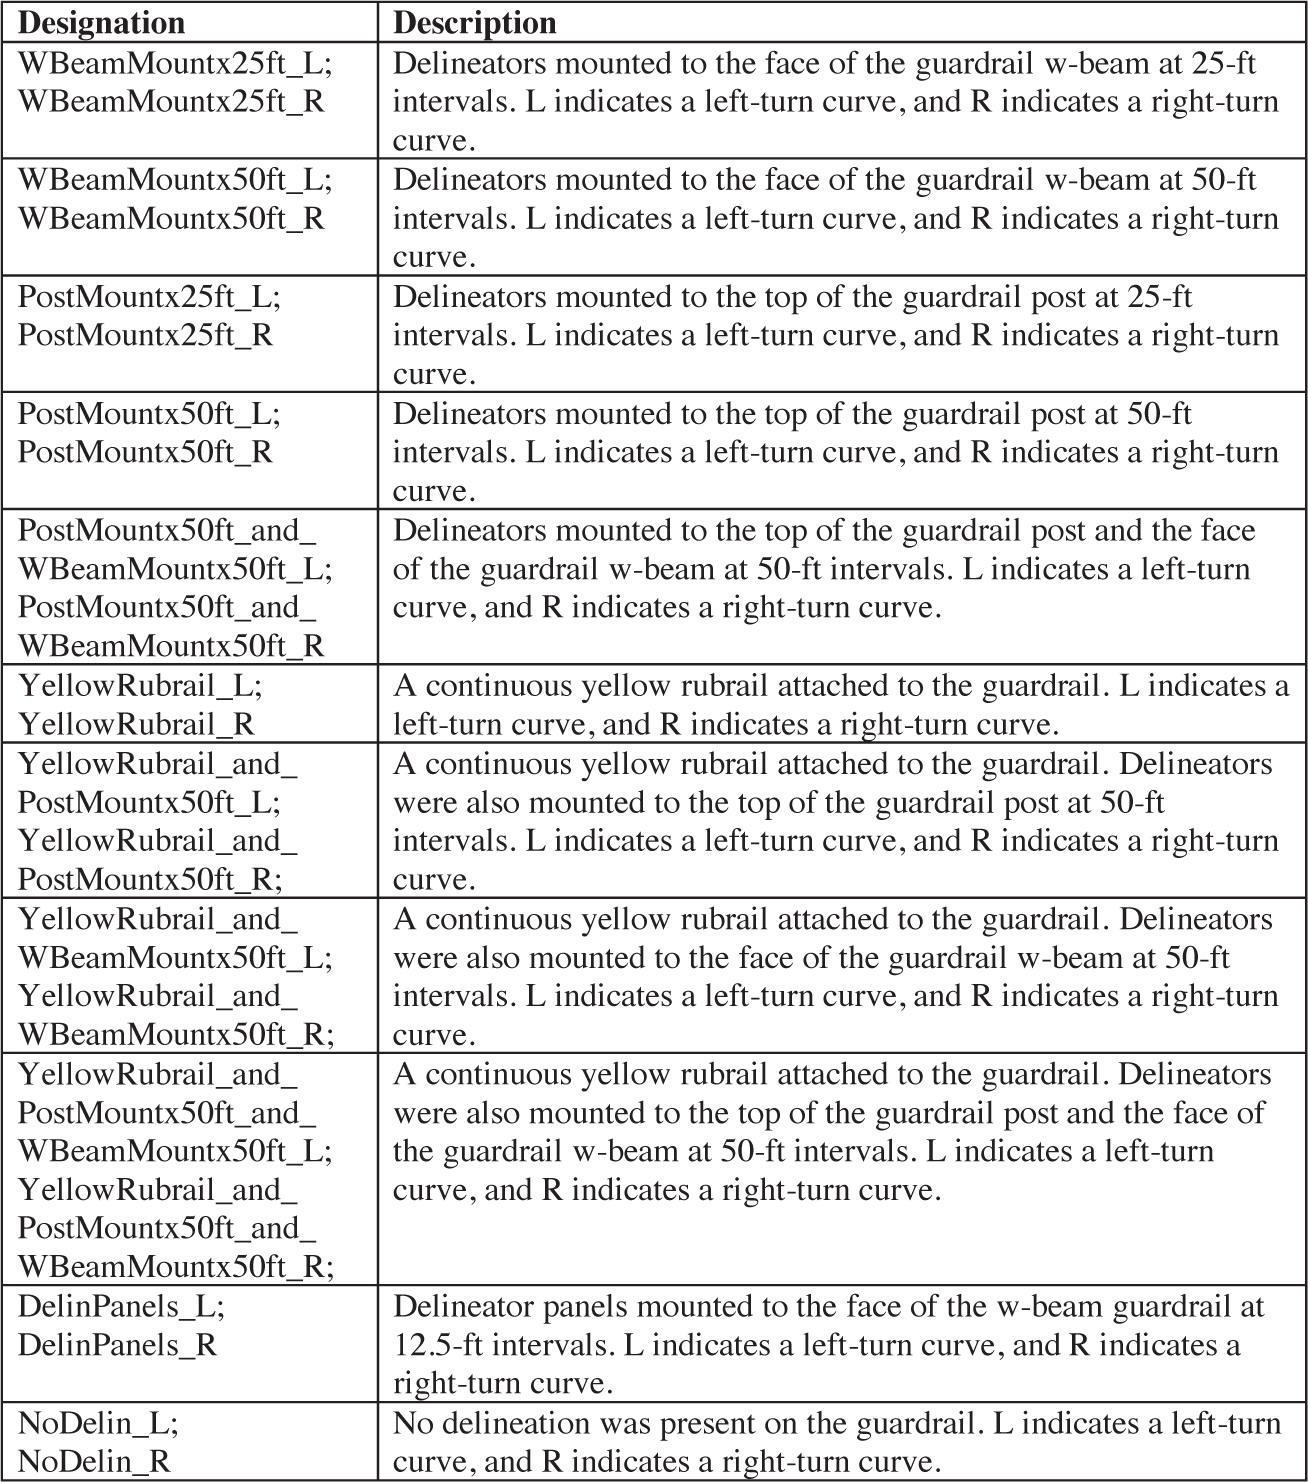
Long Description.
The table shows two columns and 11 rows. The column headers are Designation and Description. The data given are as follows: Row 1: WBeamMountx25ft_L and WBeamMountx25ft_R: Delineators mounted to the face of the guardrail W-Beam at 25-foot intervals. L indicates a left turn curve, and R indicates a right turn curve. Row 2: WBeamMountx50ft_L and WBeamMountx50ft_R: Delineators mounted to the face of the guardrail W-Beam at 50-foot intervals. L indicates a left turn curve, and R indicates a right turn curve. Row 3: PostMountx25ft_L and PostMountx25ft_R: Delineators mounted to the top of the guardrail post at 25-foot intervals. L indicates a left turn curve, and R indicates a right turn curve. Row 4: PostMountx50ft_L and PostMountx50ft_R: Delineators mounted to the top of the guardrail post at 50-foot intervals. L indicates a left turn curve, and R indicates a right turn curve. Row 5: PostMountx50ft_and_WBeamMountx50ft_L and PostMountx50ft_and_WBeamMountx50ft_R: Delineators mounted to the top of the guardrail post and the face of the guardrail W-Beam at 50-foot intervals. L indicates a left turn curve, and R indicates a right turn curve. Row 6: YellowRubrail_L and YellowRubrail_R: A continuous yellow rubrail attached to the guardrail. L indicates a left turn curve, and R indicates a right turn curve. Row 7: YellowRubrail_and_PostMountx50ft_L and YellowRubrail_and_PostMountx50ft_R: A continuous yellow rubrail attached to the guardrail. Delineators were also mounted to the top of the guardrail post at 50-foot intervals. L indicates a left turn curve, and R indicates a right turn curve. Row 8: YellowRubrail_and_WBeamMountx50ft_L and YellowRubrail_and_WBeamMountx50ft_R: A continuous yellow rubrail attached to the guardrail. Delineators were also mounted to the face of the guardrail W-Beam at 50-foot intervals. L indicates a left turn curve, and R indicates a right turn curve. Row 9: YellowRubrail_and_PostMountx50ft_and_WBeamMountx50ft_L and YellowRubrail_and_PostMountx50ft_and_WBeamMountx50ft_R: A continuous yellow rubrail attached to the guardrail. Delineators were also mounted to the top of the guardrail post and the face of the guardrail W-Beam at 50-foot intervals. L indicates a left turn curve, and R indicates a right turn curve. Row 10: DelinPanels_L and DelinPanels_R: Delineator panels mounted to the face of the W-Beam guardrail at 12.5-foot intervals. L indicates a left turn curve, and R indicates a right turn curve. Row 11: NoDelin_L and NoDelin_R: No delineation was present on the guardrail. L indicates a left turn curve, and R indicates a right turn curve.
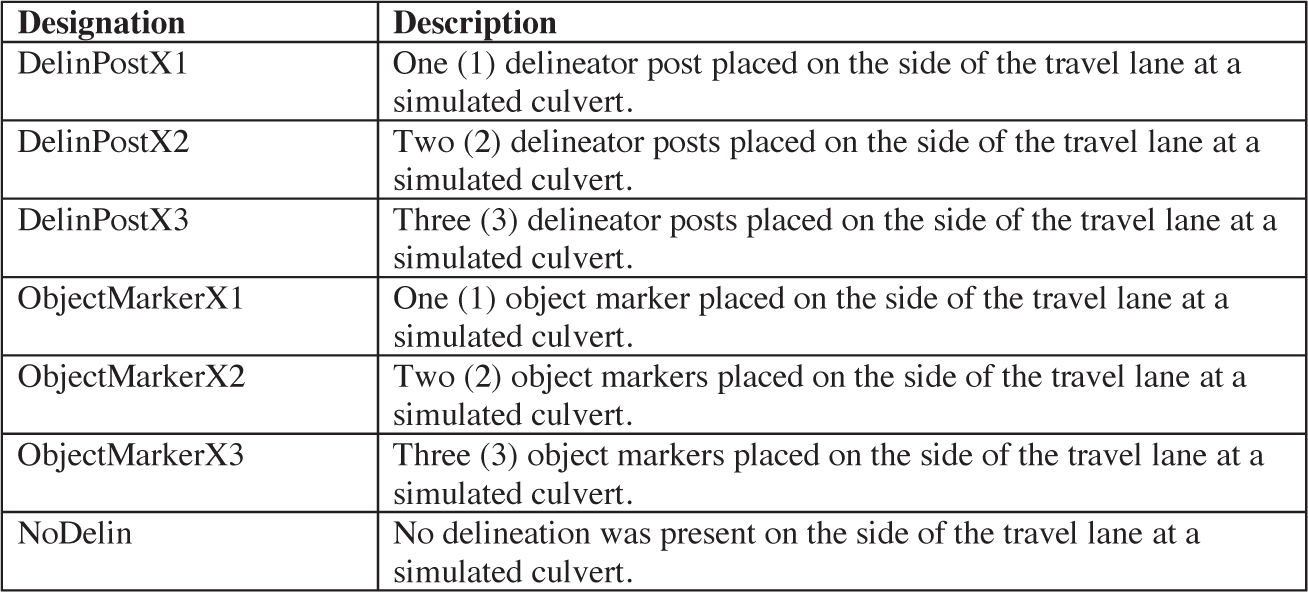
Long Description.
The table shows two columns and seven rows. The column headers are Designation and Description. The data given are as follows: Row 1: DelinPostX1: A single delineator post placed on the side of the travel lane at a simulated culvert. Row 2: DelinPostX2: Two delineator posts placed on the side of the travel lane at a simulated culvert. Row 3: DelinPostX3: Three delineator posts placed on the side of the travel lane at a simulated culvert. Row 4: ObjectMarkerX1: A single object marker placed on the side of the travel lane at a simulated culvert. Row 5: ObjectMarkerX2: Two object markers placed on the side of the travel lane at a simulated culvert. Row 6: ObjectMarkerX3: Three object markers placed on the side of the travel lane at a simulated culvert. Row 7: NoDelin: No delineation was present on the side of the travel lane at a simulated culvert.
Closed-Course Study
In the closed-course study, 41 participants were recruited to drive an instrumented vehicle through the closed course and react to different delineation practices. The closed course included two main curve sections with a concrete barrier and guardrail. Different delineation practices were applied to each roadside hardware system. A tangent section of the course was set up to represent a roadside object, and different delineation practices were applied at that location.
Each participant was instructed to drive the instrumented vehicle at a speed of 40 mi/h and call out the direction of the curve ahead as soon as they determined the direction of the curve with certainty. A TTI employee sat in the back row of the vehicle and pushed the button as soon as the driver called out each curve direction. A response–time delay was collected before the participants entered the vehicle and was later applied to the collected data to correct for perception–reaction delay.
Participants drove through the closed course starting with left- or right-turn curves. Once the first part of the lap was complete, participants drove through the course in the reverse direction. After the first lap was completed, the delineation practice was changed. Participants then completed a second lap driving in both directions again.
Data Post-Processing
During the closed-course study, three main types of data were collected:
- Vehicle data using an onboard data acquisition system (i.e., Dewetron). These data were collected at a frequency of 200 Hz and included location (i.e., latitude and longitude), speed, acceleration, brake pedal pressure, throttle pedal pressure, and steering angle.
- Curve or roadside culvert detection distance. These data were collected by a TTI employee pressing a button connected to the Dewetron system, which would record when each driver called out the curve direction.
- Eye tracking using a vehicle-mounted advanced eye-tracking system (i.e., Smart Eye with iMotions software). These data included dwell counts (i.e., the number of times a driver looked at each area of interest) and dwell times (i.e., the length of time a driver looked at each area of interest), among other variables.
Each participantʼs vehicle data were output and processed to determine the driverʼs performance metrics. These metrics included the following:
- Throttle release distance from the start of the curve
- First brake applied distance from the start of the curve
- Average speed along the length of the curve
- Average brake pressure along the length of the curve
- Maximum brake pressure in the curve
- Average throttle pressure along the length of the curve
- Maximum throttle pressure in the curve
- Average steering angle along the length of the curve
These data were only collected for the guardrail and concrete barrier delineation practices. Only the detection distance was collected and processed for the culvert delineation practices. Three performance metrics analyzed driver behavior prior to the driver entering the curve: (1) curve detection distance, (2) throttle release distance, and (3) brake distance. The remaining metrics analyzed driver behavior in the curve.
Whisker and box plots were produced for each performance metric to visualize the dataset and performance metrics. This approach allowed for a general understanding of the distribution
of the datasets. For the three metrics analyzing driver behavior prior to the curve (i.e., curve detection distance, throttle release distance, and braking distance) and one of the metrics analyzing driver behavior in the curve (i.e., average speed along the length of the curve), statistical models were used to evaluate the dataset further. Multiple linear regression models were developed and applied to evaluate the effects of the delineation practices and other parameters on the four performance metrics. The general form for the multiple regression models was as follows:
 (7)
(7)
The dependent variable (Y) represents the performance metric. The dependent variables (X1, X2, X3, . . . , Xk) consist of the delineation practices, driver demographics (e.g., age, gender), and curve direction. The coefficients (β1, β2, β3, . . . , βk) and error term (ε) in the model were estimated using the ordinary least squares method. A different model was developed for each of the four performance metrics.
The eye-tracking data were processed for each participant as they approached and passed the guardrail and concrete barrier curve locations. No eye-tracking data were processed for the roadside culvert location. The entire roadside barrier and delineation practice were marked with boxes as areas of interest. The data output allowed for identifying when a participantʼs eye focus was aligned with the area of interest or when it was focused on the roadway. Figure 11 shows an example of a participant looking at the area of interest. Figure 12 shows an example of a participant looking at the roadway instead of the area of interest. These areas constantly changed as drivers approached the curve locations and progressed through the curves. Areas of interest were captured at several locations along the length of the curve. The software allowed interpolation between these locations to continuously evaluate participantsʼ eye focus as they traversed through the curve. Data processing was initiated 100 ft in advance of the curve. However,
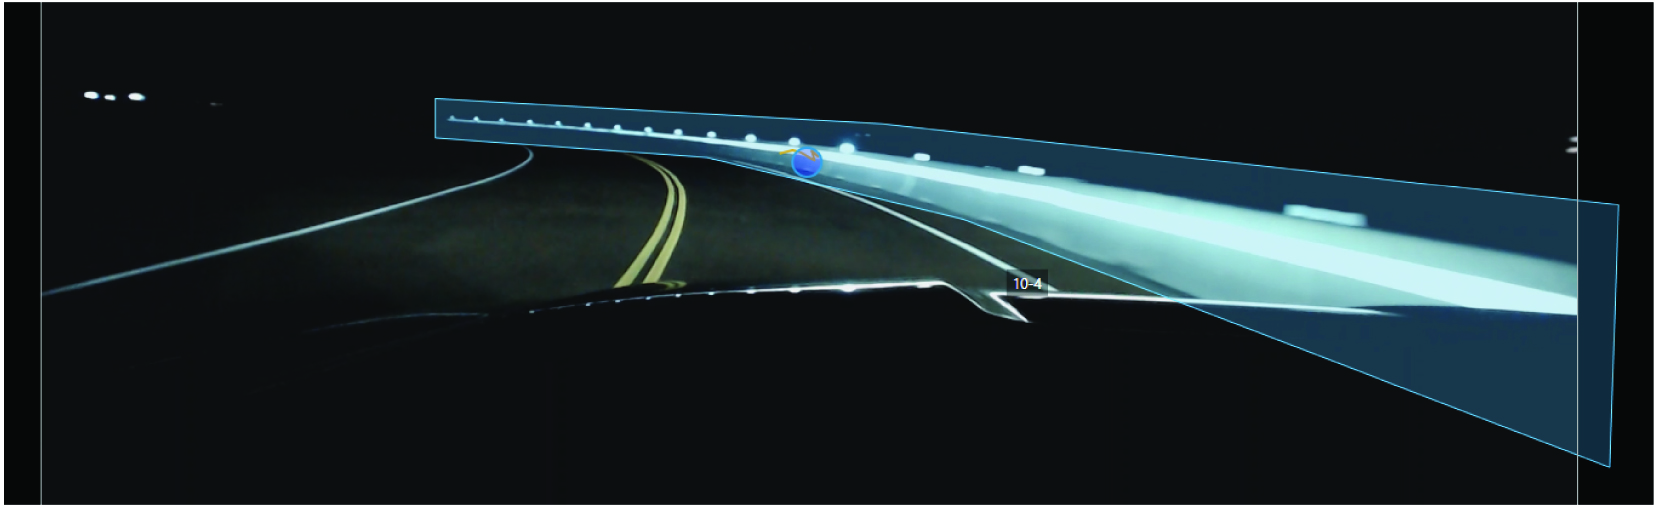
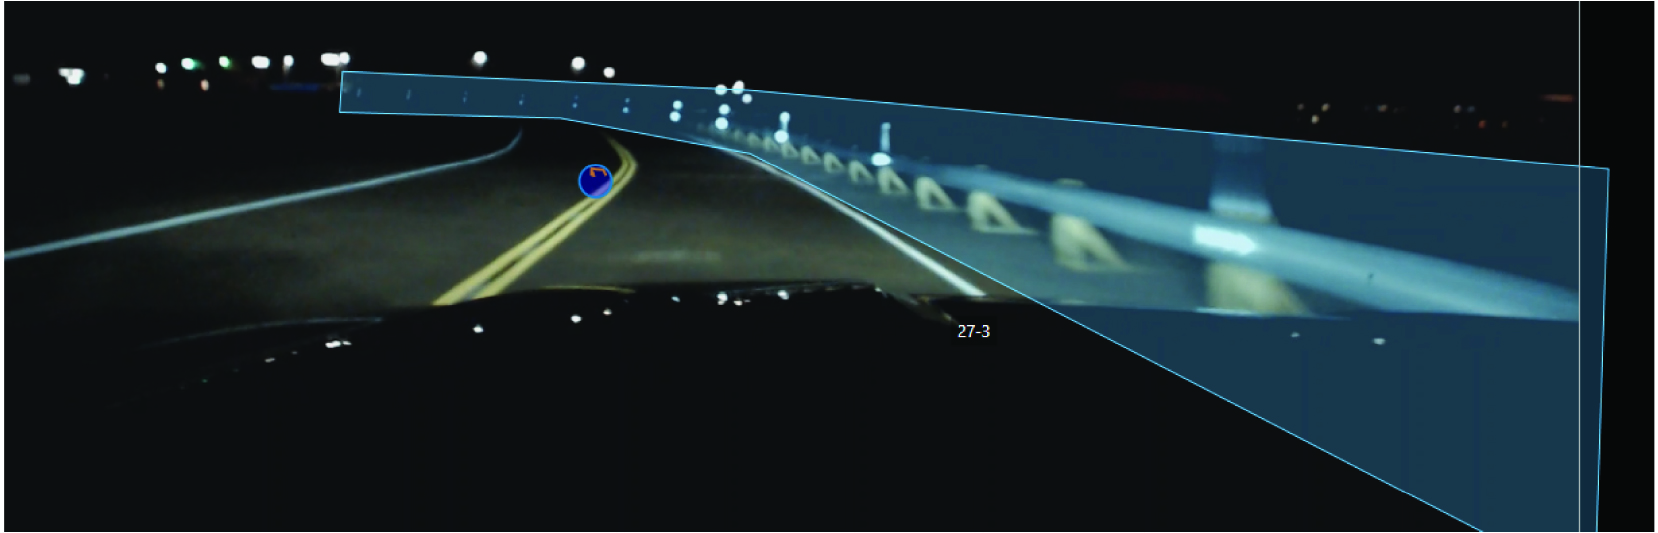
the software failed to differentiate whether the driverʼs gaze was focused on the roadway or the roadside hardware at distances greater than 100 ft from the roadside hardware, resulting in difficult post-processing.
Two main variables were output from the eye-tracking data: dwell count and dwell time. Dwell count represents the number of times each participant looked at the area of interest while driving through the curve. Dwell time represents the average time participants looked at each area of interest while driving through the curve. The dwell count and dwell time performance metrics were analyzed as part of driver behavior in the curve. The same multiple linear regression analysis used for the four vehicle performance metrics was applied to the two eye tracker performance metrics.
Results – Driver Behavior Prior to the Curve
Curve Detection Distance
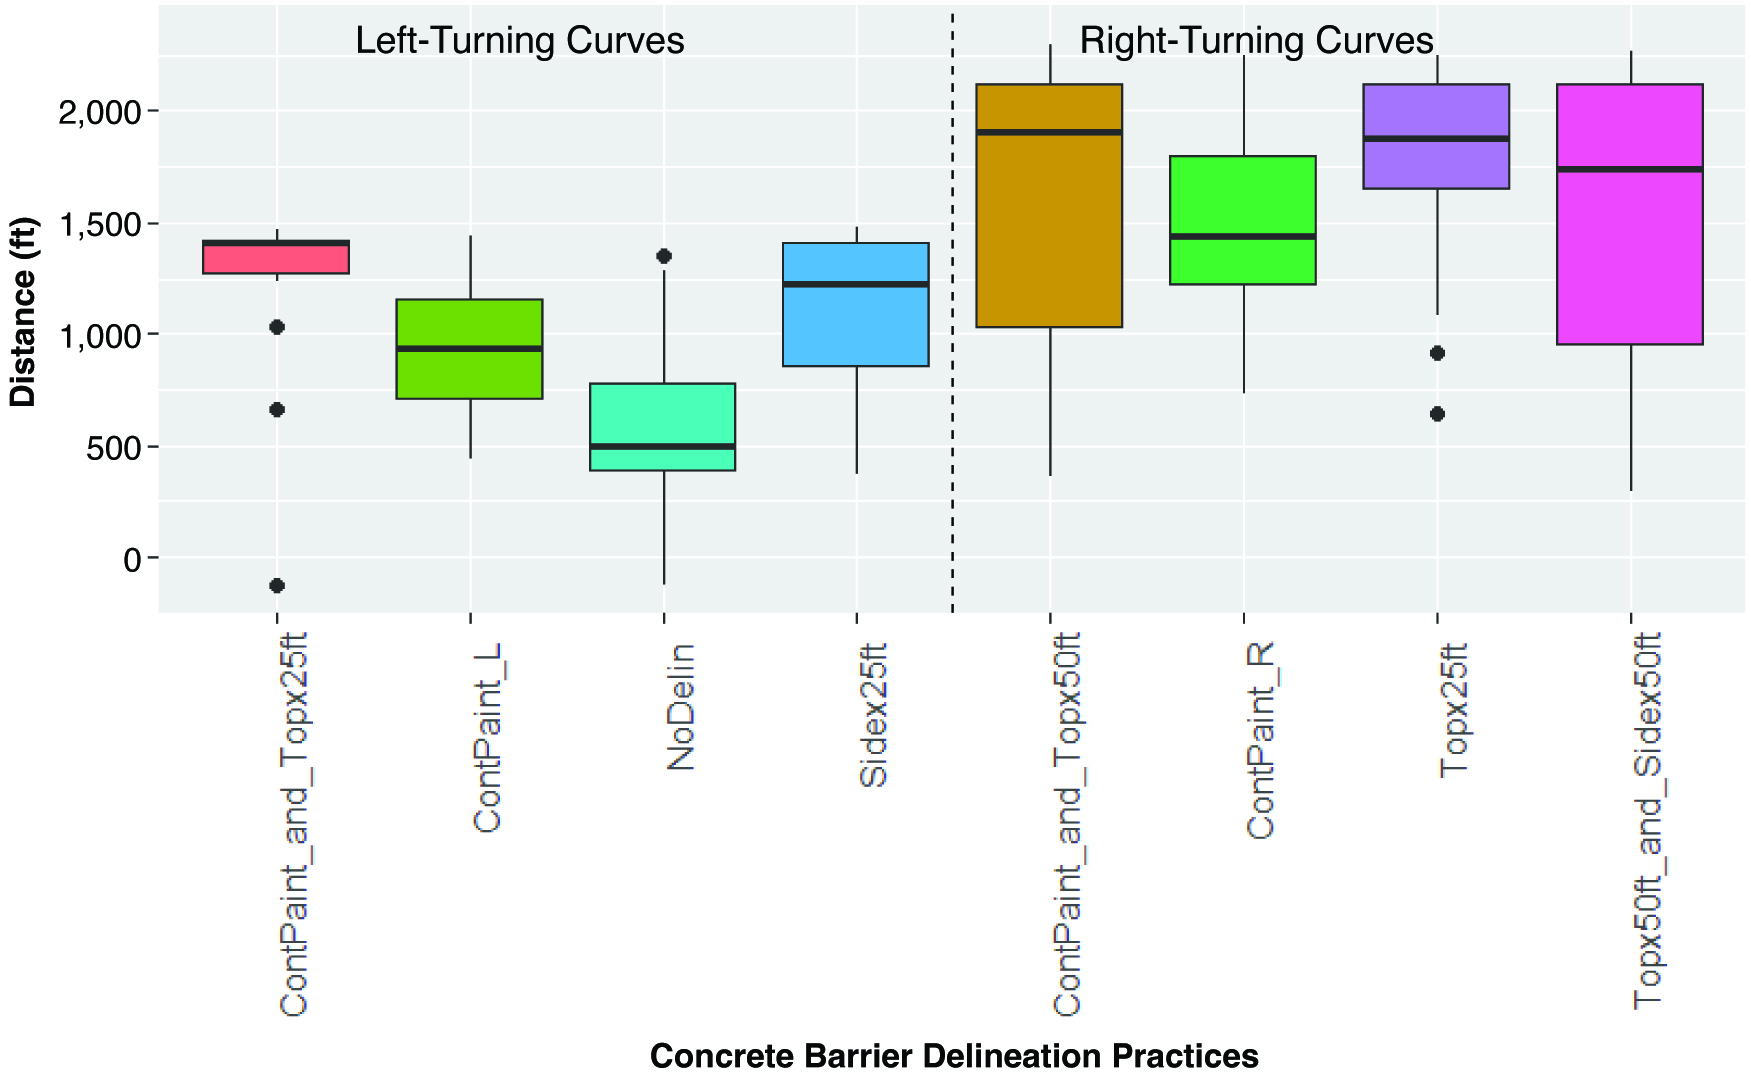
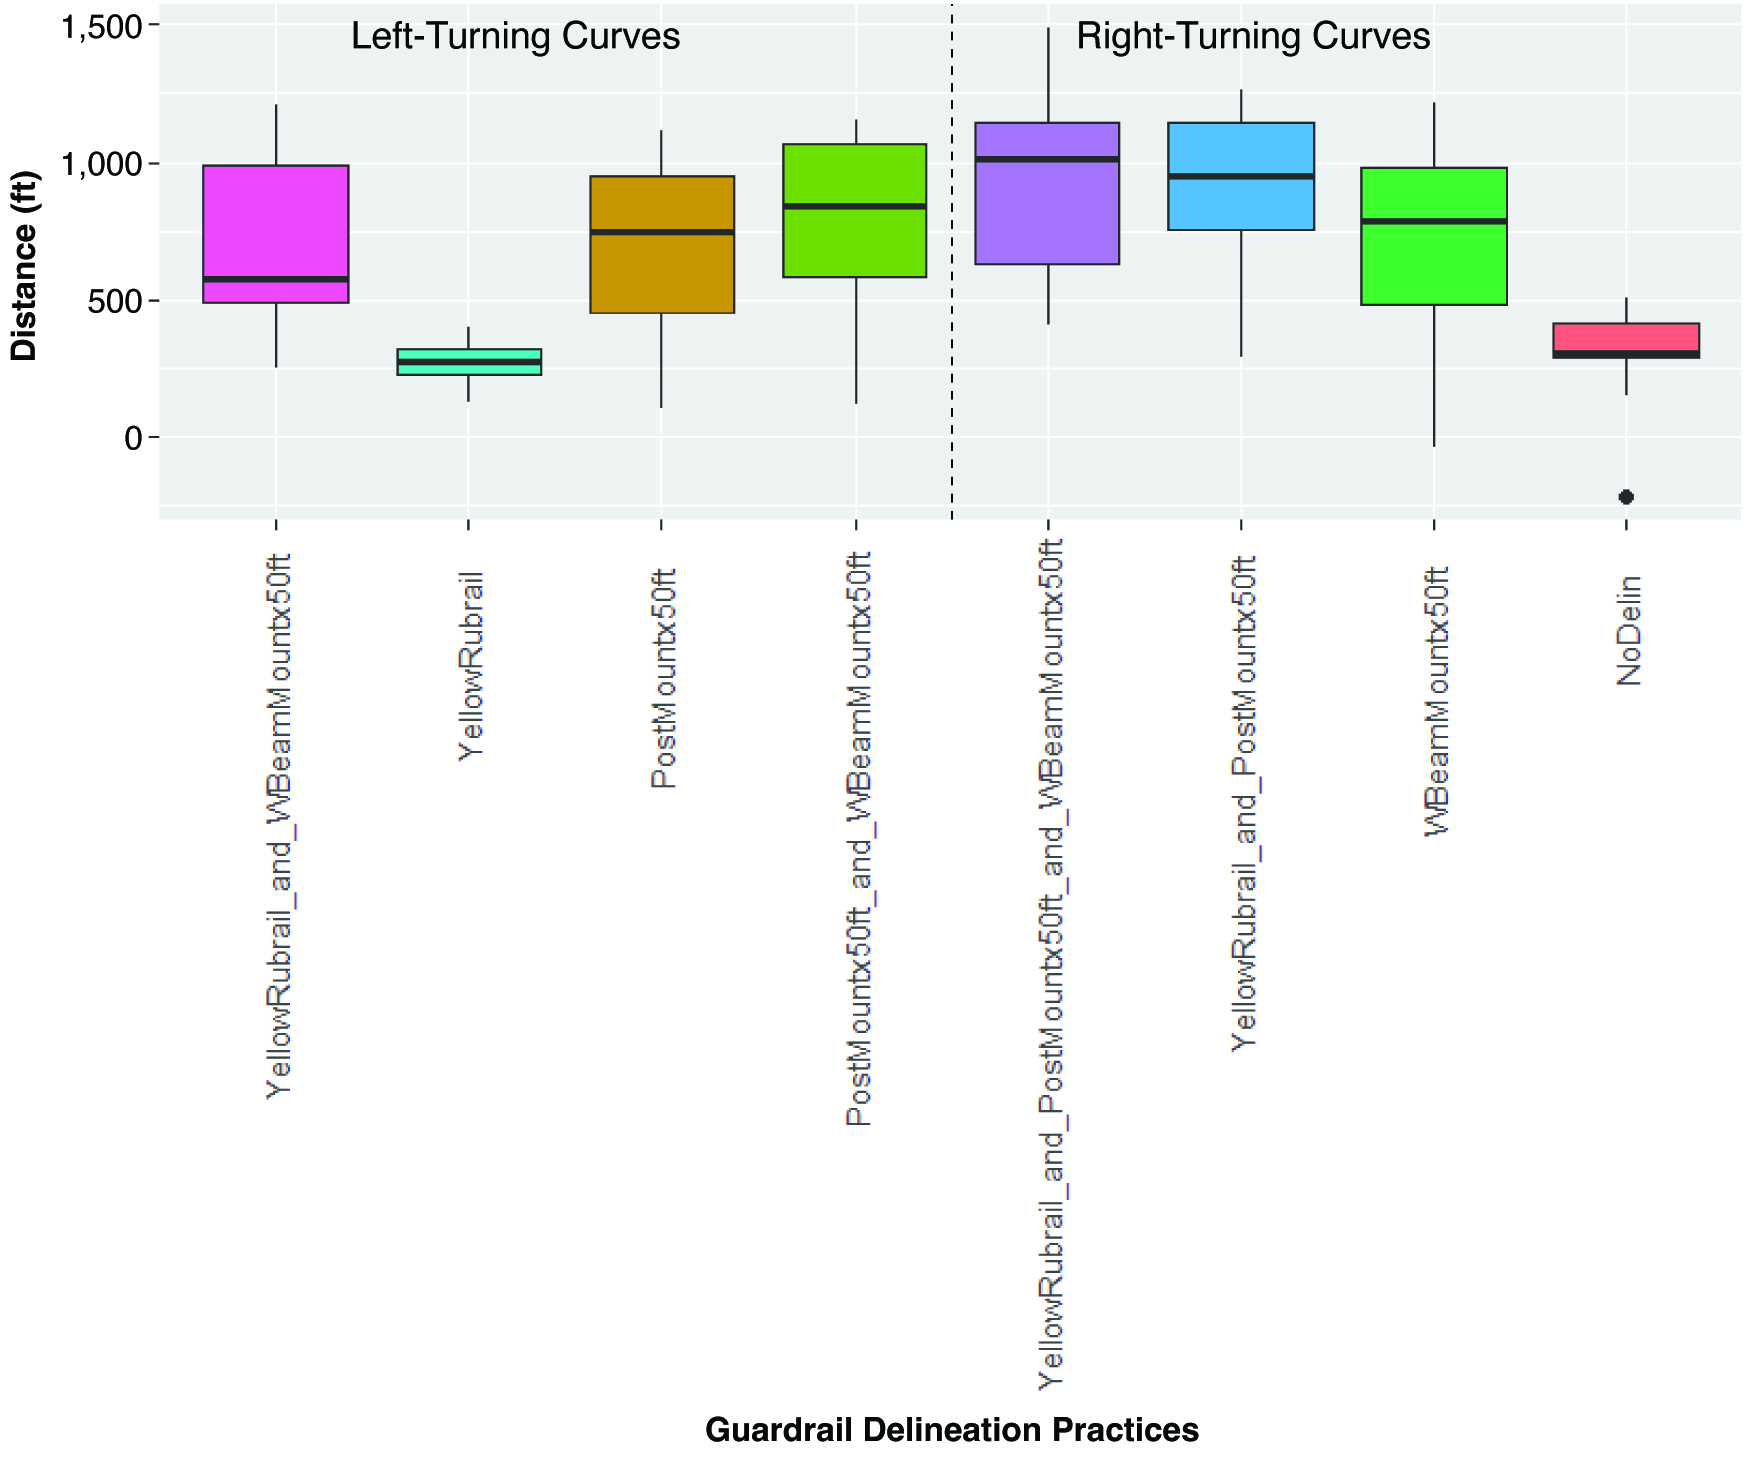
The average curve detection distance for concrete barrier delineation practices is presented in Figure 13. This distance was determined to be the location at which participants identified the curve direction prior to the start of the curve. If participants identified the curve direction while in the curve, the detection distance was recorded as a negative distance value. A noticeable difference in the detection distance of delineation practices was detected when comparing left- and right-turn curves. This difference was likely an effect caused by the closed-course layout. Driver participants who approached the concrete barrier curve as a left turn had less approach distance than the right-turn curve. Thus, the detection distance was directly limited by the course layout. The lack of delineation (i.e., no delineation) resulted in the lowest average detection distances. The presence of top-mounted delineators resulted in the highest detection distances for left- and right-turn curves. The average curve detection distance for guardrail delineation practices is presented in Figure 14. No significant difference seemed to be present in the curve detection distance between left- and right-turn curves. The yellow rubrail and no-delineation
Long Description.
The graph is separated into two sections: Left-Turning Curves and Right-Turning Curves. The horizontal axis is labeled Concrete Barrier Delineation Practices. The vertical axis shows the distance (feet) ranging from 0 to 2000 in increments of 500. The data provided for each road condition is presented as a set of six estimated values (Minimum, First Quartile, Median, Third Quartile, Maximum, and Outliers). For Left-Turning Curves: ContPaint_and_Topx25ft (1000, 1300, 1400, 1450, 1500; outliers negative 50, 700, 1000); ContPaint_L (600, 750, 950, 1200, 1350; outliers None); NoDelin (0, 400, 500, 800, 1100; outlier 1350); and Sidex25ft (800, 850, 1250, 1400, 1450; outliers None). For Right-Turning Curves: ContPaint_and_Topx50ft (700, 1000, 1900, 2100, 2200; outliers None); ContPaint_R (1100, 1250, 1450, 1800, 1850; outliers None); Topx25ft (1200, 1700, 1850, 1950, 2050; outliers 650, 950); and Topx50ft_and_Sidex50ft (800, 950, 1750, 2000, 2100; outliers None). Note that the values mentioned are approximate.
Long Description.
The graph is separated into two sections: Left-Turning Curves and Right-Turning Curves. The horizontal axis is labeled Guardrail Delineation Practices. The vertical axis shows the distance (feet) ranging from 0 to 1500 in increments of 500. The data provided for each road condition is presented as a set of six estimated values (Minimum, First Quartile, Median, Third Quartile, Maximum, and Outliers). For Left-Turning Curves: YellowRubrail_and_WBeamMountx50ft (500, 500, 600, 1000, 1200; outliers None); YellowRubrail (250, 300, 300, 350, 400; outliers None); PostMountx50ft (400, 700, 800, 1000, 1100; outliers None); and PostMountx50ft_and_WBeamMountx50ft (550, 700, 900, 1050, 1150; outliers None). For Right-Turning Curves: YellowRubrail_and_PostMountx50ft_and_WBeamMountx50ft (650, 700, 1000, 1150, 1200; outliers None); YellowRubrail_and_PostMountx50ft (700, 900, 1000, 1150, 1200; outliers None); WBeamMountx50ft (500, 550, 800, 1000, 1050; outliers None); and NoDelin (300, 350, 350, 450, 500; outlier negative 100). Note that the values mentioned are approximate. The x-axis label reads Guardrail Delineation Practices.
practices resulted in the lowest curve detection distances. The presence of post-mounted delineators tended to result in higher curve detection distances.
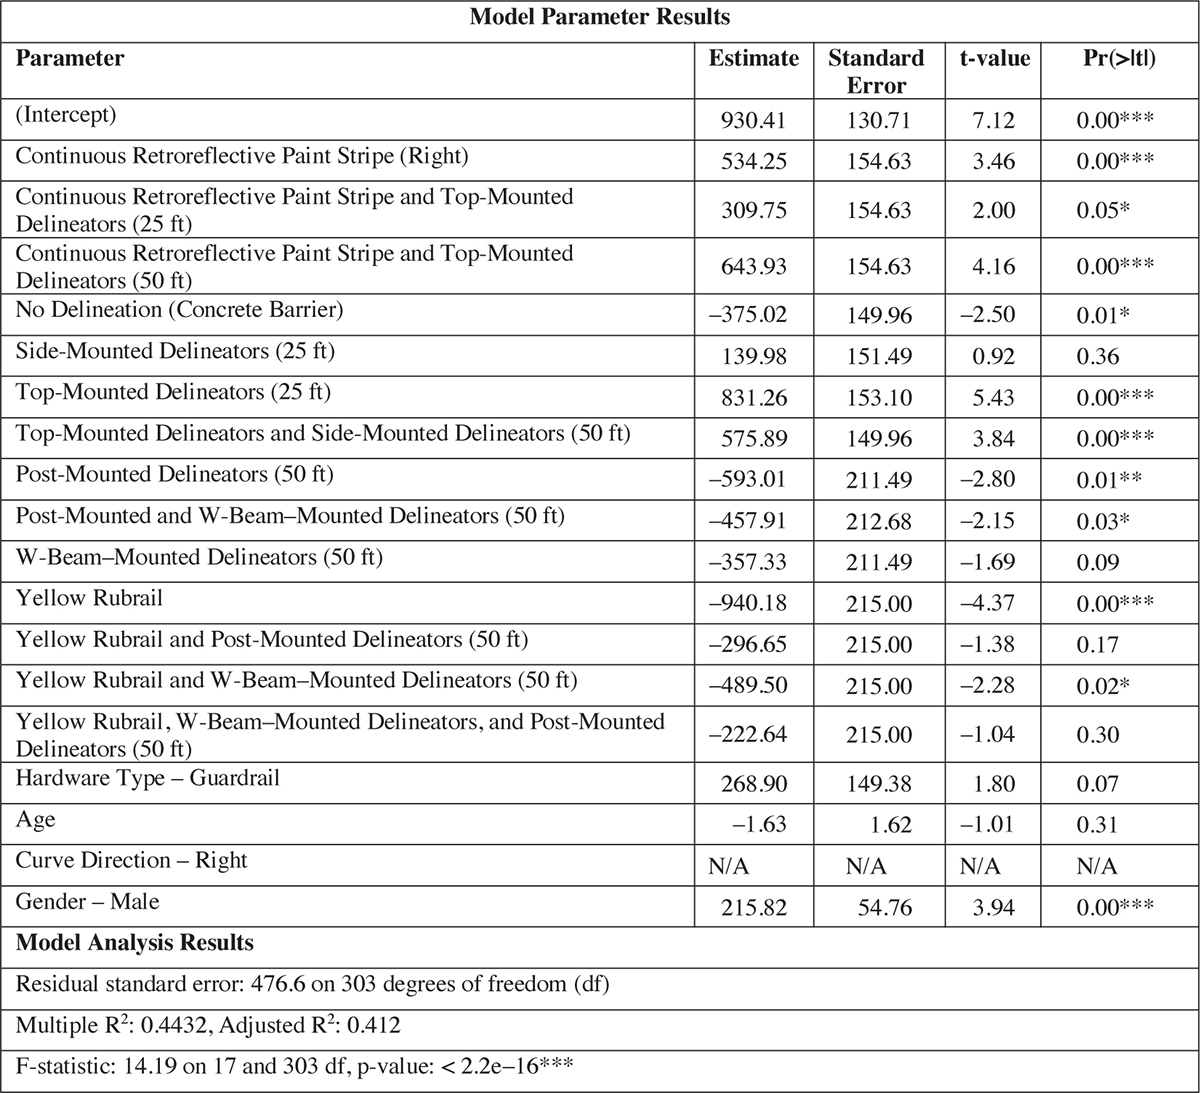
A multiple regression analysis was conducted to investigate the impact of various parameters on curve detection distance. The parameters included in the analysis were delineation practice, hardware type (i.e., concrete barrier or guardrail), age, curve direction, and gender. The reference parameters were continuous retroreflective paint stripe, concrete barrier, age, left-turn curve, and female gender. The model parameters and analysis are summarized in Table 25.
The analysis indicated a strong fit (Adjusted R2 = 0.412) and was statistically significant (p < 0.001), suggesting that the included parameters collectively explain a meaningful portion of the variance in curve detection distance. Several concrete barrier delineation practices were found to be statistically significant. These practices included top-mounted delineators spaced at 25 ft, continuous retroreflective paint stripe, continuous retroreflective paint stripe and top-mounted delineators spaced at 25 ft, continuous retroreflective paint stripe and top-mounted delineators spaced at 50 ft, and top-mounted and side-mounted delineators spaced at 50 ft. All of these statistically significant practices resulted in increased detection distances. Thus, the presence of the top-mounted delineators and continuous retroreflective paint stripe substantially enhanced the participantsʼ curve detection distance. The no-delineation practice was statistically significant for a reduction in curve detection distance.
*** 0 < p-value ≤ 0.001
** 0.001 < p-value ≤ 0.01
* 0.01 < p-value ≤ 0.05
Long Description.
The table displays two sections: Model Parameter Results and Model Analysis Results. The first section shows five columns and 19 rows. The column headers from the second column are as follows: estimate, standard error, t value, and p value derived from the t-test. The data given are as follows: Row 1: (Intercept): 930.41, 130.71, 7.12, and 0.00 (The p-value is less than or equal to 0.001, but greater than 0). Row 2: Continuous Retroreflective Paint Stripe (Right): 534.25, 154.63, 3.46, and 0.00 (The p-value is less than or equal to 0.001, but greater than 0). Row 3: Continuous Retroreflective Paint Stripe and Top-Mounted Delineators (25 feet): 309.75, 154.63, 2.00, and 0.05 (The p-value is less than or equal to 0.05, but greater than 0.01). Row 4: Continuous Retroreflective Paint Stripe and Top-Mounted Delineators (50 feet): 643.93, 154.63, 4.16, and 0.00 (The p-value is less than or equal to 0.001, but greater than 0). Row 5: No Delineation (Concrete Barrier): negative 375.02, 149.96, negative 2.50, and 0.01 (The p-value is less than or equal to 0.05, but greater than 0.01). Row 6: Side-Mounted Delineators (25 feet): 139.98, 151.49, 0.92, and 0.36. Row 7: Top-Mounted Delineators (25 feet): 831.26, 153.10, 5.43, and 0.00 (The p-value is less than or equal to 0.001, but greater than 0). Row 8: Top-Mounted Delineators and Side-Mounted Delineators (50 feet): 575.89, 149.96, 3.84, and 0.00 (The p-value is less than or equal to 0.001, but greater than 0). Row 9: Post-Mounted Delineators (50 feet): negative 593.01, 211.49, negative 2.80, and 0.01 (The p-value is less than or equal to 0.05, but greater than 0.01). Row 10: Post-Mounted and W-Beam-Mounted Delineators (50 feet): negative 457.91, 212.68, negative 2.15, and 0.03 (The p-value is less than or equal to 0.05, but greater than 0.01). Row 11: W-Beam-Mounted Delineators (50 feet): negative 357.33, 211.49, negative 1.69, and 0.09. Row 12: Yellow Rubrail: negative 940.18, 215.00, negative 4.37, and 0.00 (The p-value is less than or equal to 0.001, but greater than 0). Row 13: Yellow Rubrail and Post-Mounted Delineators (50 feet): negative 296.65, 215.00, negative 1.38, and 0.17. Row 14: Yellow Rubrail and W-Beam-Mounted Delineators (50 feet): negative 489.50, 215.00, negative 2.28, and 0.02 (The p-value is less than or equal to 0.05, but greater than 0.01). Row 15: Yellow Rubrail, W-Beam-Mounted Delineators, and Post-Mounted Delineators (50 feet): negative 222.64, 215.00, negative 1.04, and 0.30. Row 16: Hardware Type - Guardrail: 268.90, 149.38, 1.80, and 0.07. Row 17: Age: negative 1.63, 1.62, negative 1.01, and 0.31. Row 18: Curve Direction - Right: Not Applicable, Not Applicable, Not Applicable, and Not Applicable. Row 19: Gender - Male: 215.82, 54.76, 3.94, and 0.00 (The p-value is less than or equal to 0.001, but greater than 0). The second section of the table shows 3 rows. The data given are as follows: Row 1: Residual standard error: 476.6 on 303 degrees of freedom. Row 2: Multiple R-squared: 0.4432, and Adjusted R-squared: 0.412. Row 3: F-statistic: 14.19 on 17 and 303 DF, p-value: less than 2.2 exponent minus 16 (The p-value is less than or equal to 0.001, but greater than 0).
Most of the guardrail delineation practices with post-mounted delineators resulted in a statistically significant increase in curve detection distance. No-delineation and yellow rubrail delineation practices were associated with statistically significant decreases in detection distance. Beyond delineation practice effects, gender was a significant predictor (p < 0.001), with male drivers detecting the curves 216 ft earlier in the driving route than female drivers, suggesting a potential difference in response timing or decision confidence. Age and curve direction were not significant predictors.
Culvert Detection Distance
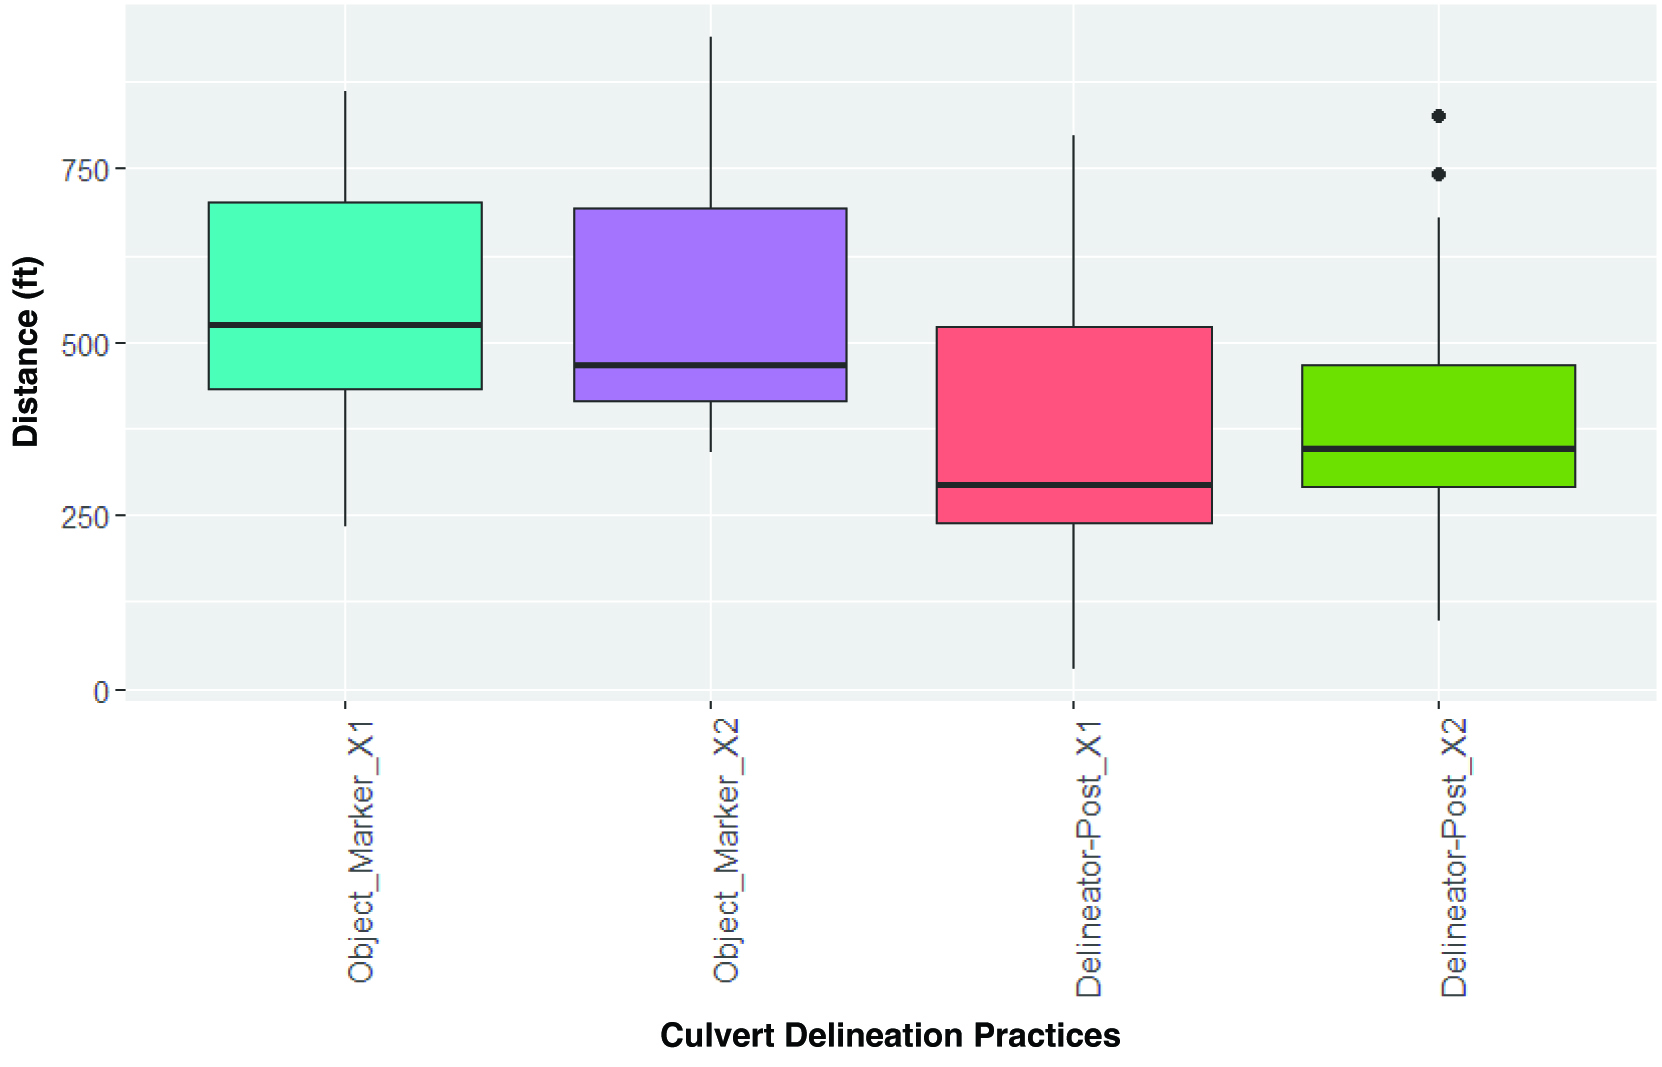
The average culvert detection distance for culvert delineation practices is presented in Figure 15. This distance was determined to be the location at which participants identified the presence of a roadside object (i.e., a culvert) in advance of the location of the simulated culvert. The object markers were identified at a longer distance compared to the delineator posts. When considering the effect of one or two object markers or delineator posts, no significance was found in detection distance.
Long Description.
The horizontal axis is labeled Culvert Delineation Practices. The vertical axis shows the distance (feet) ranging from 0 to 750 in increments of 250. The data provided for each road condition is presented as a set of six estimated values (Minimum, First Quartile, Median, Third Quartile, Maximum, and Outliers). For the conditions shown: Object_Marker_X1 (250, 425, 525, 700, 850; outliers None); Object_Marker_X2 (300, 400, 475, 700, 950; outliers None); Delineator-Post_X1 (0, 250, 300, 525, 775; outliers None); and Delineator-Post_X2 (25, 300, 375, 475, 700; outliers 750, 800). Note that the values mentioned are approximate. The x-axis label reads Culvert Delineation Practices.
Throttle Release Distance
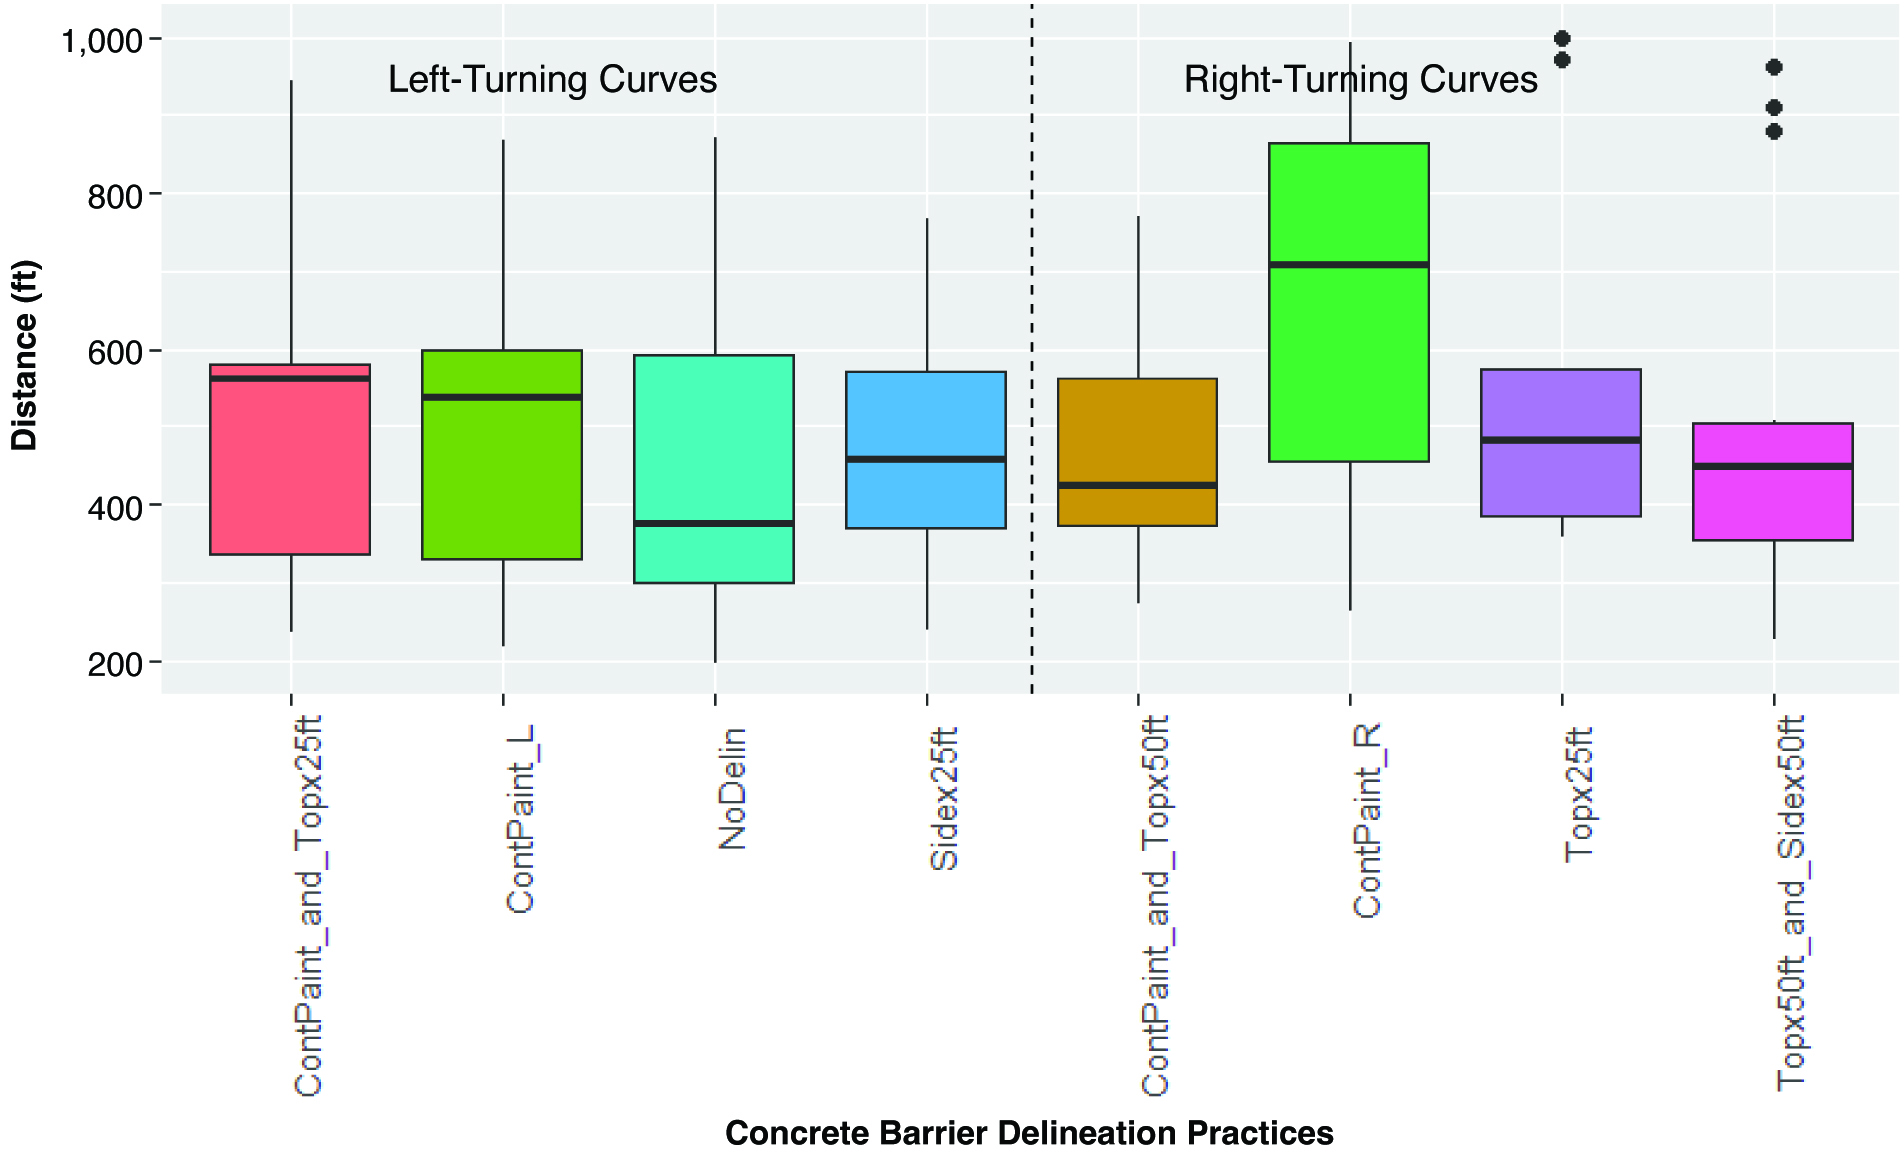
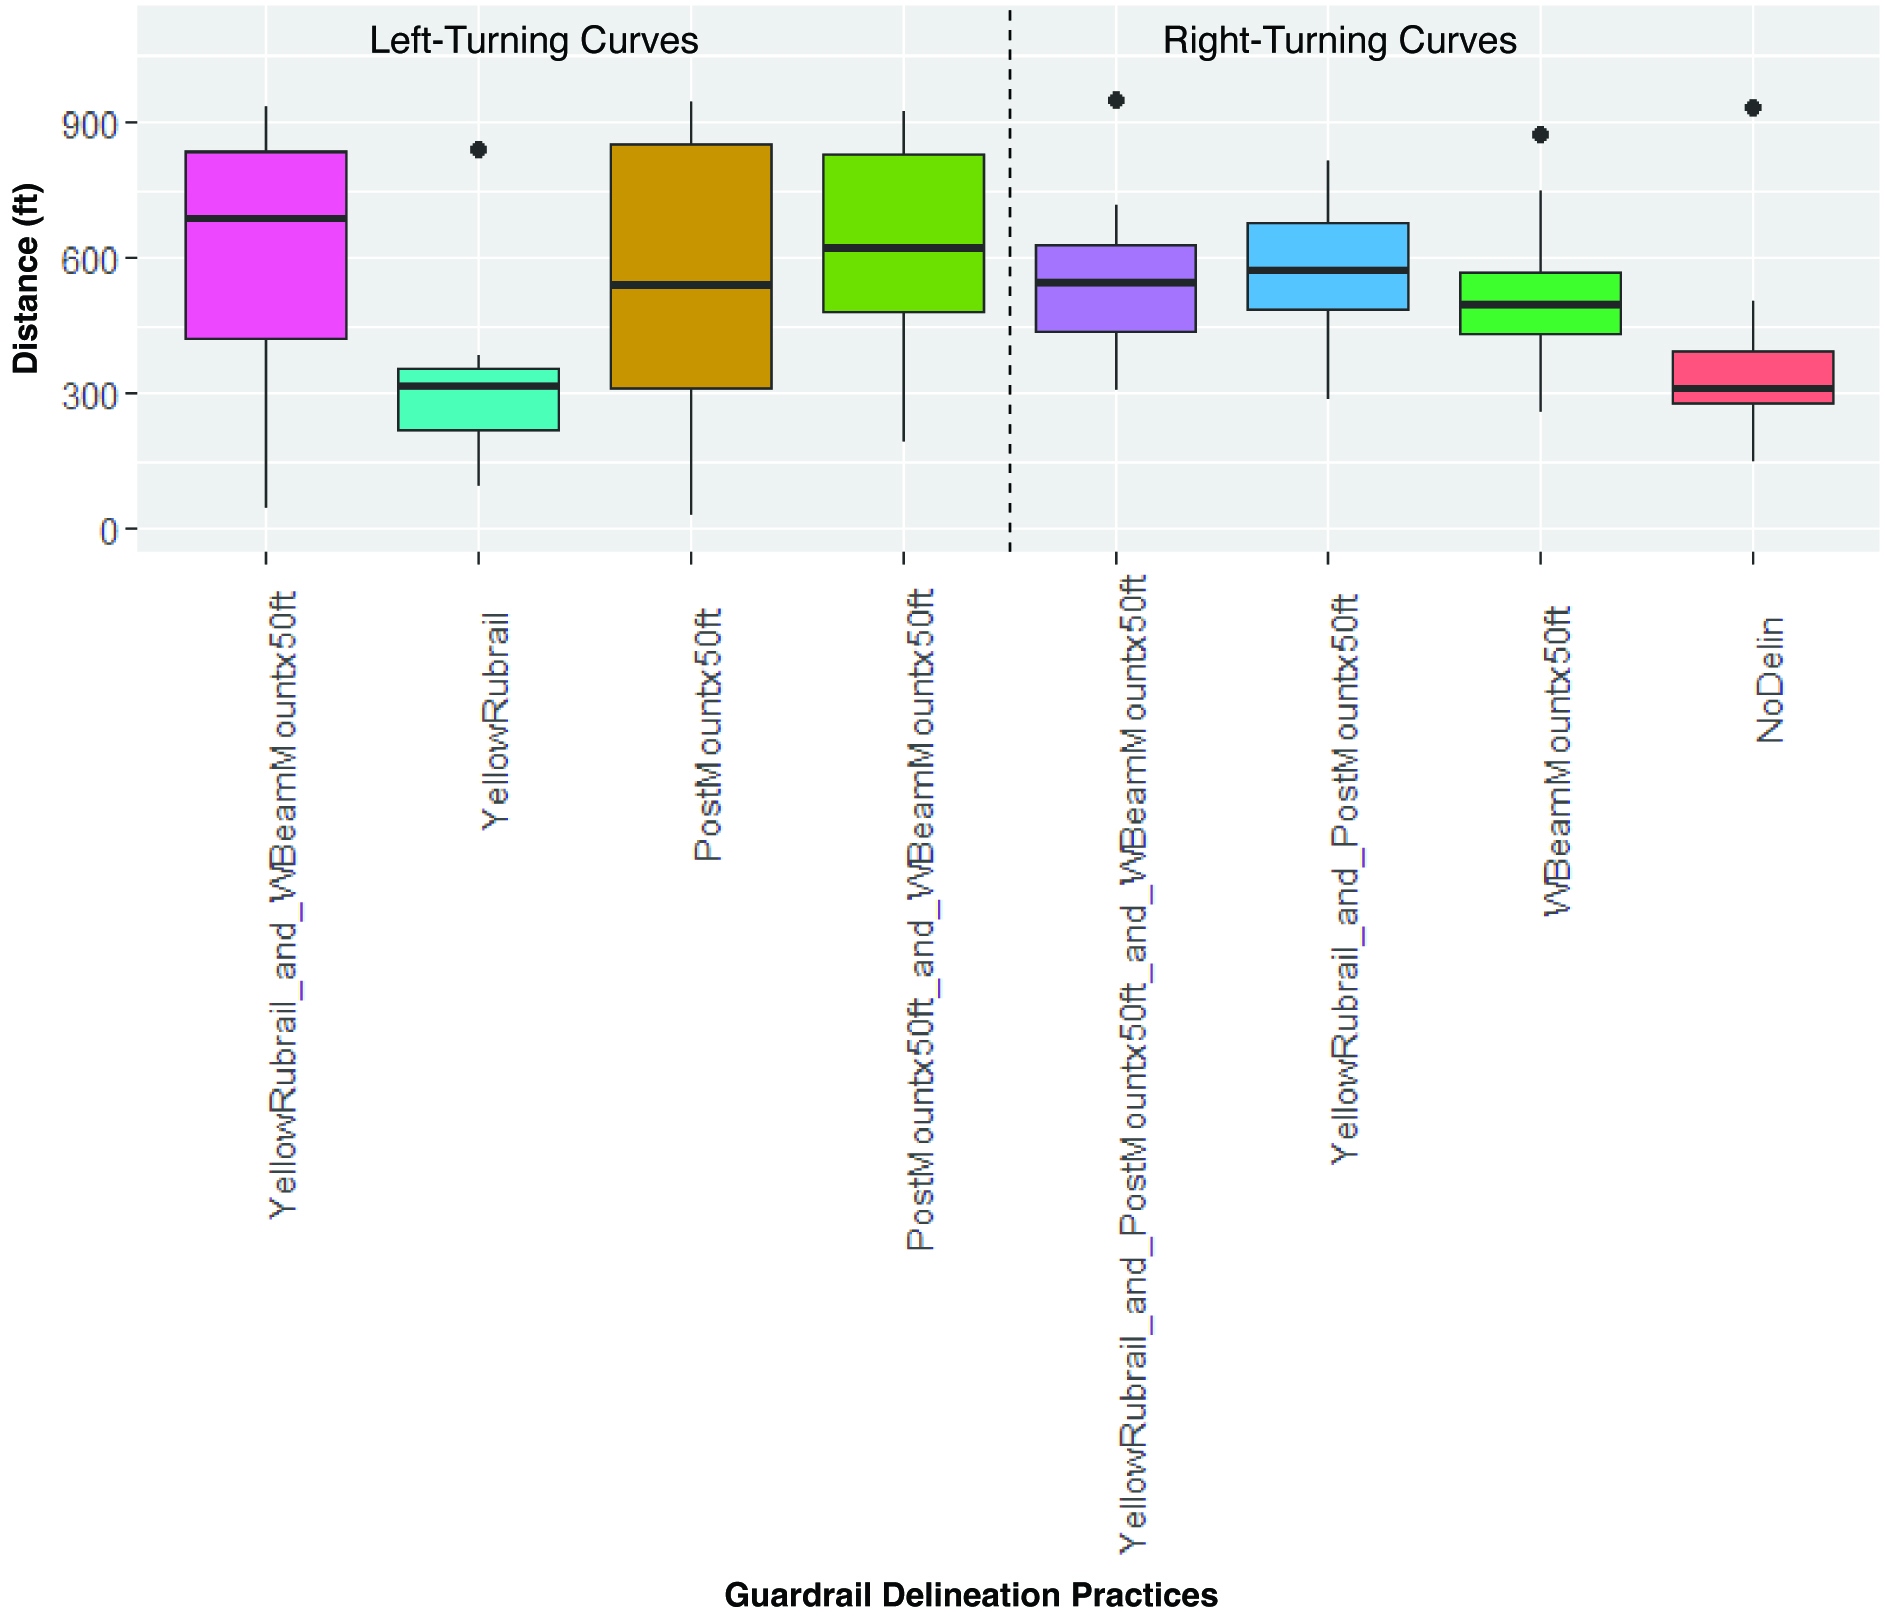
The distance from the start of the curve to the location at which participants had zero pressure on the throttle (i.e., the foot was completely off the gas pedal) is shown in Figures 16 and 17 for concrete barrier and guardrail delineation practices, respectively. Specifically, the throttle release distance was determined to be the first point at which the participant released the gas pedal after indicating the direction of the curve.
For the concrete barrier delineation practices, the presence of continuous retroreflective paint stripe tended to result in earlier throttle release as participants approached the curve. An earlier throttle release can indicate that a participant is slowing down and preparing to turn through the curve. The absence of delineation resulted in the latest throttle release as participants approached the curve. For the guardrail delineation practices, the presence of the yellow rubrail and no-delineation practices resulted in the latest throttle release as participants approached the curve. The presence of post-mounted delineators tended to result in the earliest throttle releases as participants approached the curve.
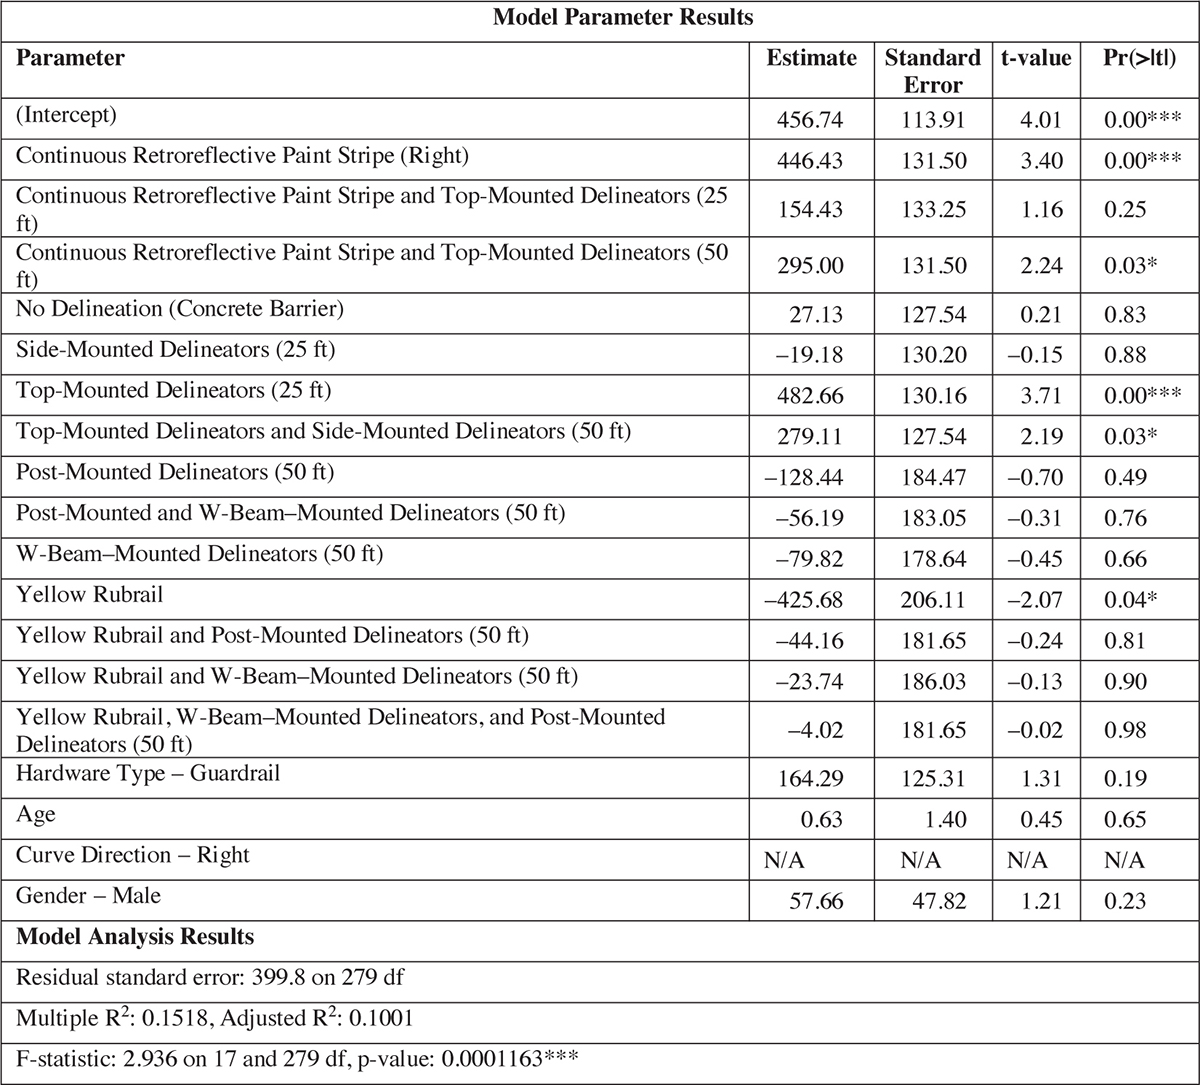
A multiple regression analysis was conducted to investigate the impact of various parameters on throttle release distance. The parameters included in the analysis were delineation practice, hardware type (i.e., concrete barrier or guardrail), age, curve direction, and gender. The reference parameters were continuous retroreflective paint stripe, concrete barrier, age, left-turn curve, and female gender. The model parameters and analysis are summarized in Table 26.
Despite a modest fit (Adjusted R2 = 0.1001), the model is statistically significant overall (p < 0.001), suggesting that the included parameters collectively explain a meaningful portion of the variance in throttle release distance. The intercept was highly significant (p < 0.001), with a baseline throttle release distance of approximately 457 ft. Among the concrete barrier delineation practices, continuous retroreflective paint stripe, top-mounted delineators, continuous retroreflective paint stripe with top-mounted delineators spaced at 50 ft, and top-mounted and side-mounted delineators spaced at 50 ft were all statistically significant for the throttle release distance.
Long Description.
The graph is separated into two sections: Left-Turning Curves and Right-Turning Curves. The horizontal axis is labeled Concrete Barrier Delineation Practices. The vertical axis shows the distance (feet) ranging from 0 to 1000 in increments of 200. The graph is divided into two sections: Left turning curves and Right turning curves. The data provided for each road condition is presented as a set of six estimated values (Minimum, First Quartile, Median, Third Quartile, Maximum, and Outliers). For Left Turning Curves: ContPaint_and_Topx25ft (350, 450, 580, 680, 950; outliers None); ContPaint_L (340, 450, 540, 600, 900; outliers None); NoDelin (300, 310, 380, 600, 850; outliers None); and Sidex25ft (350, 380, 470, 580, 780; outliers None). For Right Turning Curves: ContPaint_and_Topx50ft (360, 370, 420, 560, 770; outliers None); ContPaint_R (450, 470, 710, 860, 870; outliers None); Topx25ft (350, 380, 480, 580, 860; outliers 900, 950, 1000); and Topx50ft_and_Sidex50ft (350, 370, 450, 520, 880; outliers 930, 980). Note that the values mentioned are approximate.
Long Description.
The graph is separated into two sections: Left-Turning Curves and Right-Turning Curves. The horizontal axis is labeled Guardrail Delineation Practices. The vertical axis shows the distance (feet) ranging from 0 to 900 in increments of 300. The data provided for each road condition is presented as a set of six estimated values (Minimum, First Quartile, Median, Third Quartile, Maximum, and Outliers). For Left Turning Curves: YellowRubrail_and_WBeamMountx50ft (350, 480, 650, 800, 900; outliers None); YellowRubrail (200, 270, 300, 400, 450; outlier 875); PostMountx50ft (100, 300, 550, 880, 900; outliers None); and PostMountx50ft_and_WBeamMountx50ft (400, 550, 620, 850, 900; outliers None). For Right Turning Curves: YellowRubrail_and_PostMountx50ft_and_WBeamMountx50ft (450, 500, 580, 680, 700; outlier 900); YellowRubrail_and_PostMountx50ft (500, 550, 600, 700, 750; outliers None); WBeamMountx50ft (300, 480, 550, 650, 800; outlier 900); and NoDelin (200, 280, 320, 500, 780; outlier 920). Not that the values mentioned are approximate.
*** 0 < p-value ≤ 0.001
** 0.001 < p-value ≤ 0.01
* 0.01 < p-value ≤ 0.05
Long Description.
The table displays two sections: Model Parameter Results and Model Analysis Results. The first section shows five columns and 19 rows. The column headers from the second column are as follows: estimate, standard error, t value, and p value derived from the t-test. The data given are as follows: Row 1: (Intercept): 456.74, 113.91, 4.01, and 0.00 (The p-value is less than or equal to 0.001, but greater than 0). Row 2: Continuous Retroreflective Paint Stripe (Right): 446.43, 131.50, 3.40, and 0.00 (The p-value is less than or equal to 0.001, but greater than 0). Row 3: Continuous Retroreflective Paint Stripe and Top-Mounted Delineators (25 feet): 154.43, 133.25, 1.16, and 0.25. Row 4: Continuous Retroreflective Paint Stripe and Top-Mounted Delineators (50 feet): 295.00, 131.50, 2.24, and 0.03 (The p-value is less than or equal to 0.05, but greater than 0.01). Row 5: No Delineation (Concrete Barrier): 27.13, 127.54, 0.21, and 0.83. Row 6: Side-Mounted Delineators (25 feet): negative 19.18, 130.20, -0.15, and 0.88. Row 7: Top-Mounted Delineators (25 feet): 482.66, 130.16, 3.71, and 0.00 (The p-value is less than or equal to 0.001, but greater than 0). Row 8: Top-Mounted Delineators and Side-Mounted Delineators (50 feet): 279.11, 127.54, 2.19, and 0.03 (The p-value is less than or equal to 0.05, but greater than 0.01). Row 9: Post-Mounted Delineators (50 feet): negative 128.44, 184.47, negative 0.70, and 0.49. Row 10: Post-Mounted and W-Beam-Mounted Delineators (50 feet): negative 56.19, 183.05, negative 0.31, and 0.76. Row 11: W-Beam-Mounted Delineators (50 feet): negative 79.82, 178.64, negative 0.45, and 0.66. Row 12: Yellow Rubrail: negative 425.68, 206.11, negative 2.07, and 0.04 (The p-value is less than or equal to 0.05, but greater than 0.01). Row 13: Yellow Rubrail and Post-Mounted Delineators (50 feet): negative 44.16, 181.65, negative 0.24, and 0.81. Row 14: Yellow Rubrail and W-Beam-Mounted Delineators (50 feet): negative 23.74, 186.03, negative 0.13, and 0.90. Row 15: Yellow Rubrail, W-Beam-Mounted Delineators, and Post-Mounted Delineators (50 feet): negative 4.02, 181.65, negative 0.02, and 0.98. Row 16: Hardware Type - Guardrail: 164.29, 125.31, 1.31, and 0.19. Row 17: Age: 0.63, 1.40, 0.45, and 0.65. Row 18: Curve Direction - Right: Not Applicable, Not Applicable, Not Applicable, and Not Applicable. Row 19: Gender - Male: 57.66, 47.82, 1.21, and 0.23. The second section of the table shows three rows. The data given are as follows: Row 1: Residual standard error: 399.8 on 279 degrees of freedom. Row 2: Multiple R-squared: 0.3518, and Adjusted R-squared: 0.3101. Row 3: F-statistic: 2.936 on 17 and 279 DF, p-value: 0.0001163 (The p-value is less than or equal to 0.001, but greater than 0).
These concrete barrier delineation practices were all associated with positive increases in the throttle release distance. The other concrete barrier delineation practices did not indicate statistical significance. Yellow rubrail was the only guardrail delineation practice that indicated statistical significance; it was statistically significant for a low throttle release distance. The other guardrail delineation practices did not indicate statistical significance.
Demographic variables, such as age and gender, were not statistically significant, with very low t-values and high p-values, suggesting minimal influence on throttle release behavior. Additionally, the curve direction parameter was removed because of collinearity or lack of variability in the dataset.
Braking Distance
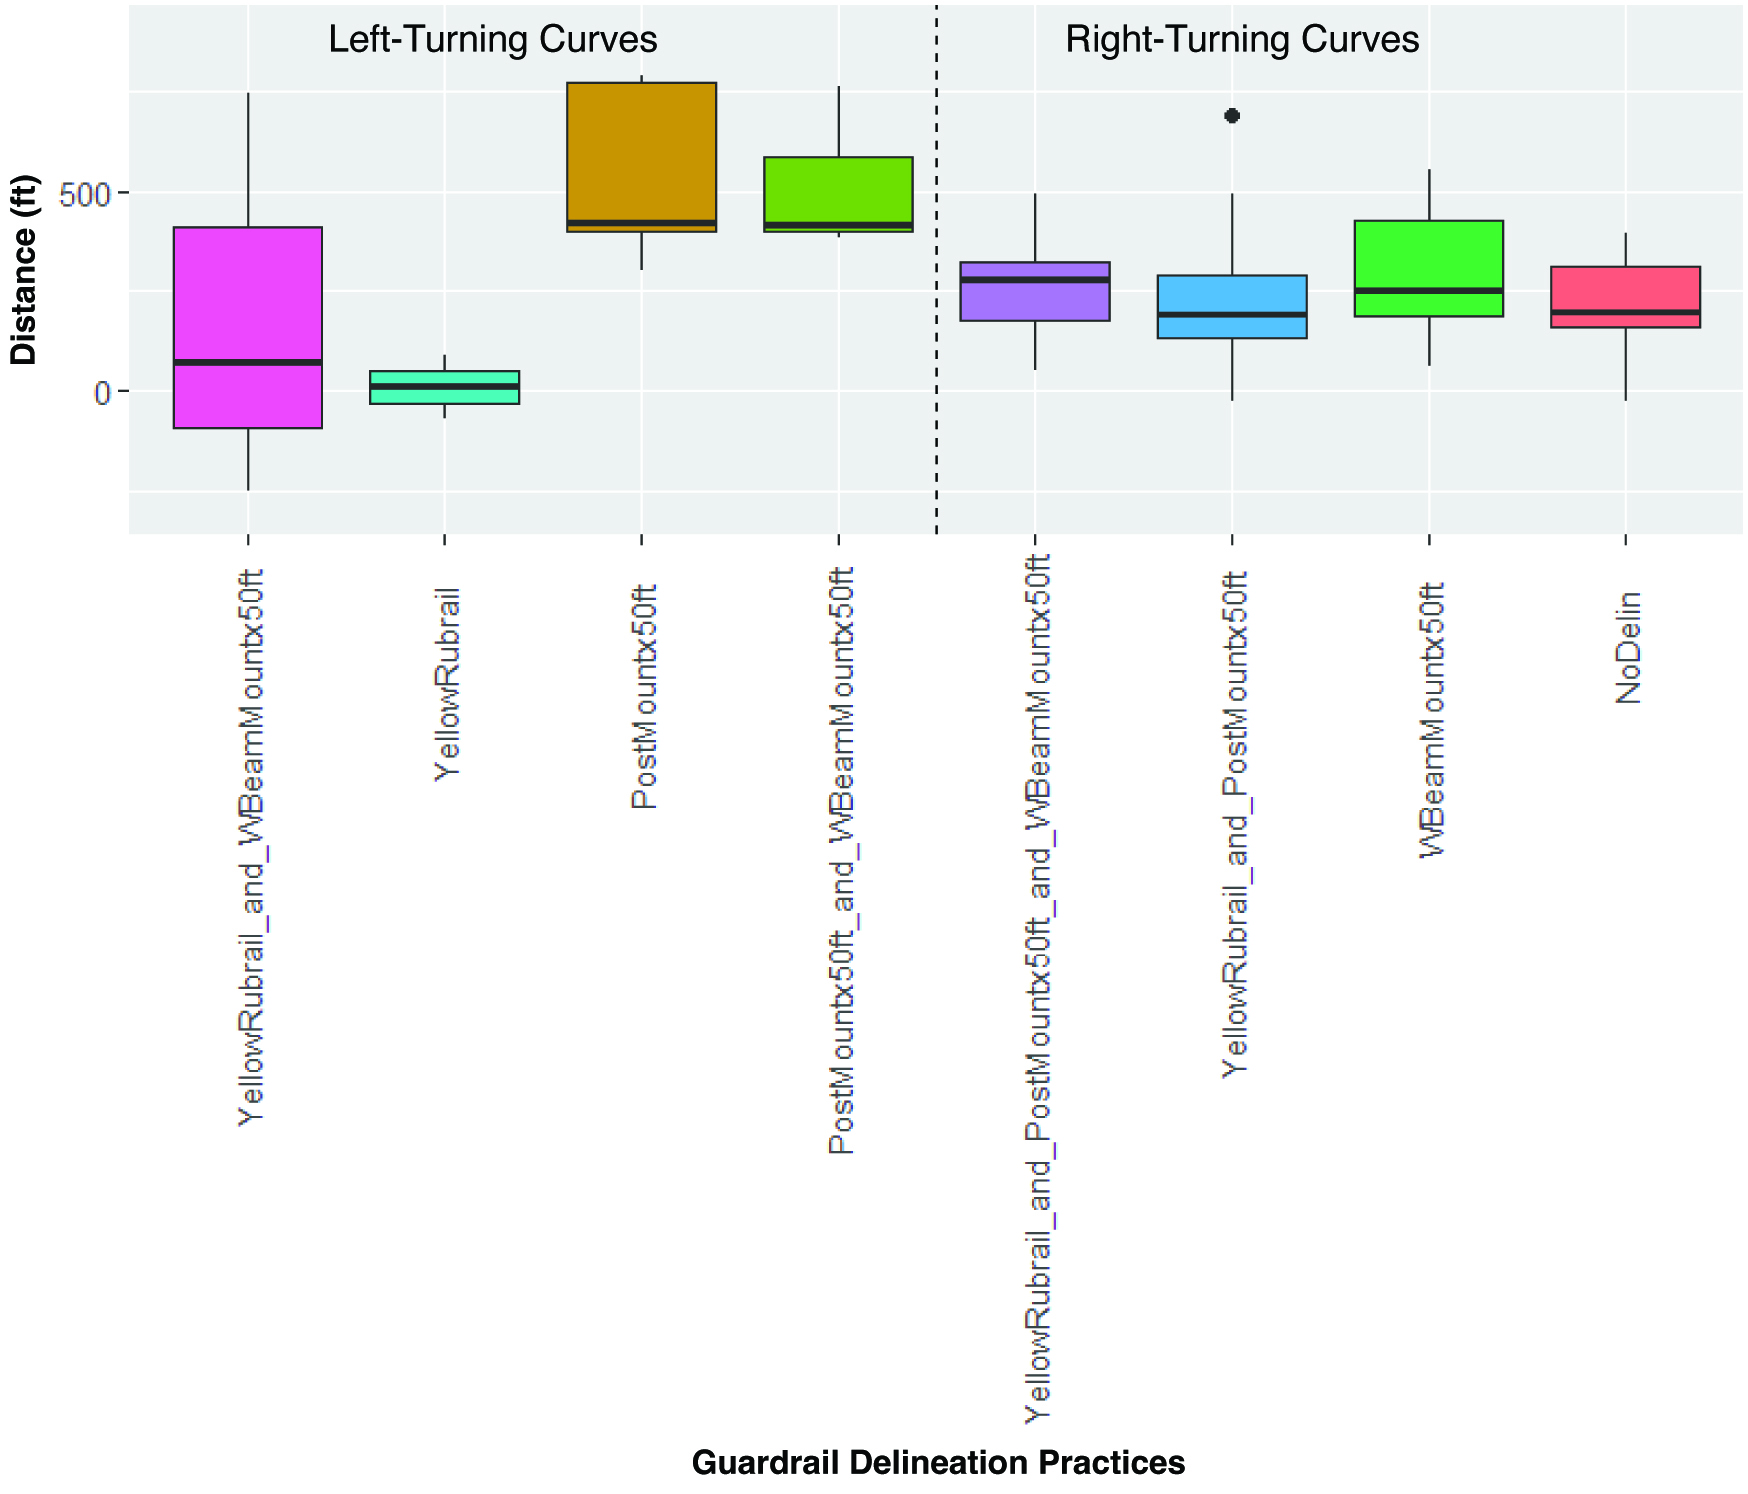
The distance from the start of the curve to the location at which participants first applied brakes is shown in Figures 18 and 19 for concrete barrier and guardrail delineation practices, respectively. If participants applied brakes before the starting point of the curve, the braking distance was recorded as a positive value. If participants applied the brakes after entering

Long Description.
The graph is separated into two sections: Left-Turning Curves and Right-Turning Curves. The horizontal axis is labeled Concrete Barrier Delineation Practices. The vertical axis shows the distance (feet) ranging from negative 500 to 1500 in increments of 500. The data provided for each road condition is presented as a set of six estimated values (Minimum, First Quartile, Median, Third Quartile, Maximum, and Outliers). For Left-Turning Curves: ContPaint_and_Topx25ft (0, 100, 250, 350, 500; outliers 1000, 1550); ContPaint_L (200, 220, 250, 320, 450; outlier negative 100); NoDelin (negative 500, negative 50, 200, 300, 400; outlier 1350); and Sidex25ft (0, 0, 50, 250, 300; outliers None). For Right-Turning Curves: ContPaint_and_Topx50ft (negative 150, 280, 320, 380, 400; outlier negative 100); ContPaint_R (negative 100, 280, 320, 380, 400; outlier negative 100); Topx25ft (negative 150, 250, 300, 380, 450; outlier 1200); and Topx50ft_and_Sidex50ft (negative 100, 250, 300, 350, 400; outlier negative 100). Note that the values mentioned are approximate.
Long Description.
The graph is separated into two sections: Left-Turning Curves and Right-Turning Curves. The horizontal axis is labeled Guardrail Delineation Practices. The vertical axis shows the distance (feet) ranging from 0 to 500 in increments of 500. The data provided for each road condition is presented as a set of six estimated values (Minimum, First Quartile, Median, Third Quartile, Maximum, and Outliers). For Left-Turning Curves: For Left-Turning Curves: YellowRubrail_and_WBeamMountx50ft (negative 50, negative 25, 50, 450, 900; outliers None); YellowRubrail (negative 100, negative 50, 0, 0, 50; outliers None); PostMountx50ft (100, 450, 550, 850, 900; outliers None); and PostMountx50ft_and_WBeamMountx50ft (350, 500, 600, 850, 950; outliers None). For Right-Turning Curves: YellowRubrail_and_WBeamMountx50ft (0, 150, 250, 400, 500; outliers None); YellowRubrail_and_PostMountx50ft (50, 150, 200, 350, 450; outlier 650); WBeamMountx50ft (100, 250, 300, 450, 550; outliers None); and NoDelin (100, 200, 250, 350, 500; outliers None). Note that the values mentioned are approximate.
the curve, the braking distance was recorded as a negative value. In addition, the number of participants who applied brakes prior to the curve, in the curve, or did not apply brakes at all was determined.
Figures 20 and 21 show the count of brake locations for concrete barrier and guardrail delineation practices, respectively. Minimal variance was present in the braking distance among the concrete barrier delineation practices. The no-delineation practice had the highest spread of braking distance and some lower braking distance values. For the braking location, the presence of a continuous retroreflective paint stripe consistently resulted in more brake applications prior to the curve rather than in the curve.
The presence of post-mounted delineators resulted in earlier brake application as participants approached the curve compared to the other delineation practices. The yellow rubrail delineation practice resulted in the latest brake application as participants approached the curve. No significant differences were present in the braking location among the guardrail delineation practices. A multiple regression analysis was conducted to investigate the impact of various parameters on braking distance.
The parameters included in the analysis were delineation practice, hardware type (i.e., concrete barrier or guardrail), age, curve direction, and gender. The reference parameters were continuous retroreflective paint stripe, concrete barrier, age, left-turn curve, and female gender. The model parameters and analysis are summarized in Table 27. The overall model fit was modest (Adjusted R2 = 0.0467). None of the concrete barrier delineation practices indicated any statistical significance for the braking distance, although several of them were close to being significant. All guardrail delineation practices with post-mounted delineators were statistically significant except one. Demographic variables, such as age and gender, were not statistically significant, indicating minimal influence on braking behavior. Additionally, the curve direction parameter was removed because of collinearity or lack of variability in the dataset.
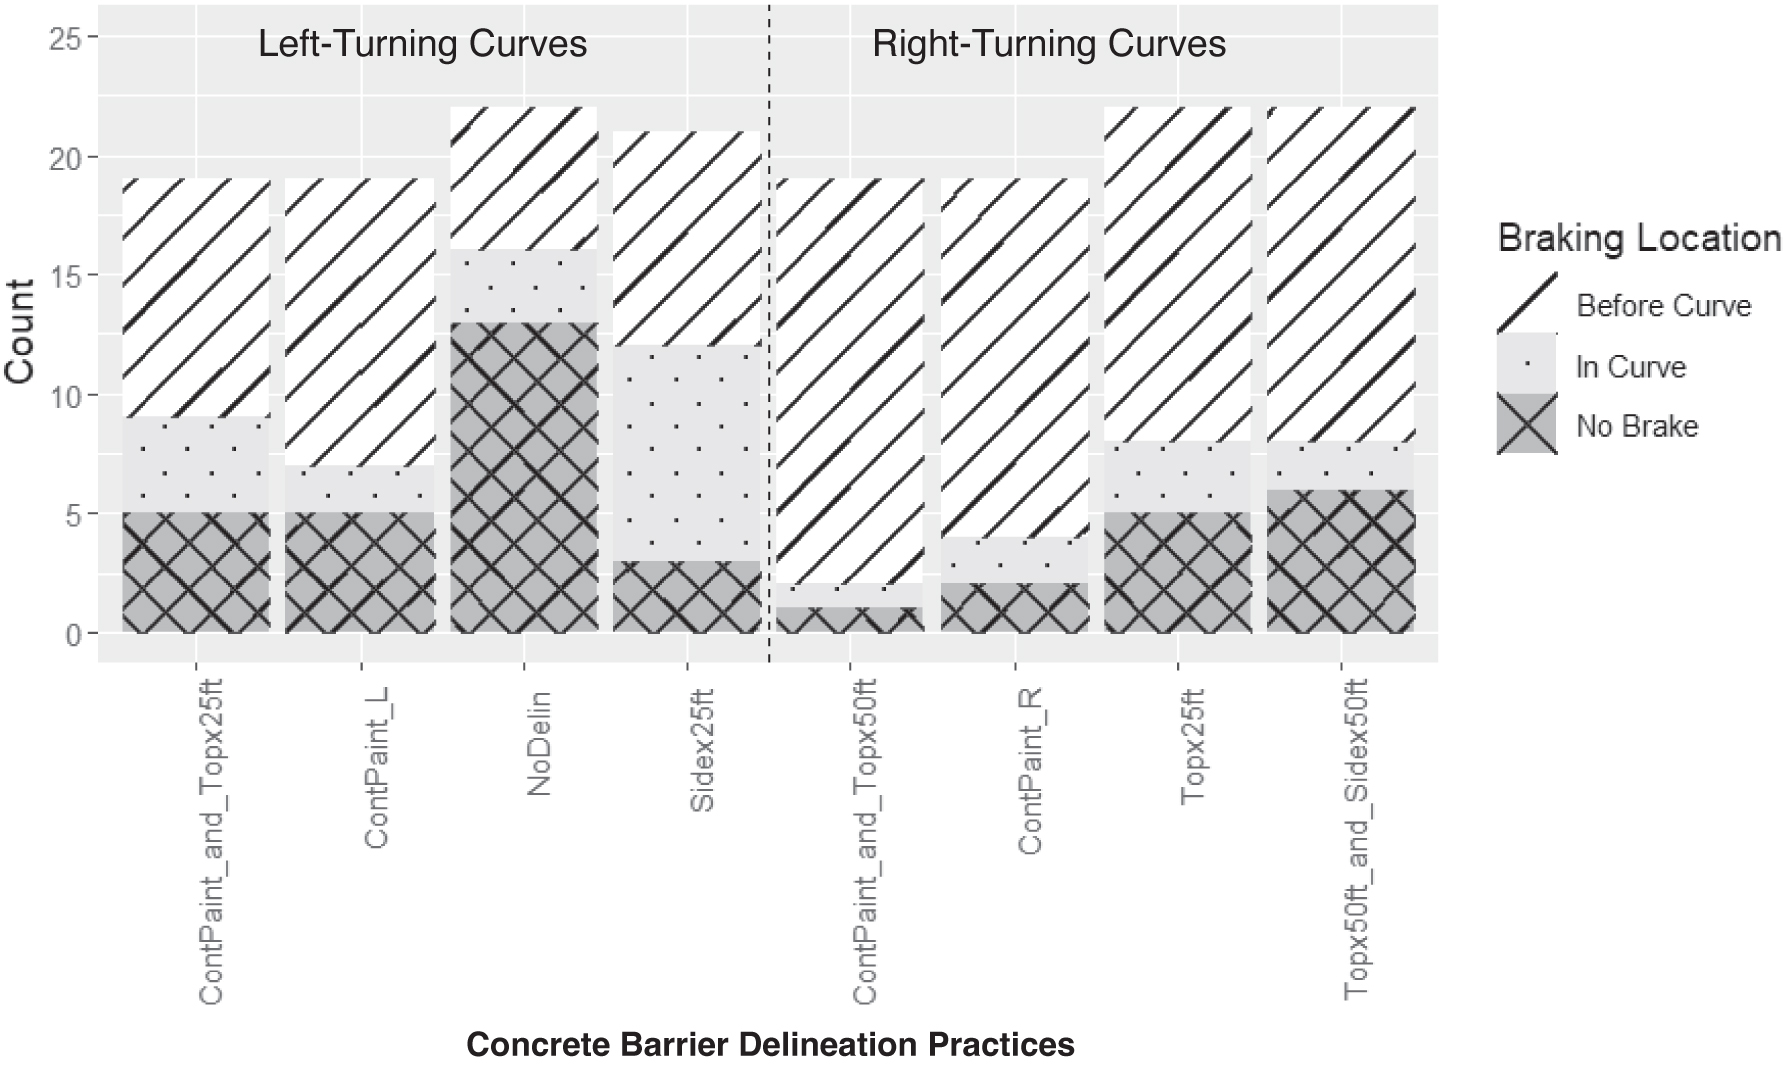
Long Description.
The graph is separated into two sections: Left-Turning Curves and Right-Turning Curves. The horizontal axis is labeled Concreate Barrier Delineation Practices. The vertical axis shows the count ranging from 0 to 25 in increments of 5. The data provided for each road condition is presented as a set of three estimated values: No brake (crossed section), In curve (dotted section), and Before curves (shaded in diagonal lines). For left-turning curves: ContPaint_and_Topx25ft: 0 to 5; 5 to 9; and 9 to 15. ContPaint_L: 0 to 5; 5 to 6.5; and 6.5 to 19. NoDelin: 0 to 13; 13 to 16; and 16 to 22. Sidex25ft: 0 to 3; 3 to 12; and 12 to 21. For right-turning curves: ContPaint_and_Topx50ft: 0 to 1; 1 to 2; and 2 to 19. ContPaint_R: 0 to 2; 2 to 4; and 4 to 19. Topx25ft: 0 to 5; 5 to 8; and 7 to 22. Topx50ft_and_Sidex50ft: 0 to 6; 6 to 8; and 8 to 22. Note that the values mentioned are approximate.
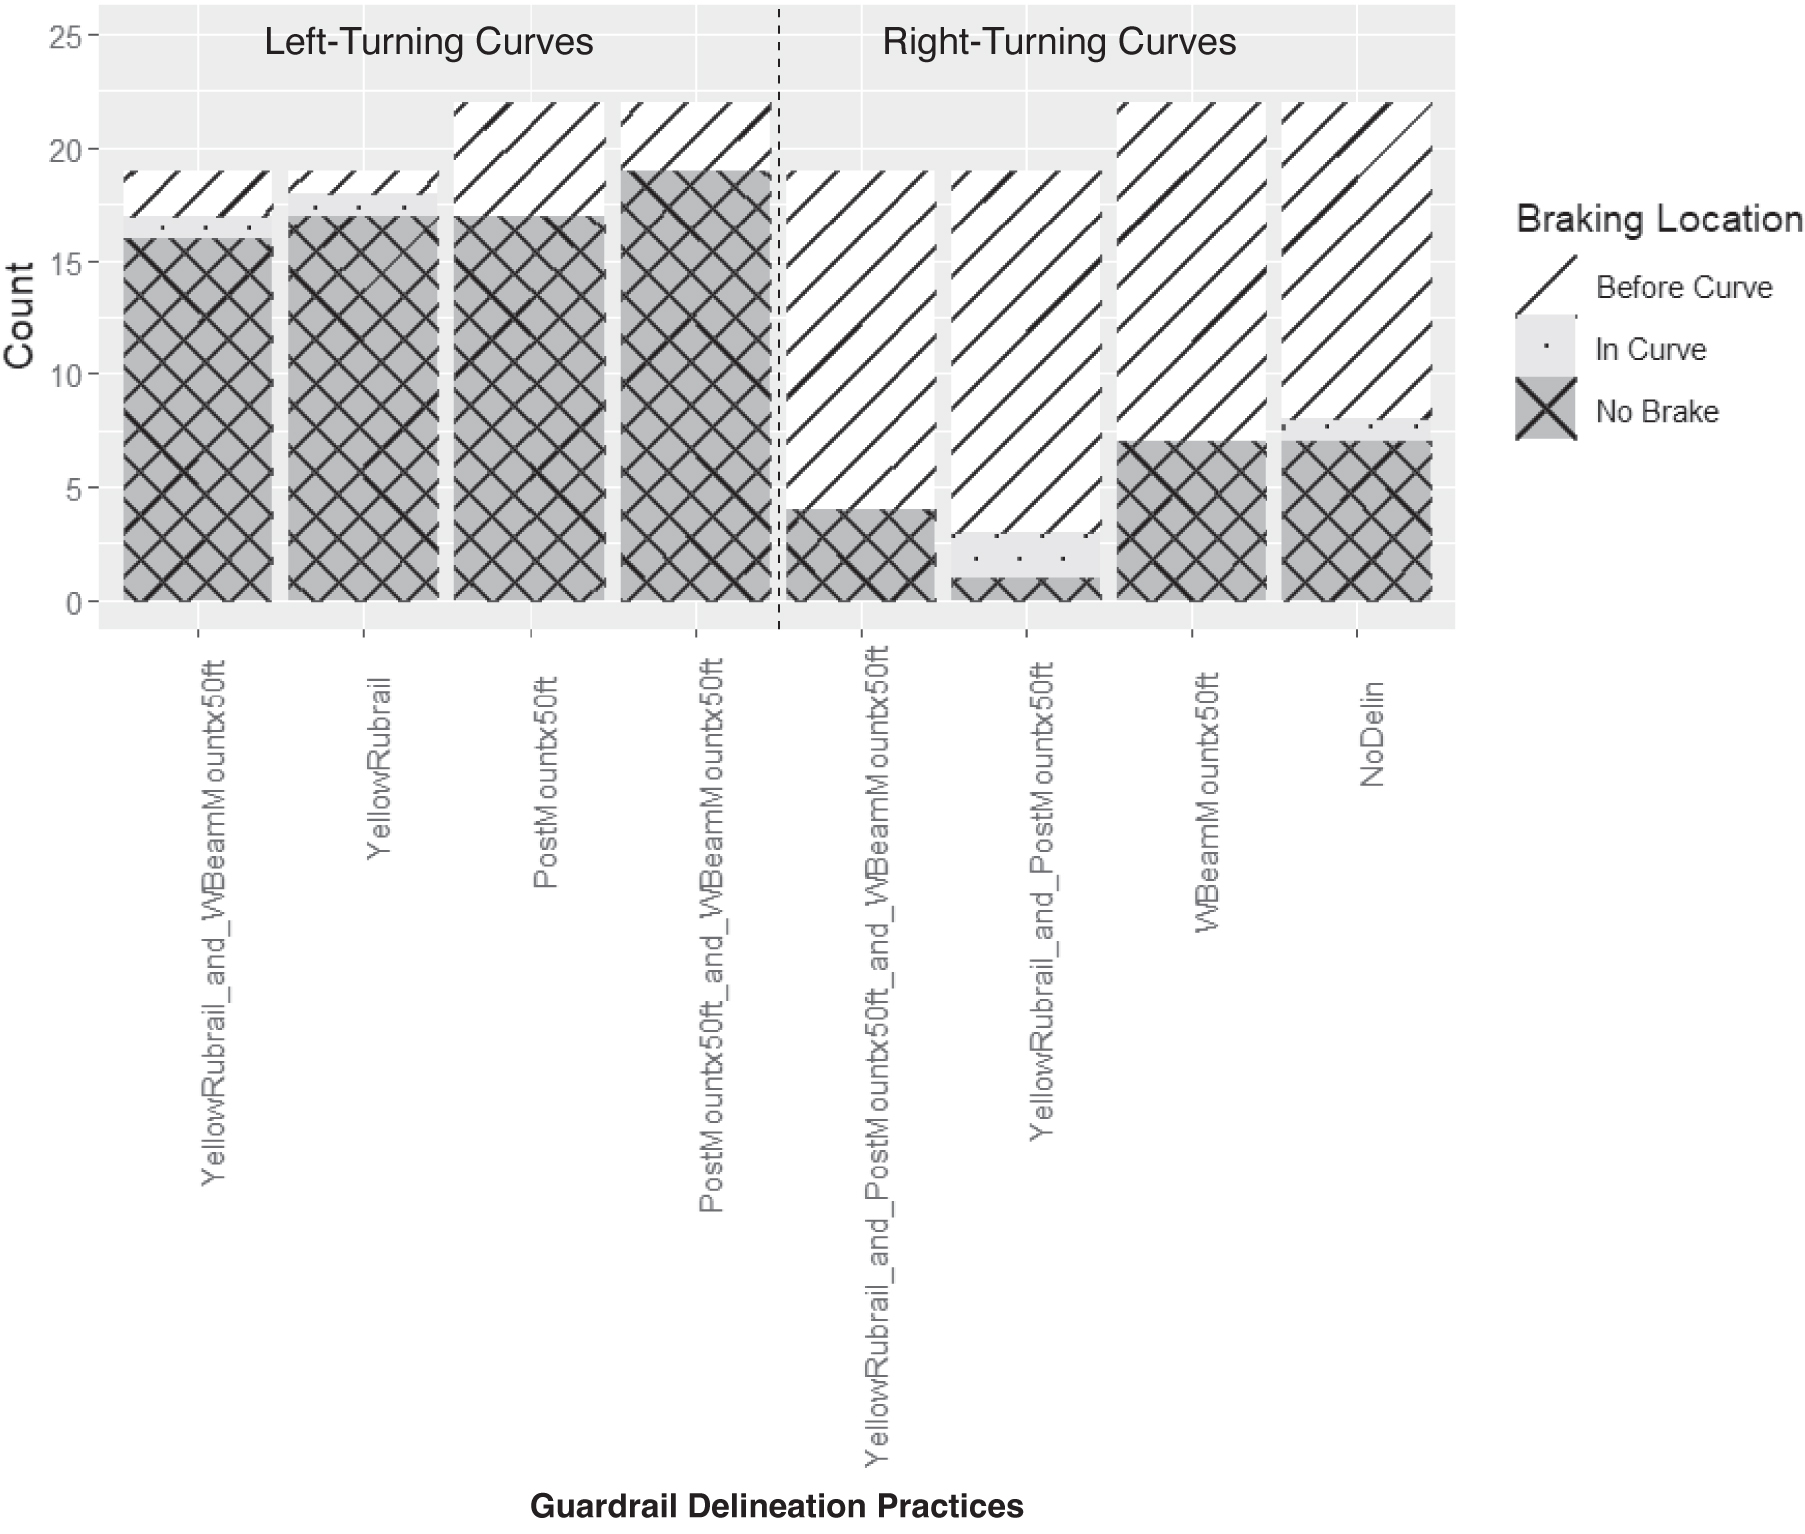
Long Description.
The graph is separated into two sections: Left-Turning Curves and Right-Turning Curves. The horizontal axis is labeled Guardrail Delineation Practices. The vertical axis shows the count ranging from 0 to 25 in increments of 5. The data provided for each road condition is presented as a set of three estimated values: No brake (crossed section), In curve (dotted section), and Before curves (shaded in diagonal lines). For Left Turning Curves: YellowRubrail_and_WBeamMountx50ft: 0 to 16; 16 to 17; and 17 to 19. YellowRubrail: 0 to 17; 17 to 18; and 18 to 19. PostMountx50ft: 0 to 17; no in curve range; and 17 to 22. PostMountx50ft_and_WBeamMountx50ft: 0 to 19; no in curve range; and 19 to 22. For Right Turning Curves: YellowRubrail_and_PostMountx50ft_and_WBeamMountx50ft: 0 to 4; no in curve range; and 4 to 19. YellowRubrail_and_PostMountx50ft: 0 to 1; 1 to 3; and 3 to 19. WBeamMountx50ft: 0 to 6.5; no in curve range; and 6.5 to 22. NoDelin: 0 to 6.5; 6.5 to 7; and 7 to 22. Note that the values mentioned are approximate.
Results – Driver Behavior in the Curve
Average Speed
Participants were instructed to maintain a speed of 40 mi/h while driving through the closed course. The curve radius for both curves was 600 ft, which implied a design speed of 42.5 mi/h. Figures 22 and 23 show average speeds along the length of the curves for the concrete barrier and guardrail delineation practices, respectively. The average speed was fairly uniform among the concrete barrier delineation practices. The continuous retroreflective paint stripe had a slightly lower average speed when compared to the rest of the delineation practices. Minimal variance was present in the average speed among the guardrail delineation practices. The post-mounted delineation practices had marginally lower average speeds compared to other delineation practices.
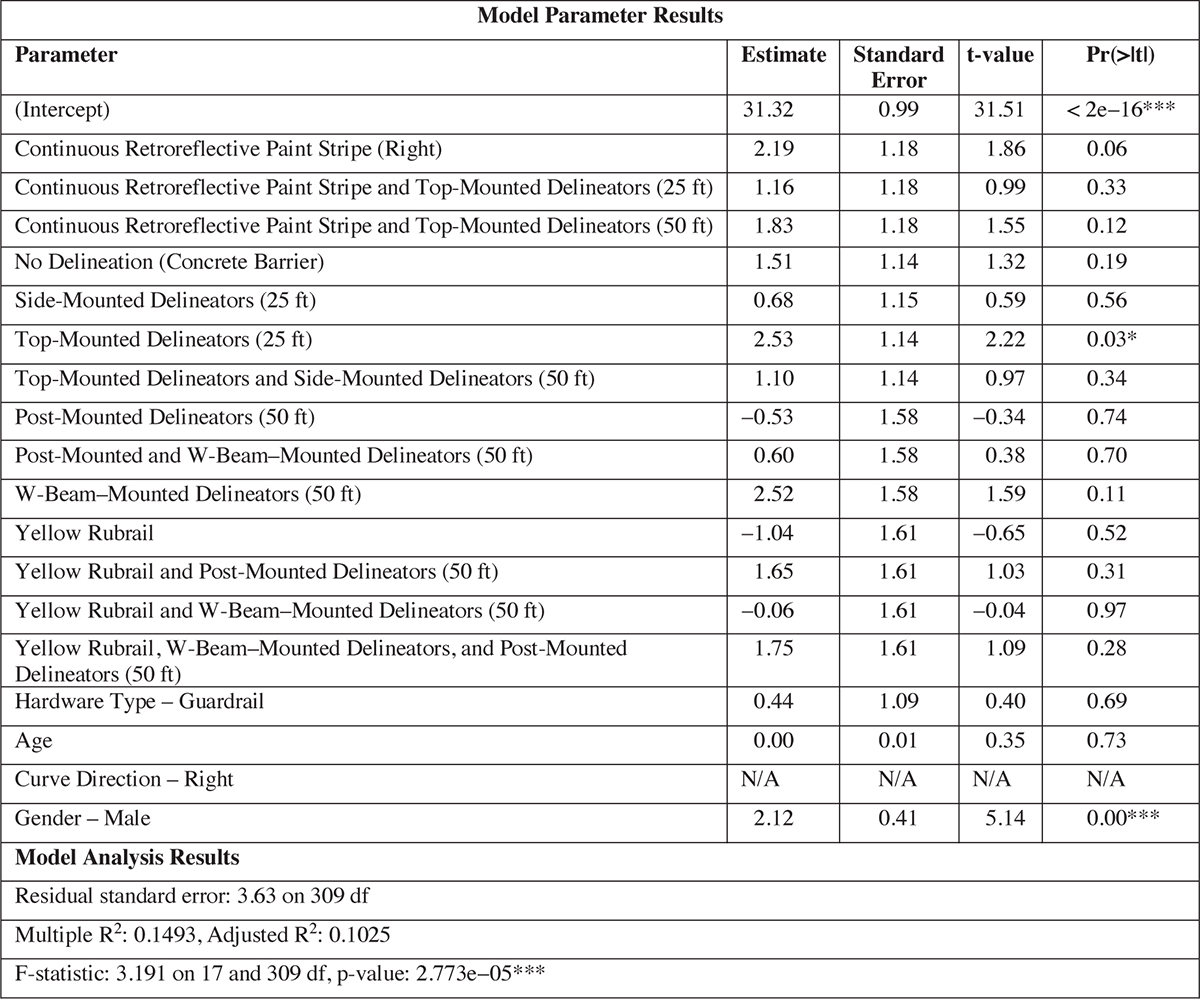
A multiple regression analysis was conducted to investigate the impact of various parameters on the average speed in the curve. The parameters included in the analysis were delineation practice, hardware type (i.e., concrete barrier or guardrail), age, curve direction, and gender. The reference parameters were continuous retroreflective paint stripe, concrete barrier, age, left-turn curve, and female gender. The model parameters and analysis are summarized in Table 28. The model revealed a statistically significant fit overall (p < 0.001), albeit with a modest
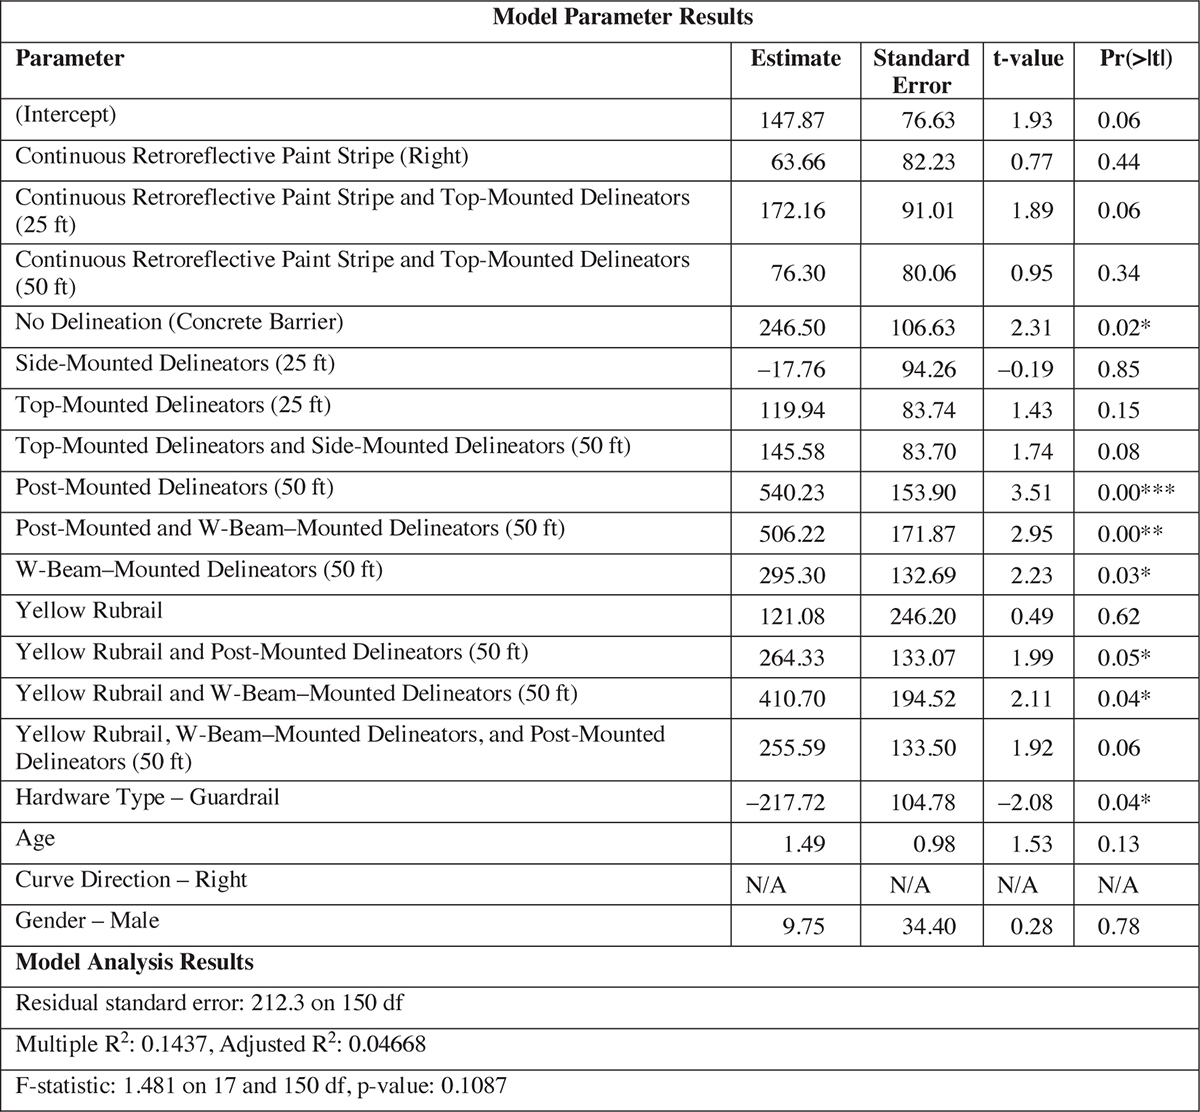
*** 0 < p-value ≤ 0.001
** 0.001 < p-value ≤ 0.01
* 0.01 < p-value ≤ 0.05
Long Description.
The table displays two sections: Model Parameter Results and Model Analysis Results. The first section shows five columns and 19 rows. The column headers from the second column are as follows: estimate, standard error, t value, and p value derived from the t-test. The data given are as follows: Row 1: (Intercept): 147.87, 76.63, 1.93, and 0.06. Row 2: Continuous Retroreflective Paint Stripe (Right): 63.66, 82.23, 0.77, and 0.44. Row 3: Continuous Retroreflective Paint Stripe and Top-Mounted Delineators (25 feet): 172.16, 91.01, 1.89, and 0.06. Row 4: Continuous Retroreflective Paint Stripe and Top-Mounted Delineators (50 feet): 76.30, 80.06, 0.95, and 0.34. Row 5: No Delineation (Concrete Barrier): 246.50, 106.63, 2.31, and 0.02 (The p-value is less than or equal to 0.05, but greater than 0.01). Row 6: Side-Mounted Delineators (25 feet): negative 17.76, 94.26, negative 0.19, and 0.85. Row 7: Top-Mounted Delineators (25 feet): 119.94, 83.74, 1.43, and 0.15. Row 8: Top-Mounted Delineators and Side-Mounted Delineators (50 feet): 145.58, 83.70, 1.74, and 0.08. Row 9: Post-Mounted Delineators (50 feet): 540.23, 153.90, 3.51, and 0.00 (The p-value is less than or equal to 0.001, but greater than 0). Row 10: Post-Mounted and W-Beam-Mounted Delineators (50 feet): 506.22, 171.87, 2.95, and 0.00 (The p-value is less than or equal to 0.01, but greater than 0.001). Row 11: W-Beam-Mounted Delineators (50 feet): 295.30, 132.69, 2.23, and 0.03 (The p-value is less than or equal to 0.05, but greater than 0.01). Row 12: Yellow Rubrail: 121.08, 346.20, 0.49, and 0.62. Row 13: Yellow Rubrail and Post-Mounted Delineators (50 feet): 264.33, 133.07, 1.99, and 0.05 (The p-value is less than or equal to 0.05, but greater than 0.01). Row 14: Yellow Rubrail and W-Beam-Mounted Delineators (50 feet): 410.70, 194.52, 2.11, and 0.04 (The p-value is less than or equal to 0.05, but greater than 0.01). Row 15: Yellow Rubrail, W-Beam-Mounted Delineators, and Post-Mounted Delineators (50 feet): 255.59, 133.50, 1.92, and 0.06. Row 16: Hardware Type - Guardrail: negative 217.72, 104.78, negative 2.08, and 0.04 (The p-value is less than or equal to 0.05, but greater than 0.01). Row 17: Age: 1.49, 0.98, 1.53, and 0.13. Row 18: Curve Direction - Right: NA, NA, NA, and NA. Row 19: Gender - Male: 9.75, 34.40, 0.28, and 0.78. The second section of the table shows 3 rows. The data given are as follows: Row 1: Residual standard error: 212.3 on 150 degrees of freedom. Row 2: Multiple R-squared: 0.1417, and Adjusted R-squared: 0.04668. Row 3: F-statistic: 1.481 on 17 and 150 DF, p-value: 0.1087.
explanatory power (Adjusted R2 = 0.1025). The continuous retroreflective paint stripe baseline and top-mounted delineators spaced at 25 ft were the only statistically significant concrete barrier delineation practices.
The top-mounted delineators were associated with a statistically significant increase in speed. None of the guardrail delineation practices indicated any statistical significance for average speed along the curve. Demographic variables, such as age and gender, were not statistically significant, indicating minimal influence on braking behavior. Additionally, the curve direction parameter was removed because of collinearity or lack of variability in the dataset.
Demographic variables played a somewhat more prominent role in this model. Gender was a significant predictor (p < 0.001), with male drivers traveling on average 2.12 mi/h faster than female drivers. However, age was not a significant factor (p = 0.729), indicating that average speed did not vary meaningfully with driver age in this dataset. Additionally, the curve direction parameter was removed because of collinearity or lack of variability in the dataset.
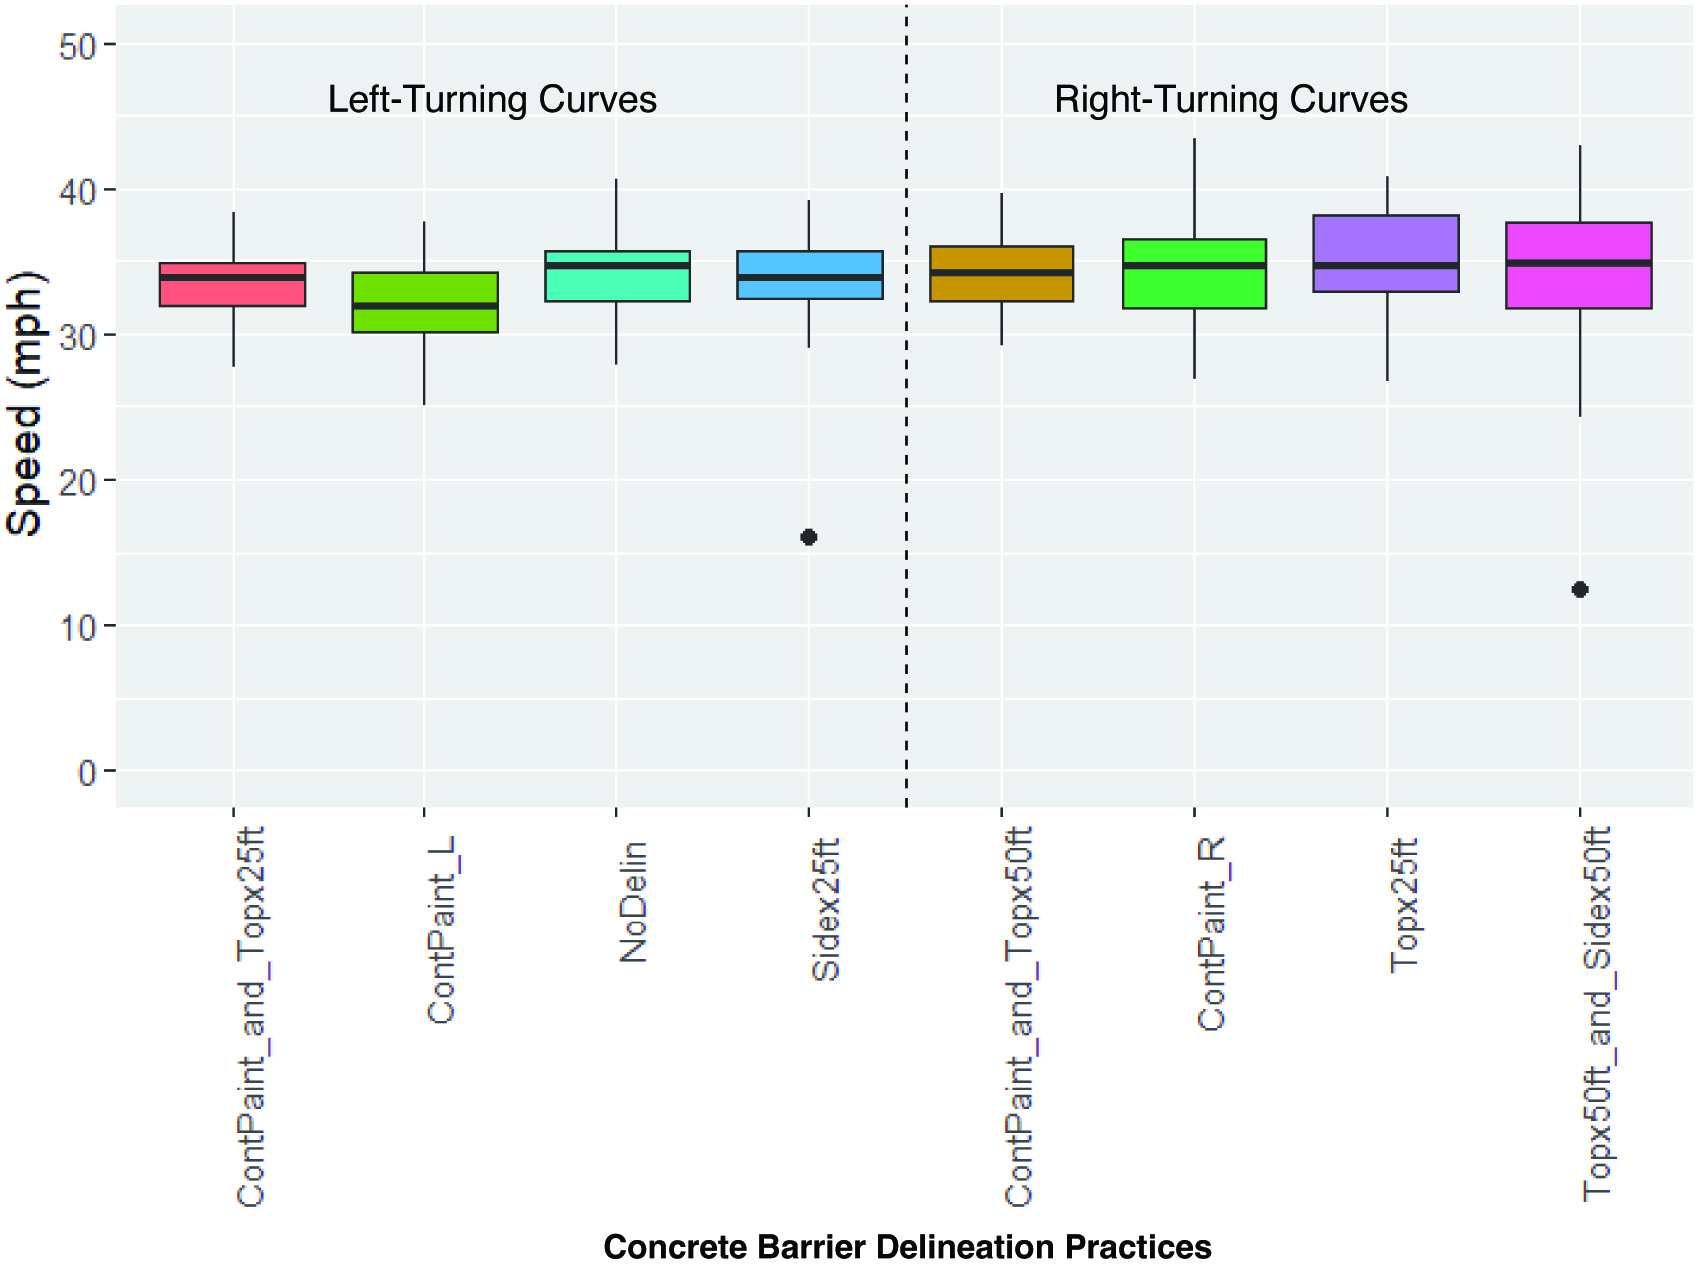
Long Description.
The graph is separated into two sections: Left-Turning Curves and Right-Turning Curves. The horizontal axis is labeled Concrete Barrier Delineation Practices. The vertical axis shows the speed (miles per hour) ranging from 0 to 50 in increments of 10. The data provided for each road condition is presented as a set of six estimated values (Minimum, First Quartile, Median, Third Quartile, Maximum, and Outliers). For Left-Turning Curves: ContPaint_and_Topx25ft (33, 33, 34, 35, 38; outliers None); ContPaint_L (30, 31, 32, 34, 35; outliers None); NoDelin (33, 34, 35, 36, 40; outliers None); and Sidex25ft (33, 34, 35, 36, 39; outlier 17). For Right-Turning Curves: ContPaint_and_Topx50ft (33, 34, 35, 36, 40; outliers None); ContPaint_R (33, 34, 35, 37, 43; outliers None); Topx25ft (33, 34, 35, 38, 43; outliers None); and Topx50ft_and_Sidex50ft (32, 33, 35, 38, 43; outlier 12). Note that the values mentioned are approximate.

Long Description.
The graph is separated into two sections: Left-Turning Curves and Right-Turning Curves. The horizontal axis is labeled Guardrail Delineation Practices. The vertical axis shows the speed (miles per hour), ranging from 0 to 50 in increments of 10. The data provided for each road condition is presented as a set of six estimated values (Minimum, First Quartile, Median, Third Quartile, Maximum, and Outliers). For Left-Turning Curves: YellowRubrail_and_WBeamMountx50ft (32, 33, 34, 35, 37; outliers 26, 40); YellowRubrail (30, 31, 33, 34, 35; outliers None); PostMountx50ft (30, 32, 33, 35, 37; outlier 41); and PostMountx50ft_and_WBeamMountx50ft (32, 33, 34, 35, 39; outliers None). For Right-Turning Curves: YellowRubrail_and_PostMountx50ft_and_WBeamMountx50ft (34, 35, 36, 37, 39; outliers None); YellowRubrail_and_PostMountx50ft (33, 35, 36, 37, 39; outliers None); WBeamMountx50ft (34, 36, 37, 38, 40; outliers None); and NoDelin (33, 35, 36, 38, 40; outliers None). Note that the values mentioned are approximate.
*** 0 < p-value ≤ 0.001
** 0.001 < p-value ≤ 0.01
* 0.01 < p-value ≤ 0.05
Long Description.
The table displays two sections: Model Parameter Results and Model Analysis Results. The first section shows five columns and 19 rows. The column headers from the second column are as follows: estimate, standard error, t value, and p value derived from the t-test. The data given are as follows: Row 1: (Intercept): 31.32, 0.99, 31.51, and less than 2 exponent minus 16 (The p-value is less than or equal to 0.001, but greater than 0). Row 2: Continuous Retroreflective Paint Stripe (Right): 2.19, 1.18, 1.86, and 0.06. Row 3: Continuous Retroreflective Paint Stripe and Top-Mounted Delineators (25 feet): 1.16, 1.18, 0.99, and 0.33. Row 4: Continuous Retroreflective Paint Stripe and Top-Mounted Delineators (50 feet): 1.83, 1.18, 1.55, and 0.12. Row 5: No Delineation (Concrete Barrier): 1.51, 1.14, 1.32, and 0.19. Row 6: Side-Mounted Delineators (25 feet): 0.68, 1.15, 0.59, and 0.56. Row 7: Top-Mounted Delineators (25 feet): 2.53, 1.14, 2.22, and 0.03 (The p-value is less than or equal to 0.05, but greater than 0.01), Row 8: Top-Mounted Delineators and Side-Mounted Delineators (50 feet): 1.10, 1.14, 0.97, and 0.34. Row 9: Post-Mounted Delineators (50 ft): negative 0.53, 1.58, negative 0.34, and 0.74. Row 10: Post-Mounted and W-Beam-Mounted Delineators (50 feet): 0.60, 1.58, 0.38, and 0.70. Row 11: W-Beam-Mounted Delineators (50 feet): 2.52, 1.58, 1.59, and 0.11. Row 12: Yellow Rubrail: negative 1.04, 1.61, negative 0.65, and 0.52. Row 13: Yellow Rubrail and Post-Mounted Delineators (50 feet): 1.65, 1.61, 1.03, and 0.31. Row 14: Yellow Rubrail and W-Beam-Mounted Delineators (50 feet): negative 0.06, 1.61, negative 0.04, and 0.97. Row 15: Yellow Rubrail, W-Beam-Mounted Delineators, and Post-Mounted Delineators (50 feet): 1.75, 1.61, 1.09, and 0.28. Row 16: Hardware Type - Guardrail: 0.44, 1.09, 0.40, and 0.69. Row 17: Age: 0.00, 0.01, 0.35, and 0.73. Row 18: Curve Direction - Right: NA, NA, NA, and NA. Row 19: Gender - Male: 2.12, 0.41, 5.14, and 0.00 (The p-value is less than or equal to 0.001, but greater than 0). The second section of the table shows 3 rows. The data given are as follows: Row 1: Residual standard error: 3.63 on 309 degrees of freedom. Row 2: Multiple R-squared: 0.1461, and Adjusted R-squared: 0.1025. Row 3: F-statistic: 3.191 on 17 and 309 DF, p-value: 2.773 exponent minus 05 (The p-value is less than or equal to 0.001, but greater than 0).
Average and Maximum Brake Pressure
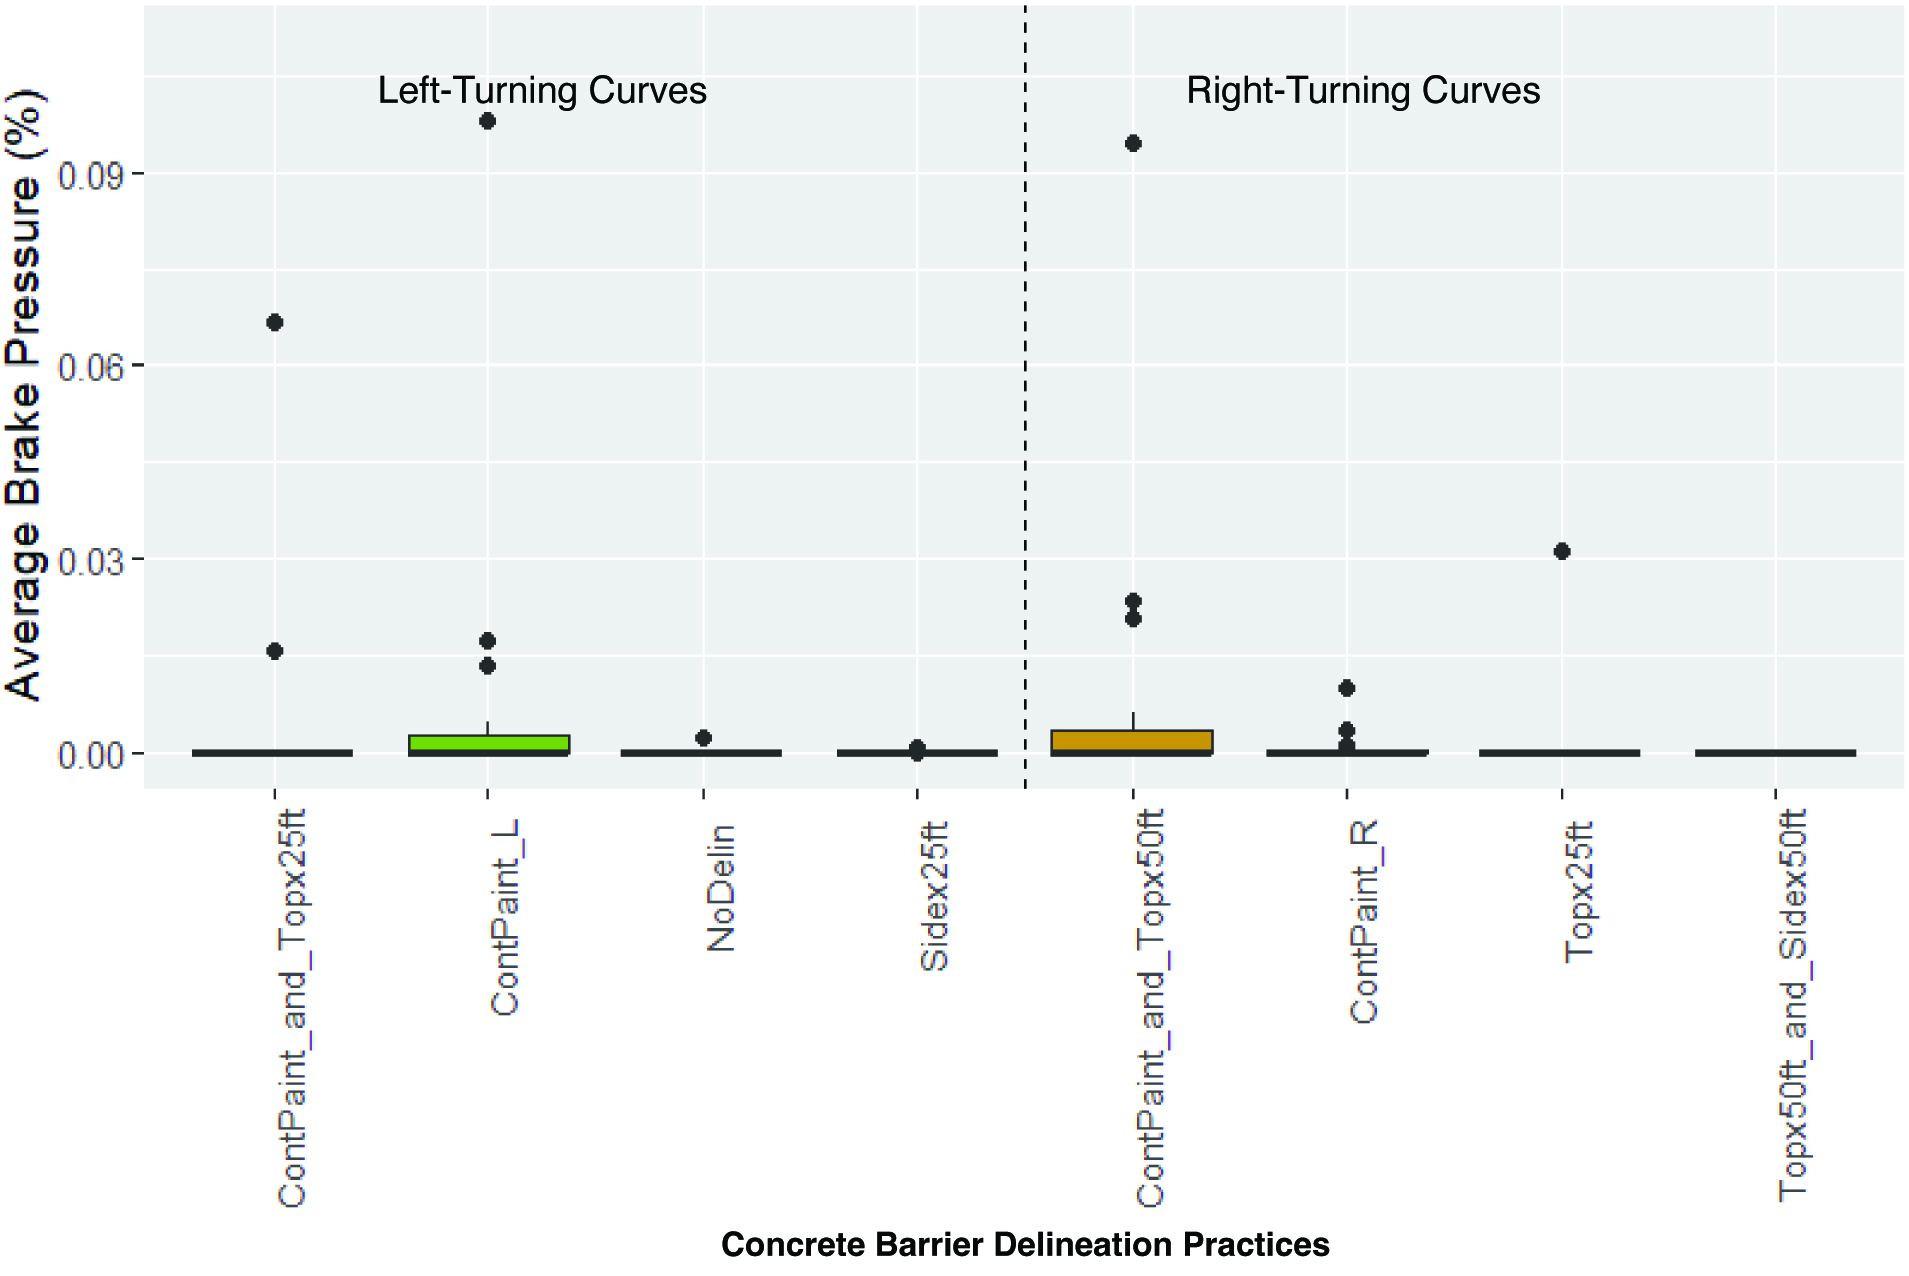
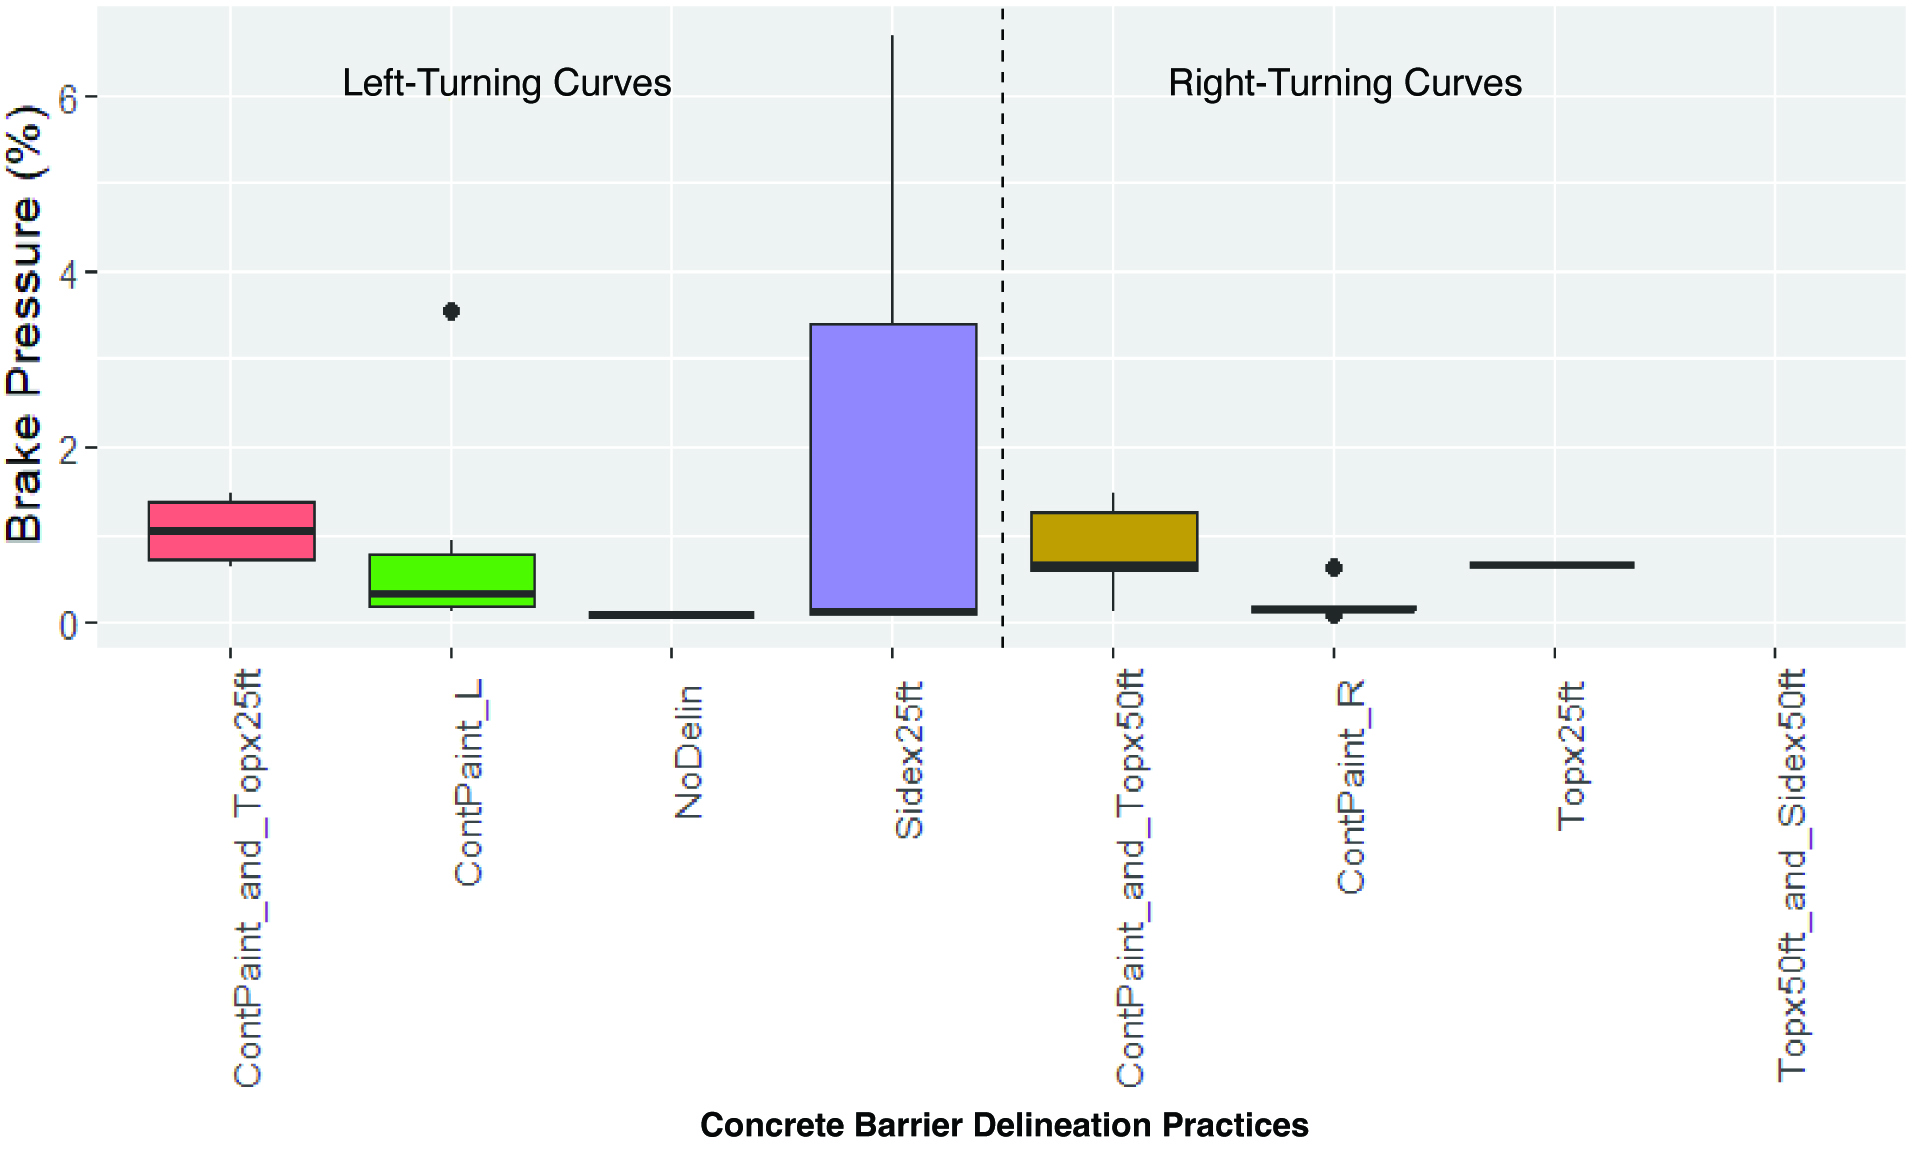
Brake pressure is measured in percent and represents the pressure applied to the brake pedal. Participants applied minimal pressure to the brake pedal for concrete barrier delineation practices, and all values remained under 0.1%, as shown in Figure 24. In addition to average brake pressure, the maximum brake pressure applied in the curve was extracted and visualized. Except for the concrete barrier with the side-mounted delineators spaced at 25 ft, for which several participants applied a brake pressure over 2%, the maximum brake pressure applied for the other concrete barrier delineation practices was under 2%, as shown in Figure 25.
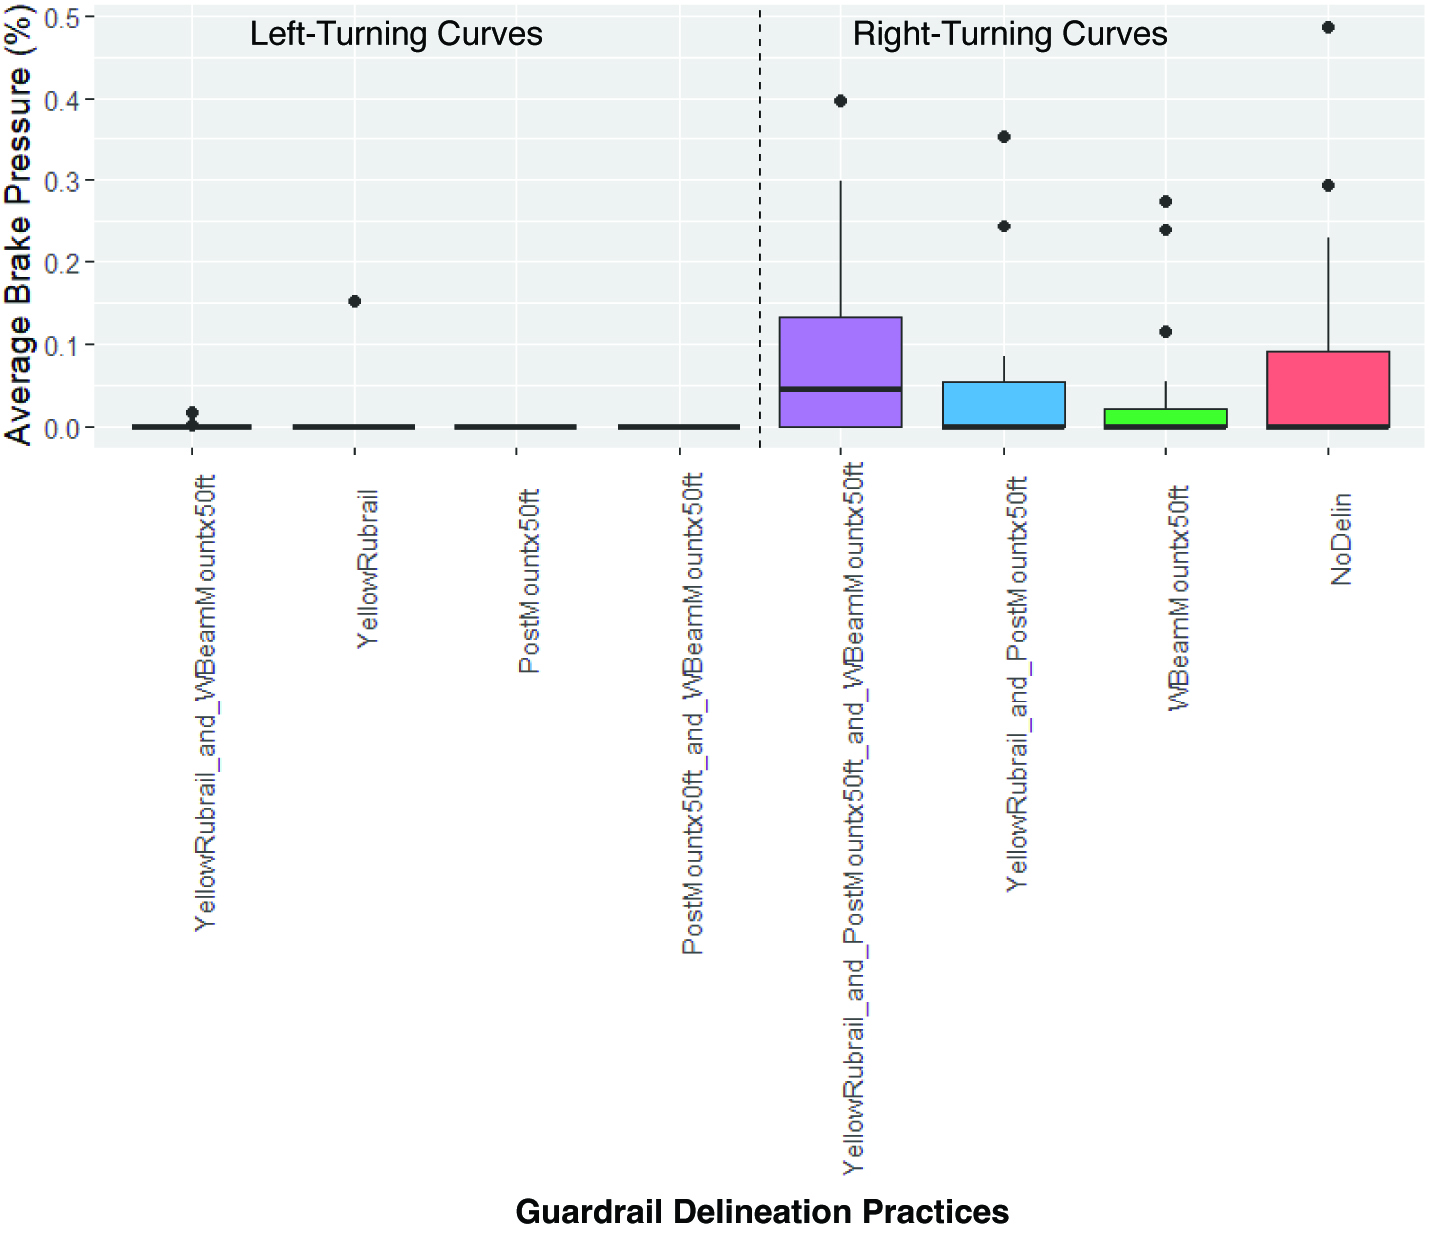
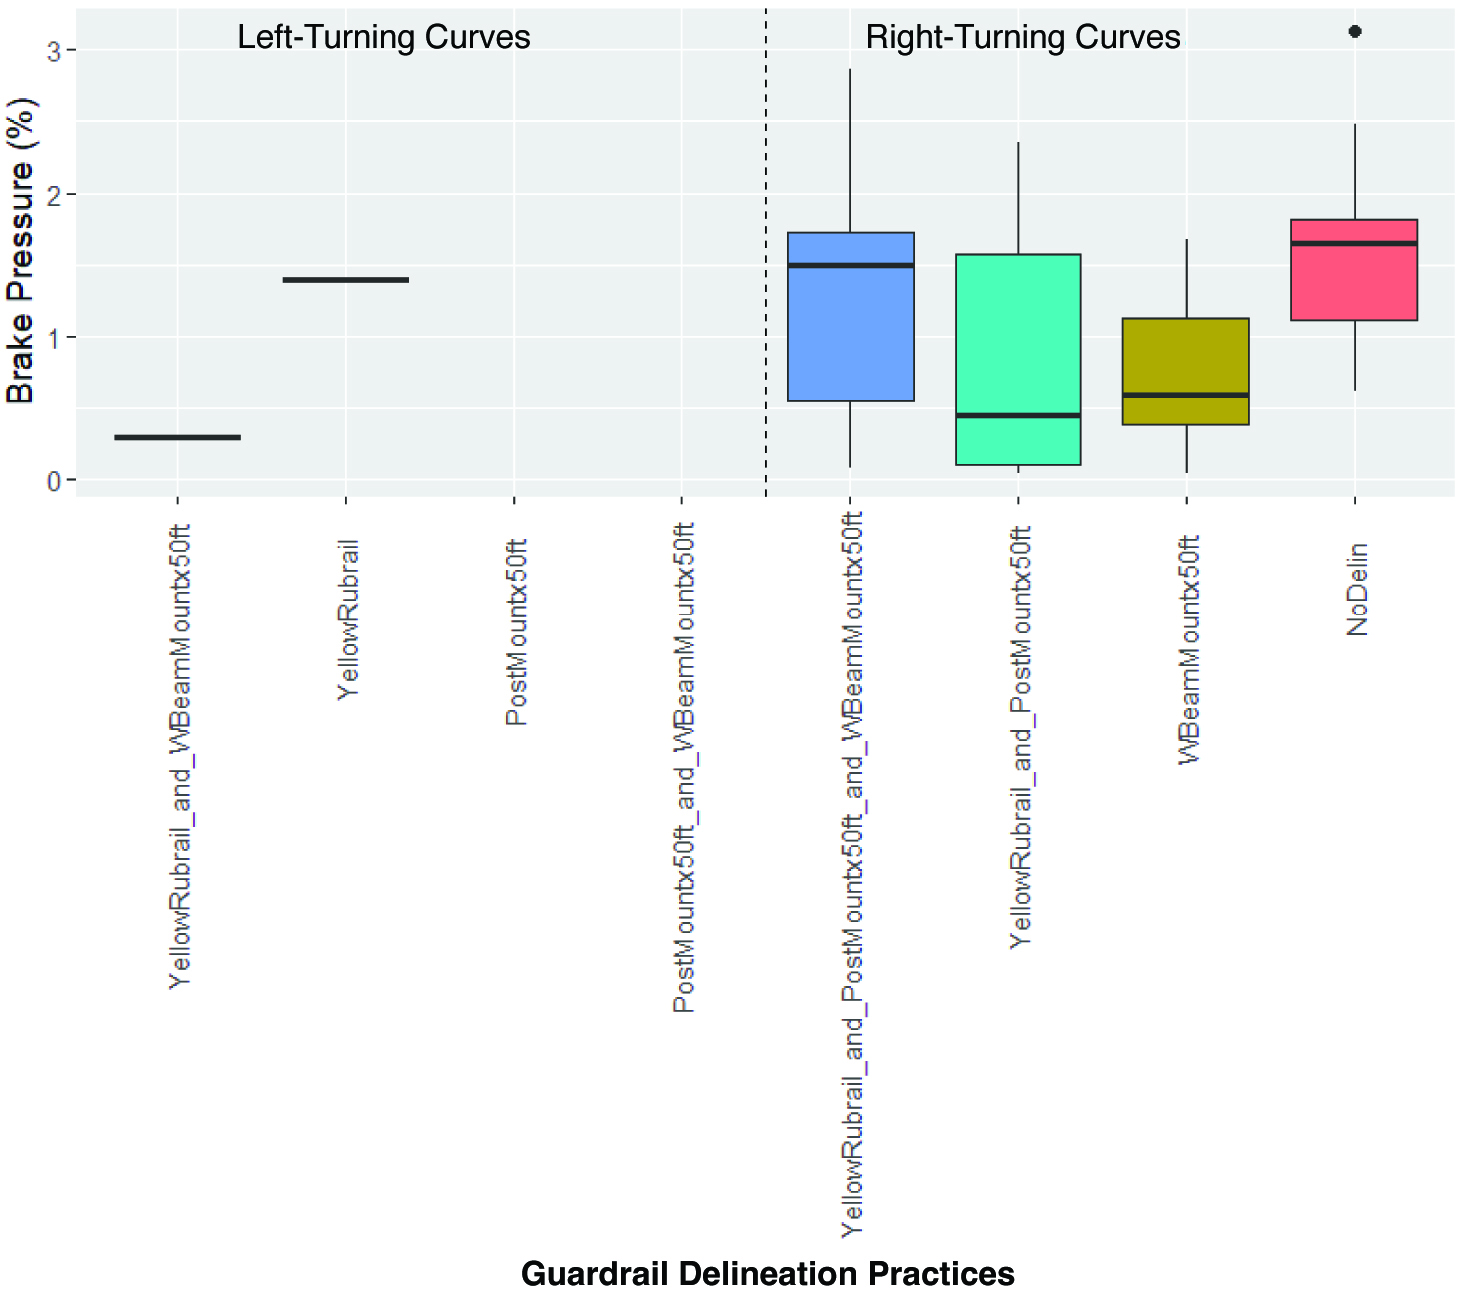
For guardrail delineation practices, participants applied minimal pressure to the brake pedal, and all values remained under 0.5%, as shown in Figure 26. Right-turn curve delineation practices had more dispersion when compared to left-turn curve delineation practices. Besides this curve direction difference, no significant variance was present in the average brake pressure across the different delineation practices. The maximum brake pressure applied in the curve was similarly higher for right-turn curve delineation practices, as shown in Figure 27, with minimal observable brake pressure for left-turn curve delineation practices. The no-delineation practice had the highest maximum brake pressure applied for the right-turn curve delineation practices. It should be noted that the guardrail curve location had a downward vertical slope for
Long Description.
The graph is separated into two sections: Left-Turning Curves and Right-Turning Curves. The horizontal axis is labeled Concrete Barrier Delineation Practices. The vertical axis shows the Average Brake Pressure (percentage), ranging from 0 to 0.09 in increments of 0.03. The data provided for each road condition is presented as a set of six estimated values (Minimum, First Quartile, Median, Third Quartile, Maximum, and Outliers). For Left-Turning Curves: ContPaint_and_Topx25ft (0.00, 0.00, 0.00, 0.00, 0.00; outliers 0.015, 0.065); ContPaint_L (0.00, 0.00, 0.00, 0.00, 0.00; outliers 0.015, 0.02); NoDelin (0.00, 0.00, 0.00, 0.00, 0.00; outliers None); and Sidex25ft (0.00, 0.00, 0.00, 0.00, 0.00; outliers None). For Right-Turning Curves: ContPaint_and_Topx50ft (0.00, 0.00, 0.00, 0.00, 0.00; outliers 0.02, 0.095); ContPaint_R (0.00, 0.00, 0.00, 0.00, 0.00; outlier 0.005); Topx25ft (0.00, 0.00, 0.00, 0.00, 0.00; outlier 0.03); and Topx50ft_and_Sidex50ft (0.00, 0.00, 0.00, 0.00, 0.00; outliers None). Note that the values mentioned are approximate, and for most conditions, the values (the box and whiskers) are extremely close to the 0.00 percent line. The horizontal axis reads Concrete Barrier Delineation Practices.
Long Description.
The graph is separated into two sections: Left-Turning Curves and Right-Turning Curves. The horizontal axis is labeled Concrete Barrier Delineation Practices. The vertical axis shows the Brake Pressure (percentage), ranging from 0 to 6 in increments of 2. The data provided for each road condition is presented as a set of six estimated values (Minimum, First Quartile, Median, Third Quartile, Maximum, and Outliers). For Left-Turning Curves: ContPaint_and_Topx25ft (0.5, 0.8, 1.0, 1.3, 1.5; outliers None); ContPaint_L (0.1, 0.2, 0.4, 0.6, 0.8; outlier 3.7); NoDelin (0.05, 0.1, 0.2, 0.25, 0.3; outliers None); and Sidex25ft (0.05, 0.1, 0.2, 3.5, 6.0; outliers None). For Right-Turning Curves: ContPaint_and_Topx50ft (0.5, 0.7, 0.8, 1.0, 1.3; outliers None); ContPaint_R (0.05, 0.1, 0.2, 0.3, 0.4; outlier 0.8); Topx25ft (0.5, 0.7, 0.8, 0.85, 0.9; outliers None); and Topx50ft_and_Sidex50ft (0.05, 0.1, 0.2, 0.3, 0.4; outliers None). Note that the values mentioned are approximate.
Long Description.
The graph is separated into two sections: Left-Turning Curves and Right-Turning Curves. The horizontal axis is labeled Guardrail Delineation Practices. The vertical axis shows the Average Brake Pressure (percentage), ranging from 0 to 0.5 in increments of 0.1. The data provided for each road condition is presented as a set of six estimated values (Minimum, First Quartile, Median, Third Quartile, Maximum, and Outliers). For Left-Turning Curves: YellowRubrail_and_WBeamMountx50ft (0.00, 0.00, 0.00, 0.00, 0.00; outlier 0.02); YellowRubrail (0.00, 0.00, 0.00, 0.00, 0.00; outlier 0.16); PostMountx50ft (0.00, 0.00, 0.00, 0.00, 0.00; outliers None); and PostMountx50ft_and_WBeamMountx50ft (0.00, 0.00, 0.00, 0.00, 0.00; outliers None). For Right-Turning Curves: YellowRubrail_and_PostMountx50ft_and_WBeamMountx50ft (0.02, 0.05, 0.06, 0.14, 0.16; outlier 0.40); YellowRubrail_and_PostMountx50ft (0.00, 0.01, 0.03, 0.06, 0.08; outliers 0.25, 0.35); WBeamMountx50ft (0.00, 0.01, 0.02, 0.03, 0.04; outliers 0.25, 0.29); and NoDelin (0.00, 0.02, 0.04, 0.08, 0.10; outliers 0.30, 0.48). Note that the values mentioned are approximate.
Long Description.
The graph is separated into two sections: Left-Turning Curves and Right-Turning Curves. The horizontal axis is labeled Guardrail Delineation Practices. The vertical axis shows the Brake Pressure (percentage), ranging from 0 to 3 in increments of 1. The data provided for each road condition is presented as a set of six estimated values (Minimum, First Quartile, Median, Third Quartile, Maximum, and Outliers). For Left-Turning Curves: YellowRubrail_and_WBeamMountx50ft (0.00, 0.00, 0.00, 0.3, 0.4; outliers None); YellowRubrail (0.00, 1.4, 1.4, 1.4, 1.4; outliers None); PostMountx50ft (0.00, 0.00, 0.00, 0.00, 0.00; outliers None); and PostMountx50ft_and_WBeamMountx50ft (0.00, 0.00, 0.00, 0.00, 0.00; outliers None). For Right-Turning Curves: YellowRubrail_and_PostMountx50ft_and_WBeamMountx50ft (0.6, 0.7, 1.6, 1.8, 2.7; outliers None); YellowRubrail_and_PostMountx50ft (0.00, 0.2, 0.5, 1.6, 2.2; outliers None); WBeamMountx50ft (0.3, 0.4, 0.6, 1.1, 1.7; outliers None); and NoDelin (1.1, 1.2, 1.7, 1.9, 2.5; outlier 3.1). Note that the values mentioned are approximate.
right-turn curves and an upward vertical slope for left-turn curves. This roadway geometry may have influenced the driverʼs need to react to the influence of vertical curvature through additional braking for the downward slope right-turn curve delineation practices.
Average and Maximum Throttle Pressure
Figure 28 shows the average throttle pressure along the length of the curve for concrete barrier delineation practices. Delineation practices with a continuous retroreflective paint stripe tended to have higher maximum values and smaller interquartile ranges. However, the average throttle pressure was consistent among the different delineation practices. The average maximum throttle pressure observed in the curve is presented in Figure 29. No significant observable trends existed for this variable.
Figure 30 shows the average throttle pressure along the length of the curve for different guardrail delineation practices. As observed with brake pressure, a difference in the average throttle pressure was observed between left- and right-turn curve delineation practices. This difference could similarly be attributed to the vertical curvature present at the guardrail curve site. In addition, delineation practices with post-mounted delineators had higher median values and interquartile ranges when compared to no-delineation and w-beam–mounted delineators. Figure 31 shows the average maximum throttle pressure in the curve. A similar difference existed between left- and right-turn curves. A slight increase occurred in the median value for the no-delineation and yellow rubrail practices. The delineation practices with post-mounted delineators tended to have some of the highest maximum throttle pressure values.
Average Steering Angle
Figure 32 presents the average steering angle along the length of the curve for the concrete barrier delineation practices. The only notable difference was between left- and right-turn curves.
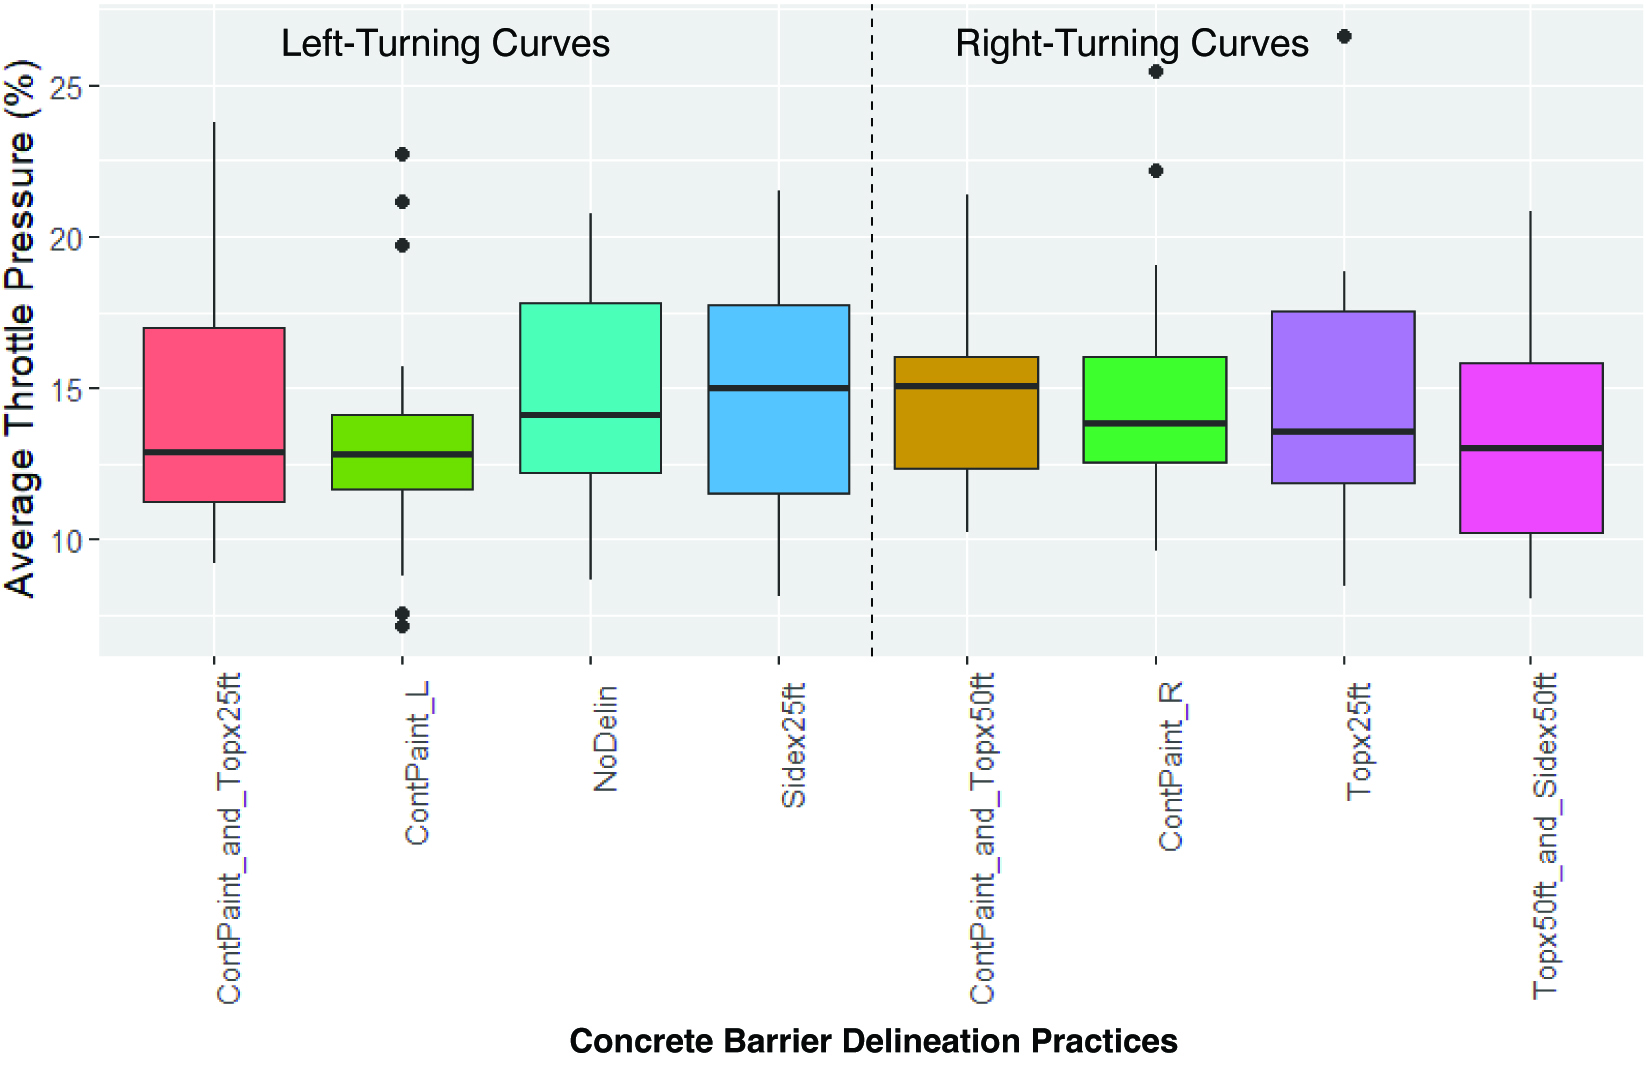
Long Description.
The graph is separated into two sections: Left-Turning Curves and Right-Turning Curves. The horizontal axis is labeled Concrete Barrier Delineation Practices. The vertical axis shows the Average Throttle Pressure (percentage), ranging from 5 to 25 in increments of 5. The data provided for each road condition is presented as a set of six estimated values (Minimum, First Quartile, Median, Third Quartile, Maximum, and Outliers). For Left-Turning Curves: ContPaint_and_Topx25ft (10, 11, 13, 17, 24; outliers None); ContPaint_L (7.5, 12, 13, 14, 18.5; outliers 20, 21, 23); NoDelin (10, 12, 14, 18, 20.5; outliers None); and Sidex25ft (8.5, 11.5, 13.5, 18, 21.5; outliers None). For Right-Turning Curves: ContPaint_and_Topx50ft (9, 12.5, 15, 16, 21; outliers None); ContPaint_R (9, 13, 14, 16.5, 19.5; outliers 22); Topx25ft (9.5, 12, 14, 18, 22.5; outliers None); and Topx50ft_and_Sidex50ft (8.5, 10.5, 13, 16, 20.5; outliers None). Note that the values mentioned are approximate.
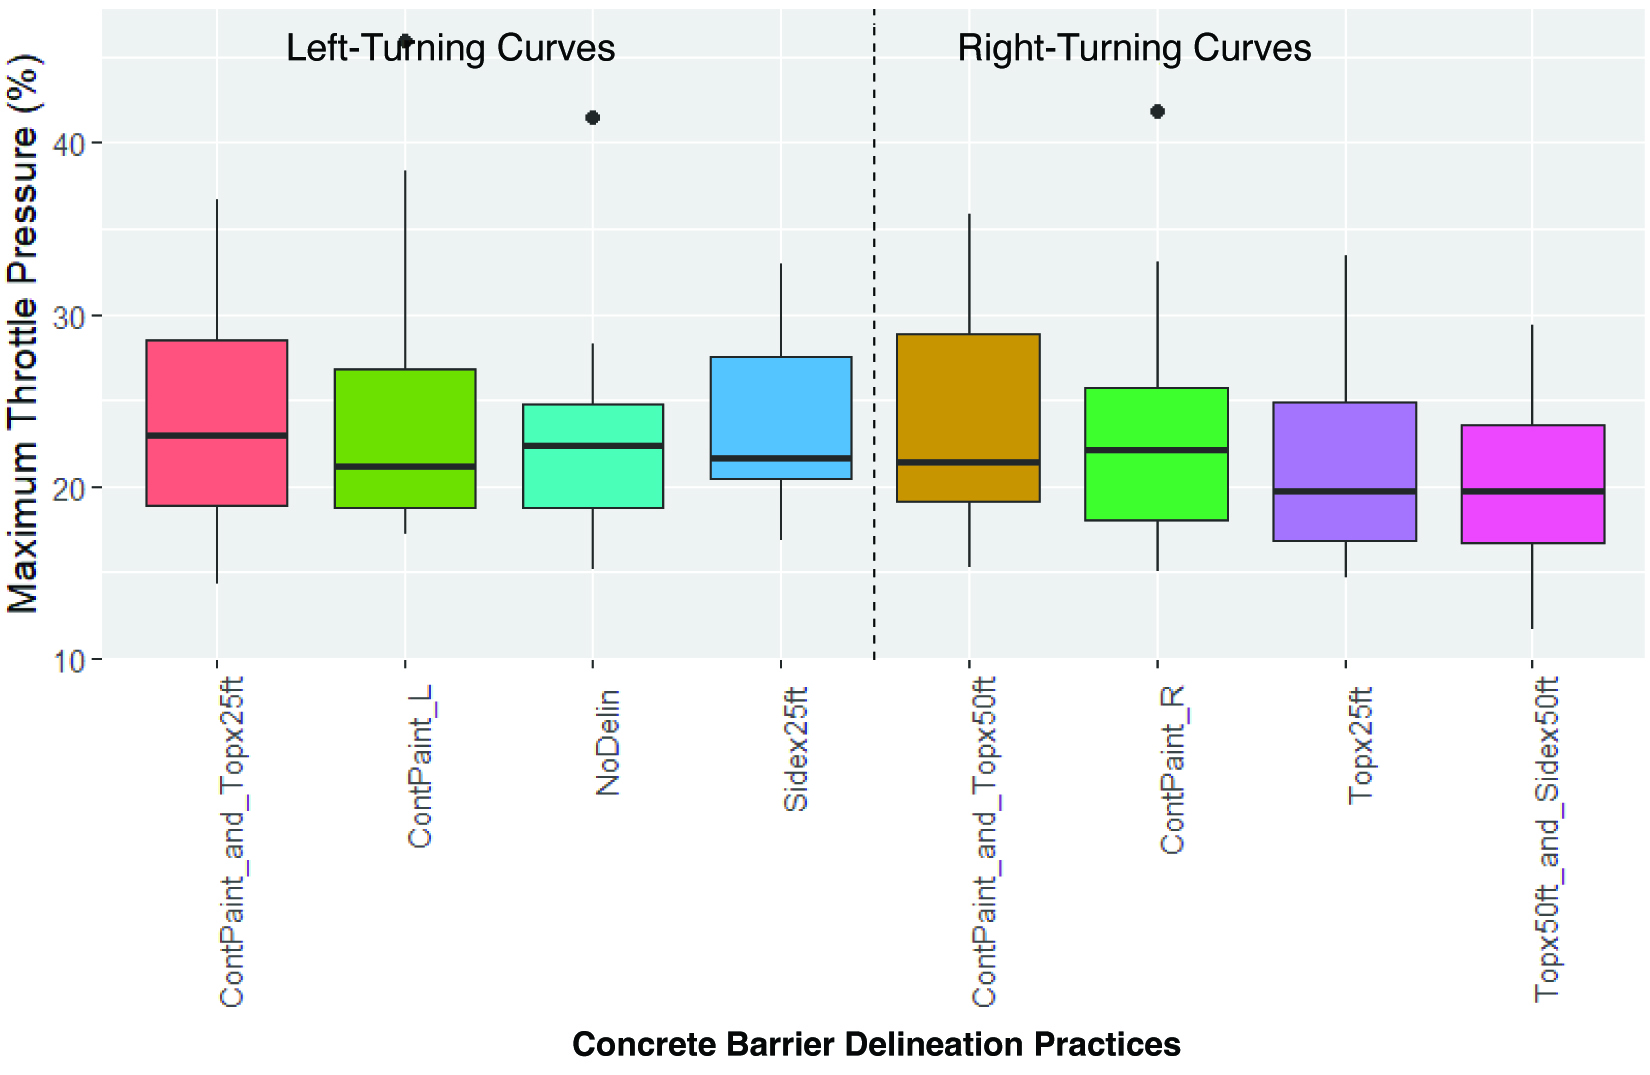
Long Description.
The graph is separated into two sections: Left-Turning Curves and Right-Turning Curves. The horizontal axis is labeled Concrete Barrier Delineation Practices. The vertical axis shows the Maximum Throttle Pressure (percentage), ranging from 10 to 40 in increments of 10. The data provided for each road condition is presented as a set of six estimated values (Minimum, First Quartile, Median, Third Quartile, Maximum, and Outliers). For Left-Turning Curves: ContPaint_and_Topx25ft (19, 20, 23, 29, 36; outliers None); ContPaint_L (19, 19, 21.5, 27, 39; outliers None); NoDelin (19, 19, 22.5, 25, 28; outlier 41); and Sidex25ft (21, 21, 22, 28, 33; outliers None). For Right-Turning Curves: ContPaint_and_Topx50ft (18, 19, 22, 29, 35; outliers None); ContPaint_R (18, 19, 22.5, 27, 33; outlier 42); Topx25ft (16, 17, 20, 25, 33; outliers None); and Topx50ft_and_Sidex50ft (16, 18, 20, 24, 30; outliers None). Note that the values mentioned are approximate.
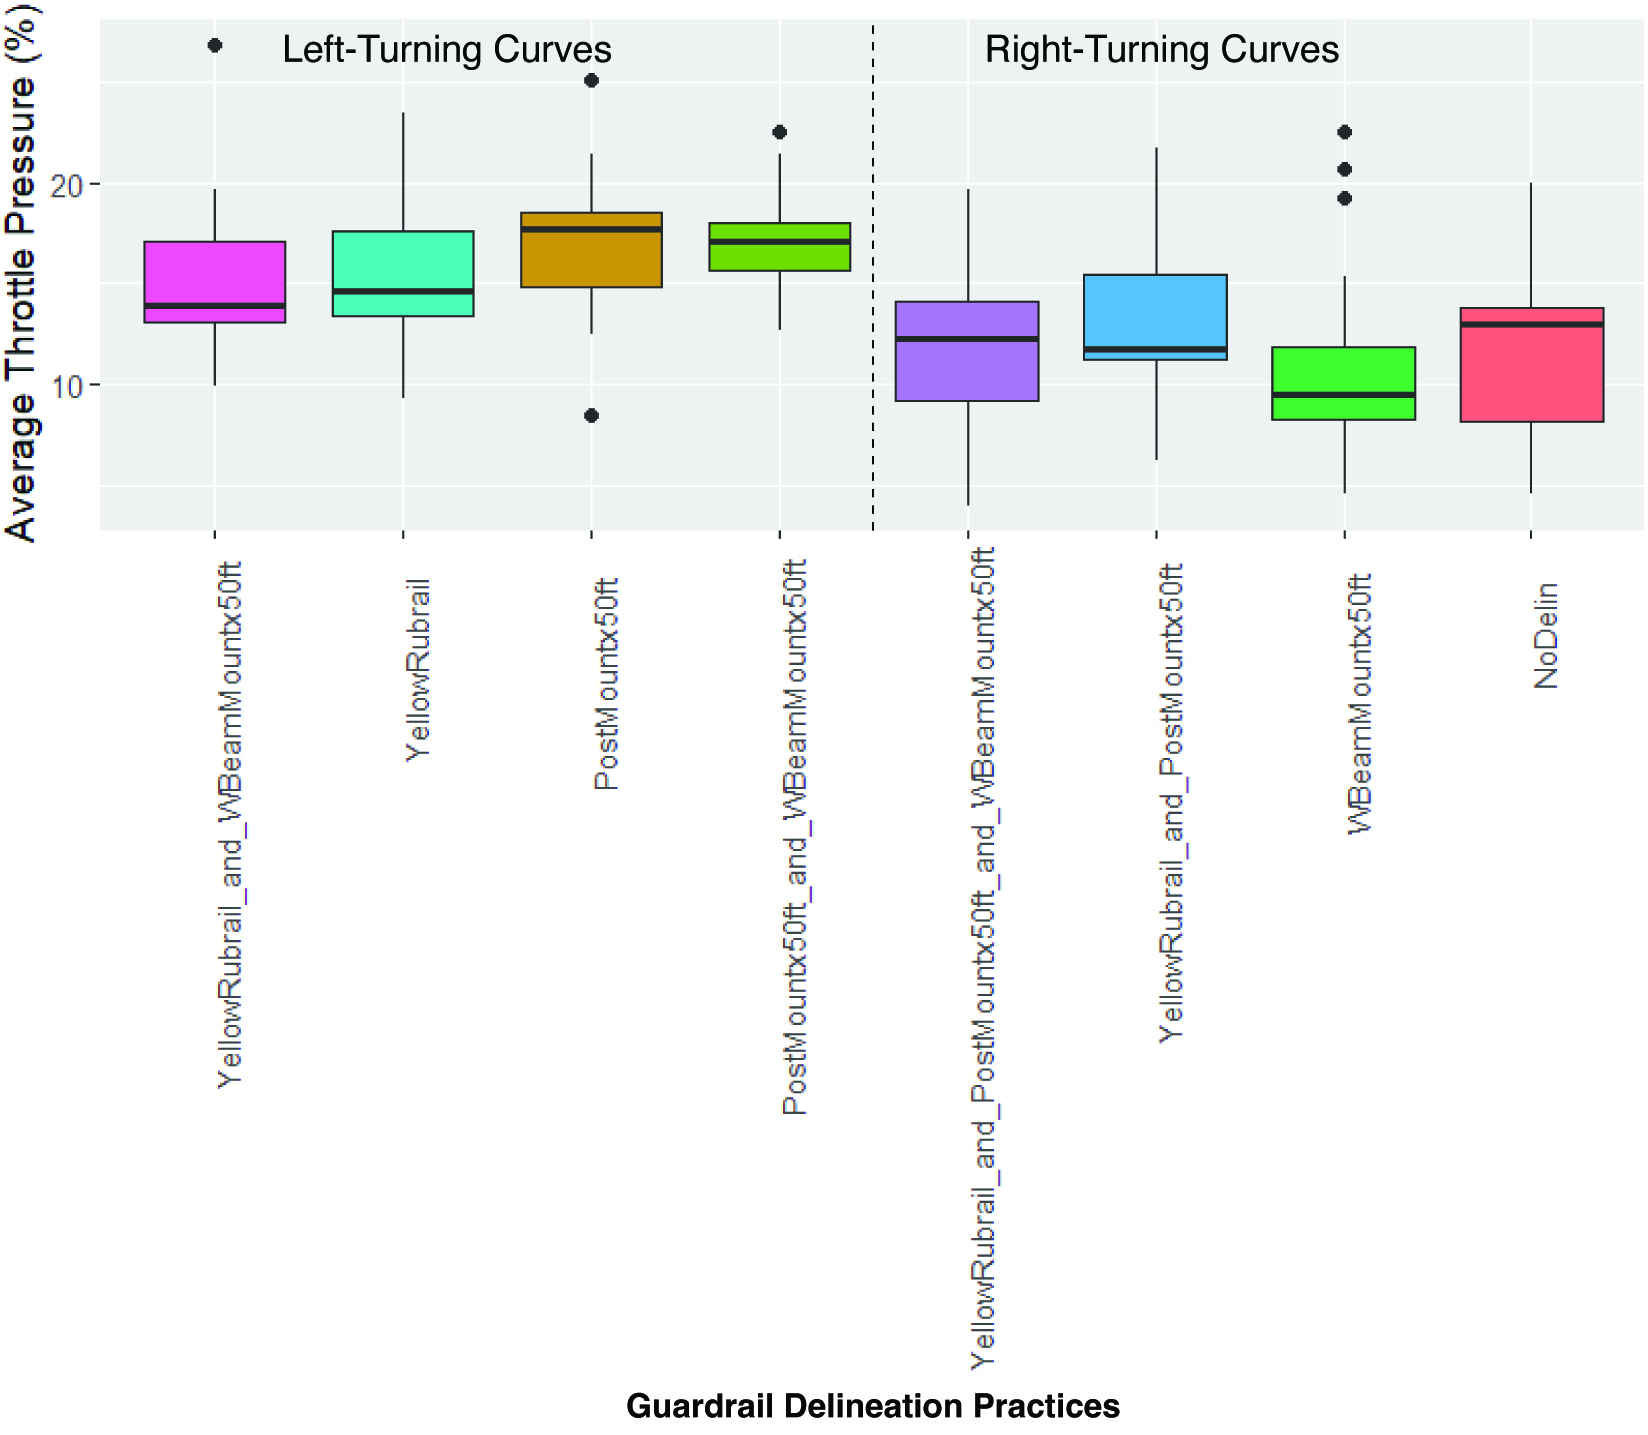
Long Description.
The graph is separated into two sections: Left-Turning Curves and Right-Turning Curves. The horizontal axis is labeled Guardrail Delineation Practices.The vertical axis shows the Average Throttle Pressure (percentage), ranging from 0 to 25 in increments of 10. The data provided for each road condition is presented as a set of six estimated values (Minimum, First Quartile, Median, Third Quartile, Maximum, and Outliers). For Left-Turning Curves: YellowRubrail_and_WBeamMountx50ft (11.5, 12, 13.5, 17, 19; outlier 25); YellowRubrail (10, 14, 15, 17, 19; outliers None); PostMountx50ft (8.5, 17, 18.5, 19, 21; outlier 9); and PostMountx50ft_and_WBeamMountx50ft (13.5, 17, 18.5, 19, 21; outliers None). For Right-Turning Curves: YellowRubrail_and_PostMountx50ft_and_WBeamMountx50ft (10, 11, 12, 14, 20; outliers None); YellowRubrail_and_PostMountx50ft (10, 12, 13, 16, 18; outliers None); WBeamMountx50ft (8, 9, 10, 11, 14; outliers 20, 21); and NoDelin (8.5, 9, 13.5, 16, 18; outliers None). Note that the values mentioned are approximate.

Long Description.
The graph is separated into two sections: Left-Turning Curves and Right-Turning Curves. The horizontal axis is labeled Guardrail Delineation Practices. The vertical axis shows the Maximum Throttle Pressure (percentage), ranging from 10 to 40 in increments of 10. The data provided for each road condition is presented as a set of six estimated values (Minimum, First Quartile, Median, Third Quartile, Maximum, and Outliers). For Left-Turning Curves: YellowRubrail_and_WBeamMountx50ft (23, 24, 25, 28, 30; outlier 40); YellowRubrail (20, 20, 29, 32, 36; outliers None); PostMountx50ft (20, 25, 27, 30, 35; outlier 15); and PostMountx50ft_and_WBeamMountx50ft (20, 20, 26, 30, 35; outliers None). For Right-Turning Curves: YellowRubrail_and_PostMountx50ft_and_WBeamMountx50ft (18, 19, 22, 30, 36; outliers None); YellowRubrail_and_PostMountx50ft (17, 18, 20, 27, 33; outliers None); WBeamMountx50ft (15, 16, 18, 21, 23; outliers 31, 34); and NoDelin (17, 18, 22, 27, 30; outlier 40). Note that the values mentioned are approximate.
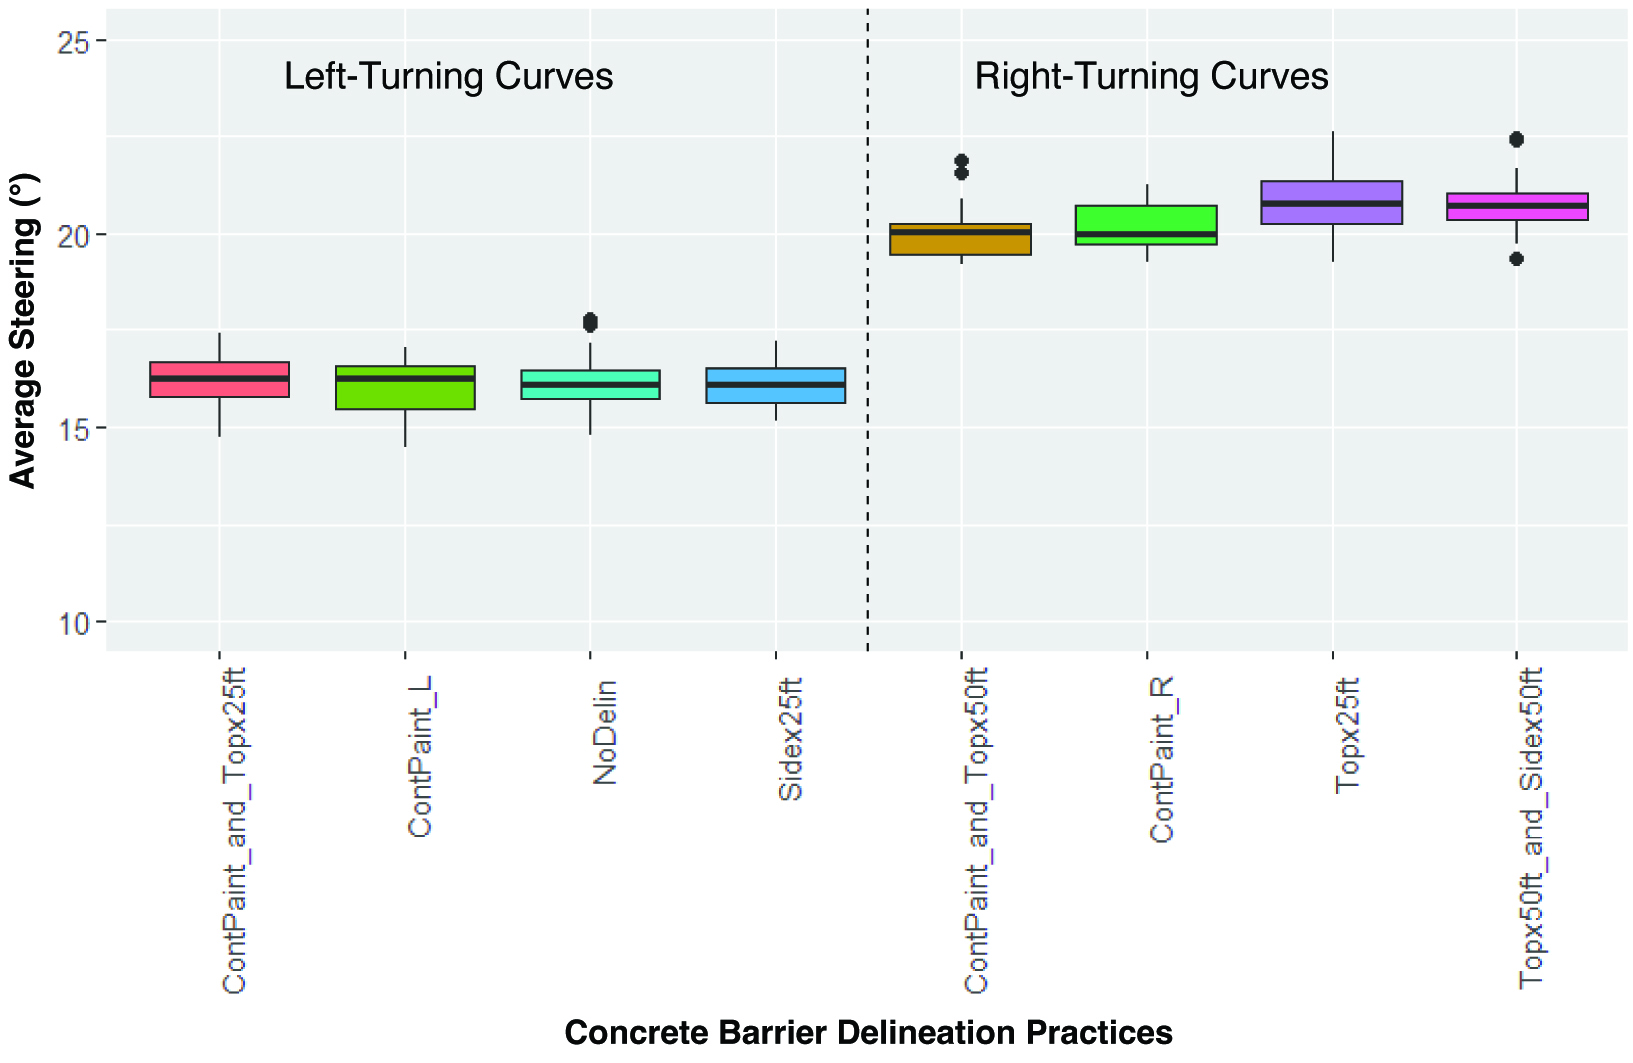
Long Description.
The graph is separated into two sections: Left-Turning Curves and Right-Turning Curves. The horizontal axis is labeled Concrete Barrier Delineation Practices.The vertical axis shows the Average Steering (Degrees), ranging from 10 to 25 in increments of 5. The data provided for each road condition is presented as a set of six estimated values (Minimum, First Quartile, Median, Third Quartile, Maximum, and Outliers). For Left-Turning Curves: ContPaint_and_Topx25ft (16, 16, 16.5, 17, 17; outliers None); ContPaint_L (15.5, 16, 16.5, 17, 17; outliers None); NoDelin (16, 16, 16.5, 17, 17; outlier 18); and Sidex25ft (16, 16, 16.5, 17, 17; outliers None). For Right-Turning Curves: ContPaint_and_Topx50ft (20, 20, 20, 20.5, 21; outlier 22); ContPaint_R (20, 20, 20.5, 21, 21; outliers None); Topx25ft (20.5, 20.5, 21, 21.5, 22; outliers None); and Topx50ft_and_Sidex50ft (19.5, 20.5, 21, 21.5, 22; outlier 23). Note that the values mentioned are approximate.
This difference can likely be attributed to being in the outside or inside lanes. Similar to the concrete barrier delineation practices, the average steering angles remained consistent for the left- and right-turn curve guardrail delineation practices while showing a clear separation between the two curve directions, as shown in Figure 33.
Driver Gaze
An eye-tracking system was installed in the instrumented vehicle to evaluate the participantsʼ gaze behavior. Two main parameters were analyzed for each participant: dwell count and dwell time. Dwell count represented the number of times a participant looked at the delineation practice while traversing through the curve. Dwell time represented the combined length of time each participant looked at the delineation practice while traversing through the curve. Figures 34 and 35 show the average dwell counts for the concrete barrier and guardrail delineation practices, respectively.
Concrete barrier delineation practices with continuous retroreflective paint stripes tended to have higher dwell counts when compared to the other delineation practices. Delineation practices with the top- and side-mounted delineators tended to have lower dwell counts when compared to the other delineation practices. The guardrail delineation practices did not exhibit significant variance for the dwell count. Delineation practices with yellow rubrail did appear to
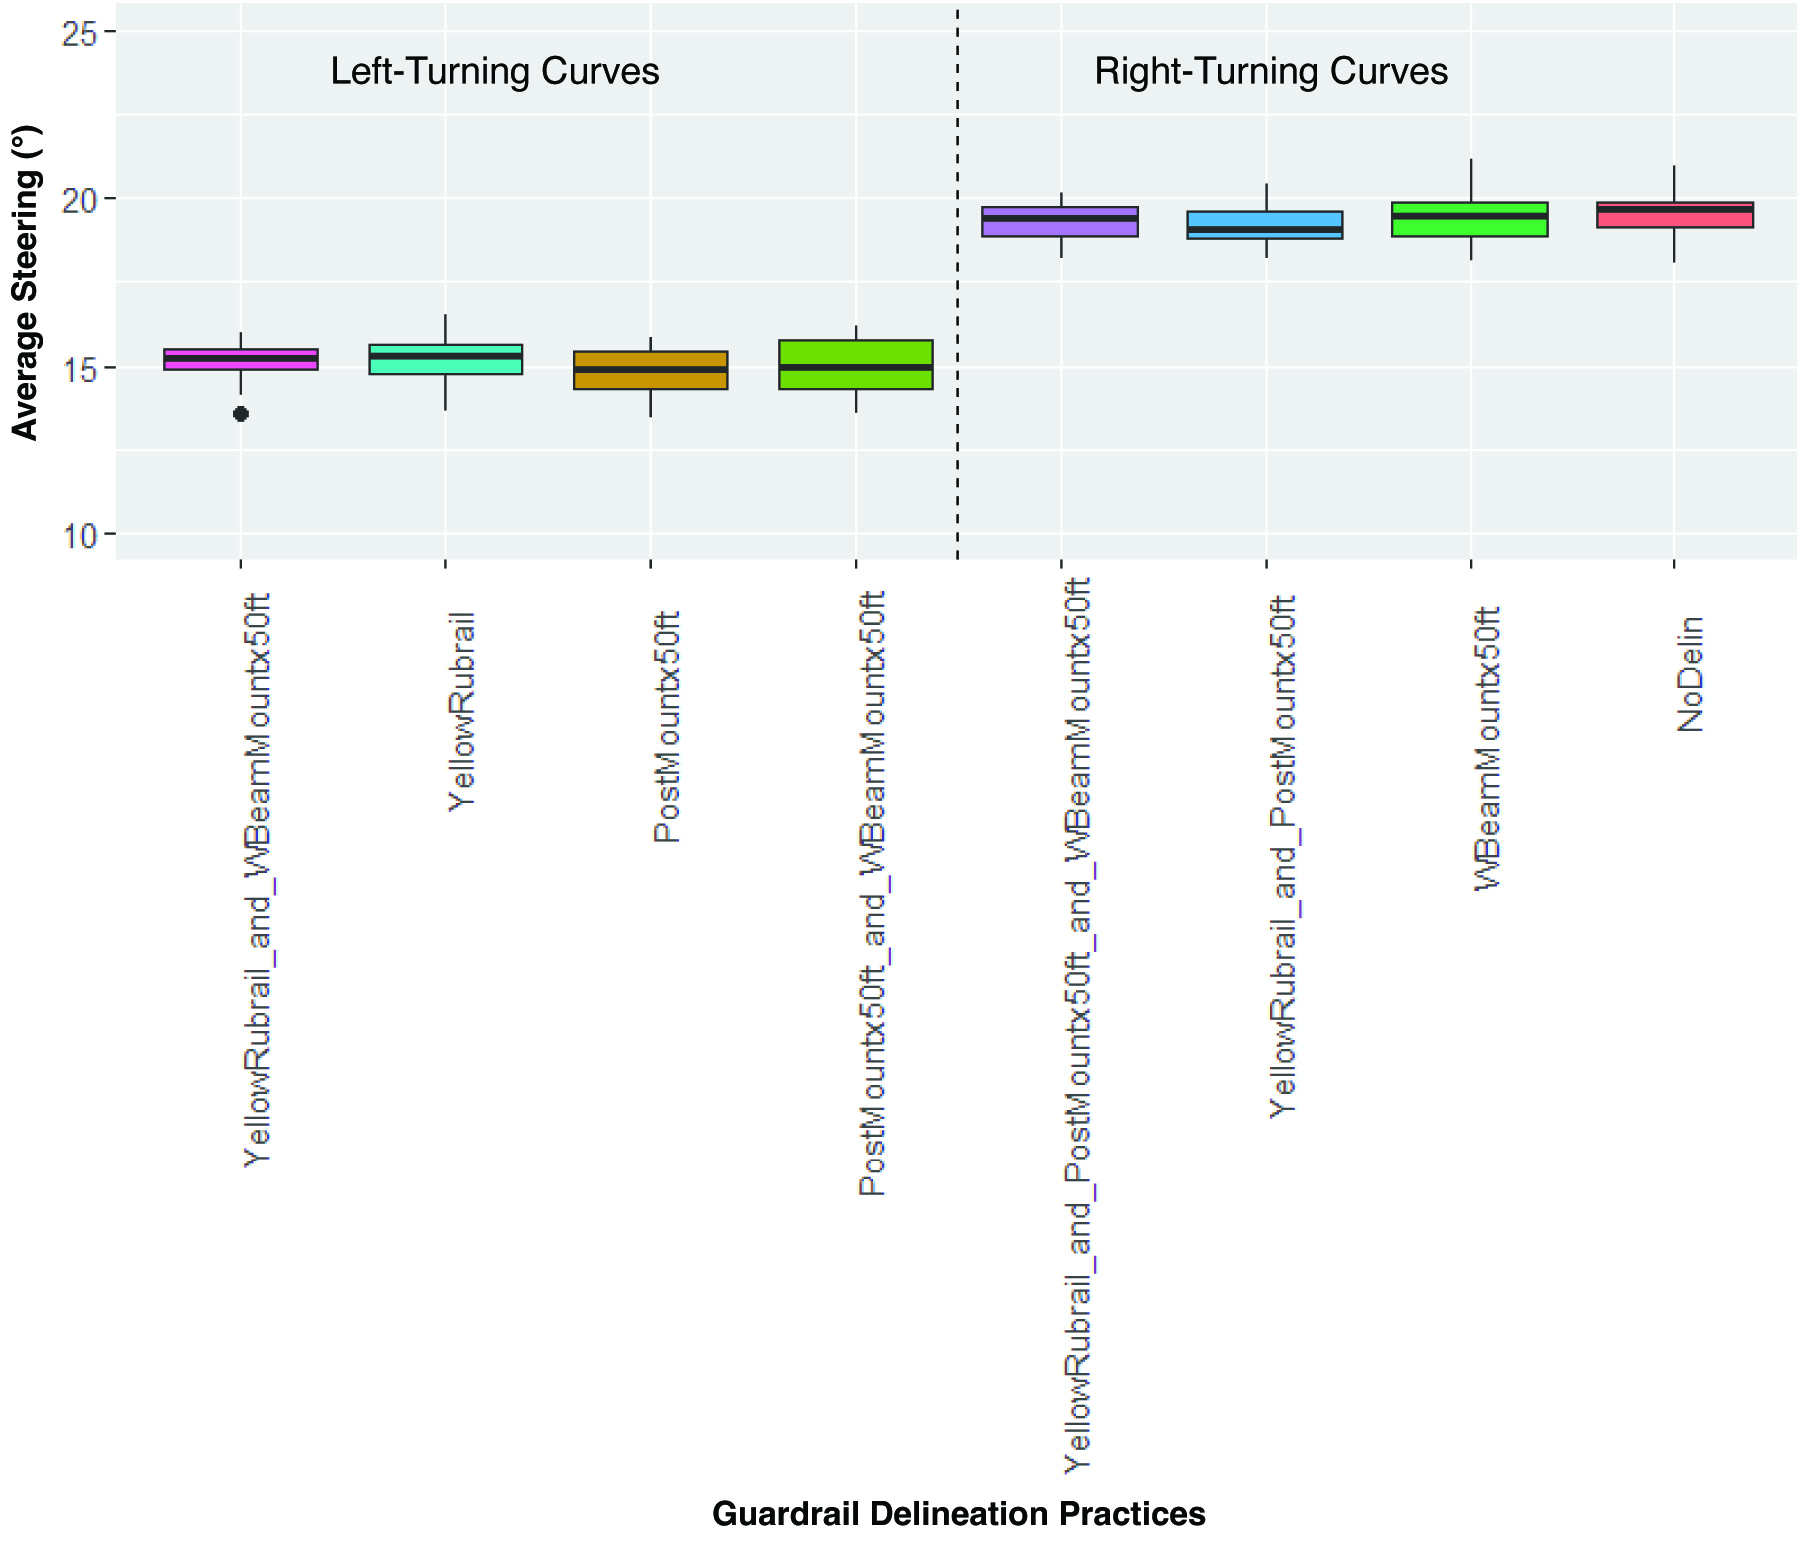
Long Description.
The graph is separated into two sections: Left-Turning Curves and Right-Turning Curves. The horizontal axis is labeled Guardrail Delineation Practices. The vertical axis shows the Average Steering (Degrees), ranging from 10 to 25 in increments of 5. The data provided for each road condition is presented as a set of six estimated values (Minimum, First Quartile, Median, Third Quartile, Maximum, and Outliers). For Left-Turning Curves: YellowRubrail_and_WBeamMountx50ft (15, 15, 15.5, 16, 16; outlier 14); YellowRubrail (15, 15, 15.5, 16, 16; outliers None); PostMountx50ft (15, 15, 15.5, 16, 16; outliers None); and PostMountx50ft_and_WBeamMountx50ft (15, 15, 15.5, 16, 16; outliers None). For Right-Turning Curves: YellowRubrail_and_PostMountx50ft_and_WBeamMountx50ft (19, 19, 19.5, 20, 20; outliers None); YellowRubrail_and_PostMountx50ft (19, 19, 19.5, 20, 20; outliers None); WBeamMountx50ft (19, 19, 19.5, 20, 20; outliers None); and NoDelin (19, 19, 19.5, 20, 20; outliers None). Note that the values mentioned are approximate.

Long Description.
The graph is separated into two sections: Left-Turning Curves and Right-Turning Curves. The horizontal axis is labeled Concrete Barrier Delineation Practices. The vertical axis shows the Dwell Count ranging from 0 to 15 in increments of 5. The data provided for each road condition is presented as a set of six estimated values (Minimum, First Quartile, Median, Third Quartile, Maximum, and Outliers). For Left-Turning Curves: ContPaint_and_Topx25ft (5, 6, 8, 10, 15; outliers None); ContPaint_L (4, 7, 10, 11, 15; outliers None); NoDelin (3, 6, 9, 10, 13; outliers None); and Sidex25ft (4, 6, 7, 10, 15; outliers None). For Right-Turning Curves: ContPaint_and_Topx50ft (5, 6, 7, 9, 12; outliers None); ContPaint_R (5, 6, 7, 9, 12; outlier 14); Topx25ft (5, 6, 7, 8, 11; outliers 12, 13, 14); and Topx50ft_and_Sidex50ft (5, 6, 7, 8, 12; outlier 2). Note that the values mentioned are approximate.
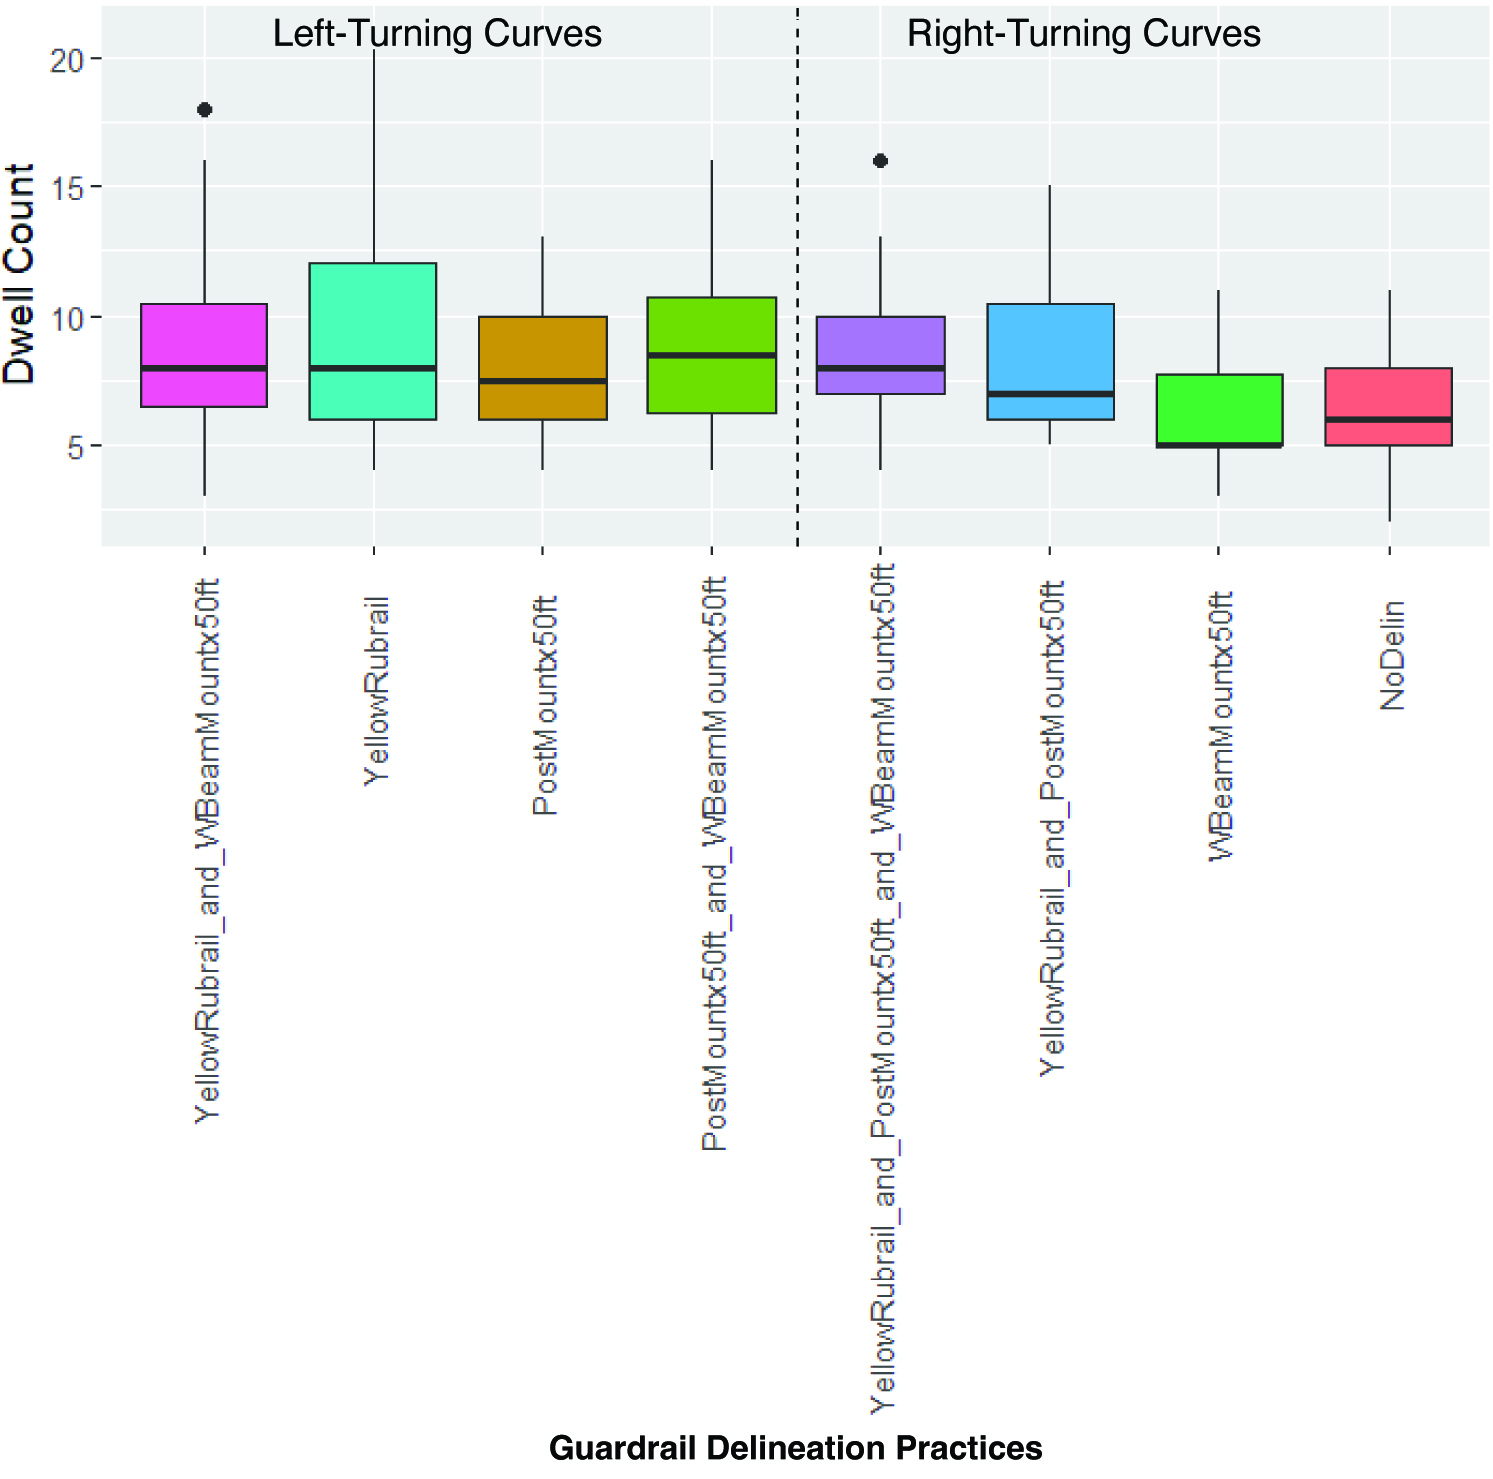
Long Description.
The graph is separated into two sections: Left-Turning Curves and Right-Turning Curves. The horizontal axis is labeled Guardrail Delineation Practices. The data provided for each road condition is presented as a set of six estimated values (Minimum, First Quartile, Median, Third Quartile, Maximum, and Outliers). For Left-Turning Curves: YellowRubrail_and_WBeamMountx50ft (6, 7, 8, 10, 12; outlier 18); YellowRubrail (6, 6, 8, 12, 14; outliers None); PostMountx50ft (5, 6, 8, 10, 14; outliers None); and PostMountx50ft_and_WBeamMountx50ft (6, 7, 8.5, 10.5, 16; outliers None). For Right-Turning Curves: YellowRubrail_and_PostMountx50ft_and_WBeamMountx50ft (6, 7, 8, 10, 12; outlier 16); YellowRubrail_and_PostMountx50ft (6, 7, 8, 10, 12; outliers None); WBeamMountx50ft (5, 5, 6, 8, 11; outliers None); and NoDelin (5, 5, 6, 8, 10; outliers None). Note that the values mentioned are approximate.
increase dwell count, although this increase was minimal. One overall trend for concrete barrier and guardrail delineation practices was that right-turn curves had lower dwell counts than left-turn curves. This observation could be attributed to the increased offset from the delineation practice due to the participant being in the inside lane for the right-turn curve.
A multiple regression analysis was performed to investigate the impact of various parameters on dwell count. The parameters included in the analysis were delineation practice, hardware type (i.e., concrete barrier or guardrail), age, curve direction, and gender. Since the outcome variable represents count data, a Poisson regression model was the appropriate modeling choice. The reference parameters were continuous retroreflective paint stripe, concrete barrier, age, left-turn curve, and female gender. The model parameters are presented in Table 29.
None of the concrete barrier delineation practices indicated statistically significant differences in dwell count. Continuous retroreflective paint stripe and top-mounted delineators spaced at 50 ft were marginally significant (p < 0.10) for an increase in dwell count. None of the guardrail delineation practices were statistically significant for dwell count. Among the demographic and contextual variables, curve direction and gender were statistically significant. Participants traversing through the curve in a right-turn direction were associated with a 20% decrease in dwell count compared to the left-turn curves (p = 0.044). This observation could likely be attributed to an increased offset from the delineation practice in the inside lane for right-turn curves.

*** 0 < p-value ≤ 0.001
** 0.001 < p-value ≤ 0.01
* 0.01 < p-value ≤ 0.05
Long Description.
The table displays two sections: Model Parameter Results and Model Analysis Results. The first section shows five columns and 18 rows. The column headers from the second column are as follows: estimate, standard error, z value, and p value derived from the z-test. The data given are as follows: Row 1: (Intercept): 2.24, 0.09, 23.91, and less than 2 exponent minus 16 (The p-value is less than or equal to 0.001, but greater than 0). Row 2: Continuous Retroreflective Paint Stripe (Right): negative 0.06, 0.11, negative 0.57, and 0.57. Row 3: Continuous Retroreflective Paint Stripe and Top-Mounted Delineators (25 feet): 0.21, 0.11, 1.84, and 0.07. Row 4: Continuous Retroreflective Paint Stripe and Top-Mounted Delineators (50 feet): negative 0.11, 0.11, negative 0.99, and 0.32. Row 5: No Delineation (Concrete Barrier): negative 0.10, 0.22, negative 0.46, and 0.65. Row 6: Side-Mounted Delineators (25 feet): negative 0.03, 0.12, negative 0.23, and 0.82. Row 7: Top-Mounted Delineators (25 feet): negative 0.14, 0.17, negative 0.84, and 0.40. Row 8: Top-Mounted Delineators and Side-Mounted Delineators (50 feet): negative 0.04, 0.22, negative 0.17, and 0.87. Row 9: Post-Mounted Delineators (50 feet): 0.01, 0.12, 0.11, and 0.91. Row 10: Post-Mounted and W-Beam-Mounted Delineators (50 feet): negative 0.20, 0.11, negative 1.83, and 0.07. Row 11: W-Beam-Mounted Delineators (50 feet): 0.02, 0.22, 0.10, and 0.92. Row 12: Yellow Rubrail: 0.13, 0.16, 0.77, and 0.44. Row 13: Yellow Rubrail and Post-Mounted Delineators (50 feet): negative 0.03, 0.22, negative 0.13, and 0.89. Row 14: Yellow Rubrail and W-Beam-Mounted Delineators (50 feet): 0.16, 0.16, 0.97, and 0.33. Row 15: Yellow Rubrail, W-Beam-Mounted Delineators, and Post-Mounted Delineators (50 feet): negative 0.04, 0.16, negative 0.23, and 0.82. Row 16: Hardware Type - Guardrail: 0.00, 0.00, 1.18, and 0.24. Row 17: Age: negative 0.23, 0.11, negative 2.02, and 0.04 (The p-value is less than or equal to 0.05, but greater than 0.01). Row 18: Curve Direction - Right: negative 0.15, 0.04, negative 3.70, and 0.00 (The p-value is less than or equal to 0.001, but greater than 0). The second section shows 2 columns. The data given are as follows: Column 1: Dispersion ratio equals 1.111, Pearson’s Chi-Squared equals 335.37, and p-value equals 0.09. Column 2: No overdispersion detected.
Male participants exhibited a 14% lower dwell count than female participants (p < 0.001), indicating a potential gender-related behavioral difference. Age did not significantly affect dwell counts.
Dwell time was measured in milliseconds. Figures 36 and 37 show the average total dwell time for the concrete barrier and guardrail delineation practices, respectively. Concrete barrier delineation practices with continuous retroreflective paint stripes and side-mounted delineators tended to have higher dwell times when compared to the other delineation practices. The no-delineation practice had the lowest dwell time compared to the other practices.
Guardrail delineation practices with post-mounted delineators on the left-turn curve had higher dwell times than the other delineation practices. This effect was not as apparent for delineation practices on the right-turn curve. The presence of yellow rubrail tended to result in the lowest dwell time. A multiple regression analysis was performed to investigate the impact of various parameters on dwell time. The parameters included in the analysis were delineation practice, hardware type (i.e., concrete barrier or guardrail), age, curve direction, and gender. This model used a standard linear regression method since the outcome variable was continuous. The reference parameters were continuous retroreflective paint stripe, concrete barrier, age, left-turn curve, and female gender. The model parameters are presented in Table 30.
None of the concrete barrier delineation practices indicated statistically significant differences in dwell time. The only statistically significant guardrail delineation practice was yellow rubrail with post-mounted delineators spaced at 50 ft. This effect was associated with a significant decrease in average dwell time. The other yellow rubrail delineation practices were marginally significant and similarly associated with decreased average dwell time.
Demographics did have a significant influence on dwell time. Male participants exhibited significantly shorter dwell times than female participants, averaging 1,495 ms less (p < 0.001). Older participants had longer dwell times, with each year of age associated with an increase of 26 ms (p = 0.0017).
The right-turn curve direction indicated a marginally significant reduction of 1,387 ms (p = 0.086) in dwell time.
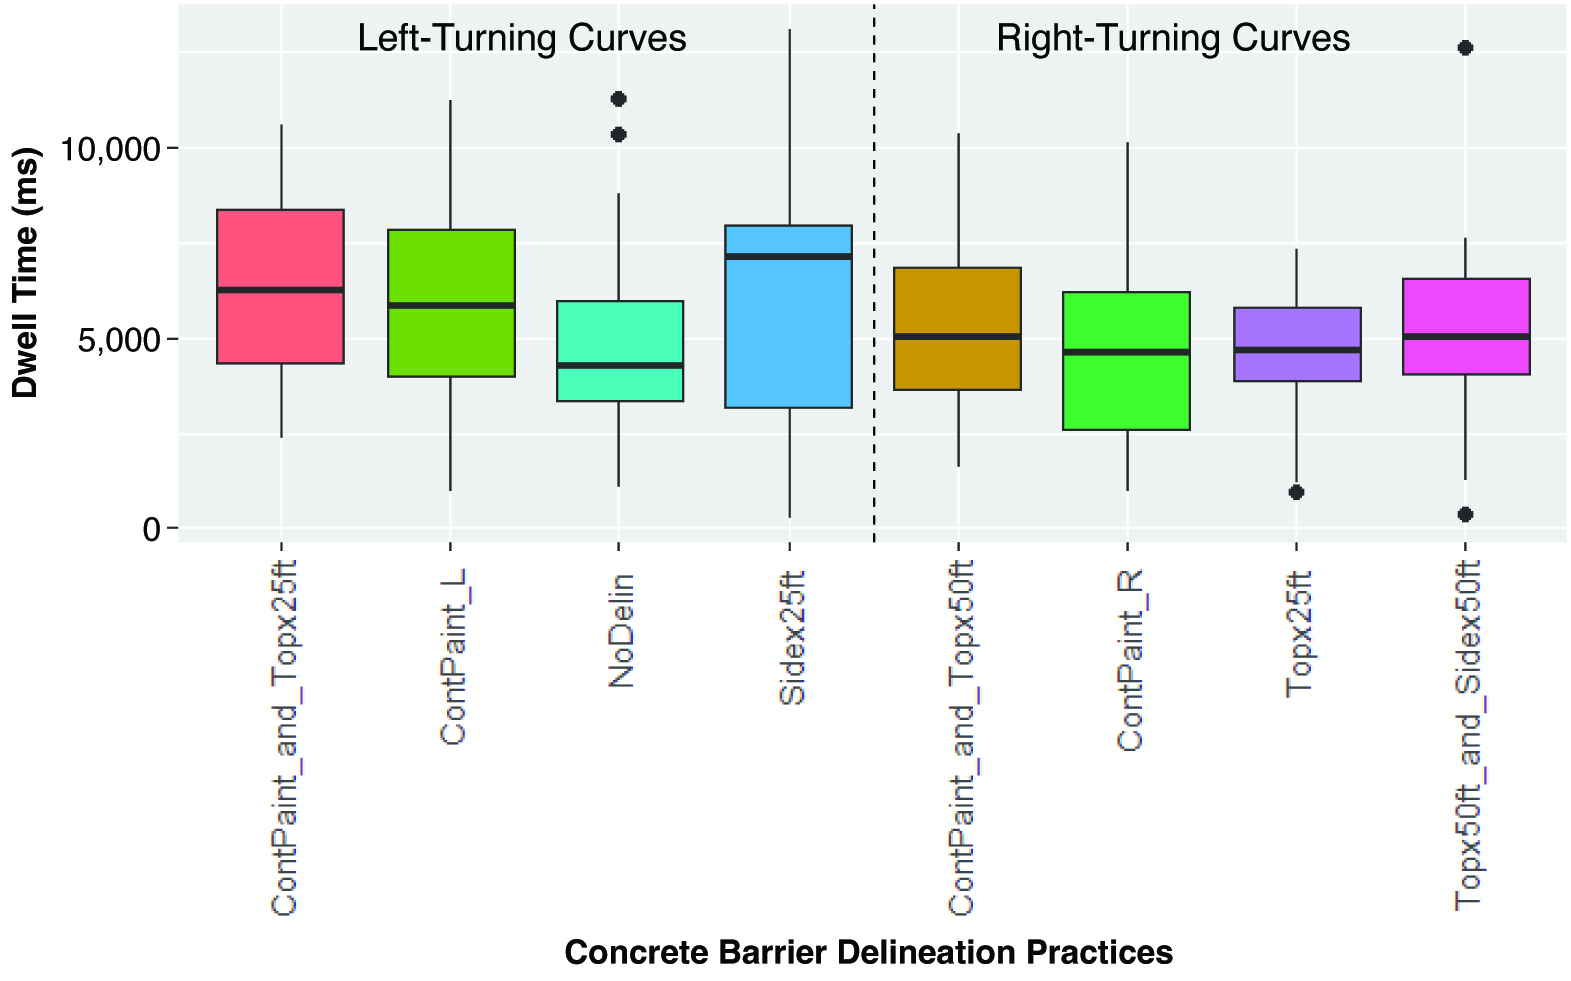
Long Description.
The graph is separated into two sections: Left-Turning Curves and Right-Turning Curves. The horizontal axis is labeled Concrete Barrier Delineation Practices. The vertical axis shows the Dwell Length (milliseconds), ranging from 0 to 15000 (implied maximum) in increments of 5000. The data provided for each road condition is presented as a set of six estimated values (Minimum, First Quartile, Median, Third Quartile, Maximum, and Outliers). For Left-Turning Curves: ContPaint_and_Topx25ft (4000, 4500, 6500, 8500, 10500; outliers None); ContPaint_L (3000, 4000, 6000, 8000, 9000; outliers None); NoDelin (1000, 3500, 4500, 6000, 8000; outlier 10500); and Sidex25ft (3000, 3500, 7500, 9000, 10000; outliers None). For Right-Turning Curves: ContPaint_and_Topx50ft (2000, 4000, 5000, 7000, 10000; outliers None); ContPaint_R (2500, 3000, 5000, 6000, 8000; outliers None); Topx25ft (3000, 4000, 5000, 6000, 7000; outlier 1000); and Topx50ft_and_Sidex50ft (3500, 4000, 5000, 7000, 8000; outlier 100). Note that the values mentioned are approximate.
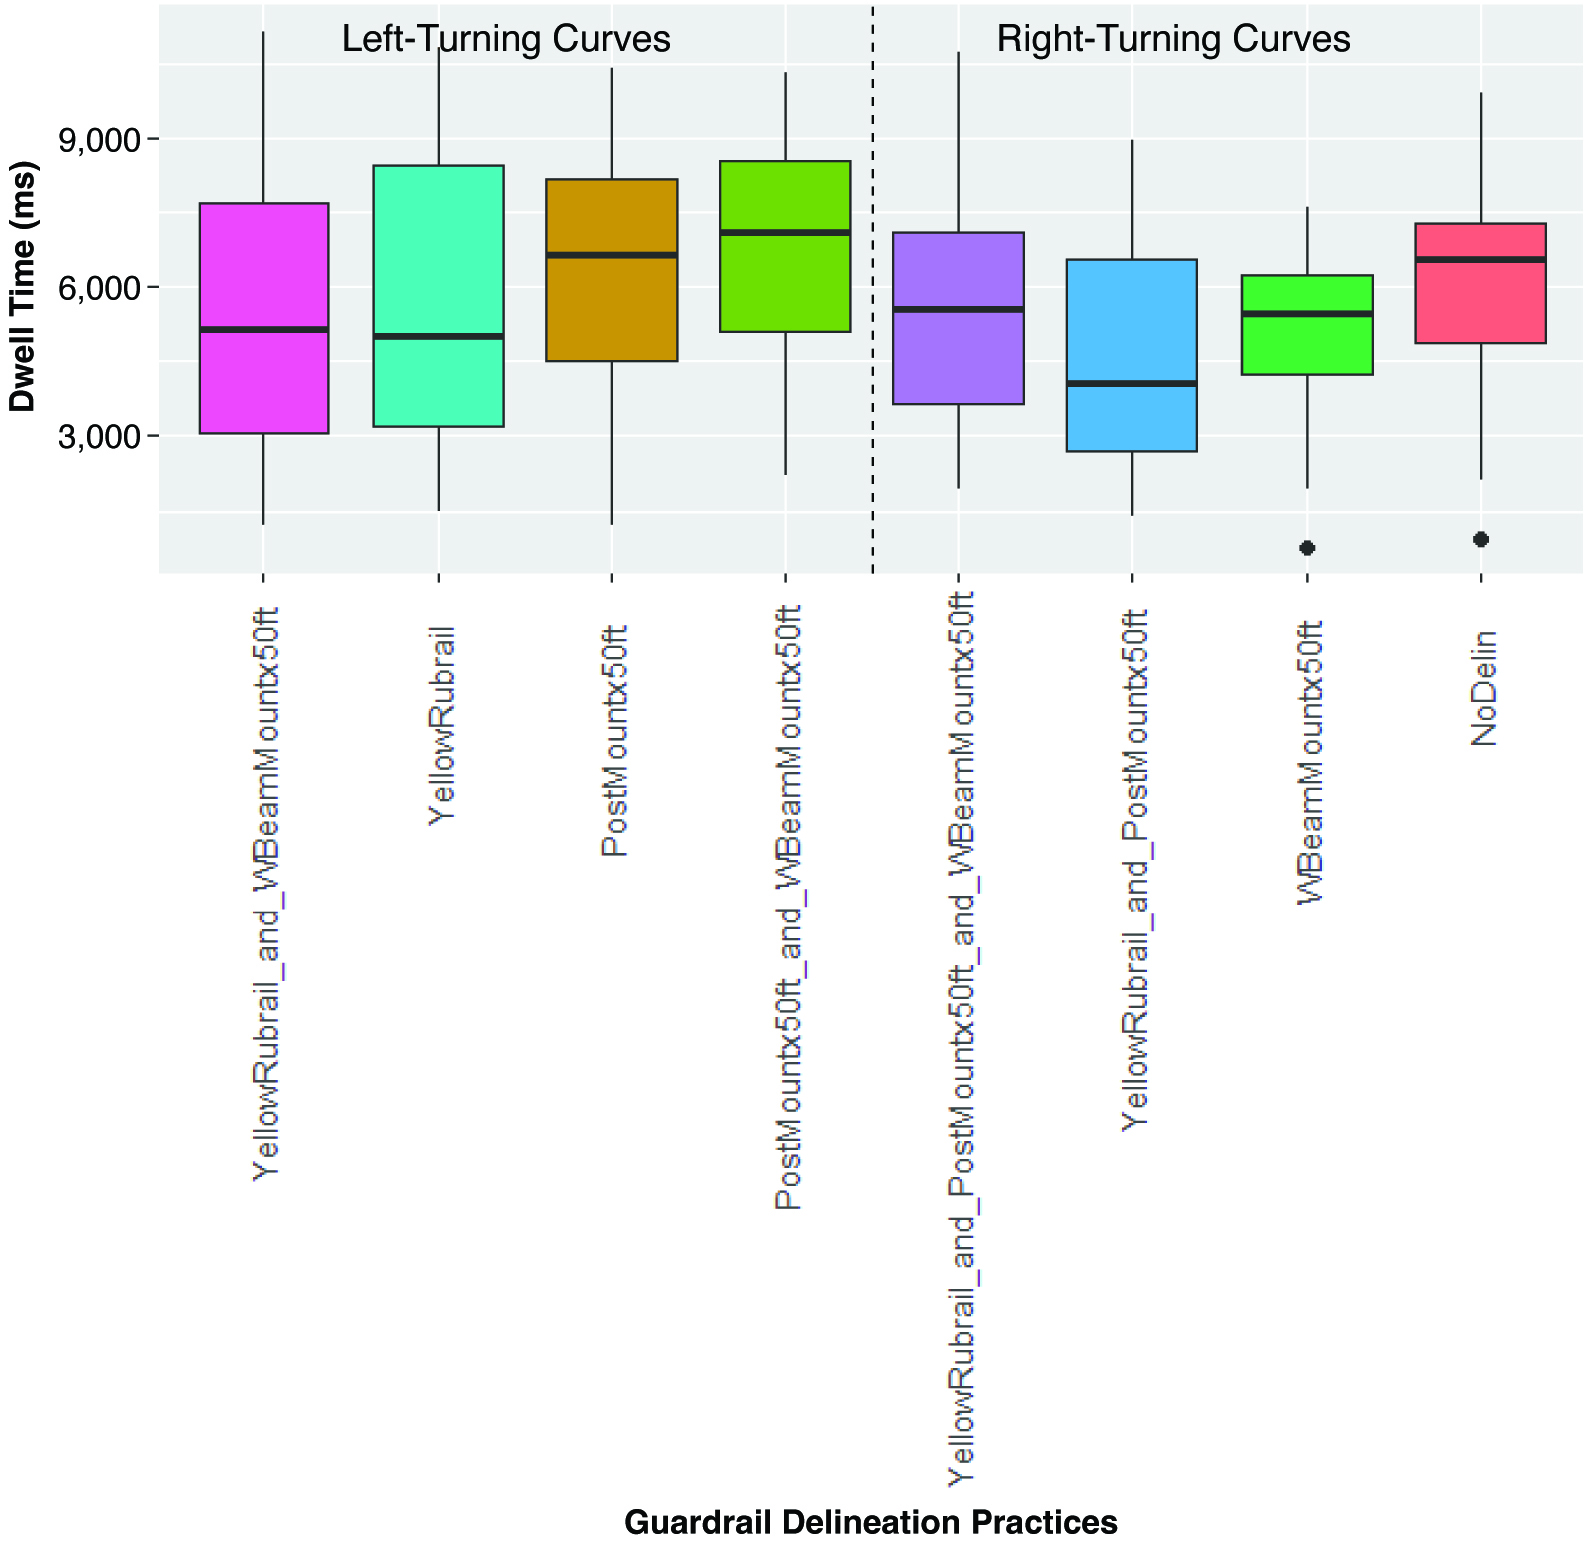
Long Description.
The graph is separated into two sections: Left-Turning Curves and Right-Turning Curves. The horizontal axis is labeled Guardrail Delineation Practices. The vertical axis shows the Dwell Length (milliseconds), ranging from 3000 to 9000 in increments of 3000. The data provided for each road condition is presented as a set of six estimated values (Minimum, First Quartile, Median, Third Quartile, Maximum, and Outliers). For Left-Turning Curves: YellowRubrail_and_WBeamMountx50ft (3000, 4500, 5500, 8000, 8500; outliers None); YellowRubrail (3000, 4500, 5500, 9000, 9000; outliers None); PostMountx50ft (4000, 5000, 6500, 8500, 9000; outliers None); and PostMountx50ft_and_WBeamMountx50ft (4000, 5500, 6500, 8500, 9000; outliers None). For Right-Turning Curves: YellowRubrail_and_PostMountx50ft_and_WBeamMountx50ft (3500, 4000, 5500, 7000, 8500; outliers None); YellowRubrail_and_PostMountx50ft (3000, 3500, 4500, 6500, 7500; outliers None); WBeamMountx50ft (4000, 4500, 5000, 6500, 7500; outlier 1500); and NoDelin (5000, 5500, 6500, 7500, 8000; outlier 1500). Note that the values mentioned are approximate.
Computer-Based Study
The computer-based study was conducted at five different sites. Participants were recruited from four cities: (1) Houston, TX; (2) Des Moines, IA; (3) San Diego, CA; and (4) Boston, MA. Participants from the closed-course study in Bryan, TX, also completed the computer-based study. A total of 148 participants completed the computer-based study. Each participant completed two sections of the computer-based study. The results from both sections of the study were analyzed to evaluate driversʼ responses to different delineation practices.
Data Post-Processing
The outputs from the SuperLab portion of the computer-based study consisted of a time stamp for when participants pressed the keyboard button to indicate the curve direction or roadside object detection. This time stamp was converted to a distance from the start of the delineation practice using the known vehicle speed of 40 mi/h. An average of all the participantsʼ responses was calculated and applied to the calculated distances for each delineation practice.
The outputs from the survey questionnaire portion of the computer-based study consisted of open-ended text responses and numerical rating values. For the first series of open-ended survey questions, a count of the times specific keywords were mentioned was used to identify common
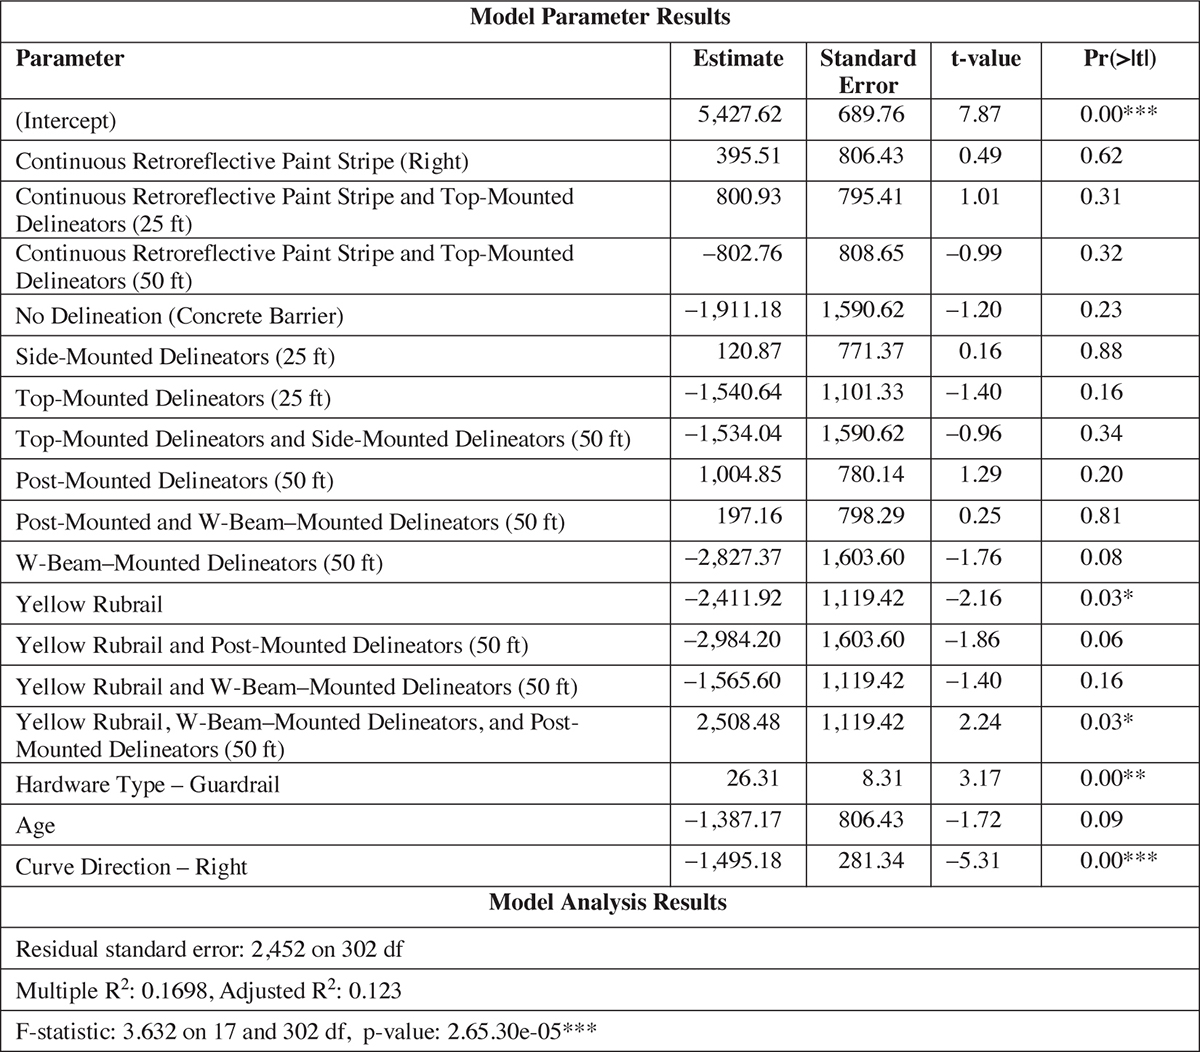
*** 0 < p-value ≤ 0.001
** 0.001 < p-value ≤ 0.01
* 0.01 < p-value ≤ 0.05
Long Description.
The table displays two sections: Model Parameter Results and Model Analysis Results. The first section shows 5 columns and 18 rows. The column headers from the second column are as follows: estimate, standard error, t value, and p value derived from the t-test. The data given are as follows: Row 1: (Intercept): 5427.62, 689.76, 7.87, and 0.00 (The p-value is less than or equal to 0.001, but greater than 0). Row 2: Continuous Retroreflective Paint Stripe (Right): 393.31, 806.43, 0.49, and 0.62. Row 3: Continuous Retroreflective Paint Stripe and Top-Mounted Delineators (25 feet): 800.90, 795.41, 1.01, and 0.31. Row 4: Continuous Retroreflective Paint Stripe and Top-Mounted Delineators (50 feet): negative 402.76, 806.65, negative 0.99, and 0.32. Row 5: No Delineation (Concrete Barrier): negative 1911.18, 1590.62, negative 1.20, and 0.23. Row 6: Side-Mounted Delineators (25 feet): 120.87, 771.37, 0.16, and 0.88. Row 7: Top-Mounted Delineators (25 feet): negative 1540.64, 1101.33, negative 1.40, and 0.16. Row 8: Top-Mounted Delineators and Side-Mounted Delineators (50 feet): negative 1334.04, 1390.62, negative 0.96, and 0.34. Row 9: Post-Mounted Delineators (50 feet): 1004.85, 780.14, 1.29, and 0.20. Row 10: Post-Mounted and W-Beam-Mounted Delineators (50 feet): 197.16, 798.29, 0.25, and 0.81. Row 11: W-Beam-Mounted Delineators (50 feet): negative 2827.37, 1603.60, negative 1.76, and 0.08. Row 12: Yellow Rubrail: negative 2411.92, 1119.42, negative 2.16, and 0.03 (The p-value is less than or equal to 0.05, but greater than 0.01). Row 13: Yellow Rubrail and Post-Mounted Delineators (50 feet): negative 2984.20, 1603.60, negative 1.86, and 0.06. Row 14: Yellow Rubrail and W-Beam-Mounted Delineators (50 feet): negative 1565.60, 1119.42, negative 1.40, and 0.16. Row 15: Yellow Rubrail, W-Beam-Mounted Delineators, and Post-Mounted Delineators (50 feet): 2506.46, 1119.42, 2.24, and 0.03 (The p-value is less than or equal to 0.05, but greater than 0.01). Row 16: Hardware Type - Guardrail: 26.31, 8.31, 3.17, and 0.00 (The p-value is less than or equal to 0.01, but greater than 0.001). Row 17: Age: negative 1387.17, 806.43, negative 1.72, and 0.09. Row 18: Curve Direction - Right: negative 1495.18, 281.34, negative 5.31, and 0.00 (The p-value is less than or equal to 0.001, but greater than 0). The second section of the table shows Model Analysis Results. The data given are as follows: Row 1: Residual standard error: 2452 on 302 degrees of freedom. Row 2: Multiple R-squared: 0.1698, and Adjusted R-squared: 0.123.
Row 3: F-statistic: 3.632 on 17 and 302 DF, p-value: 2.65.30 exponent minus 05 (The p-value is less than or equal to 0.001, but greater than 0).
themes. This count was converted to a percentage value based on the total number of participants. The following list presents the keyword search applied to the participantsʼ responses:
- Question: What do you think this delineation practice means?
- Association with Curve: left, curve, right, or turn
- Identification of Barrier: barrier, concrete, divider, guard, rail, or guardrail
- Slow/Caution: slow, decelerate, caution, or speed
- Question: How would this delineation practice impact your driving?
- Improve Visibility: night, nighttime, visibility, dark, light, see, or bright
- Reduce Speed: slow, decelerate, caution, speed, or turn
- Improve Roadway Awareness: attention, attentive, alert, aware, awareness, anticipate, prepare, warn, or react
For the numerical rating questions, an average of the numerical ratings was calculated and applied to all the responses for each delineation practice. The survey questionnaire software, Qualtrics, provided a thematic analysis of two survey questions that asked whether the participants had any concerns with the delineation practices and observed any advantages of the delineation practices. This approach was used to identify standard delineation practices mentioned in the responses and any specific items.
Concrete Barrier Delineation Practices
Figures 38 and 39 show the average detection distances for concrete barrier delineation practices in nighttime conditions with left- and right-turn curves, respectively. The no-delineation and chevron panel delineation practices had significantly lower detection distances than the other practices. The decreased spacing of 25 ft for the top-mounted and side-mounted delineators resulted in a higher average detection distance. No significant difference was observed in detection distance when the continuous retroreflective paint stripe delineation practice was compared
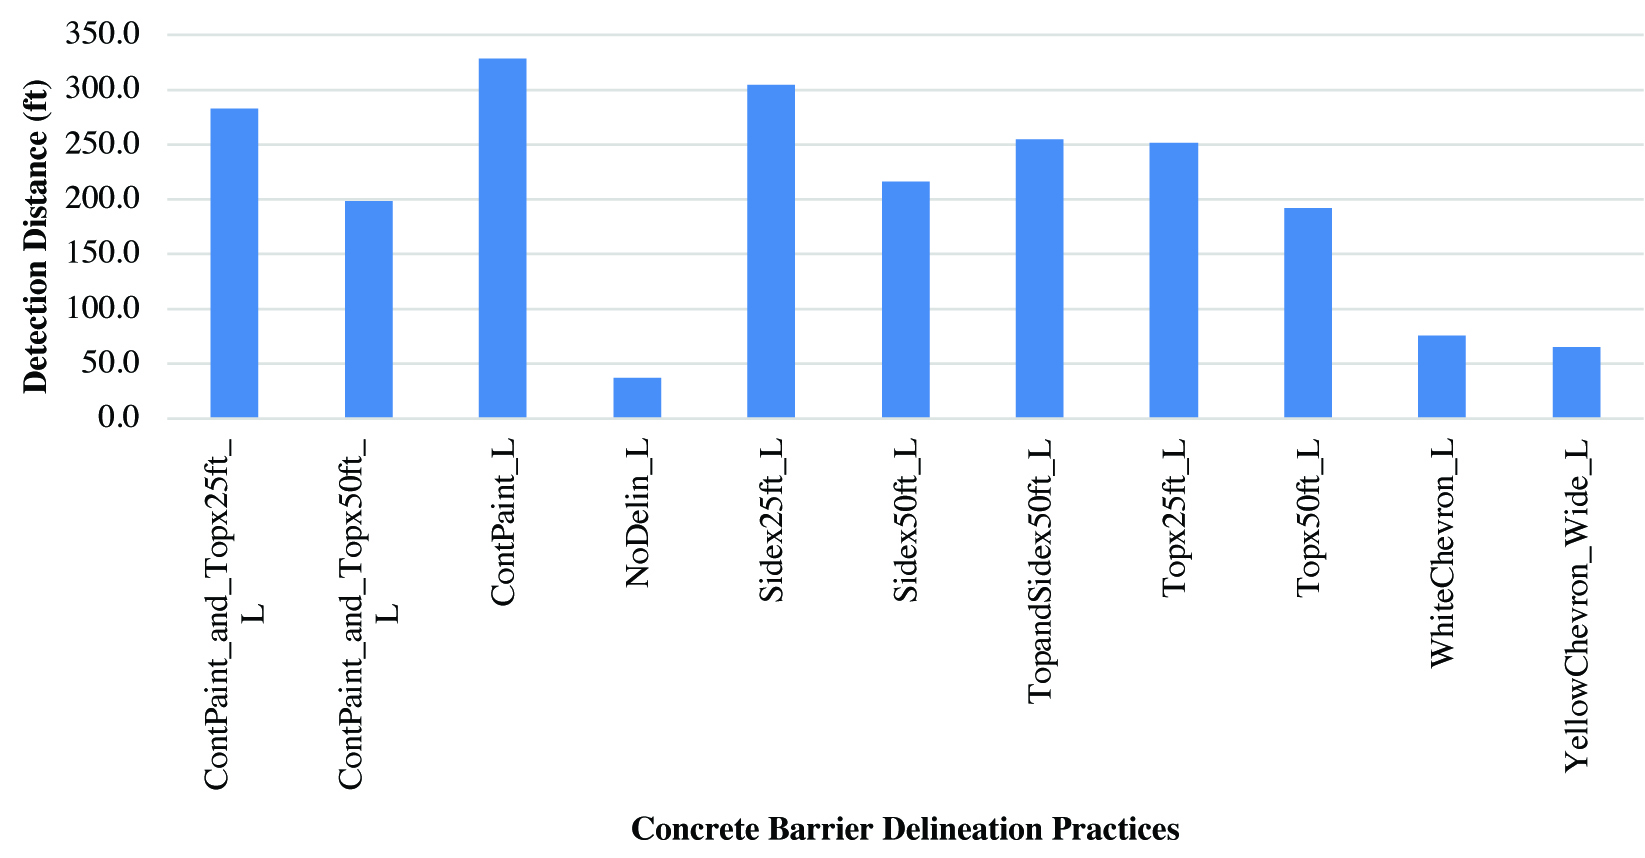
Long Description.
The horizontal axis is labeled Concrete Barrier Delineation Practices. The vertical axis shows the Detection Distance (feet), ranging from 0.0 to 350.0 in increments of 50.0. The data given are as follows: ContPaint_and_Topx25ft_L: 285 feet, ContPaint_and_Topx50ft_L: 200 feet, ContPaint_L: 330 feet, NoDelin_L: 40 feet, Sidex25ft_L: 305 feet, Sidex50ft_L: 220 feet, TopandSidex50ft_L: 255 feet, Topx25ft_L: 250 feet, Topx50ft_L: 195 feet, WhiteChevron_Wide_L: 80 feet, and YellowChevron_Wide_L: 70 feet. Note that the values mentioned are approximate.

Long Description.
The horizontal axis is labeled Concrete Barrier Delineation Practices. The vertical axis shows the distance (feet), ranging from 0.0 to 500.0 in increments of 50.0. The data given are as follows: ContPaint_and_Topx25ft_R: 225 feet, ContPaint_and_Topx50ft_R: 160 feet, ContPaint_R: 175 feet, NoDelin_R: 30 feet, Sidex25ft_R: 455 feet, Sidex50ft_R: 230 feet, TopandSidex50ft_R: 230 feet, Topx25ft_R: 205 feet, Topx50ft_R: 155 feet, WhiteChevron_Wide_R: 115 feet, and YellowChevron_Wide_R: 85 feet. Note that the values mentioned are approximate.
to the top-mounted and side-mounted delineation practices. Most delineation practices had minimal differences in detection distance when comparing left-turn curves to right-turn curves.
Figures 40 and 41 show the average detection distances for concrete barrier delineation practices in daytime conditions with left and right-turn curves, respectively. The detection distance did not vary significantly among the concrete barrier delineation practices for daytime conditions. The continuous retroreflective paint stripe delineation practice slightly increased the detection distance (∼25 ft) compared to the other delineation practices. Table 31 summarizes
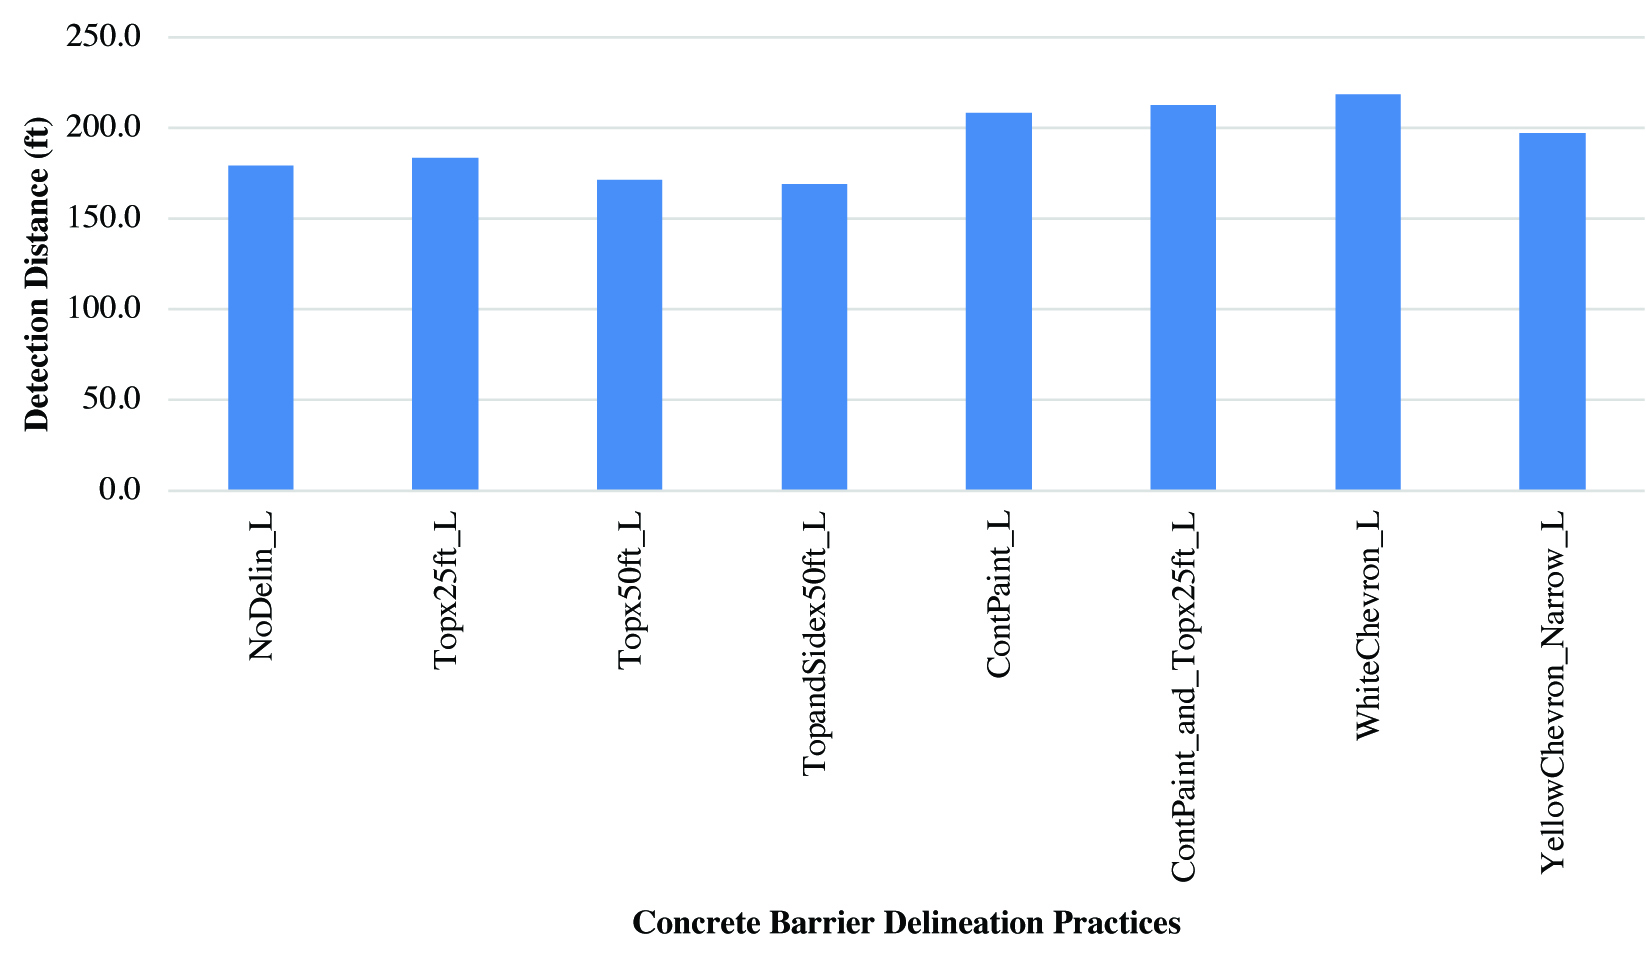
Long Description.
The horizontal axis is labeled Concrete Barrier Delineation Practices. The vertical axis shows the Distance (feet), ranging from 0.0 to 250.0 in increments of 50.0. The data provided for each road condition is presented as a single estimated value (the height of the bar). The data given are as follows: NoDelin_L: 180 feet, Topx25ft_L: 185 feet, Topx50ft_L: 170 feet, TopandSidex50ft_L: 170 feet, ContPaint_L: 205 feet, ContPaint_and_Topx25ft_L: 210 feet, WhiteChevron_Narrow_L: 220 feet, and YellowChevron_Narrow_L: 200 feet. Note that the values mentioned are approximate.
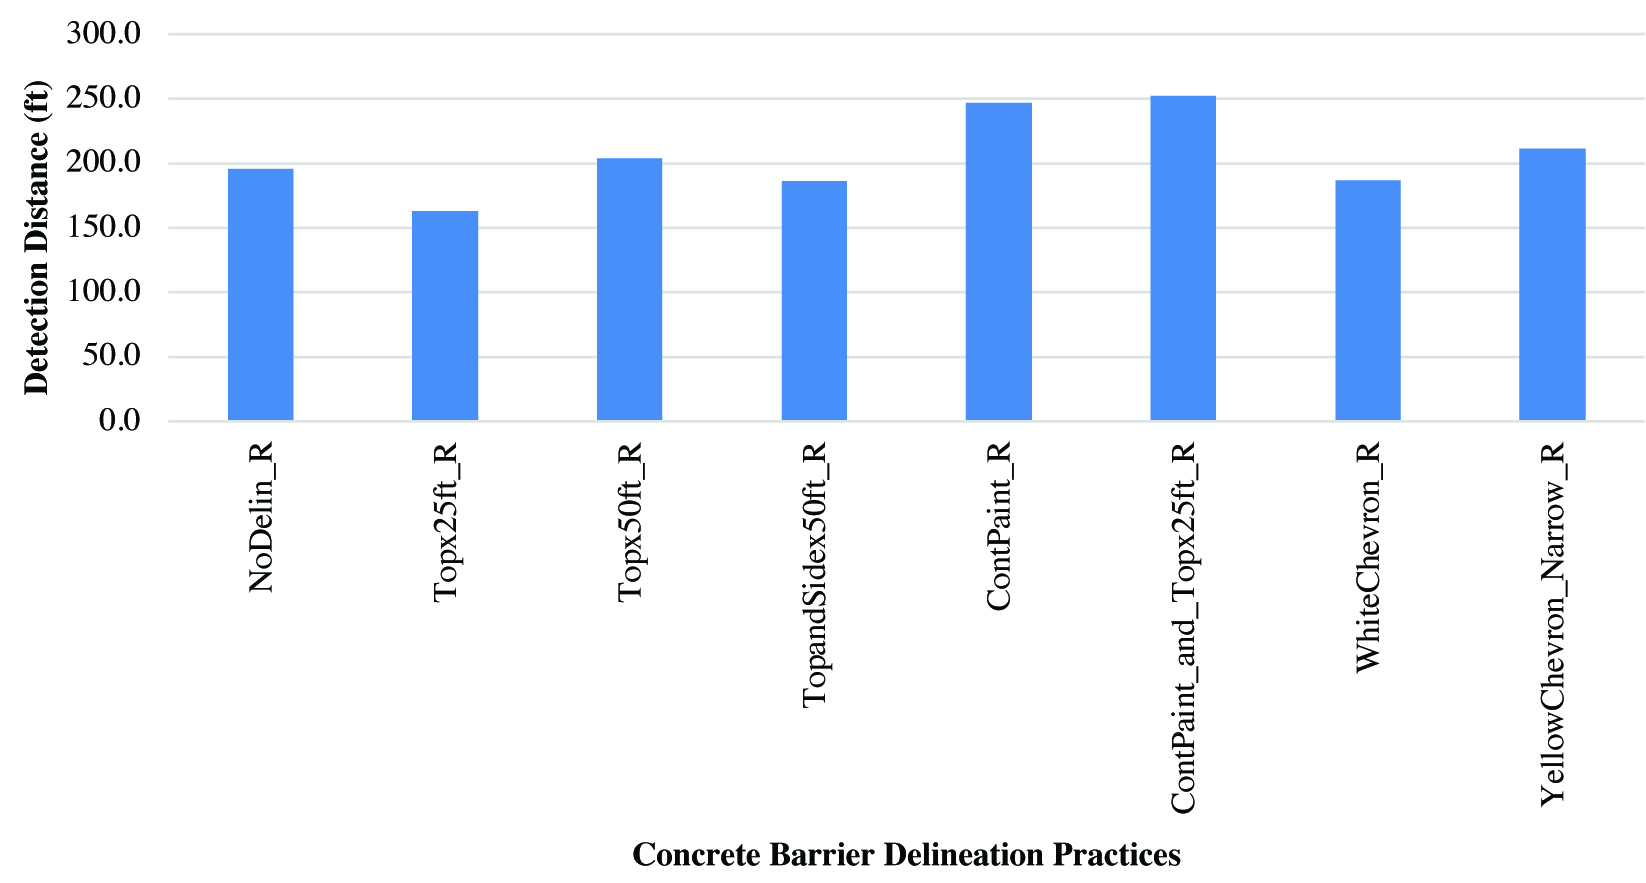
Long Description.
The horizontal axis is labeled Concrete Barrier Delineation Practices. The vertical axis shows the Distance (feet), ranging from 0.0 to 300.0 in increments of 50.0. The data given are as follows: NoDelin_R: 200 feet, Topx25ft_R: 160 feet, Topx50ft_R: 205 feet, TopandSidex50ft_R: 185 feet, ContPaint_R: 250 feet, ContPaint_and_Topx25ft_R: 255 feet, WhiteChevron_Narrow_R: 185 feet, and YellowChevron_Narrow_R: 210 feet. Note that the values mentioned are approximate.
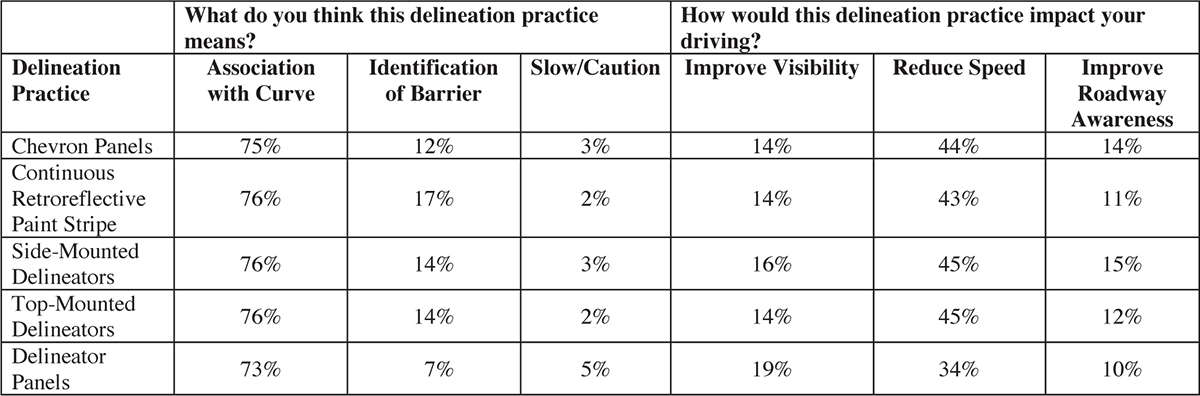
Long Description.
The table shows two columns and five rows. The first column header is “What do you think this delineation practice means?”. It is divided into three sub-columns. Those headers are Association with the Curve, Identification of Barrier, and Slow or Caution. The second column header is “How would this delineation practice impact your driving?”. It is divided into three sub-columns. Those headers are Improve Visibility, Reduce Speed, and Improve Roadway Awareness. The row headers are as follows: Chevron Panels, Continuous Retroreflective Paint Stripe, Side-Mounted Delineators, Top-Mounted Delineators, and Delineator Panels. The data provided in percentages are as follows: Row 1: 75, 12, 3, 14, 44, and 14. Row 2: 76, 17, 2, 14, 43, and 11. Row 3: 76, 14, 3, 16, 45, and 15. Row 4: 76, 14, 2, 14, 45, and 12. Row 5: 73, 7, 5, 19, 34, and 10.
the participantsʼ responses to the questions about the meaning of the delineation practice and its impact on driver behavior. The responses had minimal variability for each delineation practice. Most participants identified the delineation practices with a curve direction and would respond by decelerating.
Participants indicated an association between reduced delineation spacing (i.e., more delineators along the curve) with a sharper curve and a need for increased awareness or caution. Approximately 45% of the participants responded with this association. Participants rated each delineation practice on a scale of 1 to 10 based on how it stood out, how it would help them identify the roadway curve, and how it would help them traverse the roadway curve. The numerical ratings for each question type had minimal variance because participants often provided the same rating for each of the three questions. Thus, only one numerical rating value for each delineation practice is reported in Figure 42, which presents the average numerical rating of each concrete barrier delineation practice. The highest-rated delineation practices were those with continuous retroreflective paint stripes, top-mounted delineators, and side-mounted delineators. The no-delineation and chevron panel delineation practices received the lowest ratings.
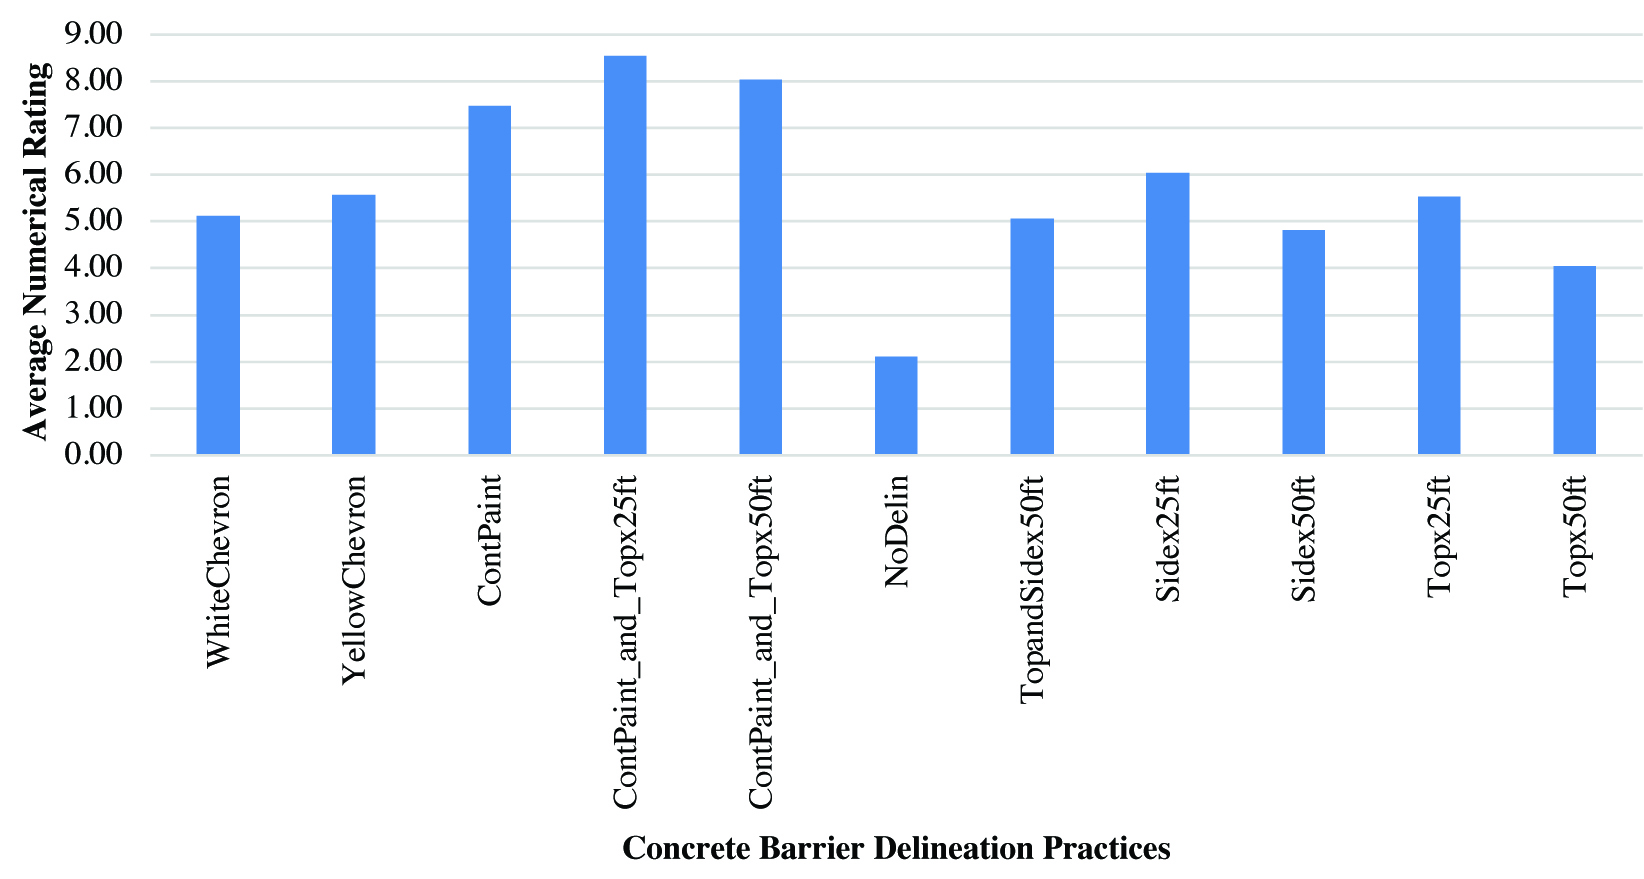
Long Description.
The horizontal axis is labeled Concrete Barrier Delineation Practices. The vertical axis shows the Average Numerical Rating, ranging from 0.00 to 9.00 in increments of 1.00. The data given are as follows: WhiteChevron: 5.10, YellowChevron: 5.60, ContPaint: 7.50, ContPaint_and_Topx25ft: 8.50, ContPaint_and_Topx50ft: 8.10, NoDelin: 2.10, TopandSidex50ft: 5.00, Sidex25ft: 6.00, Sidex50ft: 4.80, Topx25ft: 5.50, and Topx50ft: 4.00. Note that the values mentioned are approximate.
The top three delineation practices that participants associated with being concerning were no delineation, top-mounted delineators spaced at 50 ft, and white chevron panels. The primary associated concerns were poor visibility, no advanced warning of the curve, lack of sufficient delineators, and inadequate frequency of delineators. The top three delineation practices that participants associated with being advantageous were delineator panels, continuous retroreflective paint stripes, and continuous retroreflective paint stripes with top-mounted delineators spaced at 25 ft. The primary associated advantages were improved visibility, increased awareness of the curve, and improved comfort.
Guardrail Delineation Practices
Figures 43 and 44 show the average detection distances for guardrail delineation practices in nighttime conditions with left- and right-turn curves, respectively. The no-delineation and yellow rubrail delineation practices had significantly lower detection distances than the other practices. The decreased spacing of 25 ft for the w-beam–mounted and post-mounted delineators resulted in a higher average detection distance. No significant difference existed among the other guardrail delineation practices. Most delineation practices exhibited minimal differences in detection distance when comparing left-turn curves to right-turn curves.
Figures 45 and 46 show the average detection distances for guardrail delineation practices in daytime conditions with left- and right-turn curves, respectively. The detection distance did not vary significantly among the daytime guardrail delineation practices—except for the yellow rubrail delineation practice. An approximate 100-ft increase occurred in detection distance for the yellow rubrail delineation practice compared to the other delineation practices.
Table 32 summarizes the participantsʼ responses to the questions about the meaning of the delineation practice and its impact on driver behavior. Overall, the responses had minimal variability for each delineation practice. Most participants identified the delineation practice with
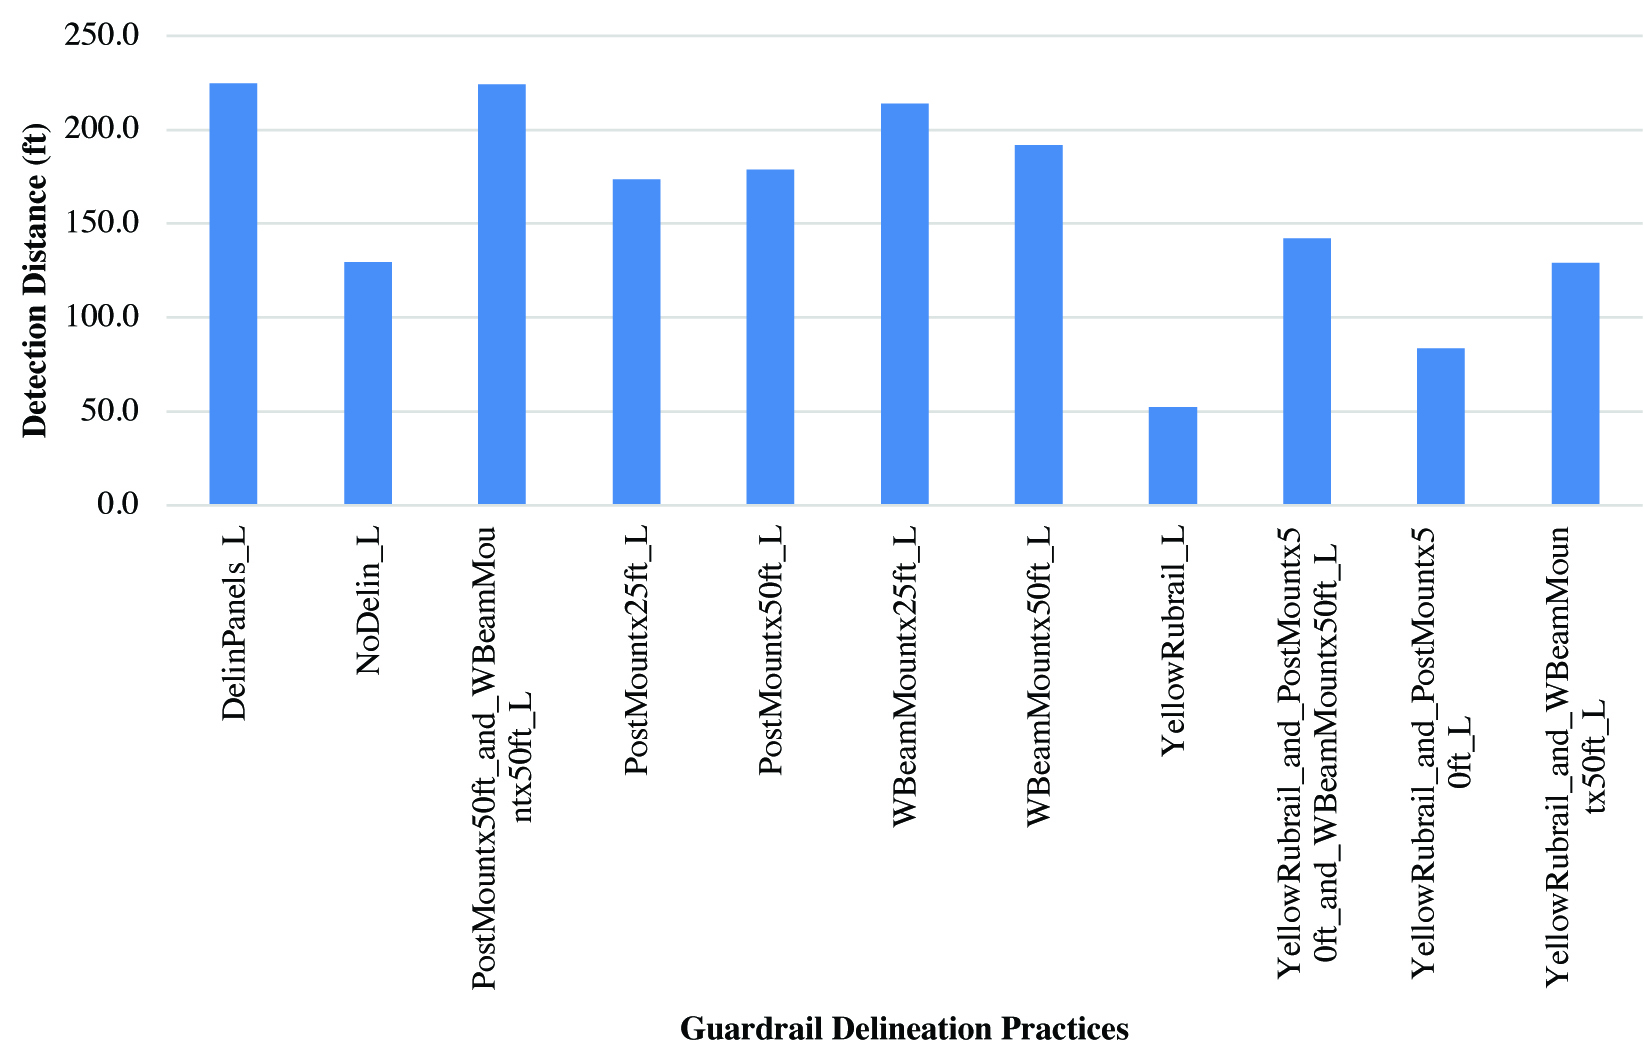
Long Description.
The horizontal axis is labeled Guardrail Delineation Practices. The vertical axis shows the Distance (feet), ranging from 0.0 to 250.0 in increments of 50.0. The data given are as follows: DelinPanels_L: 225 feet, NoDelin_L: 135 feet, PostMountx50ft_and_WBeamMountx50ft_L: 225 feet, PostMountx25ft_L: 175 feet, PostMountx50ft_L: 180 feet, WBeamMountx25ft_L: 215 feet, WBeamMountx50ft_L: 195 feet, YellowRubrail_L: 50 feet, YellowRubrail_and_PostMountx50ft_and_WBeamMountx50ft_L: 145 feet, YellowRubrail_and_PostMountx50ft_L: 85 feet, an YellowRubrail_and_WBeamMountx50ft_L: 130 feet. Note that the values mentioned are approximate.
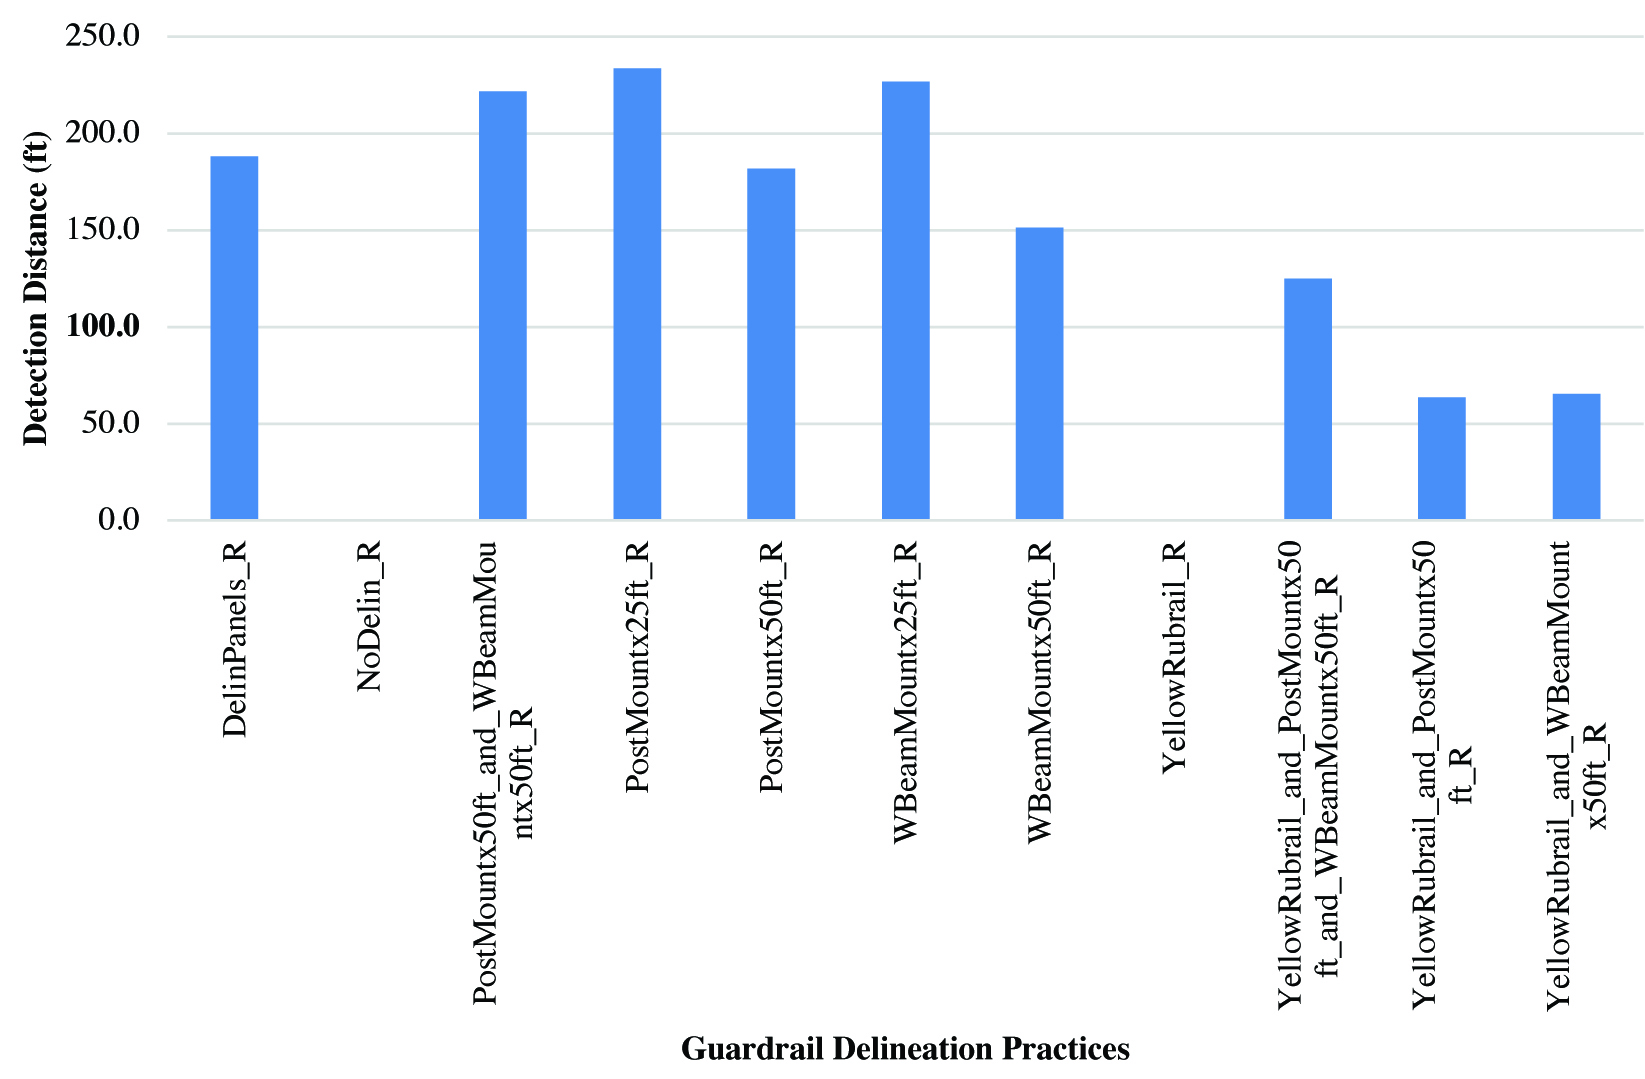
Long Description.
The horizontal axis is labeled Guardrail Delineation Practices. The vertical axis shows the Distance (feet), ranging from 0.0 to 250.0 in increments of 50.0. The data given are as follows: DelinPanels_R: 190 feet, NoDelin_R: 0 feet, PostMountx50ft_and_WBeamMountx50ft_R: 220 feet, PostMountx25ft_R: 240 feet, PostMountx50ft_R: 180 feet, WBeamMountx25ft_R: 230 feet, WBeamMountx50ft_R: 150 feet, YellowRubrail_R: 0 feet (or near 0), YellowRubrail_and_PostMountx50ft_and_WBeamMountx50ft_R: 130 feet, YellowRubrail_and_PostMountx50ft_R: 65 feet, and YellowRubrail_and_WBeamMountx50ft_R: 65 feet. Note that the values mentioned are approximate.

Long Description.
The horizontal axis is labeled Guardrail Delineation Practices. The vertical axis shows the Distance (feet), ranging from 0.0 to 250.0 in increments of 50.0. The data given are as follows: NoDelin_L: 120 feet, PostMountx50ft_and_WBeamMountx50ft_L: 105 feet, PostMountx25ft_L: 120 feet, PostMountx50ft_L: 90 feet, WBeamMountx25ft_L: 120 feet, WBeamMountx50ft_L: 115 feet, and YellowRubrail_L: 195 feet. Note that the values mentioned are approximate.
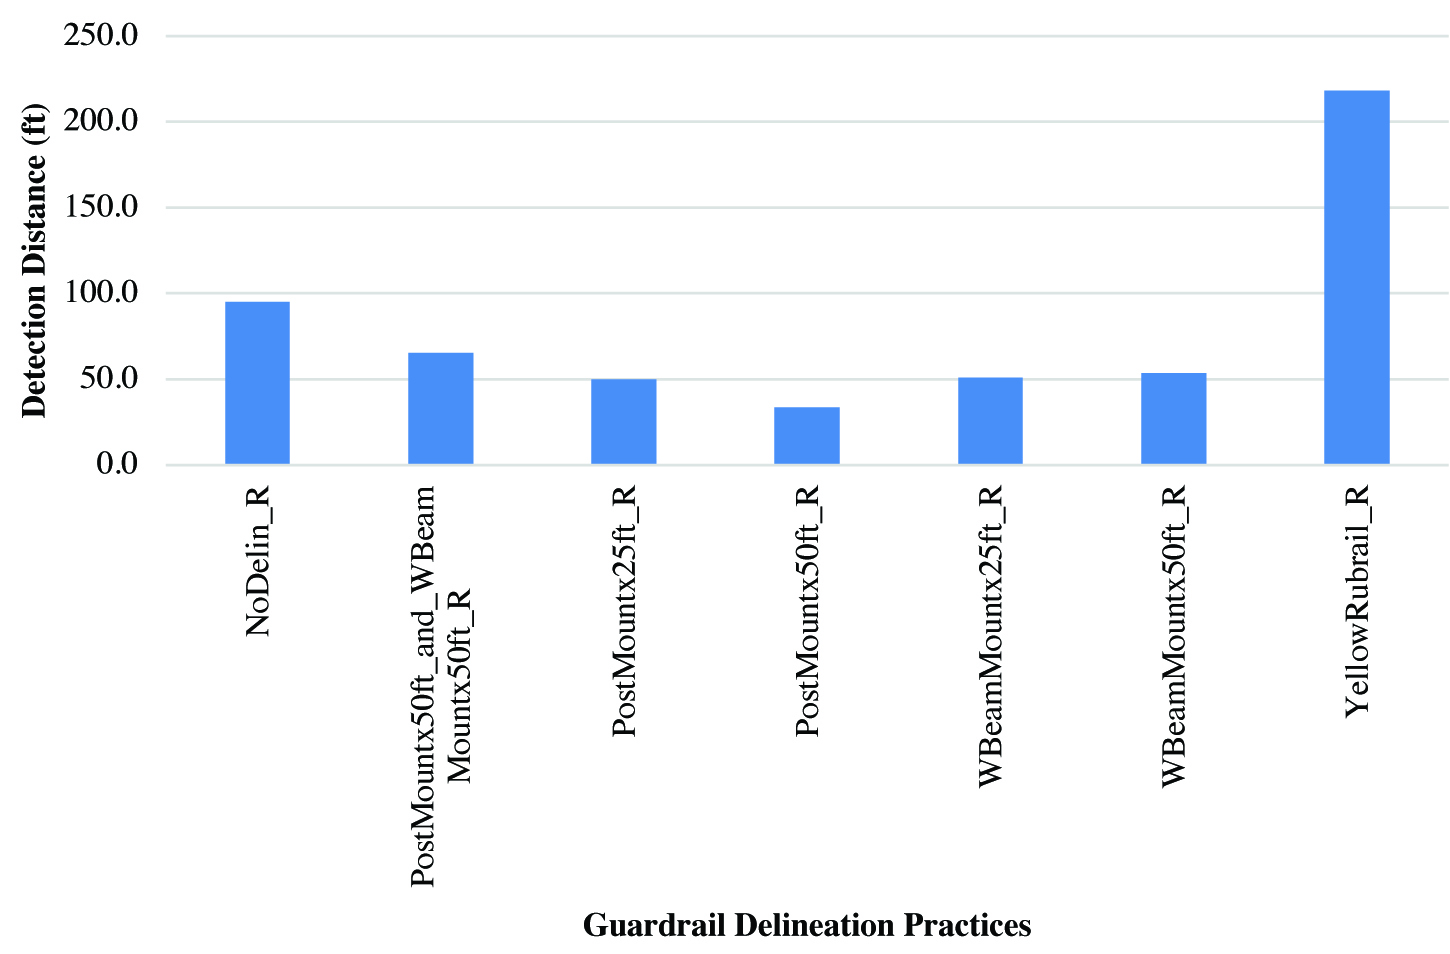
Long Description.
The horizontal axis is labeled Guardrail Delineation Practices. The vertical axis shows the Distance (feet), ranging from 0.0 to 250.0 in increments of 50.0. The data provided for each road condition is presented as a single estimated value (the height of the bar). The data given are as follows: NoDelin_R: 95 feet, PostMountx50ft_and_WBeamMountx50ft_R: 65 feet, PostMountx25ft_R: 50 feet, PostMountx50ft_R: 35 feet, WBeamMountx25ft_R: 50 feet, WBeamMountx50ft_R: 55 feet, and YellowRubrail_R: 220 feet. Note that the values mentioned are approximate.
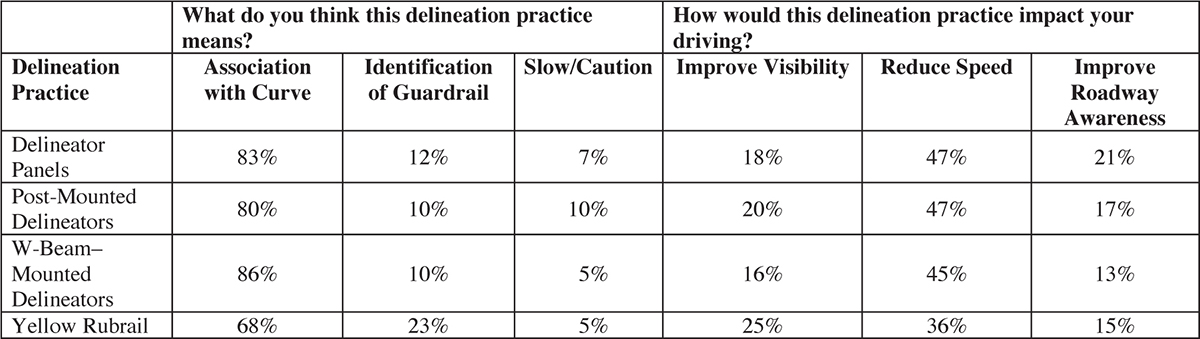
Long Description.
The table shows two columns and four rows. The first column header is “What do you think this delineation practice means?”. It is divided into three sub-columns. Those headers are Association with the Curve, Identification of Guardrail, and Slow or Caution. The second column header is “How would this delineation practice impact your driving?”. It is divided into three sub-columns. Those headers are Improve Visibility, Reduce Speed, and Improve Roadway Awareness. The row headers are as follows: Delineator Panels, Post-Mounted Delineators, W-Beam-Mounted Delineators, and Yellow Rubrail. The data provided in percentages are as follows: Row 1: 83, 12, 7, 18, 47, and 21. Row 2: 80, 10, 10, 20, 47, and 17. Row 3: 86, 10, 5, 16, 45, and 13. Row 4: 68, 23, 5, 25, 36, and 15.
a curve direction and would respond by decelerating. The yellow rubrail delineation practice did indicate a lower identification of curve detection and a reduction in speed compared to the other three delineation practices. Participants indicated an association between reduced delineation spacing (i.e., more delineators along the curve) with a sharper curve and a need for increased awareness or caution. Approximately 50% of the participants identified this association.
Participants rated each delineation practice on a scale of 1 to 10 based on how it stood out, how it would help them identify the roadway curve, and how it would help them traverse the roadway curve. The numerical ratings for each question type had minimal variance because the participants often provided the same rating for each of the three questions. Thus, only one numerical rating value for each delineation practice is reported in Figure 47, which presents the average numerical rating of each guardrail delineation practice. The highest-rated delineation practices were delineator panels, w-beam–mounted delineators, and post-mounted delineators. The no-delineation and yellow rubrail delineation practices received the lowest ratings.
The top three delineation practices that participants associated with being concerning were yellow rubrail, w-beam–mounted delineators spaced at 50 ft, and post-mounted delineators
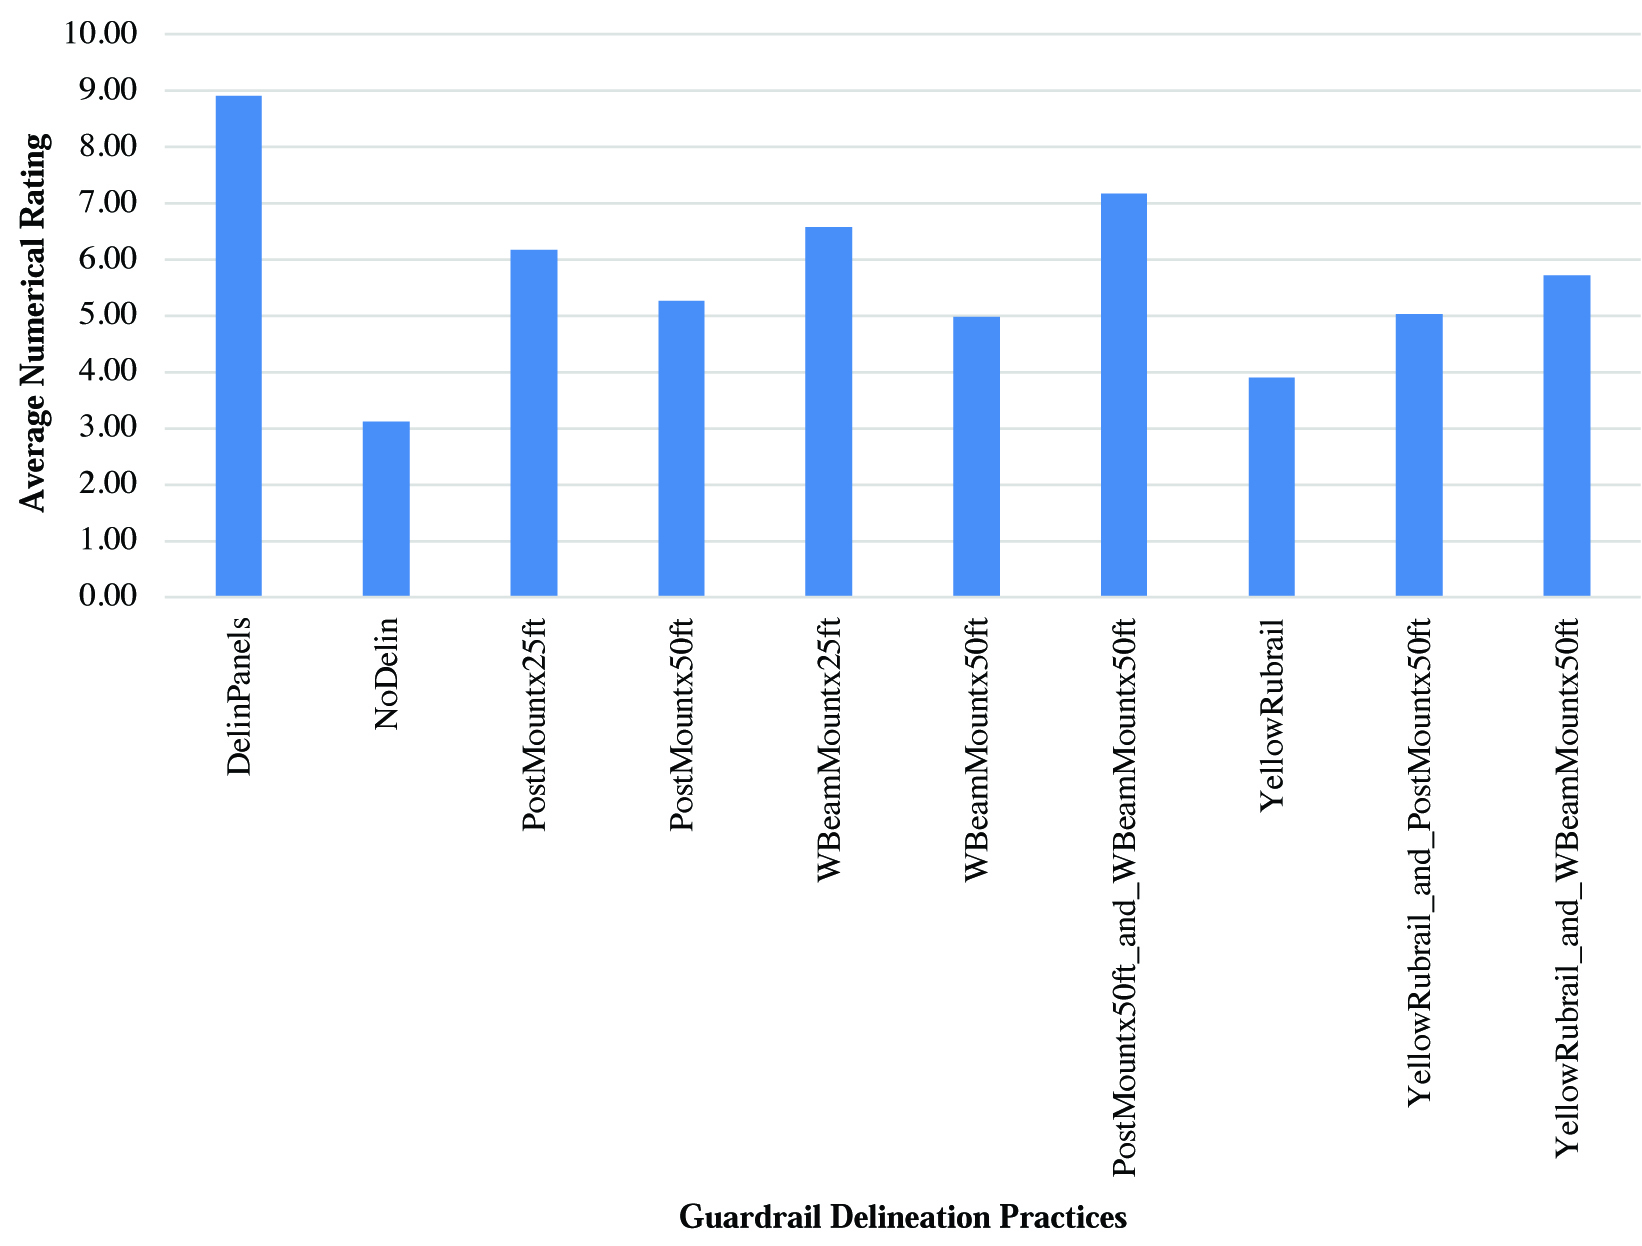
Long Description.
The horizontal axis is labeled Guardrail Delineation Practices. The vertical axis shows the Average Numerical Rating, ranging from 0.00 to 10.00 in increments of 1.00. The data given are as follows: DelinPanels: 9.00, NoDelin: 3.10, PostMountx25ft: 6.20, PostMountx50ft: 5.30, WBeamMountx25ft: 6.60, WBeamMountx50ft: 5.00, PostMountx50ft_and_WBeamMountx50ft: 7.20, YellowRubrail: 4.00, YellowRubrail_and_PostMountx50ft: 5.00, and YellowRubrail_and_WBeamMountx50ft: 5.70. Note that the values mentioned are approximate.
spaced at 50 ft. The primary associated concerns were poor visibility, lack of advanced warning of the curve, and perceived inadequate curve safety. The top three delineation practices that participants associated with being advantageous were delineator panels, w-beam–mounted and post-mounted delineators, and w-beam–mounted delineators spaced at 25 ft. The primary associated advantages were improved visibility, improved comfort, and attention-grabbing features.
Culvert Delineation Practices
The average detection distances for roadside object (i.e., culvert) delineation practices in nighttime conditions are presented in Figure 48. The object marker delineation practices resulted in a higher average detection distance compared to the delineator post detection distances. No significant difference in detection distance was exhibited for the number of delineator posts or object markers.
Figure 49 presents the average detection distances for culvert delineation practices in daytime conditions. The detection distance did not exhibit any significant difference for the various delineation practices in daytime conditions. Table 33 summarizes the participantsʼ responses to the questions about the meaning of the delineation practice and its impact on driver behavior. Participants tended to suggest a slow or cautious response at a higher rate for object markers compared to delineator posts. Other factors suggested that no difference occurred in driver behavior based on the delineation practice.
Participants primarily associated more object markers or delineator posts (i.e., increased overall delineated length) with a larger object/hazard size and an increased need for alertness. Participants rated each delineation practice on a scale of 1 to 10 based on how it stood out, how it would help them identify the roadway curve, and how it would help them traverse the

Long Description.
The horizontal axis is labeled Culvert Delineation Practices. The vertical axis shows the Distance (feet), ranging from 0.0 to 500.0 in increments of 50.0. The data provided for each condition is presented as a single estimated value (the height of the bar). The data given are as follows: DelinPostX1: 210 feet, DelinPostX2: 300 feet, DelinPostX3: 240 feet, ObjectMarkerX1: 360 feet, ObjectMarkerX2: 440 feet, ObjectMarkerX3: 430 feet, and NoDelin: 185 feet. Note that the values mentioned are approximate.
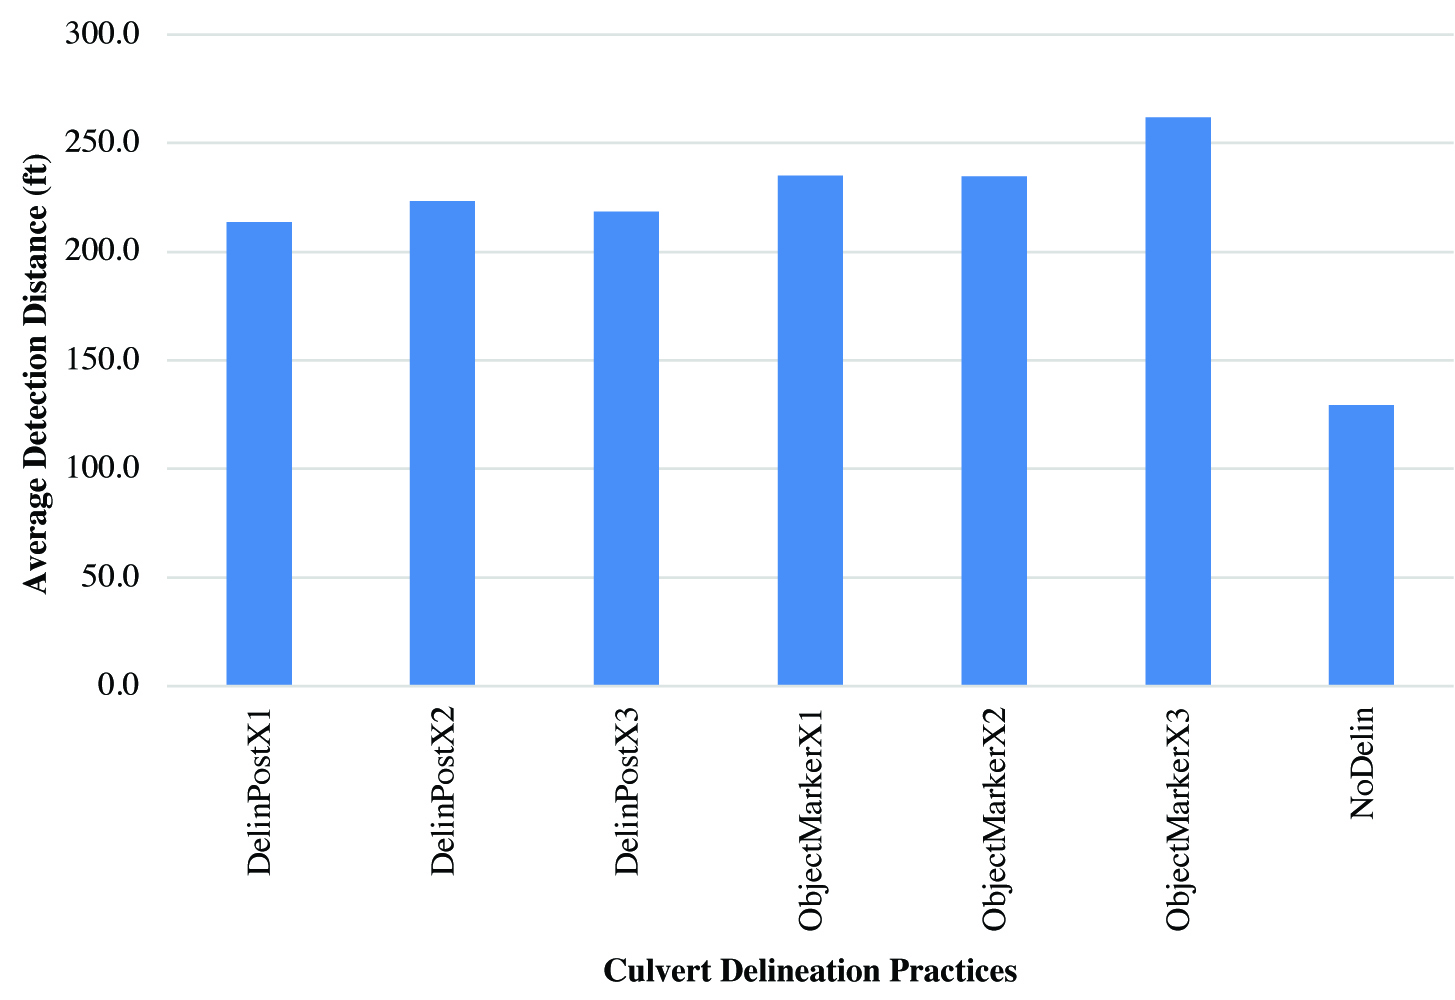
Long Description.
The horizontal axis is labeled Culvert Delineation Practices. The vertical axis shows the Distance (feet), ranging from 0.0 to 300.0 in increments of 50.0. The data provided for each condition is presented as a single estimated value (the height of the bar). The data given are as follows: DelinPostX1: 215 feet, DelinPostX2: 225 feet, DelinPostX3: 220 feet, ObjectMarkerX1: 235 feet, ObjectMarkerX2: 235 feet, ObjectMarkerX3: 260 feet, and NoDelin: 130 feet. Note that the values mentioned are approximate.

Long Description.
The table shows three columns and four rows of data. The first column header is “What do you think this delineation practice means?”. It is divided into three sub-columns. Those headers are Slow or Caution; Identification of Object or Hazard; and Roadway Edge. The second column header is “How would this delineation practice impact your driving?”. It is divided into three sub-columns. Those headers are Improve Visibility, Reduce Speed, and Improve Roadway Awareness. The data provided in percentages are as follows: Row 1: Delineator Post X 1; 5; 40; 16; 10; 15; and 10. Row 2: Delineator Post X 3; 3; 42; 12; 8; 22; and 12. Row 3: Object Marker X 1: 14, 41, 14, 7, 25, and 16. Row 4: Object Marker X 3; 17; 35; 11; 7; 33; and 18.
roadway curve. The numerical ratings for each question type had minimal variance because participants often provided the same rating for each of the three questions. Thus, only one numerical rating value for each delineation practice is reported in Figure 50, which presents the average numerical rating of each culvert delineation practice. The object marker delineation practices received higher ratings than the delineator post practices. Participants rated more object markers or delineator posts higher than a single object marker or delineator post.
The delineation practice that participants most associated with being concerning was a single delineator post. The primary associated concerns were poor visibility, unknown purpose, and lack of response. The delineation practice that participants most associated with being advantageous was three object markers. The primary associated advantages were improved visibility, improved brightness, and attention-grabbing features.
Luminance Assessment
An imaging colorimeter was used to evaluate the luminance of the concrete barrier and guardrail delineation practices. The instrumented vehicle was positioned in the middle of the travel lane, with the colorimeter positioned inside the vehicle, looking out under the rearview mirror. The vehicle was stationary during the measurements. The colorimeter was calibrated to
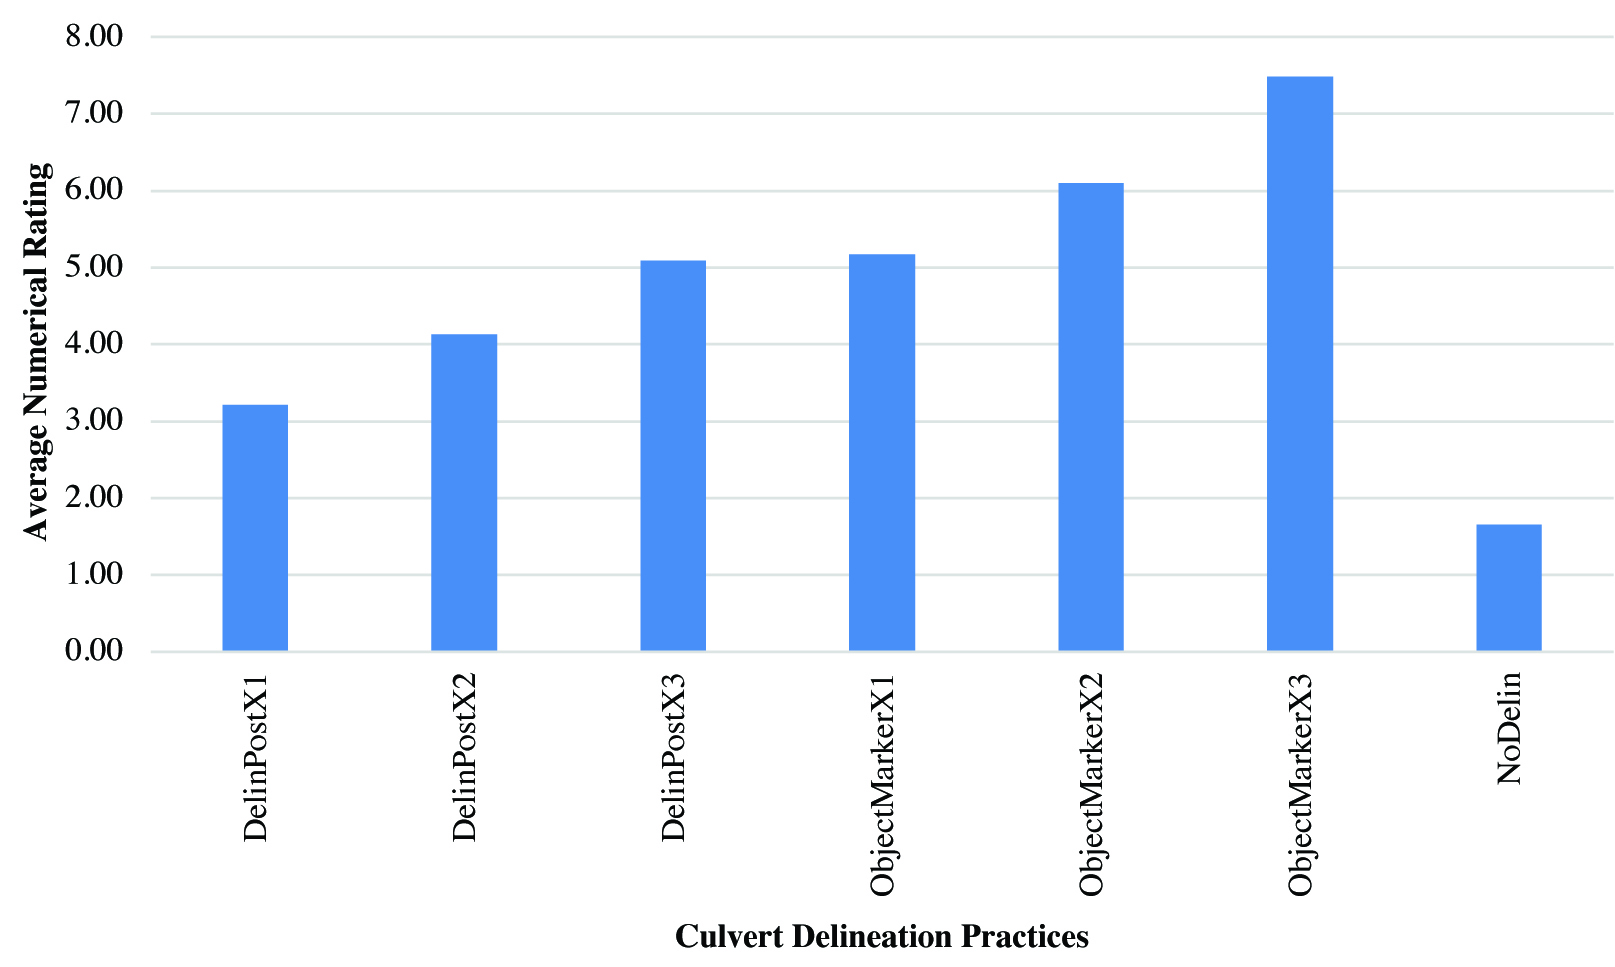
Long Description.
The horizontal axis shows different delineation and object marker conditions. The vertical axis shows the Average Numerical Rating, ranging from 0.00 to 8.00 in increments of 1.00. The data given are as follows: DelinPostX1: 3.10, DelinPostX2: 4.10, DelinPostX3: 5.00, ObjectMarkerX1: 5.10, ObjectMarkerX2: 6.00, ObjectMarkerX3: 7.50, and NoDelin: 1.70. Note that the values mentioned are approximate.
return the luminance and color of every pixel in the captured image. A box was drawn around each visible area for the concrete barrier and delineation practice. The colorimeter then output the average luminance of the selected area in candelas per meter squared (cd/m2). Figure 51 provides an example of an image collected with an imaging colorimeter. Images of each delineation practice were taken for the left- and right-turn curve directions. Figure 52 is the color-scale version of Figure 51, indicating the luminance level of each pixel.
The non-reflective areas of the guardrail, barrier, and yellow rubrail measured less than 0.5 cd/m2. Tables 34 and 35 provide the luminance levels of the unique delineation practices. Repeat measurements were not output. For example, a continuous retroreflective paint stripe is a component of three delineation practices. The luminance level of the stripe would not change, so it was only output once. Luminance is provided at select locations along the concrete barrier and guardrail curves. Specifically, every other delineator location is shown in the table. If two delineation practices were implemented together (e.g., top and side delineators), they were evaluated at the same locations along the curve.
The top- and side-mounted delineators had higher luminance levels when compared to the continuous retroreflective paint stripe. This outcome was expected because these delineators were positioned perpendicular to vehicle traffic (i.e., the retroreflective sheeting directly faces oncoming vehicle traffic). The one-third-to-halfway-point location of the curve resulted in some of the highest luminance values across the delineation practices. Other than in the first 100 ft of the curve, no significant difference was present in the luminance level for post-mounted and w-beam–mounted delineators.
Discussion
A human factors study analyzed driversʼ reactions to various delineation practices for concrete barriers, guardrails, and culverts. The study focused on a closed-course evaluation and a computer-based evaluation. The results of the human factors study are limited to dry daytime and nighttime roadway conditions.
The effect of delineation practices in non-dry conditions was not evaluated. Before the results of the human factors study are discussed, a few limitations are discussed here. First, not all delineation practices were evaluated in the closed-course study. Approximately half of the total evaluated practices were evaluated in the closed-course study. Thus, the delineation practices evaluated only through the subsequent computer-based study were limited in their evaluation because performance metrics, such as driver speed or braking, could not be measured.

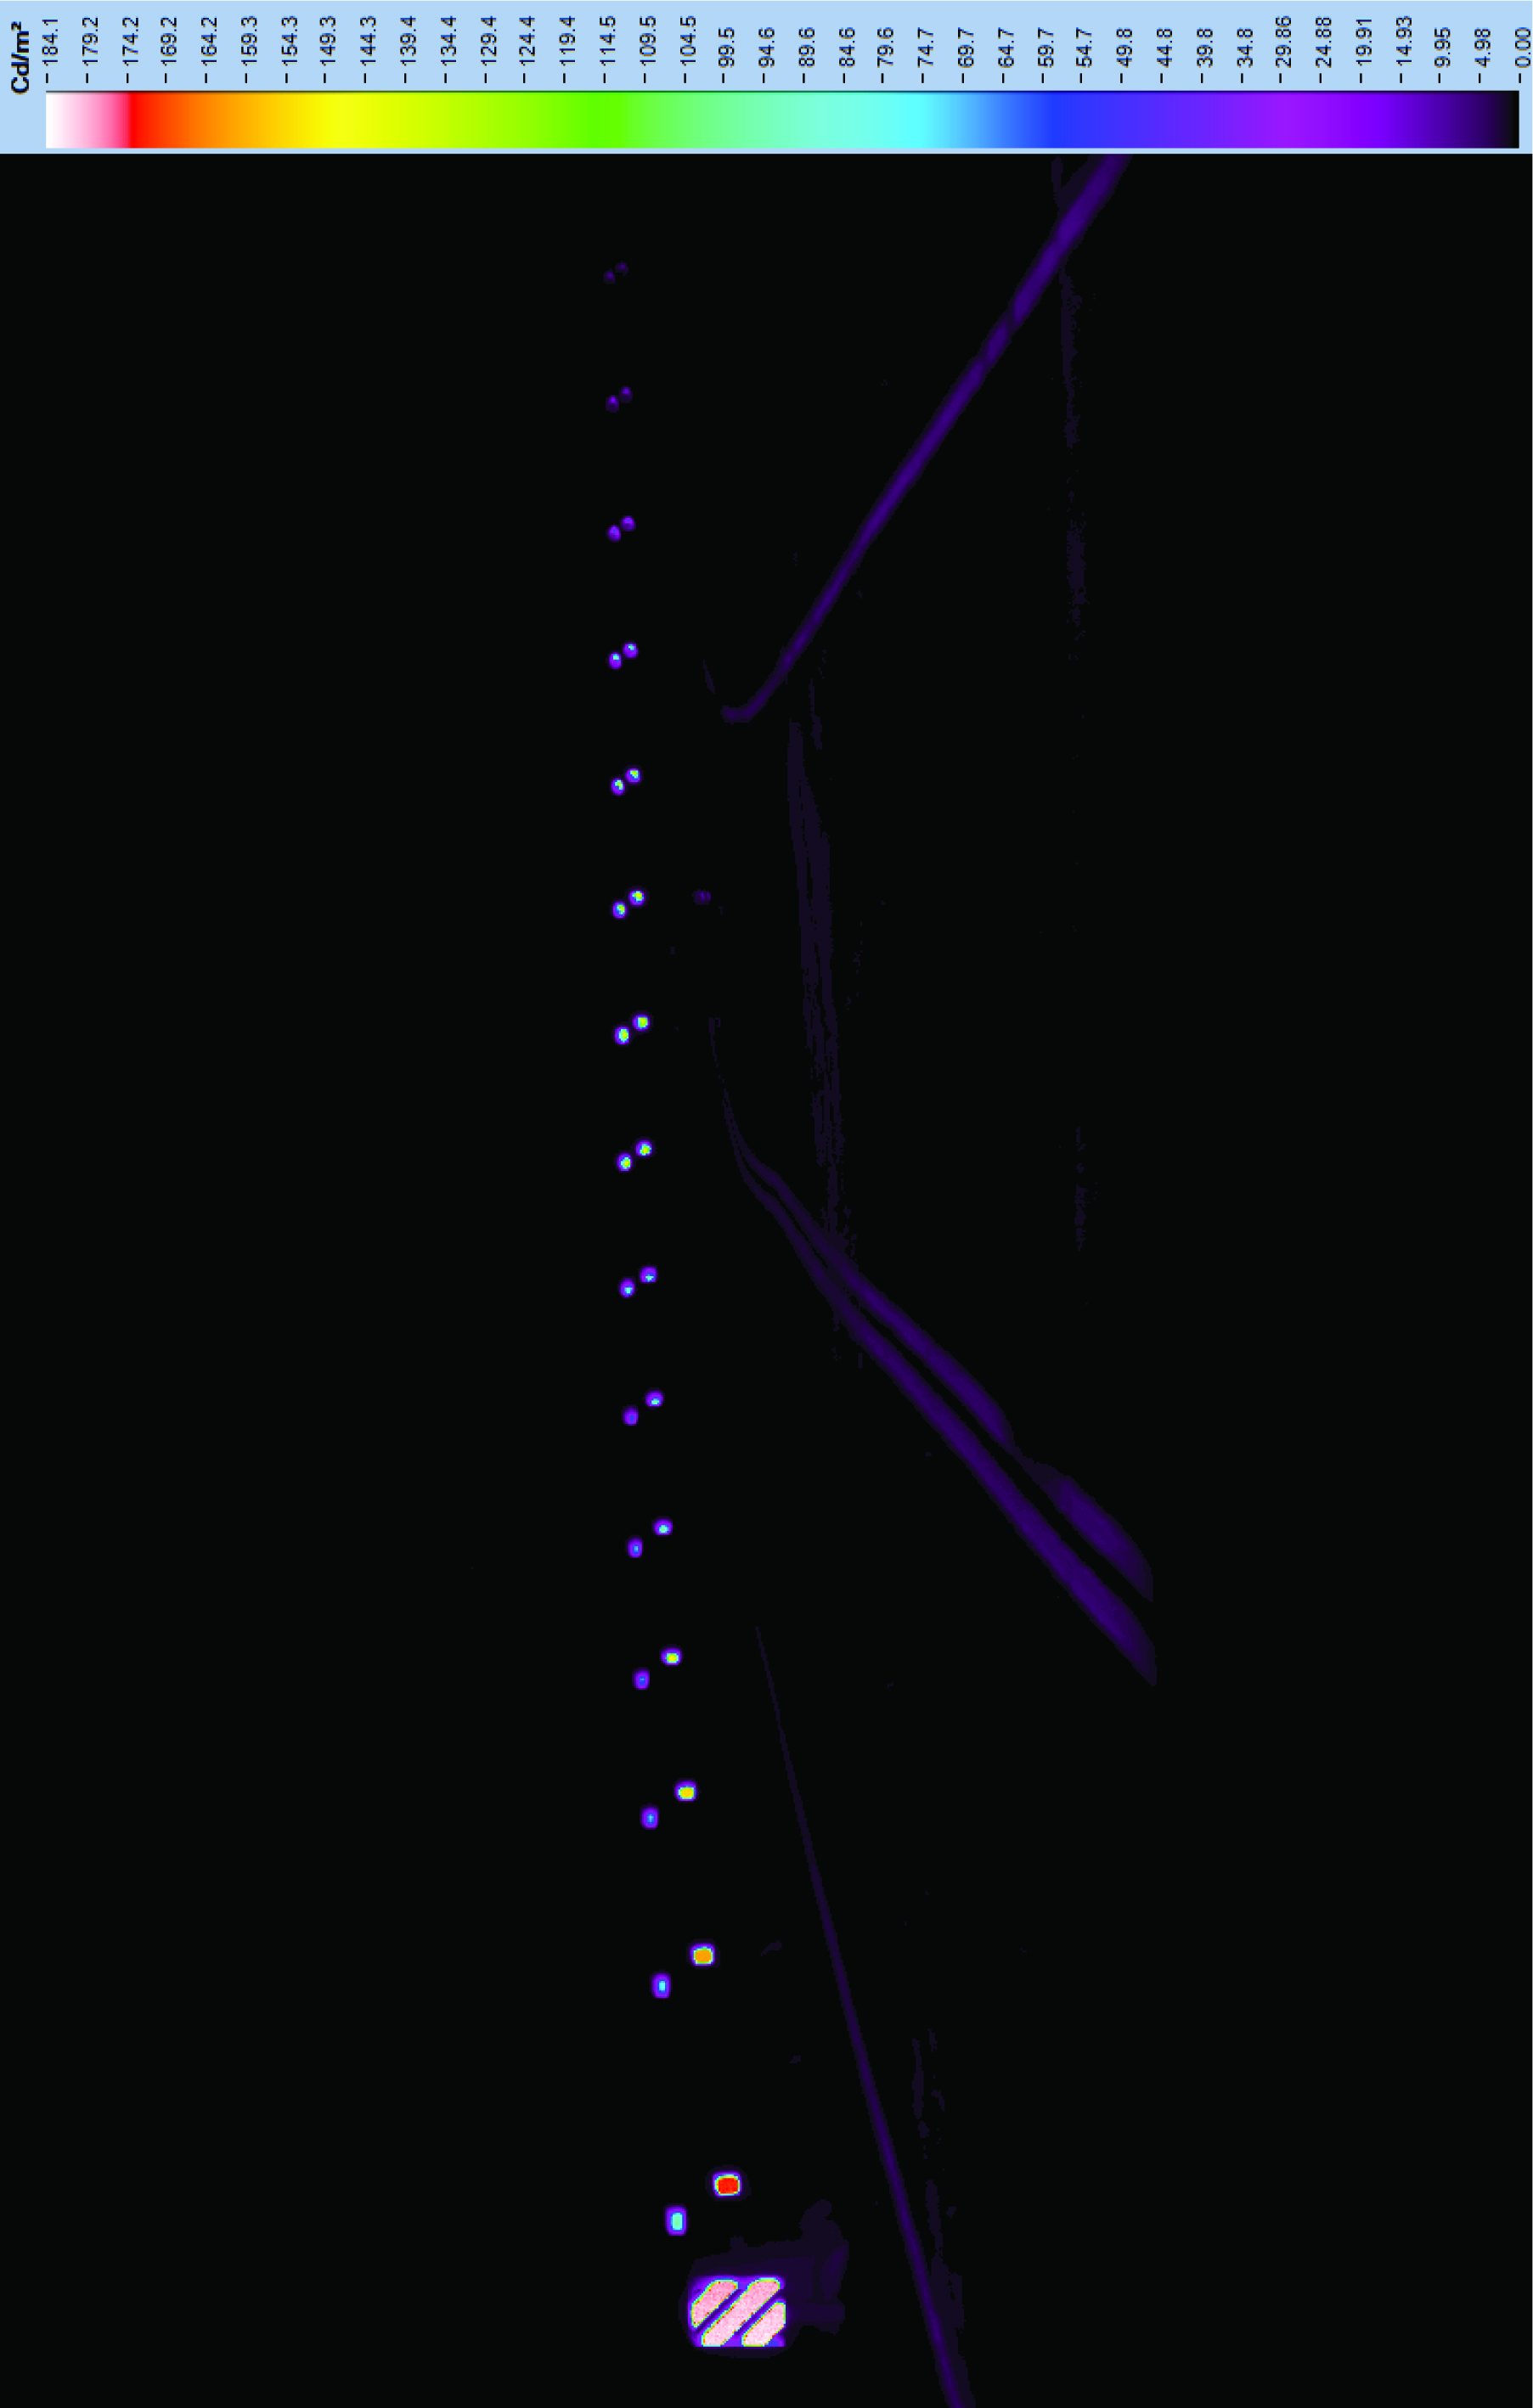
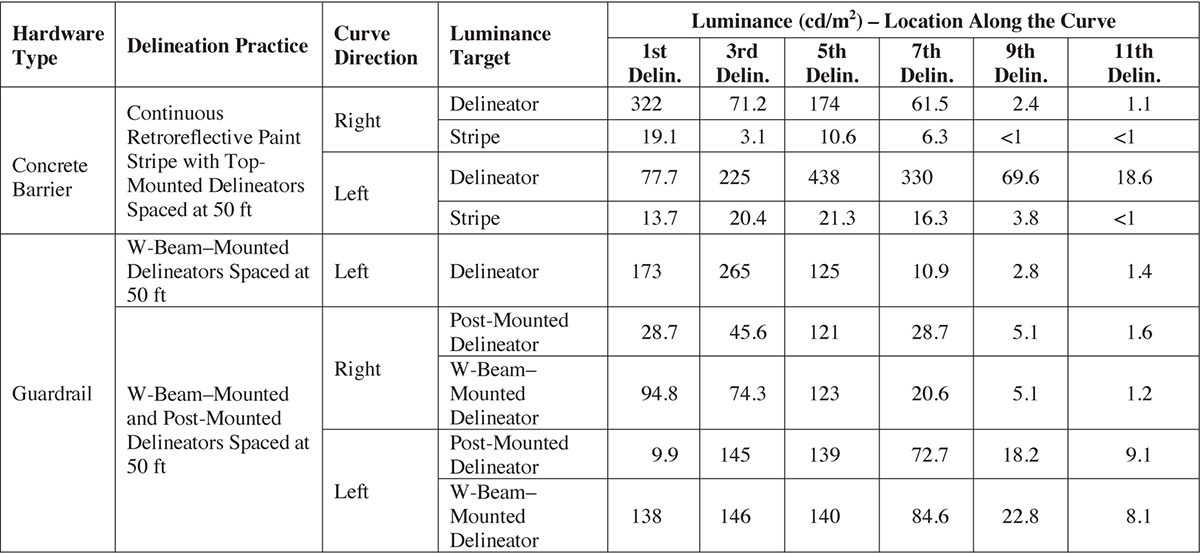
Long Description.
The table shows five columns and two rows. The column headers are Hardware Type, Delineation Practice, Curve Direction, Luminance Target, and Luminance (candelas per square meter) - Location Along the Curve. The last column is divided into six sub-columns: first delineation, second delineation, fifth delineation, seventh delineation, ninth delineation, and eleventh delineation. The rows are also divided into multiple sub-rows. The data given are as follows: Row 1: Concrete Barrier; Continuous Retroreflective Paint Stripe with Top-Mounted Delineators spaced at 50 feet; Right and Left. Right and left are subdivided into Delineator and Stripe. The values for Right: Delineator: 322, 71.2, 174, 61.5, 2.4, and 1.1. Stripe: 19.1, 3.1, 10.6, 6.3, less than 1, and less than 1. For left: Delineator: 77.7, 225, 438, 330, 69.6, and 18.6. Stripe: 13.7, 20.4, 21.3, 16.3, 3.8, and less than 1. Row 2: Guardrail; Sub row 1: W-Beam-mounted delineators spaced at 50 feet; left; delineator; 173, 265, 125, 10.9, 2.8, and 1.4. Row 2: Guardrail; Sub row 2: W-Beam-mounted and post-mounted delineators spaced at 50 feet; Right and Left. Right and left are both subdivided into post-mount delineator and W-beam-mounted delineator. The values for Right: Post-mounted delineator: 28.7, 45.6, 121, 28.7, 5.1, and 1.6. W-beam-mounted delineator: 94.8, 74.3, 123, 20.6, 5.1, and 1.2. For Left: Post-mounted delineator: 9.9, 145, 139, 72.7, 18.2, and 9.1. W-beam-mounted delineator: 138, 146, 140, 84.6, 22.8, and 8.1.
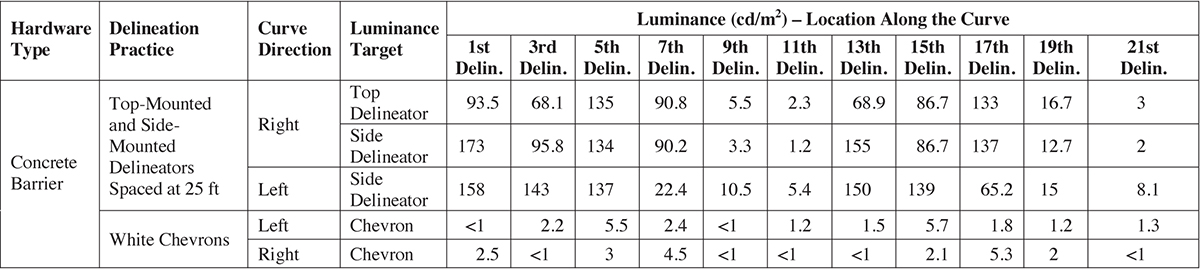
Long Description.
The table shows five columns and one row. The column headers are Hardware Type, Delineation Practice, Curve Direction, Luminance Target, and Luminance (candelas per square meter) - Location Along the Curve. The last column is divided into 11 sub-columns: first delineation, second delineation, fifth delineation, seventh delineation, ninth delineation, eleventh delineation, thirteenth delineation, seventeenth delineation, nineteenth delineation, and twenty-first delineation. The row is also divided into two sub-rows. The data given are as follows: Row 1: concrete barrier; Sub-row 1: Top-Mounted and Side-Mounted Delineators spaced at 25 feet; Right, and Left; and Sub row 2: White Chevrons; Left, and Right. Sub row 1: Right is further subdivided into Top delineator: 93.5, 68.1, 135, 90.8, 5.5, 2.3, 68.9, 86.7, 133, 16.7, and 3; and Side delineator: 173, 95.8, 134, 90.2, 3.3, 1.2, 155, 86.7, 137, 12.7, and 2. Sub row 1: Left: Side delineator: 158, 143, 137, 22.4, 10.5, 5.4, 150, 139, 65.2, 15, and 8.1. Sub row 2: Left: Chevron: less than 1, 2.2, 5.5, 2.4, less than 1, 1.2, 1.5, 5.7, 1.8, 1.2, and 1.3. Sub row 2: Right: Chevron: 2.5, less than 1, 3, 4.5, less than 1, less than 1, less than 1, 2.1, 5.3, 2, and less than 1.
The computer-based study was limited to measuring the driverʼs reaction to the delineation practices through video clips and images displayed on a monitor rather than viewing the delineation practices while driving a vehicle. Nevertheless, many of the delineation practices not evaluated in the closed-course study were variations of those evaluated. For example, the concrete barrier delineation practice of side-mounted delineators spaced at 25 ft was evaluated through the closed-course and computer-based studies; however, the same practice spaced at 50 ft was only evaluated through the computer-based study. Thus, this practice was generally evaluated except for the effect of spacing. Only one delineation practice had no variations evaluated in the closed-course study: delineator panels placed on concrete barriers or guardrails. Therefore, this practice was the only one directly limited in its evaluation.
When the closed-course study and the computer-based study were compared, two primary findings were discovered:
- The average detection distances for the delineation practices were significantly higher in the closed-course study than in the computer-based study. This observation was expected because the video capture and conversion to a monitor will result in some loss of true retroreflectivity. In addition, viewing the practices on a monitor is a different experience from viewing them while driving a vehicle.
- Participants who drove through the closed-course study and then watched the videos in the computer-based study had higher detection distances than the participants who did not participate in the closed-course study and only watched the videos in the computer-based study. This effect was likely due to the participantsʼ prior exposure to the curves and delineation practices, having just driven through the closed course.
These findings do highlight a limitation in the computer-based study results. The participantsʼ detection distances would be expected to increase if these participants had driven through the closed course. However, this limitation does not prevent the ability to compare how participants in the computer-based study reacted to different delineation practices. For example, a clear result from the computer-based study was that participants had lower detection distances when delineation was absent.
A second limitation was that the closed-course study evaluated delineation practices in left- and right-turn curves. This approach was used to increase the number of practices that could be evaluated in the study. However, it was expected that participants may react differently to delineation practices when approaching the curve in the outside lane for left-turn curves and in the inside lane for right-turn curves. Only once was the delineation practice the same in both curve directions. Participants in the closed-course study viewed the continuous retroreflective paint stripe on the concrete barrier for the left- and right-turn curves. This setup provided one point of comparison for the two curve directions. The following list comprises a few considerations regarding this limitation:
- The curve detection distance was influenced by the turn direction for concrete barrier delineation practices. Delineation practices for the right-turn curve direction resulted in a higher average detection distance when compared to the left-turn curve delineation practices. This observation was likely due to a lack of similarity in the run-up distance to the curves from each direction rather than the influence of the curve direction itself. This influence was not observed for the guardrail delineation practices.
- The brake pressure applied in the curve significantly differed in the guardrail barrier delineation practices when comparing the two curve directions. The right-turn curve delineation practices consistently resulted in more brake pressure application in the curve. This difference may have been influenced by the guardrail curve site, which possessed vertical curvature. Specifically, the right-turn curve direction at the guardrail site possessed downward vertical curvature that likely led to drivers reacting with more braking. This difference was not observed for the concrete barrier delineation practices.
- The average steering angle was smaller for left-turn curve concrete barrier and guardrail delineation practices compared to right-turn curve delineation practices. This finding can be attributed to the difference in outside- and inside-lane positions. The outside-lane position (i.e., left-turn curve) required less steering input to maintain proper lane position through the curve.
- The driverʼs dwell count and dwell time (i.e., overall gaze) for right-turn curve concrete barrier and guardrail delineation practices were less than the dwell count and shorter than the dwell time for left-turn curve delineation practices. Again, this difference can be attributed to the difference in lane position. Drivers in the inside lane (i.e., right-turn curve) had a larger lateral offset from the delineation practice while driving through the curve. Therefore, drivers were less inclined to avert their gaze from the roadway to the delineation practice if it was farther away in their peripheral vision.
While these limitations did influence the research teamʼs ability to directly compare all the delineation practices for a few of the performance metrics, the other performance metrics were unaffected by the curve direction. In addition, these known limitations can be considered when analyzing the findings of the closed-course study. The closed-course and computer-based
studies highlighted several key findings regarding delineating concrete barriers, guardrails, and culverts. The following list comprises the overall key findings from the studies:
- The presence of delineation significantly influenced driver behavior. Anytime the driver participants encountered the concrete barrier, guardrail, or culvert without delineation, they reacted significantly differently from those who encountered the same items with delineation present. This reaction was especially true for drivers as they approached the curve. Additionally, a subjective opinion from the computer-based survey revealed a strong preference for the presence of delineation.
- Delineation had a more significant impact on driver behavior prior to entering the curve compared to the driver behavior in the curve.
- The delineation practices did not significantly influence driver speed in the curve. This observation could have resulted from the curve layout and closed course setup. Longer total curve lengths and higher speeds in the course may allow for improved evaluation of driver speeds under different delineation practices.
Specific findings regarding concrete barrier delineation practices include the following:
- Continuous retroreflective paint stripe and top-mounted delineator delineation practices indicated improved driver performance prior to the curve through increased detection distance and earlier throttle release and brake application prior to the curve.
- The continuous retroreflective paint stripe indicated improved driver performance in the curve through reduced speed and throttle pressure.
- Combining practices (e.g., continuous retroreflective paint stripe and top-mounted delineators spaced at 25 ft) did not often result in significantly improved driver performance compared to using a singular delineation practice.
- Driversʼ subjective opinions favored the practices of delineator panels and the continuous retroreflective paint stripe.
- Top- and side-mounted delineators with decreased spacing (25 ft) resulted in increased detection distance and a higher subjective preference. Drivers associated the closer spacing of 25 ft with a sharper curve and would subsequently approach the curve with more caution and reduced speed.
Specific findings regarding guardrail delineation practices include the following:
- Post-mounted delineators indicated improved driver performance prior to the curve through increased detection distance and earlier throttle release prior to the curve.
- Yellow rubrail consistently indicated a similar performance to the absence of delineation on the guardrail. Driversʼ subjective feedback indicated a low preference for yellow rubrail due to concerns about low visibility. However, yellow rubrail was the only guardrail delineation practice that indicated improved curve detection distance in daytime conditions.
- Combining practices (e.g., w-beam–mounted and post-mounted delineators) did not often result in significantly improved driver performance compared to using a singular delineation practice.
- Driversʼ subjective opinions indicated the greatest preference for the delineator panel and post-mounted delineator delineation practices.
- W-beam–mounted and post-mounted delineators with decreased spacing (25 ft) resulted in increased detection distance and a higher subjective preference. Drivers associated the closer spacing of 25 ft with a sharper curve and would subsequently approach the curve with more caution and reduced speed.
Specific findings regarding culvert delineation practices include the following:
- Use of object markers indicated improved driver performance through the increased detection distance of the culvert.
- Increasing the number of object markers or delineator posts did not significantly influence driver behavior. Drivers indicated an association between more markers or posts and a larger hazard area.
- Driversʼ subjective opinions indicated a preference for object markers over delineator posts. Drivers specifically mentioned that they were unsure of the purpose of the delineator post and how to react to it.
Summary
A two-part human factors study evaluated the effects of different delineation practices for concrete barriers, guardrails, and culverts. The study comprised a closed-course and a computer-based study. A total of 41 participants completed the closed-course study, and a total of 148 participants completed the computer-based study. The two-part study evaluated concrete barrier and guardrail delineation practices on a curved roadway in dry daytime and nighttime conditions. The evaluation of a roadside culvert was included in the study for a straight roadway in dry daytime and nighttime conditions. Twenty-nine delineation practices were evaluated in the study.
The findings of the closed-course and computer-based studies showed that drivers reacted differently when delineation was present. This effect was most apparent among drivers in the closed-course study as they approached the curve. Driver behavior varied depending on the type of delineation practice. Continuous retroreflective paint stripe for concrete barriers, post-mounted delineators for guardrails, and object markers for culverts were among those that improved driver performance for curved roadway applications.


