Strategies to Improve Reporting of Impaired and Distracted Driving in Motor Vehicle Crashes (2026)
Chapter: Appendix B: Web Tool for Text Classification

APPENDIX B
Web Tool for Text Classification
Web Tool
CIEACT (CIEACT, n.d.) is an online web tool capable of analyzing and extracting valuable information from crash narratives using text-mining techniques. It provides an opportunity to develop multiple models concurrently and analyze the results. CIEACT provides the following major functionalities:
- Real-time crash classification using developed (default) model
- Real-time model development and crash classification
- Crash analysis
- Result visualization
- Result download
CIEACT gives users the option of training their own models or using a default model that has already been trained. The current version of CIEACT uses a NoisyOR-based hybrid (unigram + bigram) classifier for both the default model and the training of a new model. Currently, the default model is applicable for work zone crash classification. CIEACT was tested both offline and online using different types of electronic devices. During the testing process, the tool showed satisfactory performance with all designed functionalities working properly. A case study was also conducted to evaluate the functionality of a custom model that allows users to train their model in real time.
CIEACT can assist in extracting valuable information from narratives, recovering missed crashes, and reviewing the results in both tabular and spatial contexts. The tool can help to analyze crashes and implement new policies to enhance structural data quality and determine effective safety measures.
Training the Model (Figure B-1)
The following bullet points and figures will show users of the online tool step-by-step instructions to train the model:
- Upload training data in the form of a csv file.
- Choose a model type to train.
- Provide an email ID and a three-digit pin to run the models. This is required for the tool to distinguish data from multiple users and store individual classification results in the database.
- To apply the NoisyOR classifier to crash narratives, first, the word probabilities of unigram and bigram are computed.
- Then by combining these probabilities using the NoisyOR method, the final classification score is calculated.

Long Description.
The user interface displays options for training model parameters. Users can upload a CSV file using a browse button. Dropdown menus allow selection of select labels and select crash narratives. A select model area features Noisy OR (Unigram plus Bigram). Input fields for email and PIN are provided, with a train model button to initiate the process.
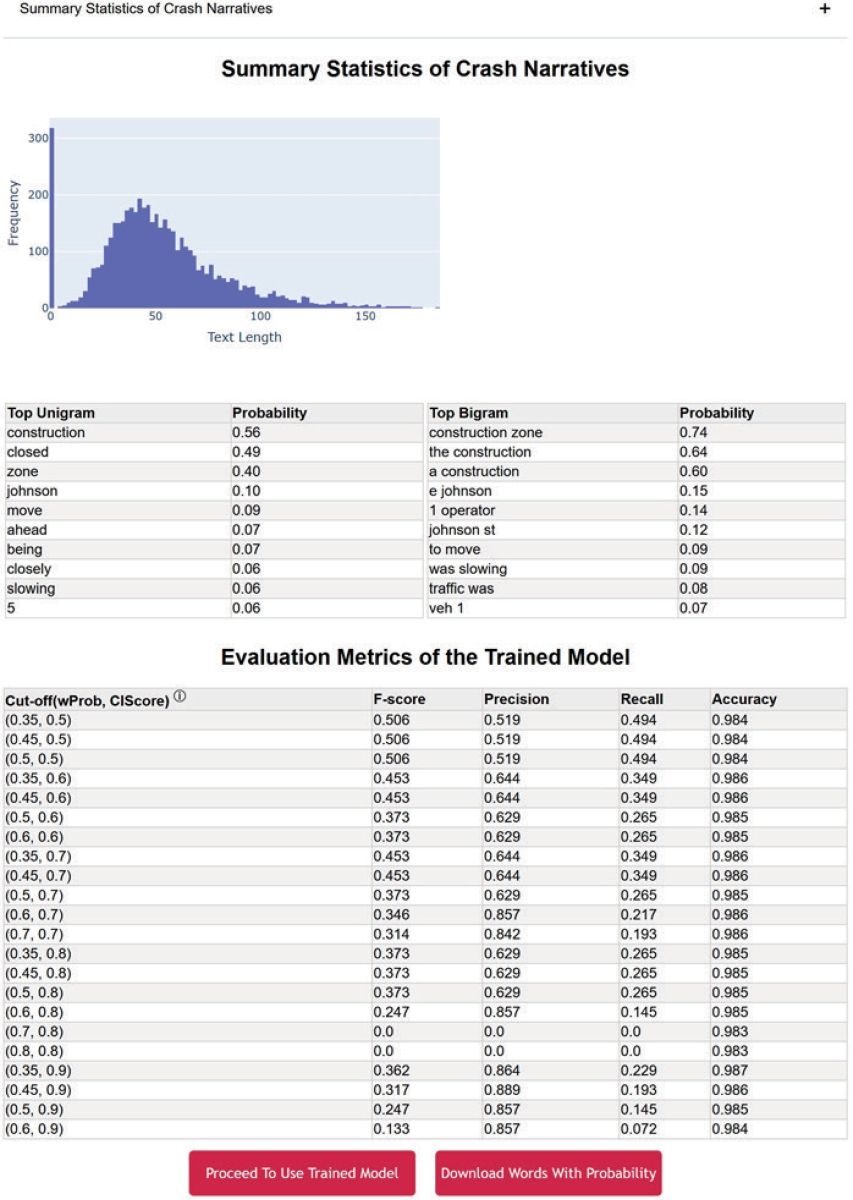
Trained Model Summary (Figure B-2)
- Get an idea of training from summary statistics of word probability.
- Choose the best cutoff value from table of evaluation metrics for crash classification. Use the best cutoff value of word probability to the next step.
- Scroll down to the bottom of the page and proceed to use model upon satisfactory training summary.
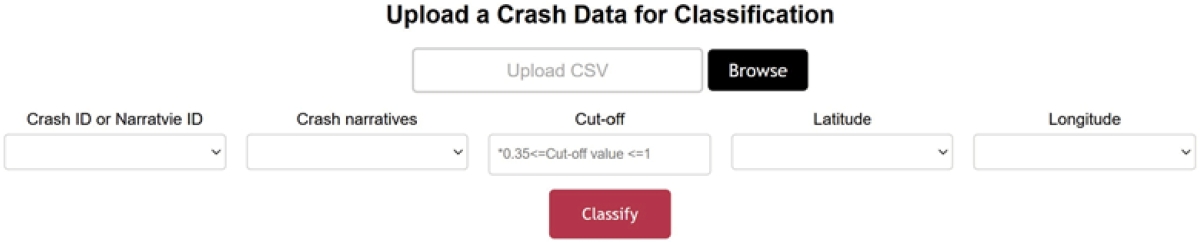
How to Use Trained Model (Figure B-3)
- Upload test data in csv file format.
- Use the best cutoff value from the previous table of evaluation metrics for training.
- Classify the text.
Explanation of Tabular Results (Figure B-4)
- Orange represents unigram.
- Green represents bigram.
- Green-orange color represents overlapping words of unigrams and bigrams.
- Black color words are considered to be less significant for classification.
- Color intensity represents the weight of the words while classifying the text/reports. A minimum threshold value of 0.35 has been used.
- Clicking on a result will display its location on map.
Long Description.
The statistical analysis of crash narratives, featuring a histogram displaying text length on the horizontal axis ranging from 0 to 150 in increments of 50 and frequency on the vertical axis ranging from 0 to 300 in increments of 100. It includes a table listing top unigrams and bigrams with their probabilities. Additionally, evaluation metrics of a trained model are shown in a second table, detailing cut-off probabilities, F-scores, precision, recall, and accuracy. The image also contains buttons labeled ‘Proceed To Use Trained Model’ and ‘Download Words With Probability’. The table at the top has two sections. The table in the left section lists the following. The column headers of the table are top unigram and probability. The data given in the table row-wise are as follows: Row 1: construction, 0.56. Row 2: closed, 0.49. Row 3: zone, 0.40. Row 4: Johnson, 0.10. Row 5: move, 0.09. Row 6: ahead, 0.07. Row 7: being, 0.07. Row 8: closely, 0.06. Row 9: slowing, 0.06.And row 10: 5, 0.06. The table on the right lists the following. The column headers of the table are top bigram and probability. The data given in the table row-wise are as follows: Row 1: the construction zone, 0.74. Row 2: the construction, 0.64. Row 3: a construction, 0.60. Row 4: e johnson, 0.15. Row 5: 1 operator, 0.14. Row 6: Johnson s t, 0.12. Row 7: to move, 0.09. Row 8: was slowing, 0.09. Row 9: traffic was 0.08. And row 10: veh 1, 0.07. The second table is titled “Evaluation metrics of the trained model.” The column headers of the table are cut off (wProb, C I Score), F-score, Precision, Recall, and Accuracy. The data given in the table row-wise are as follows: row 1: (0.35,0.5), 0.506, 0.519, 0.494, 0.984. Row 2: (0.45,0.5), 0.506, 0.519, 0.494, 0.984. Row 3: (0.5,0.5), 0.506, 0.519, 0.494, 0.984. Row 4: (0.35, 0.6), 0.453, 0.644, 0.349, 0.986. Row 5: (0.45, 0.6), 0.453, 0.644, 0.349, 0.986. Row 6: (0.5, 0.6), 0.373, 0.629,0.265, 0.985). Row 7: (0.6, 0.6),0.373, 0.629, 0.265, 0.985. Row 8: (0.35, 0.7),0.453, 0.644, 0.349, 0.986. Row 9: (0.45, 0.7) 0.453, 0.644, 0.349, 0.986. Row 10: (0.5, 0.7), 0.373, 0.629, 0.265, 0.985. Row 11: (0.6, 0.7), 0.346, 0.857, 0.217, 0.986. Row 12: (0.7, 0.7), 0.314, 0.842, 0.193, 0.986. Row 13: (0.35, 0.8), 0.373, 0.629, 0.265, 0.985. Row 14: (0.45, 0.8), 0.373, 0.629, 0.265, 0.985. Row 15: (0.5,0.8), 0.373, 0.629, 0.265, 0.985. Row 16: (0.6, 0.8), 0.247, 0.857, 0.145, 0.985. Row 17: (0.7, 0.8), 0.0, 0.0, 0.0, 0.983. Row 18: (0.8, 0.8), 0.0, 0.0, 0.0, 0.983. Row 19: (0.35, 0.9), 0.362, 0.864, 0.229,0.987. Row 20: (0.45, 0.9), 0.317, 0.889, 0.193, 0.986. Row 21: (0.5, 0.9), 0.247, 0.857, 0.145, 0.985. Row 22: (0.6, 0.9), 0.133, 0.857, 0.072, 0.984.
Long Description.
The user interface displays a form for uploading crash data for classification. It includes a button to upload a CSV file and a browse option. There are fields for entering Crash ID or Narrative ID, crash narratives, cut-off, latitude, and longitude. A ‘Classify’ button is present to initiate the classification process.

Long Description.
The image shows a map and a table detailing crash reports. The data given in the table row-wise are as follows: Row 1: 190611133, on June 29, 2019. I was working in my official capacity as a police officer for the city of Madison when I was dispatched to S Broom Street at W Wilson Street for reports of a vehicle crash with no injuries and no blockage. Unit 1 was pulled over in a closed lane of traffic for construction. Unit 1 pulled out into the active lane of traffic and crashed into the side of Unit 2, which was traveling straight in his lane. Unit 1 was cited for an unsafe lane deviation and admitted that it is. Narrative stops and score is 0.772. Row 2: 190702651, Unit 1 was driving westbound on US Highway 12. Unit 1 veered across two lanes of traffic, struck a construction cone, then collided with the concrete median. Unit 1 drove against the concrete median for approximately 100 feet and came to a stop. The driver experienced an internal event that led to the crash, Score 0.823. Row 3: 190901502, on September 7, 2019 at approximately 10:05 p m, unit on was traveling westbound on US Highway 12 behind Unit 2. The westbound lanes of US Highway 12 were under construction at this time and brought down to one lane. Traffic was congested, and multiple vehicles stopped abruptly. Unit 1 was unable to stop in time, even with the attempt to move to the left shoulder. Unit 1 struck Unit 2 on its passenger side back panel with Unit 1’s driver’s side, Score 0.557. Row 4: 191002596, on October 8, 2019, I responded to a crash at Odana Road and s. Segoe Road. At this intersection, s. Segoe Road to Odana Road has a stop sign, which was present and in place. Further, the area is under construction with construction barrels and yellow tape; however, the entire intersection is passable. Unit 1 Henry was making a right-hand turn from s. Segoe Road to head westbound on Odana Road. She stated that she was keeping her eyes open, Score 0.557. And row 5: 190505481, I was dispatched to this crash. On arrival, I saw damage to the front of Unit 1 and the rear of Unit 2. Brett told me that he was driving northbound on Johnson Street, approaching First Street. He said he was tired because he works nights, and his reaction was delayed when traffic slowed ahead of him. He crashed into the rear of Unit 2. Alexandra told me that she came to a full stop in heavy traffic that was backed up due to construction, then, Unit 1 rear-ended Unit 1 (front loader), which was traveling northbound from one construction site on E. Johnson. To another construction site on e, Score 0.557. Explanation of text colors: Orange color represents Unigram, Green color represents Bigram, Green-Orange color represents overlapping words of unigrams and bigrams. Black color is considered to be less significant for classification. Color intensity represents the weight of the words while classifying the text or reports. A minimum threshold value of 0.35 has been used. “Click” on the result will display the location on the map.


