Strategies to Improve Reporting of Impaired and Distracted Driving in Motor Vehicle Crashes (2026)
Chapter: 3 Examination and Documentation of Statewide and Jurisdictional Efforts

CHAPTER 3
Examination and Documentation of Statewide and Jurisdictional Efforts
The objectives of this task were to examine and document current statewide and jurisdictional efforts to identify current practices for collecting data on impaired (e.g., alcohol, drugs) and distracted driving in crash data, identify commonalities and differences between state practices, and identify and describe current challenges and gaps in data collection and reporting that might lead to under- and overreporting impaired and distracted driving in state crash systems. The research team developed online surveys specific to each key stakeholder group identified, and those links were distributed directly to the stakeholders by email. The seven survey types employed were for law enforcement, crash data managers (CDMs), highway safety offices, safety engineers, researchers, judicial, and all others. Each survey was sent to the appropriate stakeholders with instructions to complete the survey that aligned best with their role.
3.1 Summary of Respondents
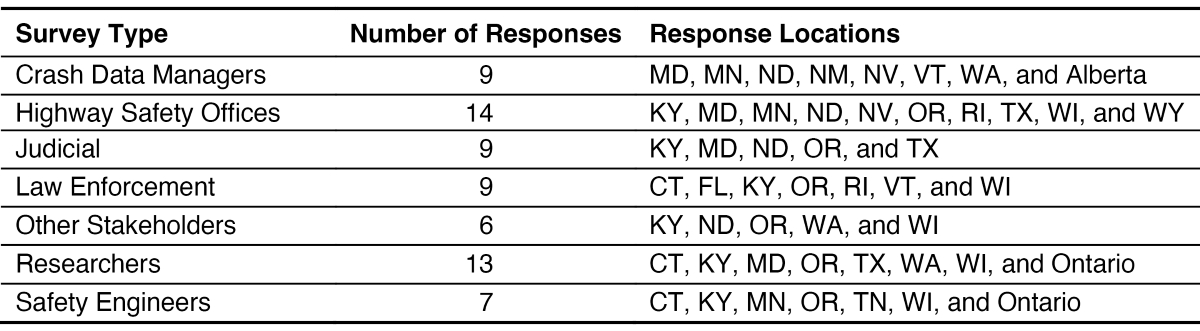
A summary of respondents by location and survey type is listed in Tables 2 and 3, followed by survey question responses. Questions on the seven surveys were tailored to each of the seven types of respondents targeted in the outreach. The seven versions of the survey are included in Appendix A of this report. Several questions were common to all seven surveys, while others were specific to the roles and responsibilities of the work performed by respondents. In the description that follows, the respondent types and total responses are provided to aid in interpreting the results. Sixty-seven responses were received from 16 states and two Canadian provinces, as shown in Tables 2 and 3.
3.1.1 How Do You Define Alcohol-Involved Crashes?
All surveys included questions about the definition of impaired driving crashes. The question was asked separately for alcohol-involved and drug-involved crashes because the definitions for the two types of impairment often differ. The question allowed the respondent to submit responses via short narrative. Responses were reviewed and sorted into categories, as shown in Figure 1.
In Figure 1 and throughout this report, the respondent type is identified as it appears in the inserted key box (e.g., CDM for crash data manager). The definitions of alcohol involved are as follows:
- N/A: Respondent reported that the question did not apply to their job responsibilities.
- Limit: Respondent replied that they used the per se alcohol limit applicable to the driver as the definition of impaired driving.
- Influence: Respondent replied that they relied on the officerʼs indication on the crash report form that the crash was influenced by alcohol.

Long Description.
The column headers of the table are Location of Survey Response and Number of Responses. The data given in the table row-wise are as follows:
Row 1: Connecticut (CT); 5.
Row 2: Florida (FL); 1
Row 3: Kentucky (KY); 9
Row 4: Maryland (MD); 5
Row 5: Minnesota (MN); 3
Row 6: Nevada (NV); 2
Row 7: New Mexico (NM); 1
Row 8: North Dakota (ND); 5
Row 9: Oregon (OR); 9
Row 10: Rhode Island (RI); 3
Row 11: Tennessee (TN); 1
Row 12: Texas (TX); 7
Row 13: Vermont (VT); 3
Row 14: Washington (WA); 3
Row 15: Wisconsin (WI); 6
Row 16: Wyoming (WY); 1
Row 17: Alberta, Canada; 1
Row 18: Ontario, Canada; 2
Long Description.
The column headers of the table are Survey Type, Number of Responses, and Response Locations. The data given in the table row-wise are as follows:
Row 1: Crash Data Managers; 9 responses; MD, MN, ND, NM, NV, VT, WA, and Alberta.
Row 2: Highway Safety Offices; 14 responses; KY, MD, MN, ND, NV, OR, RI, TX, WI, and WY.
Row 3: Judicial; 9 responses; KY, MD, ND, OR, and TX.
Row 4: Law Enforcement; 9 responses; CT, FL, KY, OR, RI, VT, and WI.
Row 5: Other Stakeholders; 6 responses; KY, ND, OR, WA, and WI.
Row 6: Researchers; 13 responses; CT, KY, MD, OR, TX, WA, WI, and Ontario.
Row 7: Safety Engineers; 7 responses; CT, KY, MN, OR, TN, WI, and Ontario.

Long Description.
The roles include CDM: Crash Data Manager, HSO: Highway Safety Office, JUD: Judicial, LEO: Law Enforcement Officer, OTHR: Other, RSCH: Researcher, SE: Safety Engineer. The x-axis lists factors like not available, Limit, Influence, Any, Contribute, Citation, Adverse, and Presence. The y-axis represents the number of respondents, ranging from 0 to 10 in increments of 2. Each category is color-coded, with CDM in blue, HSO in orange, JUD in grey, LEO in yellow, OTHR in light blue, RSCH in green, and SE in purple. The chart shows varying responses, with the highest number of respondents for ‘Limit’ and ‘Citation’ categories as 7 and 9, particularly from HSO and JUD roles. The moderate number of respondents includes 6 for Any and 4 for Contribute from RSCH and 4 for Any from SE. The lowest number of respondents includes 1 for not available, limit, adverse, and presence from CDM, HSO, and OTHR. The column headers of the table are Not Available, Limit, Influence, Any, Contribute, Citation, Adverse, and Presence. The data given in the table row-wise are as follows: Row 1: CDM, 1, 6, Blank, 2, Blank, Blank, Blank, Blank. Row 2: HSO, 1, 7, Blank, 5, Blank, Blank, 1, Blank. Row 3: JUD, 0, 0, 0, 0, 0, 9, 0, 0. Row 4: LEO, 0, 2, 3, 3, 1, 0, 0, 0. Row 5: OTHR, 2, 0, 1, 2, 0, 0, 0, 1. Row 6: RSCH, 1, 0, 0, 6, 4, 0, 0, 2. Row 7: SE, 1, 1, 1, 4, Blank, Blank, Blank, Blank.
- Any: Respondent replied that they coded the crash as alcohol involved if any coded, narrative component, or related citation included any alcohol indication.
- Contribute: Respondent replied that they relied on the “contributing circumstances” or “contributing factors” data element on the crash report.
- Citation: Respondent replied that they rely solely on the citation information.
- Adverse: Respondent defines alcohol impairment as any adverse impact of alcohol on the driverʼs performance.
- Presence: Respondent called a crash alcohol involved if there was any indication of alcohol (BAC > 0.0) for any involved person.
The pattern of results shows that domain-specific responses are clear for those in Law Enforcement, Judicial, and Research roles. These groups had unique responses that were (generally) not shared by other types of respondents—in particular, the Judicial respondents exclusively rely on citations as a source to determine whether a crash is alcohol related, and they were the only respondents to use this source exclusively. The most frequent response was to define alcohol-involved crashes based on the per se legal limit applicable to the driver.
3.1.2 How Do You Define Drug-Impaired Crashes?
This question appeared on each of the seven surveys. Figure 2 shows the responses for each type of respondent to the question asking how they define drug-impaired driving crashes. The question allowed the respondent to submit their response via short narrative, so responses were reviewed and sorted into categories.
As can be seen in Figure 2, many more respondents said that this question does not apply to their job responsibilities than the question on the definition of alcohol impairment. As might

Long Description.
The bar chart is titled ‘Define drug-involved crashes.’ The roles include CDM: Crash Data Manager, HSO: Highway Safety Office, JUD: Judicial, LEO: Law Enforcement Officer, SE: Safety Engineer, RSCH: Researcher, OTHR: Other. The x-axis lists categories such as Not Available, Limit, Influence, Any, Contribute, Citation, Adverse, and Presence. The y-axis represents the number of respondents, ranging from 0 to 10 in increments of 2. Key insights show varying responses, with Citation having the highest response from Judicial at 9, while Any has five responses from Highway Safety Office and Researchers. The lowest respondents include 1 from Not Available, Influence, Any, Contribute, Adverse, and Presence from LEO, CDM, SE, HSO, RSCH. The column headers of the table are Blank, Not Available, Limit, Influence, Any, Contribute, Citation, Adverse, and Presence. The data given in the table row-wise are as follows: Row 1: CDM, 3, Blank, Blank, 3, Blank, Blank, Blank, 3. Row 2: HSO, 2, 2, Blank, 5, Blank, Blank, 1, 4. Row 3: JUD, 0, 0, 0, 0, 0, 9, 0, 0. Row 4: LEO, 1, 0, 3, 2, 1, 0, 1, 1. Row 5: OTHR, 4, 0, 1, 1, 0, 0, 0, 0. Row 6: RSCH, 3, 0, 0, 5, 4, 0, 0, 1. Row 7: SE, 2, Blank, 1, 4, Blank, Blank, Blank, Blank.
be expected, few responded with an answer citing a legal limit for drugs because the question was general to all drug-related impairment, and states have not set a per se limit for many substances (especially if the substance is a legally prescribed medication that may, nonetheless, impair driving performance under some conditions).
The choice labeled “Presence” is unclear as it could be interpreted the same as a legal “limit” equal to the limit of detection (i.e., zero or as close to zero as the lab can detect); however, that is only applicable for licit drugs and abuse of prescribed medications (i.e., use by one other than the person for whom the drug is prescribed). Respondents who define drug-impaired crashes by “Presence” may be thinking of the specific types of drugs their state law bans at the limit of detection.
As was the case for alcohol-impaired crashes, all Judicial respondents use citations as the definition of drug-impaired crashes. One LEO reported using this definition.
3.1.3 Do You Have a Method for Estimating the Misreporting of Impaired Driving Crashes?
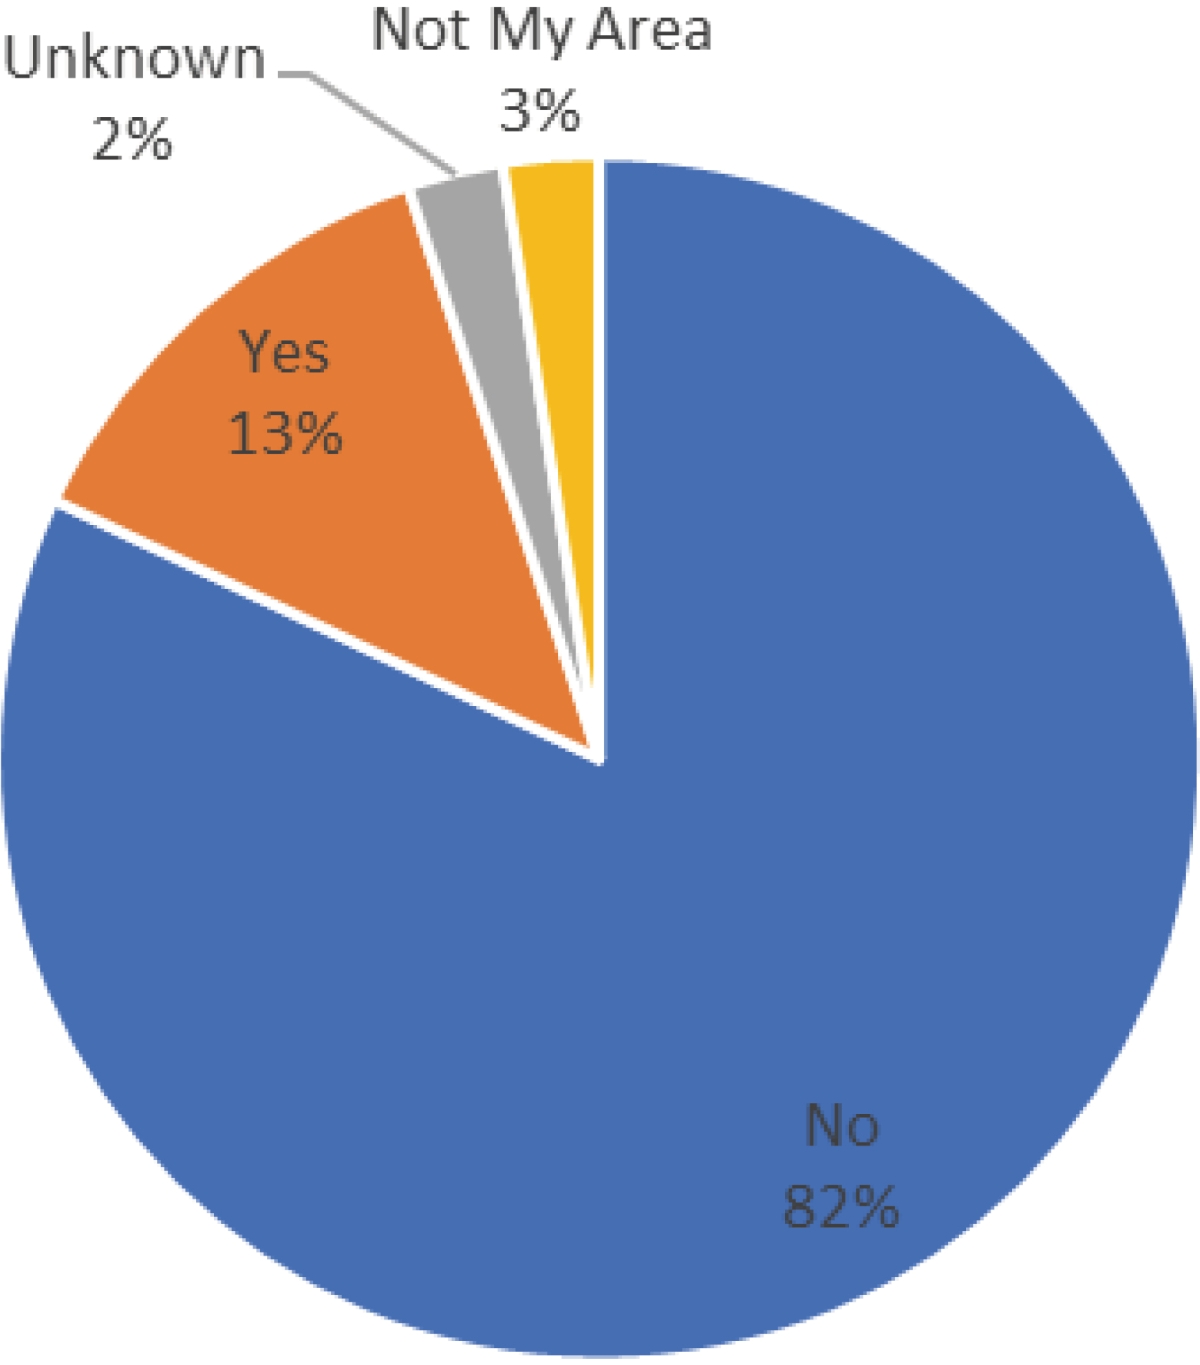
This question was included in the surveys for CDMs, LEOs, highway safety office staff, and safety engineers. It asked if they used any methods to address the under- or overreporting of impaired driving crashes. The question received 39 responses, as shown, broken down by percentage, in Figure 3.
As shown in Figure 3, the most frequent answer was that respondents do not have a method for estimating the number of under- or overreported impaired driving crashes. Five respondents said that they do have a method for assessing the degree of misreporting. Methods included linking to alternate data sources (hospital data, toxicology data, and medical examiner reports) and comparing FARS data.
Long Description.
The pie chart shows the “No” method available represented by 82 percent. “Yes” is represented by 13 percent, “Not My Area” is represented by 3 percent, and “Unknown” is represented by 2 percent. The chart visually emphasizes the predominance of the “No” response, highlighting a significant gap in available methods.
3.1.4 What Contributes to the Underreporting of Impaired Driving?
CDMs and LEOs were asked to rate the importance of several factors in underreporting impaired driving crashes using a severity scale from 0 for no impact to 5 for severe impact. The factors included in the question were testing resources, hospital refusals (to conduct or share tests), parties not at scene (upon arrival of law enforcement), and lab delays. Table 4 shows the individual scores for the respondents among CDMs and LEOs, as well as the mean, minimum, maximum, median, and standard deviation scores.
As shown in Table 4, the range of values is similar for all items. Interestingly, no respondent discounted testing resources entirely as a contributing factor in underreporting. It is important to note that only 1 of 9 LEOs reported testing resources, parties not at scene, and lab delays as having a severe impact, while 4 of 9 LEOs reported hospital refusals as having severe impacts.
3.1.5 How Do You Define Distraction-Involved Crashes?
This question appeared in all seven surveys. Figure 4 shows the results from 45 respondents.
The respondent types are shown in the key box and are identical to those in Figure 1. Figure 4 shows the results for respondents when asked how they define distraction-involved crashes. A small number replied that it was not their responsibility to define these crashes. Other responses are defined as follows:
- No Def: Respondents replied that they do not have a definition of distracted driving-involved crashes.

Long Description.
The column headers of the table are Respondent, State, Testing resources, Hospital refusals, Parties Not at scene, and Lab delays. The data given in the table row-wise are as follows: Row 1: CDM 1: MD, 1, 3, 2, 4. Row 2: CDM 2: NM, 3, 2, 4, 4. Row 3: CDM 3: VT, 3, 3, 3, 3. Row 4: CDM 4: WA, 2, 1, 1, 3. Row 5: CDM 5, NV, 1, 2,2, 1. Row 6: CDM 6: MN, 4,1, 1, 5. Row 7: CDM 8: VT, 2, 3, 2, 2. Row 8: CDM 9: ALB, 2, 0, 2, 5. Row 9: LEO 1: KY, 3, 4, 5, 1. Row 10: LEO 2: CT, 2, 5, 3, 1. Row 11: LEO 3: CT, 2, 0, 0, 0. Row 12: LEO 4: FL, 5, 5, 4, 5. Row 13: LEO 5: CT, 2, 5, 1, 0. Row 14: LEO 6: OR, 2, 2, 3, 0. Row 15: LEO 7: RI, 2, 5, 4, 0. Row 16: LEO 8: VT, 4, 2, 3, 1. Row 17: LEO 9: WI, 3, 3, 2, 4. Row 18: Blank: MEAN, 2.5, 2.7, 2.5, 2.3. Row 19: Blank: Min, 1, 0, 0, 0. Row 20: Blank: Max, 5, 5, 5, 5. Row 21: Blank: Median, 2, 3, 2, 2. Row 21: STDEV, 1.0, 1.6, 1.3, 1.9.

Long Description.
The bar chart is titled “Define distraction-involved crashes.” The roles include CDM: Crash Data Manager, LEO: Law Enforcement Officer, HSO: Highway Safety Office, SE: Safety Engineer, RSCH: Researcher, JUD: Judicial, OTHR: Other. The x-axis lists categories not available, No Def, Element, Contribute, Any, Law, Citation, Opinion, and Crash Type. The y-axis represents the number of respondents, ranging from 0 to 7 in increments of 1. Key insights show varied responses, with the Highway Safety Office having the highest response in the Any category as 6 respondents and the lowest respondents in Judicial in not available, no def, element, any, law, citation, and crash type as 1 respondents in CDM, LEO, HSO, SE, RSCH. The column headers of the table are Not Available, No Def, Element, Contribute, Any, Law, Citation, Opinion, and Crash Type. The data given in the table row-wise are as follows: Row 1: CDM, Blank, 1, 2, 4, 1, 1, Blank, Blank, Blank. Row 2: LEO, 1, 1, Blank, Blank, 4, 2, Blank, 1, Blank. Row 3: HSO, 4, 1, Blank, Blank, 6, 2, Blank, 1, Blank. Row 4: S E: 1, Blank, 1, 2, 1, 1, Blank, 1, Blank. Row 5: RSCH, 3, Blank, 3, 3, 1, Blank, 1, 1, 1. Row 6: JUD, 3, 1, Blank, Blank, Blank, Blank, 5, Blank, Blank. Row 7: OTHR, 3, Blank, 2, Blank, 1, Blank, Blank, Blank, Blank.
- Element: Respondents replied that they use a data element on the crash form to specifically code for distraction. Contents (what is coded in the data element) differed among states.
- Contribute: Respondents replied that they use the “contributing circumstances (contributing factors)” data element attributes coding for distraction.
- Any: Respondents replied that they use any information on the crash report form (any data elements or narrative text) indicating that distraction was present or a factor in the crash to determine whether a crash was distraction related.
- Law: Respondents referred to a section of state law to provide their definition of driver distraction.
- Citation: Respondents replied that they rely on information from a citation to determine whether a crash was distraction involved.
- Opinion: Respondents used a checkbox on the crash report form that officers use to signal that, in their opinion, the driver was distracted.
- Crash Type: Respondents deduced that the crash was distraction involved based on the type of crash (e.g., single vehicle, at night, run off road, and lacking other explanatory circumstances).
As with the definition of impairment-involved crashes, the Judicial respondents rely on citation information to define distraction-involved crashes. The most frequent response from LEOs and highway safety office personnel was that they use any information on the crash report. Contributing circumstances and a specific data element for distraction were evenly split for utility in defining distraction-involved crashes.
3.1.6 Do You Have a Method to Assess the Misreporting of Distraction-Involved Crashes?
This question appeared in surveys for CDMs, LEOs, highway safety office staff, and safety engineers. Twenty-nine responses were received. Figure 5 shows the responses received among the four respondent types. The majority (74 percent) of respondents said they do not have a method of assessing misreporting. Five respondents (13 percent) said they have a method for

Long Description.
The pie chart is titled "Do you have a method for addressing the misreporting of distraction-involved crashes?" The largest segment, 74 percent, indicates "No" method available. "Yes" is represented by 13 percent, "Not My Area" by 8 percent, and "Unknown" by 5 percent. Each segment is labeled with its corresponding percentage, providing a clear visual distribution of the responses.
assessing the misreporting of distraction-involved crashes. Methods reported included manual review, reducing the number of contributing circumstances they count as distraction so overreporting is not as easy, adjusting for variance in specific crashes, adjusting compared with FARS, or leaving adjustments up to the district engineers as part of the diagnosis step of projects.
3.1.7 For Which Road User Types Do You Have Information About Distraction?
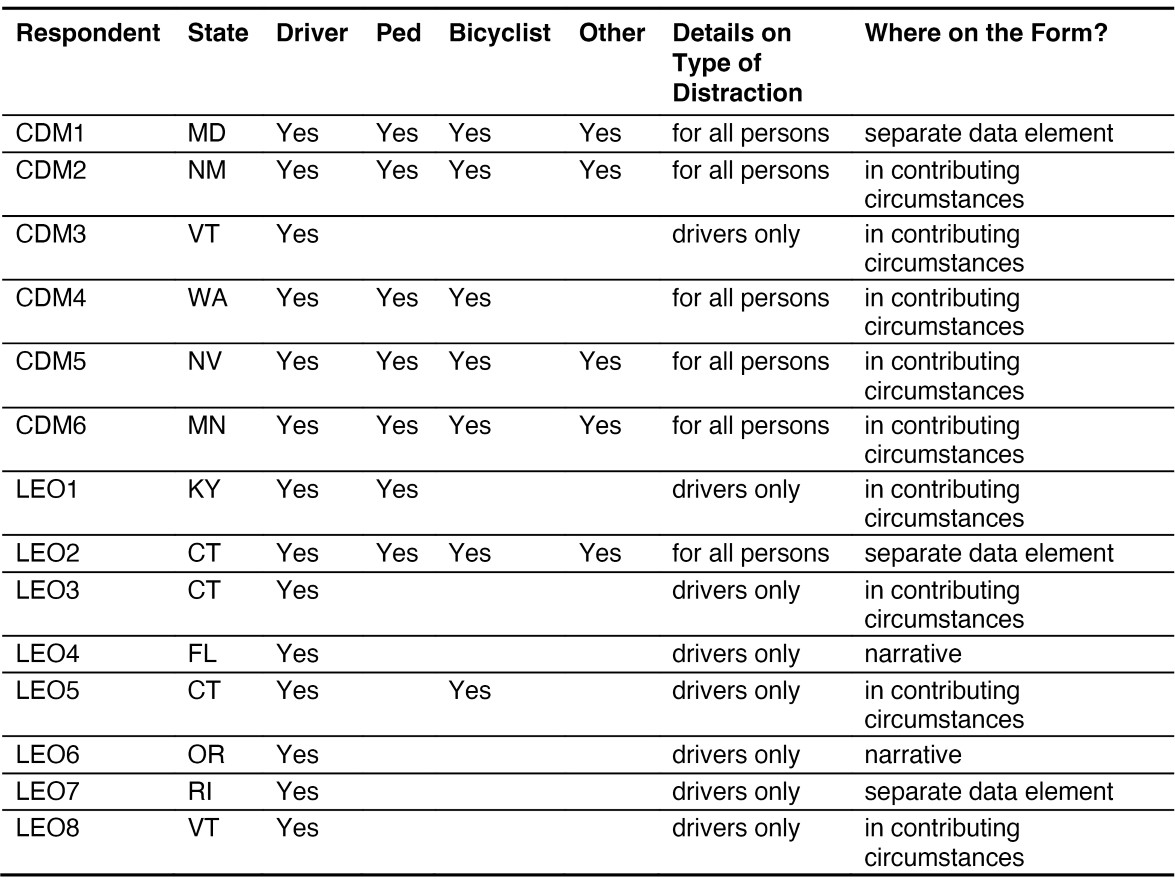
CDMs and LEOs specified the road user types for which their crash reports collect distraction-related information. There were 14 responses in total, six CDMs and eight LEOs. Table 5 shows the responses. All responding states collect distraction information about drivers. Five states (of 11 represented) had at least one respondent say that they collect distraction information on all persons (e.g., drivers, pedestrians, bicyclists, others). The most common method of capturing this information is through the “contributing circumstances (contributing factors)” data element. Only three states reported having a separate data element for collecting distraction information. Two states said they rely on the narrative description of the crash.
3.1.8 How Are Researchers Involved in Misreporting Crashes, and What Is Its Impact?
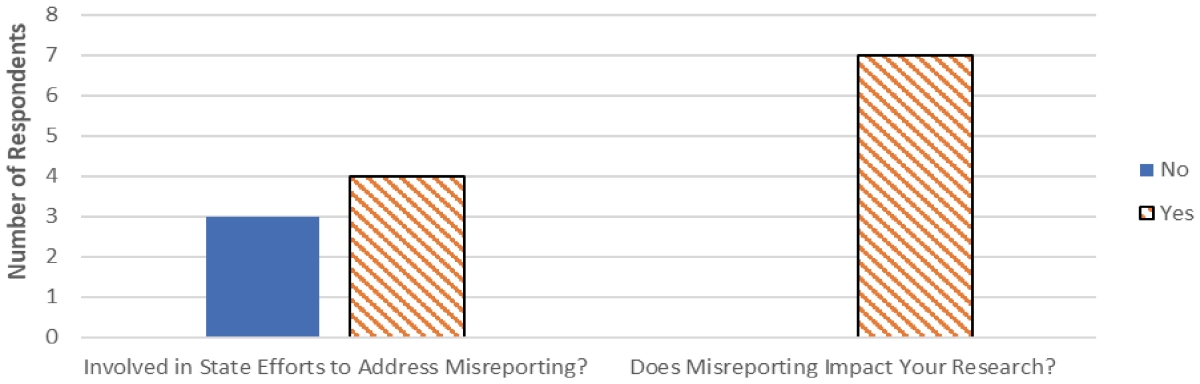
Seven respondents answered the questions on the researcher survey on whether they are involved in their statesʼ efforts to address the misreporting of specific types of crashes (either alcohol-involved or distraction-involved crashes), and whether misreporting impacts their
Long Description.
The column headers of the table are Respondent, State, Driver, Ped, Bicyclist, Other, Details on Type of Distraction, and Where on the form?. The data given in the table row-wise are as follows: Row 1: CDM 1, MD, Yes, Yes, Yes, Yes, for all persons, separate data element. Row 2: CDM 2: NM, Yes, Yes, Yes, Yes, for all persons, in contributing circumstances. Row 3: CDM 3: VT, Yes, Blank, Blank, Blank, drivers only, in contributing circumstances. Row 4: CDM 4, WA, Yes, Yes, Yes, Blank, for all persons, in contributing circumstances. Row 5: CDM 5: NV, Yes, Yes, Yes, Yes, for all persons, in contributing circumstances. Row 6: CDM 6: MN, Yes, Yes, Yes, Yes, for all persons, in contributing circumstances. Row 7: LEO 1: KY, Yes, Yes, Blank, Blank, drivers only, in contributing circumstances. Row 8: LEO 2: CT, Yes, Yes, Yes, Yes, for all persons, separate data element. Row 9: LEO 3: CT, Yes, Blank, Blank, Blank, drivers only, in contributing circumstances. Row 10: LEO 4, FL, Yes, Blank, Blank, Blank, drivers only, narrative. Row 11: LEO 5, CT, Yes, Blank, Yes, Blank, drivers only, in contributing circumstances. Row 12: LEO 6, OR, Yes, Blank, Blank, Blank, drivers only, narrative. Row 13: LEO 7: RI, Yes, Blank, Blank, Blank, drivers only, separate data element. Row 14: LEO 8: VT, Yes, Blank, Blank, Blank, drivers only, in contributing circumstances.
research, as shown in Figure 6. All seven researchers said that misreporting impacts their research. Four of the seven said that they have some role in their stateʼs efforts to address misreporting.
3.2 Limitations and Follow-Up
The surveys were tailored to the business needs of the seven respondent types. As such, the questions differed among the various surveys. The findings presented do not include a summary of all responses, in part because there were too few respondents in some classifications and in part because some respondent types did not use crash data. For example, Judicial respondents
Long Description.
The x-axis represents two categories: Involvement in state efforts to address misreporting? And does misreporting impact research? The y-axis shows the number of respondents, ranging from 0 to 8 in increments of 1. In the first category, four respondents are involved in state efforts to address misreporting, and three respondents are not. And does misreporting impact research? In that second category, seven respondents say yes. The chart uses different patterns to distinguish between “No” and “Yes” responses.
were unanimous in their reliance on citation information and therefore did not consider crash misreporting as an issue and were not concerned about data from crash reports.
The surveys identified seven individuals who said they use methods that can identify misreporting. The research team followed up with the individuals but determined that the methods being used would not be relevant or beneficial to this research. Several agencies reported on having access to linked hospital and toxicology data but are not using it for this purpose. The research team ended up developing a method using linked hospital and toxicology data, so while states may not be using the linked data for this purpose at this time, their already linked data sets will be beneficial. Several agencies were also early in the process of their own efforts to address the issue but did not have any information to share at the time of the data collection.


