Strategies to Improve Reporting of Impaired and Distracted Driving in Motor Vehicle Crashes (2026)
Chapter: 6 Case Studies

CHAPTER 6
Case Studies
6.1 Text Classification Method for Impaired Driving
Case studies were completed using crash data and narratives from three states:
- Connecticut 2018–22 crash data and narratives
- Kentucky 2019–23 crash data and narratives
- Wisconsin 2018–22 crash data and narratives
Alcohol-impaired driving was defined by crash reports indicating whether law enforcement suspected that at least one driver or non-motorist involved in the crash had used alcohol. The definition includes both alcohol use under the legal limit and at or over the legal limit. The field on the crash reports could be filled with “Yes,” “No,” or “Unknown.” Drug-impaired driving was defined by crash reports indicating whether law enforcement suspected that at least one driver or non-motorist involved in the crash had used drugs. Again, the field on the crash reports could have “Yes,” “No,” or “Unknown.” The overview statistics of the crash data used for each state can be found in Tables 19, 20, and 21. Wisconsin is the only state that records alcohol- and drug-related impaired driving crashes separately, whereas Connecticut and Kentucky include both in one category.
6.1.1 Model Training—Impairment
The models were trained with 3 years of crash data for each state. Connecticut was 2018–20, Kentucky was 2019–21, and Wisconsin was 2018–20. All crashes for which the alcohol and drug fields were reported as unknown were discarded, along with narratives with length less than 20 characters. The unigram count, bigram count, and determined cutoff value for each model are listed here:
- Connecticut: 37 unigrams and 375 bigrams were based on a 0.85 cutoff value and used to calculate the classification score for alcohol-involved crashes.
- Kentucky: 186 unigrams and 1,350 bigrams were based on a 0.8 cutoff value and used to calculate the classification score for alcohol-involved crashes.
- Wisconsin: 44 unigrams and 321 bigrams were based on a 0.8 cutoff value and used to calculate the classification score for alcohol-involved crashes; 16 unigrams and 17 bigrams were based on a 0.7 cutoff value and used to calculate the classification score for drug-involved crashes.
Examples of top unigrams and bigrams for impaired driving include Intoxilyzer, heal, glassy, deviation, alc, the Intoxilyzer, dui see, nystagmus prior, to drinking, and intoxicating beverages.

Long Description.
The column headers of the table are Year, FLAG, YES (Crashes), NO (Crashes), and Total Crashes. The data given in the table row-wise are as follows: Row 1: 2018, ALC or DRUG, 3,016, 110,840, 113,856. Row 2: 2019, ALC or DRUG, 3,075, 109,483, 12,558. Row 3: 2020, ALC or DRUG, 2,716, 81,176, 83,892. Row 4: 2021, ALC or DRUG, 3,064, 98,085, 101,149. Row 5: 2022, ALC or DRUG, 2,136, 71,219, 73,355.
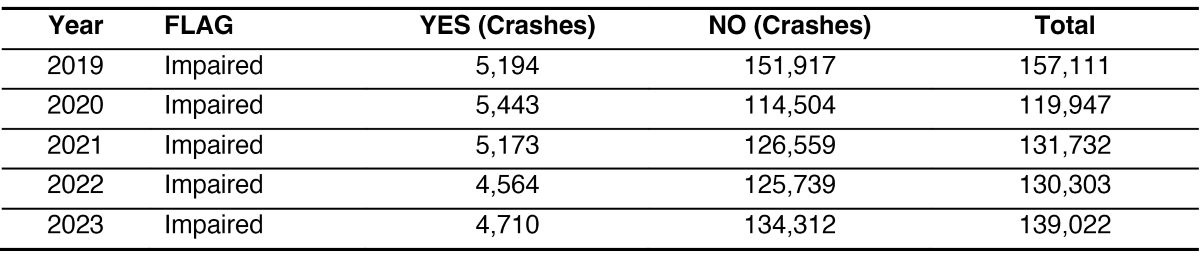
Long Description.
The column headers of the table are Year, FLAG, YES (Crashes), NO (Crashes), and Total Crashes. The data given in the table row-wise are as follows: Row 1: 2019, Impaired, 5,194, 151,917, 157,111. Row 2: 2020, Impaired, 5,443, 114,504, 119,947. Row 3: 2021, Impaired, 5, 173, 126,559, 131,732. Row 4: 2022, Impaired, 4,564, 125,739, 130,303. Row 5: 2023, Impaired, 4,710, 134,312, 139,022.
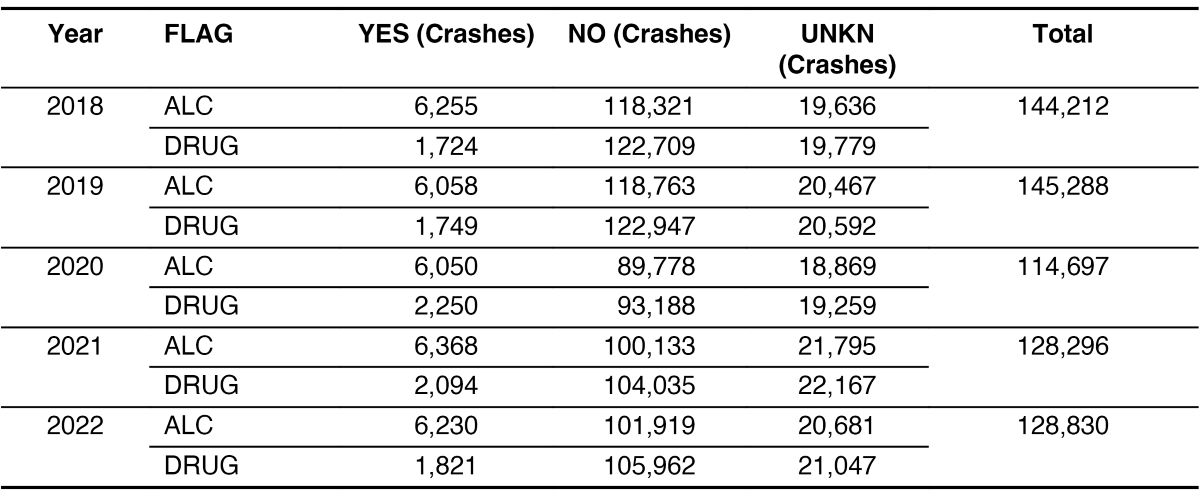
Long Description.
The column headers of the table are Year, FLAG, YES (Crashes), NO (Crashes), UNKN (Crashes), and Total Crash. The row has sub-rows. The data given in the table row-wise are as follows: Row 1: 2018. Sub-row 1: ALC: 6,255, 118,321, 19,636. Sub-row 2: DRUG: 1,724, 122,709, 19,779, 144,212. Row 2: 2019. Sub-row 1: ALC: 6,058, 118,763, 20,467, 145,288. Sub-row 2: DRUG: 1,749, 122,947, 20,592. Row 3: 2020. Sub-row 1: ALC: 6,050, 89,778, 18,869, 114,697. Sub-row 2: DRUG: 2,250, 93,188, 19,259. Row 4: 2021. Sub-row 1: ALC: 6,368, 100,133, 21,795, 128,296. Sub-row 2: DRUG: 2,094, 104,035, 22,167. Row 5: 2022. Sub-row 1: ALC: 6,230, 101,919, 20,681, 128,830. Sub-row 2: DRUG: 1,821, 105,962, 21,047.
6.1.2 Model Testing and Validation—Impairment
Five years of collected crash data from the three participating states was then used to feed the trained models for identifying underreported impaired driving–related crashes. The model testing results then went through manual validation by analytic staff. For the manual review, 20 percent of the predicted crashes from each state were randomly selected. The manual review also focused on determining whether alcohol or drugs were involved because of the use of certain words, mainly including:
- Have been intoxicated
- Drink before driving
- Open intoxicant found in vehicle
- Operating while intoxicated/impaired
- Drugs found in vehicle
- Standardized field sobriety test greater than 0
- Blood test indicating intoxicant usage
- Alcohol or weed smell
- Operation while under the influence of liquor or drug or while having an elevated BAC
The results for each state can be found in Tables 22, 23, and 24.
It is important to note the difference in the projected underreported rate for Wisconsin alcohol-involved and drug-involved driving, as shown in Table 25, when compared with the results in Chapter 5. This difference is due to different training and validation datasets being used to develop the text classification method when compared with the training and validation sets used in the case study. In Chapter 5, the training set was crash data from 2019–21, with 30 percent of the crash reports the model returned receiving a manual review. For this case study, the training set was crash data from 2018–20 and 20 percent of the crash reports the model returned went through a manual review. These results highlight two of the limitations of text mining of crash

Long Description.
The column headers of the table are Year, FLAG, Random Sample Size, Validation Results, and Projected Under-reported Rate. The data given in the table row-wise are as follows: Row 1: 2018, ALC or DRUG, 90, 51, 8.4 percent. Row 2: 2019, ALC or DRUG, 83, 62, 10.1 percent. Row 3: 2020, ALC or DRUG, 75, 45, 11.2 percent. Row 4: 2021, ALC or DRUG, 102, 73, 18.1 percent. Row 5: 2022, ALC or DRUG, 84, 39, 9.6 percent. In Row 6, the first and second columns are combined to indicate the Total. The data given in Row 6 is as follows: Total: 434, 270, 11.1 percent.
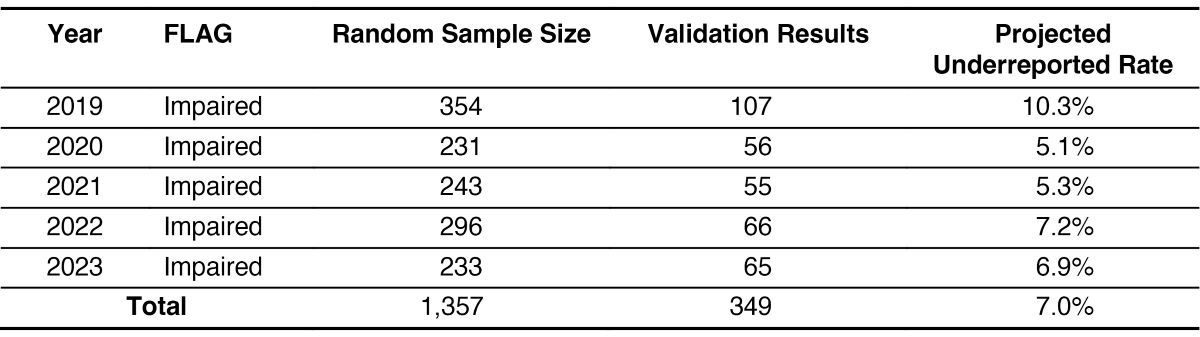
Long Description.
The column headers of the table are Year, FLAG, Random Sample Size, Validation Results, and Projected Under-reported Rate. The data given in the table row-wise are Row 1: 2019, Impaired, 354, 107, 10.3 percent. Row 2: 2020, Impaired, 231, 56, 5.1 percent. Row 3: 2021, Impaired, 243, 55, 5.3 percent. Row 4: 2022, Impaired, 296, 66, 7.2 percent. Row 5: 2023, Impaired, 233, 65, 6.9 percent. In Row 6, the first and second columns are combined to indicate the Total. The data given in Row 6 is as follows: Total: 1357, 349, 7.0 percent.
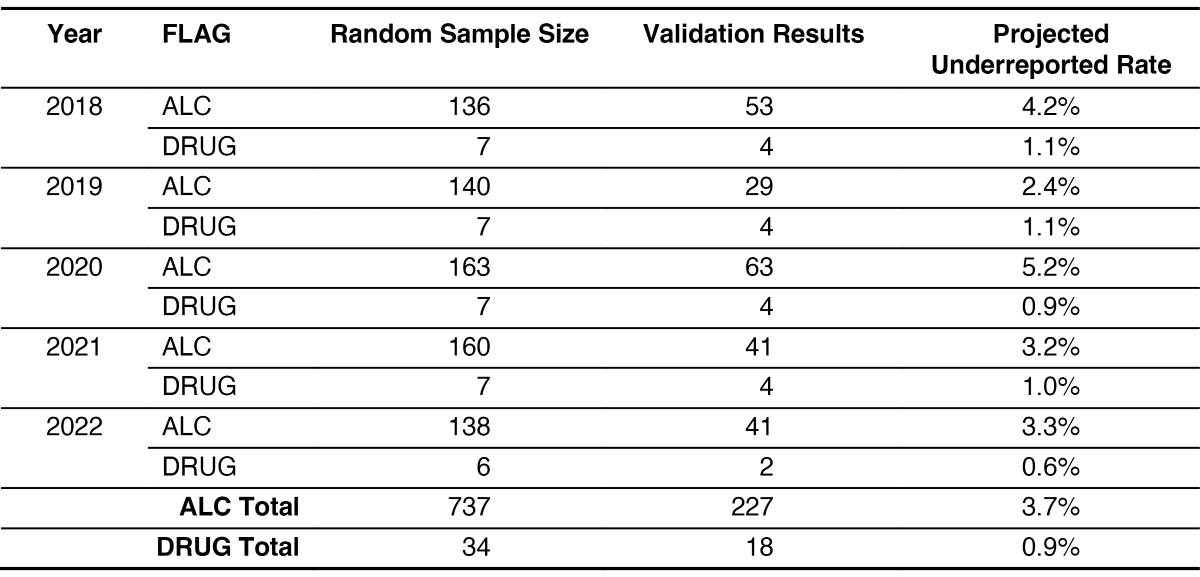
Long Description.
The column headers of the table are Year, FLAG, Random Sample Size, Validation Results, and Projected Underreported Rate. The first five rows are split into two separate rows. The data given in the table row-wise are as follows:
Row 1: 2018
The first sub-row of Row 1 consists of the following data: ALC; 136; 53; 4.2%
The second sub-row of Row 1 consists of the following data: DRUG; 7; 4; 1.1%
Row 2: 2019
The first sub-row of Row 2 consists of the following data: ALC; 140; 29; 2.4%
The second sub-row of Row 2 consists of the following data: DRUG; 7; 4; 1.1%
Row 3: 2020
The first sub-row of Row 3 consists of the following data: ALC; 163; 63; 5.2%
The second sub-row of Row 3 consists of the following data: DRUG; 7; 4; 0.9%
Row 4: 2021
The first sub-row of Row 4 consists of the following data: ALC; 160; 41; 3.2%
The second sub-row of Row 4 consists of the following data: DRUG; 7; 4; 1.0%
Row 5: 2022
The first sub-row of Row 5 consists of the following data: ALC; 138; 41; 3.3%
The second sub-row of Row 5 consists of the following data: DRUG; 6; 2; 0.6%
Row 6: ALC; Total; 737; 227; 3.7%
Row 7: DRUG; Total; 34; 18; 0.9%

Long Description.
The column headers of the table are Year, Flag, Projected Under-Reported Rate from Method Development (WI), and Projected Under-Reported Rate from Case Study (WI). The data given in the table row-wise are as follows: Row 1: 2022, ALC, 7.7 percent, 3.3 percent. Row 2: 2022, DRUG, 1.5 percent, 0.6 percent. Row 3: 2022, D I S T, 6.8 percent, 3.7 percent.
narratives: an arbitrary threshold value is needed for classification, and a careful interpretation of the results is necessary. Increasing the percentage of reports that are manually reviewed will increase the workload required for this method but will also increase the confidence of the projected underreported rate.
6.2 Text Classification Method for Distracted Driving
The text classification method was also used with Wisconsin crash data and narratives to look at distracted driving. Data were used from the years 2019–22. In 2018, the state added new data elements to the database to help separate distracted driving from inattentive driving. The implementation was rolled out gradually as law enforcement agencies upgraded their computer systems. Therefore, the database was not complete during that transitional time, so 2018 data were not included. Distracted driving was defined by crash reports indicating whether a crash involved distracted or inattentive driving (Y/N). Crash statistics are shown in Table 26.
6.2.1 Model Training–Distraction
Three years of crash data (2019–21) were used to train the distraction model, with narratives with a length less than 20 characters being discarded. Sixty unigrams and 350 bigrams were selected based on a 0.8 cutoff probability value and used to calculate the classification score for distraction-affected crashes. Examples of top unigrams and bigrams for distracted driving included inattentive, distracted, radio, cell, phone, inattentive driving, looked down, not paying attention, cell phone, and eyes off.
6.2.2 Model Testing and Validation–Distraction
All 4 years of crash data (2019–22) were then used to feed the trained model to identify misreported or underreported distracted driving–related crashes. The model testing results then went through manual validation, with 20 percent of the predicted crashes randomly selected. The manual review focused on determining whether distracted driving was involved based on specific narrative language, mainly including:
- Driver was using or seen holding a cell phone,
- Texting or typing while driving,

Long Description.
The column headers of the table are Year, FLAG, YES, NO, and Total Crashes. The data given in the table row-wise are Row 1: 2019, DIST, 17,107, 128,181, 145,288. Row 2: 2020, DIST, 14,051, 100,646, 114,697. Row 3: 2021, DIST, 15,927, 112,369, 128,296. Row 4: 2022, DIST, 15,243, 113,587, 128,830.
- Adjusting GPS or infotainment systems,
- Looking away from the road (e.g., at a passenger, pet, or object inside the vehicle),
- Reaching for items within the vehicle,
- Eating or drinking while driving,
- Engaging in grooming or personal care activities (e.g., applying makeup),
- Descriptions indicating the driver was not paying attention or was inattentive at the time of the crash, and
- Witness or officer statements confirming distraction as a contributing factor.
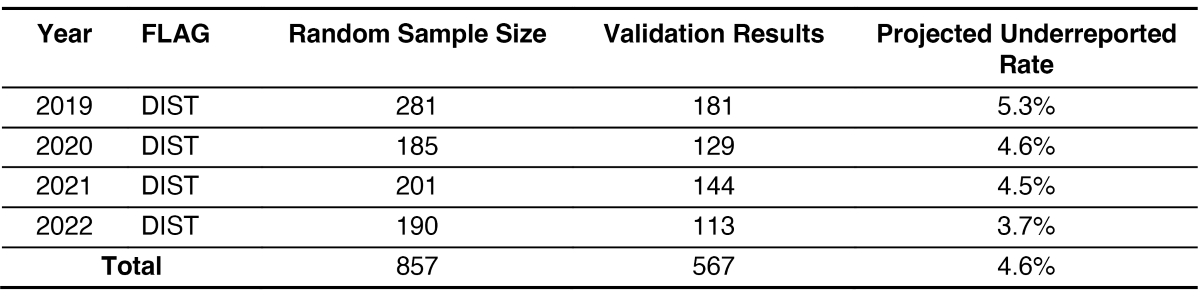
The results for distracted driving in Wisconsin are shown in Table 27.
Again, it is important to note the difference in the projected underreported rate for Wisconsin distracted driving when compared with the results in Chapter 5.
6.3 Linked Hospital Data Method for Alcohol-Impaired Driving
The Wisconsin case study uses linked hospital data from 2019–23. The following is a summary of the results.
6.3.1 2019 Linked Hospital Data
The data set included 20,871 linked person-level records, with 14,742 flagged as the driver in the crash data. Of those drivers, 1,257 were suspected of alcohol use by law enforcement. One hundred fifteen of the linked crash records can be considered underreported because the alcohol flag in the crash data was “No,” but the linked hospital records included ICD-10-CM codes for alcohol, as previously defined. The 2019 results are shown in Table 28.
6.3.2 2020 Linked Hospital Data
The data set included 16,832 linked person-level records, with 12,002 flagged as the driver in the crash data. Of those drivers, 1,099 were suspected of alcohol use by law enforcement. One hundred forty-nine of the linked crash records can be considered as underreported because
Long Description.
The column headers of the table are Year, FLAG, Random Sample Size,Validation Results, and Projected Under-reported Rate. The data given in the table row-wise are Row 1: 2019, DIST, 281, 181, 5.3 percent. Row 2: 2020, DIST, 185, 129, 4.6 percent. Row 3: 2021, DIST, 201, 144, 4.5 percent. Row 4: 2022, DIST, 190, 113, 3.7 percent. In Row 5, the first and second columns are combined to indicate the Total. The data given in Row 5 is as follows: Total: 857, 567, 4.6 percent.

Long Description.
The column headers of the table are Suspects Alcohol Use (Yes or No), ICD-10-C M Alcohol Codes, and No Alcohol Codes. The data given in the table row-wise are as follows: Row 1: Suspects Alcohol Use – Yes (Crash Data), 343, 914. Row 2: Suspects Alcohol Use – No (Crash Data), 115, 13,370.
the alcohol flag in the crash data was “No”; however, the linked hospital records included ICD-10-CM codes for alcohol, as previously defined. The 2020 results are shown in Table 29.
6.3.3 2021 Linked Hospital Data
The data set included 18,027 linked person-level records, with 12,813 flagged as the driver in the crash data. Of those drivers, 1,071 were suspected of alcohol use by law enforcement. One hundred thirty-seven of the linked crash records can be considered as underreported because the alcohol flag in the crash data was “No” but the linked hospital records included ICD-10-CM codes for alcohol, as previously defined. The Wisconsin 2021 results are shown in Table 30.
6.3.4 2022 Linked Hospital Data
The data set included 16,910 linked person-level records, with 12,155 flagged as the driver in the crash data. Of those drivers, 1,027 were suspected of alcohol use by law enforcement. One hundred seventeen of the linked crash records can be considered as underreported because the alcohol flag in the crash data was “No,” but the linked hospital records included ICD-10-CM codes for alcohol, as previously defined. The 2022 results are shown in Table 31.
6.3.5 2023 Linked Hospital Data
The data set included 22,545 linked persons level records, with 16,136 flagged as the driver in the crash data. Of those drivers, 1,329 were suspected of alcohol use by law enforcement. One hundred fifty-four of the linked crash records can be considered as underreported because the alcohol flag in the crash data was “No,” but the linked hospital records included ICD-10-CM codes for alcohol, as previously defined. The 2023 results are shown in Table 32.

Long Description.
The column headers of the table are Suspects Alcohol Use (Yes or No), ICD-10-CM Alcohol Codes, and No Alcohol Codes. The data given in the table row-wise are as follows: Row 1: Suspects Alcohol Use – Yes (Crash Data), 432, 667. Row 2: Suspects Alcohol Use – No (Crash Data), 149, 10,514.

Note: The Suspects Alcohol field was missing or unknown for 218 crash reports.
Long Description.
The column headers of the table are Suspects Alcohol Use (Yes or No), ICD-10-CM Alcohol Codes, and No Alcohol Codes. The data given in the table row-wise are as follows: Row 1: Suspects Alcohol Use – Yes (Crash Data), 424, 647. Row 2: Suspects Alcohol Use – No (Crash Data), 137, 11,387.

Note: The Suspects Alcohol field was missing or unknown for 222 crash reports.
Long Description.
The column headers of the table are Suspects Alcohol Use (Yes or No), ICD-10-CM Alcohol Codes, and No Alcohol Codes. The data given in the table row-wise are as follows: Row 1: Suspects Alcohol Use – Yes (Crash Data), 409, 618. Row 2: Suspects Alcohol Use – No (Crash Data), 117, 10,789.

Note: The Suspects Alcohol field was missing or unknown for 222 crash reports.
Long Description.
The column headers of the table are Suspects Alcohol Use (Yes or no), ICD-10-CM Alcohol Codes, and No Alcohol Codes. The data given in the table row-wise are as follows: Row 1: Suspects Alcohol Use – Yes (Crash Data), 524, 805. Row 2: Suspects Alcohol Use – No (Crash Data), 154, 14,354.
6.3.6 Exploratory Analysis of Misreported Alcohol Crashes Using Linked Hospital Data
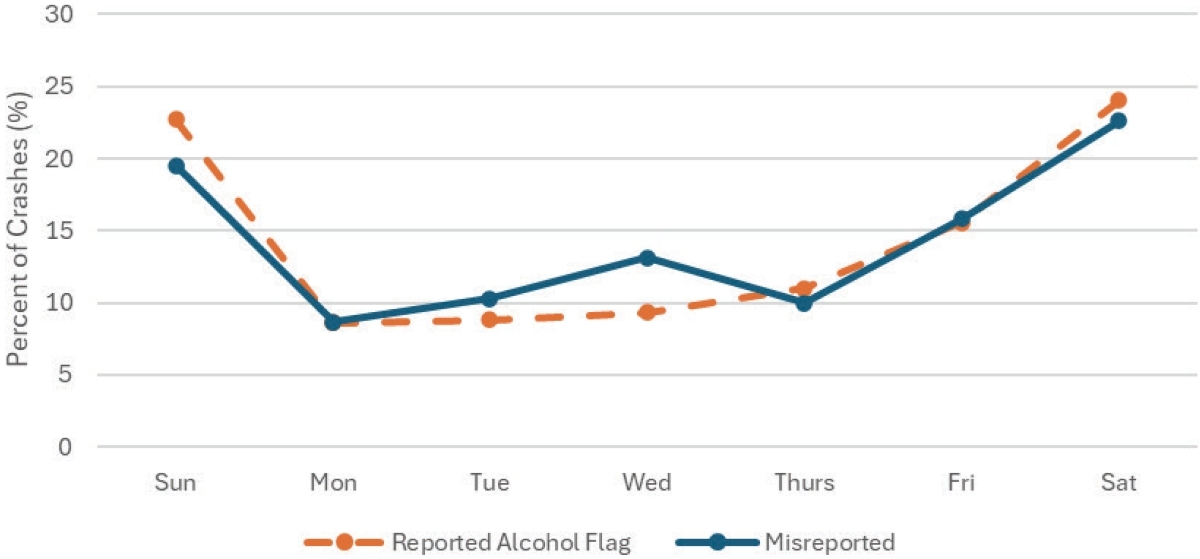
Figure 27 shows the misreported crashes from 2019–23 along with linked crashes flagged “Yes” for alcohol by day of week. The points on the graph where the misreported line is above the reported alcohol flag line are factors where misreporting is more likely, and the misreported to reported ratio will be above 1. Tuesday and Wednesday have a ratio of 1.17 and 1.41, respectively.
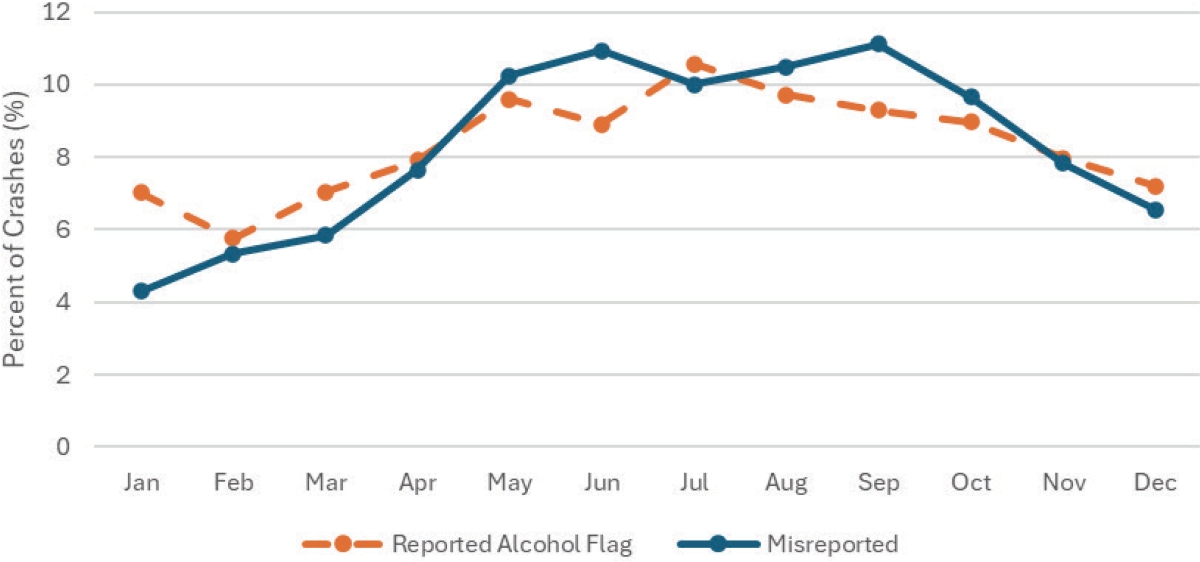
Figure 28 looks at crashes by month. From the graph the misreported to reported ratio is highest during June through September, with the highest ratios during June (1.23) and September (1.20).
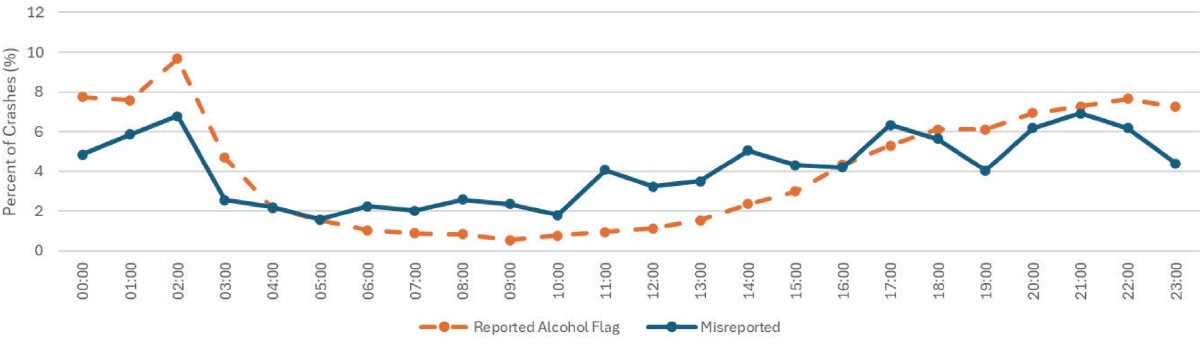
Figure 29 looks at crashes based on time of day. The misreported to reported ratio is highest during daylight between the hours of 6:00 a.m. and 6:00 p.m.
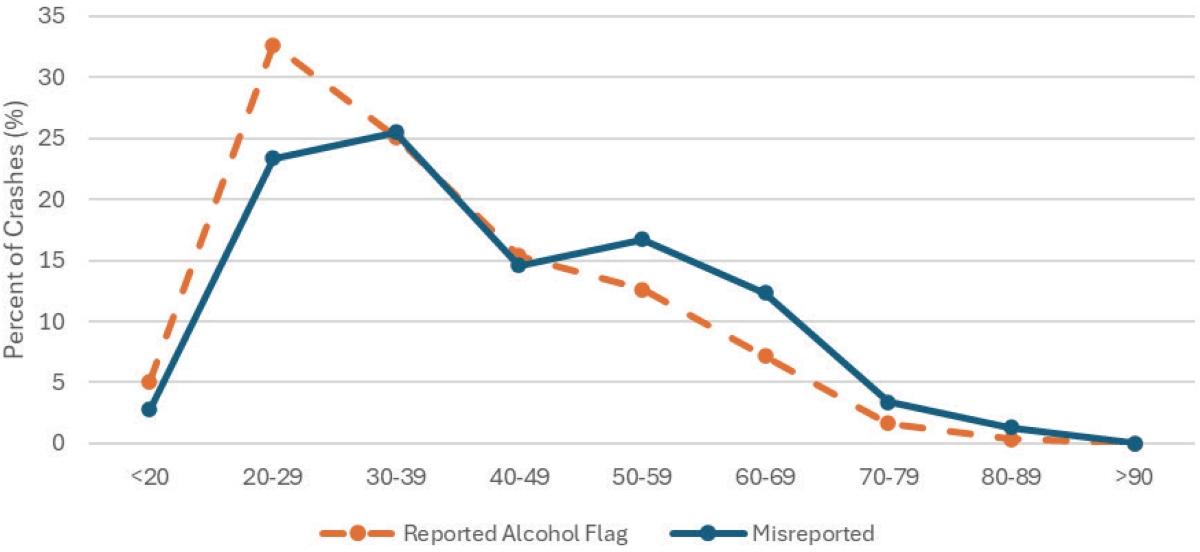
Figure 30 looks at driver age, with the misreported to reported ratio being highest in older driver populations. The ratio was 1.33 in drivers 50–59, 1.72 in drivers 60–69, 2.06 in drivers 70–79, and 3.85 in drivers 80–89.
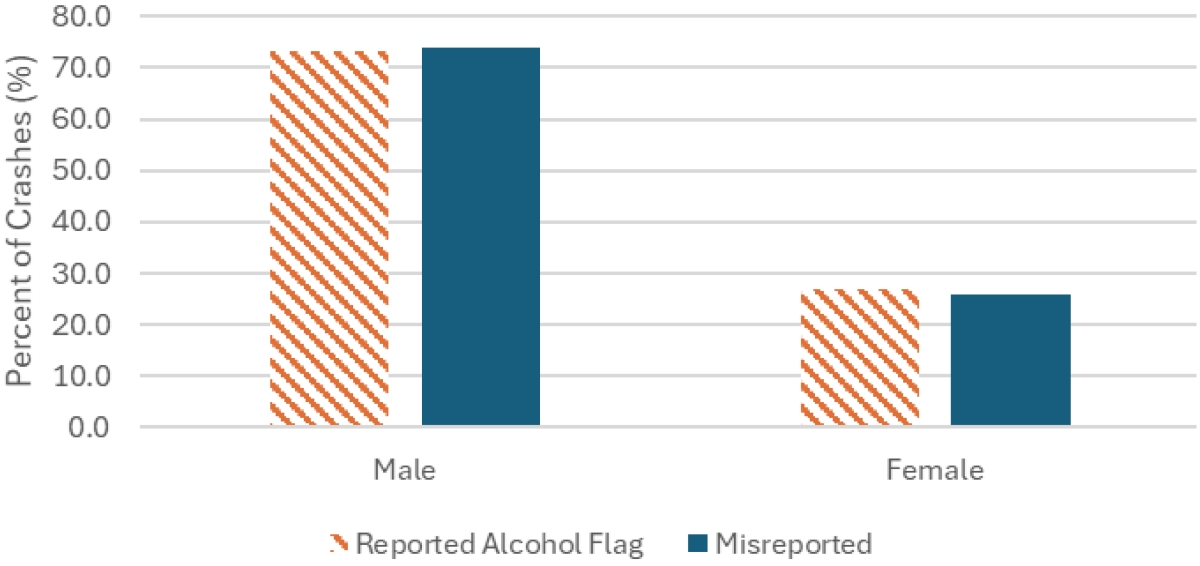
Figure 31 shows crashes by driver sex, and the misreported to reported ratio is near 1 for both male and female drivers. Crash factors where the ratio is at 1 for all choices implies that this is not playing a significant role in misreporting.
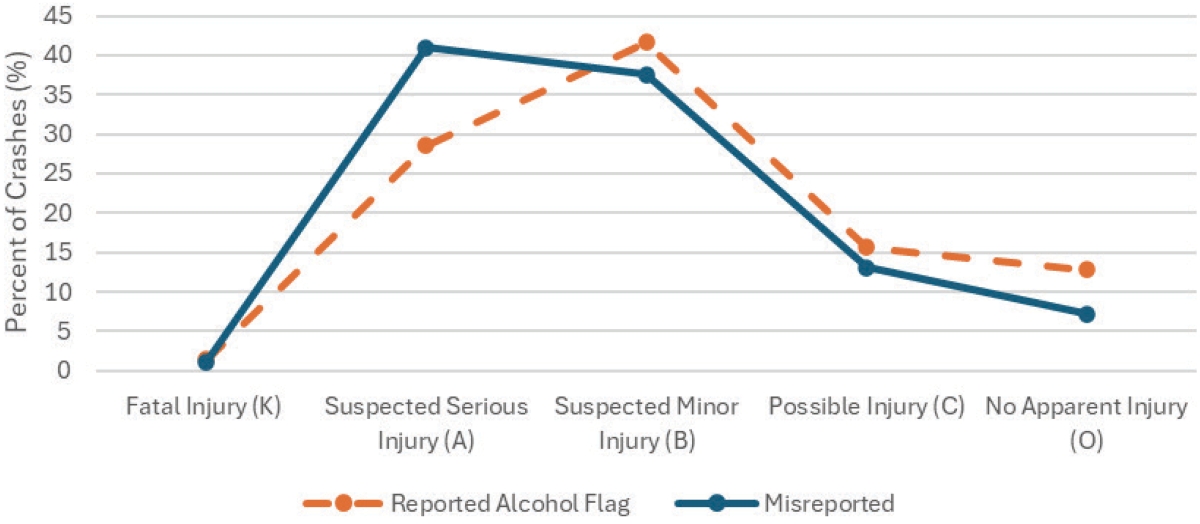
Figure 32 shows misreporting based on the KABCO injury severity scale. The misreported to reported ratio was only above 1 (1.44) for suspected serious injury.
Long Description.
The line graph is titled ‘2019 to 2023 alcohol crashes by day of week.’ The y-axis represents the percent of crashes, ranging from 0 to 30 percent in increments of 5. The x-axis lists days from Sunday to Saturday. Two lines compare data: one dotted line for reported alcohol flags and a solid line for misreported cases. Both lines show a decrease from Sunday to Monday at 23 percent and 20 percent to 4 percent in reported alcohol flag and misreported, with a gradual increase toward Saturday at 24 percent and 23 percent in reported alcohol flag and misreported from Thursday at 9 percent and 10 percent in reported alcohol flag and misreported, indicating higher crash percentages on weekends.
Long Description.
The line graph is titled “2019 to 2023 alcohol crashes by month.” The x-axis represents months from January to December, while the y-axis shows the percent of crashes ranging from 0 to 12 percent in increments of 2. Two lines compare “Reported Alcohol Flag” (dotted line) and “Misreported” (solid line) data. The “Reported Alcohol Flag” line peaks in July at around 10 percent, while the “Misreported” line shows a similar trend but with slight variations. Both lines start in January, misreported rising to a peak in mid-year at 11 percent, and reported alcohol flag declines at 9 percent, and decline towards December at 7 percent and 6.5 percent in reported alcohol flag and misreported.
Long Description.
The graph is titled ‘2019 to 2023 alcohol crashes by time of day.’ The x-axis represents time from 00:00 to 23:00 in increments of 1, while the y-axis shows the percent of crashes, ranging from 0 to 12 percent in increments of 2. Two lines depict trends: a dotted line for the reported alcohol flag and a solid line for misreported data. Reported alcohol flag and misreported start at 8 percent and 5 percent around 00.00. Peaks occur around 02:00 and 22:00 at 10 percent and 7 percent in reported alcohol flag and misreported, with a notable dip between 06:00 and 08:00 at 1 percent and 2 percent in reported alcohol flag and misreported. The graph highlights discrepancies in reporting throughout the day.
Long Description.
The line graph is titled ‘2019 to 2023 alcohol crashes by driver age.’ The x-axis represents age groups, ranging from less than 20 to over 90, while the y-axis shows the percent of crashes, from 0 to 35 percent in increments of 5. Two lines compare ‘Reported Alcohol Flag’ (dotted lines) and ‘Misreported’ (solid lines) cases. Reported alcohol flag and misreported start at less than 20 age groups, around 5 percent and 3 percent. The ‘Reported Alcohol Flag’ line peaks at the 20 to 29 age group around 33 percent, then declines steadily. The ‘Misreported’ line shows a similar trend but with lower percentages, peaking at 30-39 age group around 25 percent. Both lines decrease significantly at more than 90 years of age.
Long Description.
The bar chart is titled ‘2019 to 2023 alcohol crashes by driver sex.’ The x-axis represents driver sex with categories ‘Male’ and ‘Female.’ The y-axis shows the percent of crashes, ranging from 0.0 to 80.0 percent in increments of 10. For males, the reported alcohol flag is approximately 70 percent, while misreported cases are around 72 percent. For females, the reported alcohol flag is about 25 percent, with misreported cases near 24 percent. The chart highlights differences in reporting accuracy between male and female drivers.
Long Description.
The line graph is titled ‘2019 to 2023 alcohol crashes by injury severity.’ The x-axis lists injury types: Fatal Injury (K), Suspected Serious Injury (A), Suspected Minor Injury (B), Possible Injury (C), and No Apparent Injury (O). The y-axis represents the percent of crashes, ranging from 0 to 45 percent in increments of 5. Two lines compare data: a dotted line for the reported alcohol flag and a solid line for misreported data. Reported alcohol flag and misreported starts at fatal injury (K) at 0 percent. The graph shows a peak in suspected serious injury (A) at 40 percent for misreported, 30 percent for reported alcohol flag, and reported alcohol flag peaks at 42 percent in suspected minor injury (B) and misreported at 37 percent, with both lines declining towards no apparent injury at 14 percent and 6 percent in reported alcohol flag and misreported.
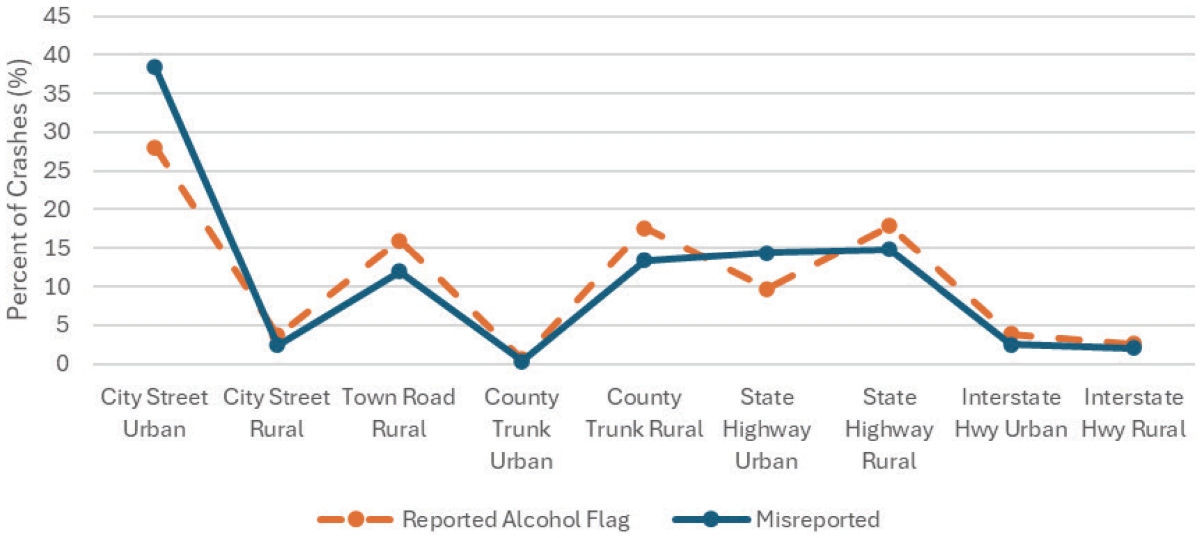
Figure 33 looks at crashes based on the highway class of the roadway where the crash occurred. The misreported to reported ratio was above 1 for two highway classes. City street urban was at 1.37, and state highway urban was at 1.48. Considering the agency type for the misreported crashes shows that 4.3 percent were reported by state patrol, 40.0 percent by sheriff offices, 55.1 percent by municipal police departments, and 0.2 percent by tribal police departments.
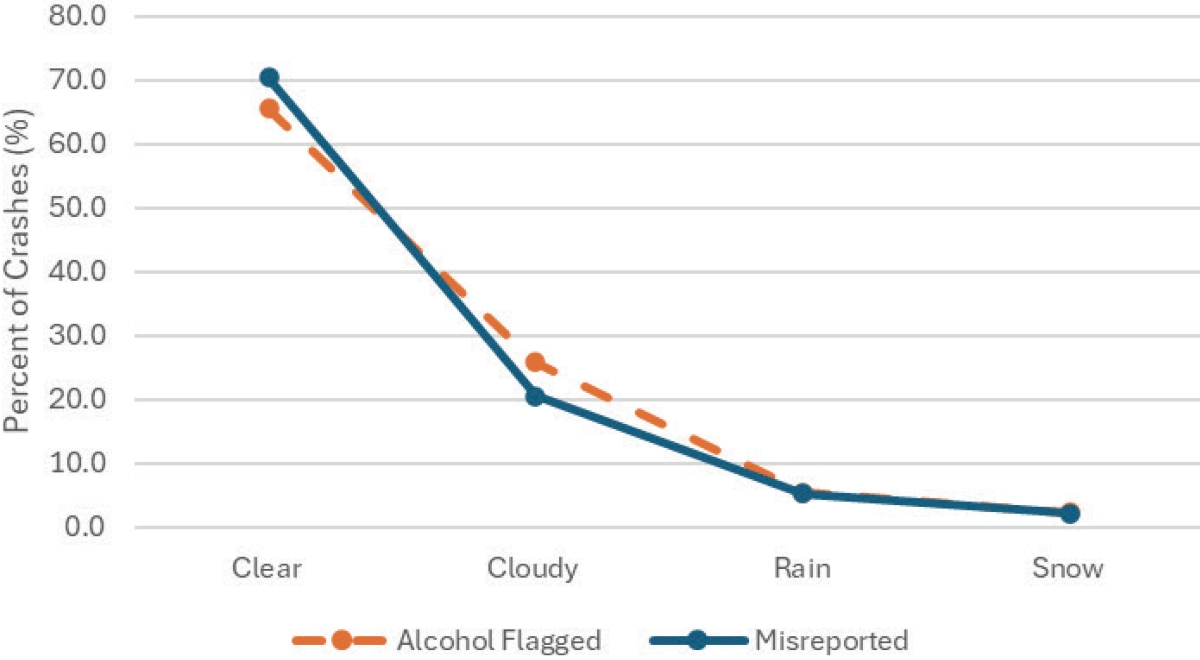
Figure 34 looks at the top four weather conditions for linked alcohol crashes: clear, cloudy, rain, and snow. The only weather condition in which the misreported to reported ratio was above 1 was clear (1.08).
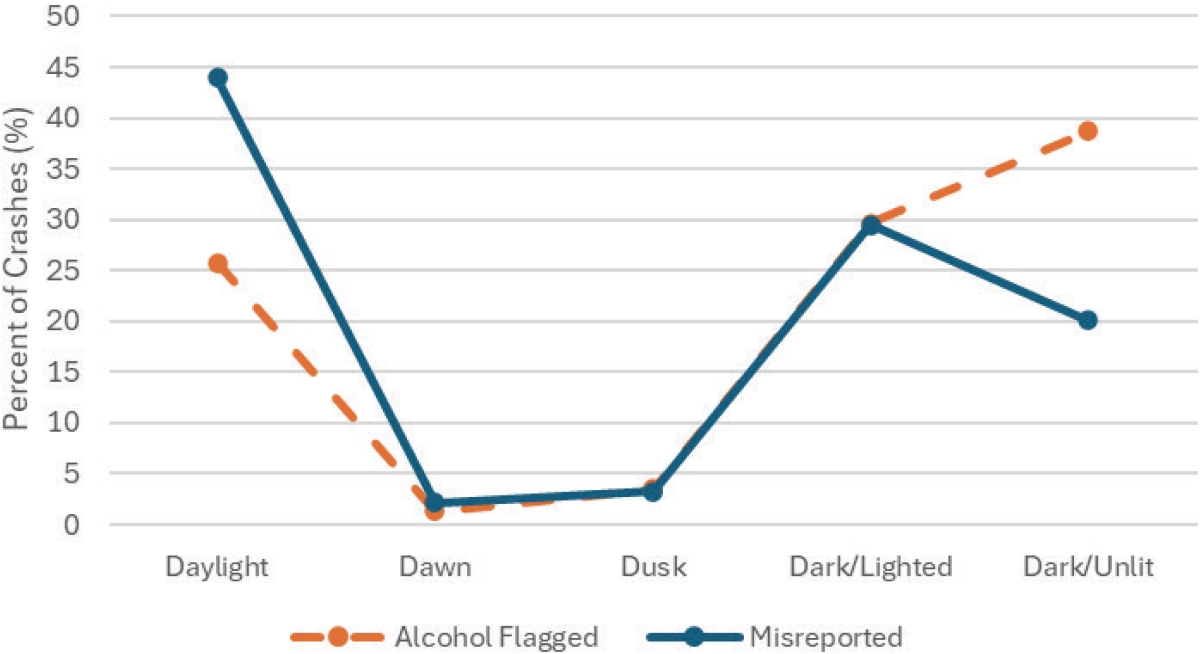
Lastly, Figure 35 shows crashes by lighting conditions at the time and locations of the crash. The field choices are daylight, dawn, dusk, dark/lighted, and dark/unlit. The misreported to reported ratio was above 1 for daylight (1.71) and dawn (1.64).
6.3.7 Linked Hospital Data Cost of Treatment
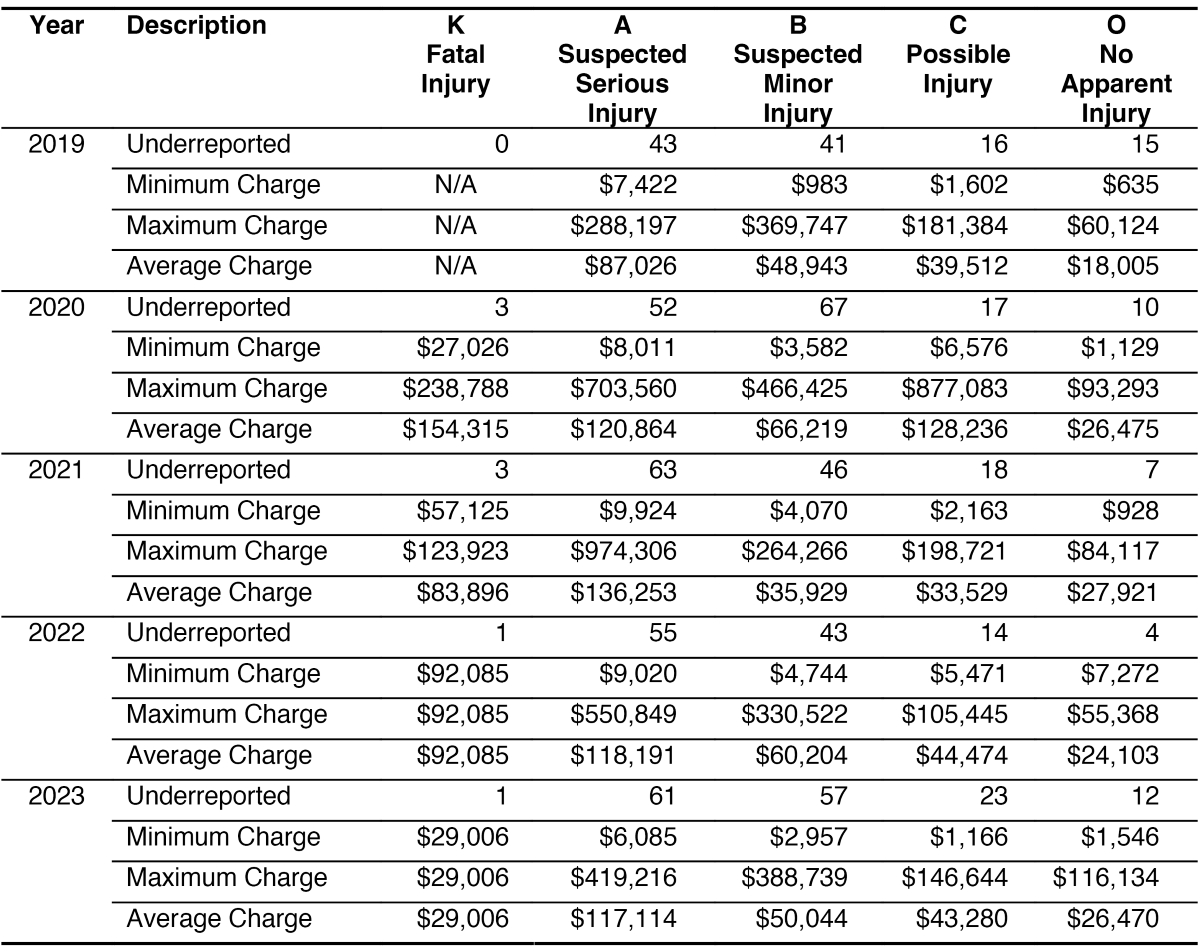
The linked Wisconsin hospital data used in the case study included total charges for length of stay. This field is reported as a single dollar amount and provides another way for agency staff and researchers to look at the post-crash treatment costs for crashes and, in this case, to examine identified underreported crashes. Table 33 shows the total charges based on injury severity as reported by law enforcement using the KABCO scale.
Long Description.
The graph is titled ‘2019 to 2023 alcohol crashes by highway class,’ with the percentage of crashes on the y-axis from 0 to 45 in increments of 5 and highway classes on the x-axis as City street urban, city street rural, town road rural, county trunk urban, county trunk rural, state highway urban, state highway rural, interstate highway urban, and interstate highway rural. It compares reported alcohol flag data, shown with a dotted line, and misreported data, shown with a solid line. Key points include a peak at for misreported at 39 percent for city street urban, which is at , 29 percent for reported alcohol flag. Both show a decline at 0 percent for county trunk urban, and a low at 3 percent for interstate highway rural for both. The data fluctuate across different highway classes, highlighting discrepancies between reported and misreported incidents.
Long Description.
The line graph is titled ‘2019 to 2023 alcohol crashes by weather condition.’ Categorized by weather conditions: clear, cloudy, rain, and snow in the x-axis. The y-axis represents the percent of crashes, ranging from 0.0 to 80.0 percent in increments of 10. Two lines are depicted: one for alcohol flagged crashes, shown with a dotted line, and another for misreported crashes, shown with a solid line. The graph shows a decrease in crash percentages from clear to snow conditions, with clear weather having the highest percentage of crashes at 70 percent for both, and snow the lowest at 0 percent for both. Cloudy weather conditions include 20 percent and 25 percent for the misreported and reported alcohol flag, and rain includes both at 5 percent.
Long Description.
The graph is titled ‘2019 to 2023 alcohol crashes by lighting condition.’ Lighting conditions: daylight, dawn, dusk, dark or lighted, and dark or unlit in the x-axis. The y-axis represents the percent of crashes, ranging from 0 to 50 percent in increments of 5. Two lines depict trends: a dotted line for alcohol flagged incidents and a solid line for misreported incidents. Daylight shows a high percentage of crashes for misreported incidents at 45 percent, while alcohol flagged incidents peak in dark or unlit conditions at 40 percent. Dawn and dusk have lower percentages for both categories at 0 percent and 4 percent. Alcohol flagged starts at 5 percent in daylight, 3 percent in dusk. Misreported at 5 percent in dusk, 20 percent in dark or unlit.
Long Description.
The column headers of the table are Year, Description, K: Fatal Injury, A: Suspected Serious Injury, B: Suspected Minor Injury, C: Possible Injury, and O: No Apparent Injury. The five rows in this table are each separated into four sub-rows.
The data given in the table row-wise are as follows:
Row 1: 2019
The first sub-row of Row 1 consists of the following data: Underreported; 0; 43; 41; 16; 15
The second sub-row of Row 1 consists of the following data: Minimum Charge; Not Applicable; $7,422; $983; $1,602; $635
The third sub-row of Row 1 consists of the following data: Maximum Charge; Not Applicable; $288,197; $369,747; $181,384; $60,124
The fourth sub-row of Row 1 consists of the following data: Average Charge; Not Applicable; $87,026; $48,943; $39,512; $18,005
Row 2: 2020
The first sub-row of Row 2 consists of the following data: Underreported; 3; 52; 67; 17; 10
The second sub-row of Row 2 consists of the following data: Minimum Charge; $27,026; $8,011; $3,582; $6,576; $1,129
The third sub-row of Row 2 consists of the following data: Maximum Charge; $238,788; $703,560; $466,425; $877,083; $93,293
The fourth sub-row of Row 2 consists of the following data: Average Charge; $154,315; $120,864; $66,219; $128,236; $26,475
Row 3: 2021
The first sub-row of Row 3 consists of the following data: Underreported; 3; 63; 46; 18; 7
The second sub-row of Row 3 consists of the following data: Minimum Charge; $57,125; $9,924; $4,070; $2,163; $928
The third sub-row of Row 3 consists of the following data: Maximum Charge; $123,923; $974,306; $264,266; $198,721; $84,117
The fourth sub-row of Row 3 consists of the following data: Average Charge; $83,896; $136,253; $35,929; $33,529; $27,921
Row 4: 2022
The first sub-row of Row 4 consists of the following data: Underreported; 1; 55; 43; 14; 4
The second sub-row of Row 4 consists of the following data: Minimum Charge; $92,085; $9,020; $4,744; $5,471; $7,272
The third sub-row of Row 4 consists of the following data: Maximum Charge; $92,085; $550,849; $330,522; $105,445; $55,368
The fourth sub-row of Row 4 consists of the following data: Average Charge; $92,085; $118,191; $60,204; $44,474; $24,103
Row 5: 2023
The first sub-row of Row 5 consists of the following data: Underreported; 1; 61; 57; 23; 12
The second sub-row of Row 5 consists of the following data: Minimum Charge; $29,006; $6,085; $2,957; $1,166; $1,546
The third sub-row of Row 5 consists of the following data: Maximum Charge; $29,006; $419,216; $388,739; $146,644; $116,134
The fourth sub-row of Row 5 consists of the following data: Average Charge; $29,006; $117,114; $50,044; $43,280; $26,470
6.3.8 Linked Toxicology Data Method for Alcohol-Impaired Driving
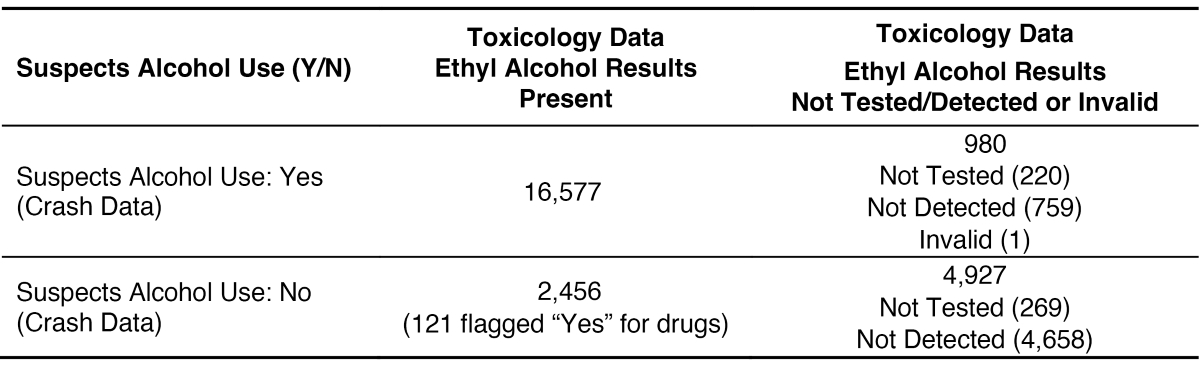
Wisconsin toxicology data were linked to Wisconsin crash reports. The results listed in Table 34 show an analysis of the data for alcohol-involved crashes. When looking at linked toxicology data, it is important to understand the testing policies of the testing center. The toxicology data came from the Wisconsin State Laboratory of Hygiene. The laboratory reports that testing may be limited on requests for comprehensive drug testing when alcohol concentration is in excess of 0.100 g/100 mL or a restricted controlled substance has been confirmed. Testing may be stopped in these situations when resources are limited and results are sufficient to support per se alcohol and drug charges.
Received toxicology data were from 2018–23, and 24,940 records were linked at the person level to Wisconsin crash data. Of those linkages, 17,557 were flagged “Yes” by law enforcement
Long Description.
The column headers of the table are Suspects Alcohol Use (Yes or No); Toxicology Data Ethyl Alcohol ( ETOH ) Results Present; and Toxicology Data ETOH Results Not Tested or Detected, or Invalid. The data given in the table row-wise are as follows: Row 1: Suspects Alcohol Use – Yes (Crash Data), 16,577, 980 Not Tested (220) Not Detected (759) Invalid (1). Row 2: Suspects Alcohol Use – No (Crash Data), 2,456 (121 flagged “Yes” for drugs), 4,927 Not Tested (269) Not Detected (4,658).
for alcohol, and 7,113 were flagged “Yes” by law enforcement for drugs (note that flagged reports for drugs are not shown in Table 34).
The 2,456 linked results that were “No” for suspected alcohol use on the crash data but had ethyl alcohol (EtOH) present in the toxicology results could be considered as preliminary underreported crashes. Of those, more than 2,200 had EtOH concentrations at or above 0.08 g/100 mL, so these were not just trace amounts of alcohol missed by law enforcement. A vast majority of the underreported crashes had alcohol levels at or above the legal limit in Wisconsin.
Regarding the 759 linked results that law enforcement flagged as “Yes” for alcohol but had EtOH results of “not detected,” these results could be considered overreporting for alcohol by law enforcement. Of those linked results, however, 573 did have a test result return with drugs present. These are cases in which law enforcement suspected impairment from alcohol, but, in fact, the impairment was from drugs. As a result, 186 results remain in which law enforcement suspected impairment from alcohol; however, the toxicology results showed that EtOH and drugs were not present. Understanding the testing policies of laboratories and which drugs were tested for is important before considering these 186 crashes as overreporting. Reviewing crash report narratives could give insight into why an officer flags a crash as alcohol involved. Misuse of OTC drugs or negative effects from prescribed drugs would potentially not be reported in toxicology results but may cause the impaired conditions observed by the reporting officer.
In summary, both methods identified potential cases of misreporting. For cases of misreporting, it is important to analyze these crashes for factors such as time of day, driver age, and crash location to further identify types of crashes more likely to be misreported by law enforcement. Agencies can then work with law enforcement through channels such as training, conferences, or quarterly newsletters to let police officers know what type of crashes are being misreported most often, with the goal of improving the crash reporting process.


