Strategies to Improve Reporting of Impaired and Distracted Driving in Motor Vehicle Crashes (2026)
Chapter: 5 Process to Verify the Accuracy of Reporting the Prevalence of Impaired and Distracted Driving in Motor Vehicle Crashes

CHAPTER 5
Process to Verify the Accuracy of Reporting the Prevalence of Impaired and Distracted Driving in Motor Vehicle Crashes
5.1 Introduction
The term crash misreporting refers to a variety of issues, including underreporting, overreporting, errors in crash data recording, and misclassification. This chapter describes the process of developing a text classification method and a direct linkage method to address misreporting in distracted driving and alcohol- and drug-involved crashes and evaluate the methodological strengths and weaknesses. The presumption is that certain crash types are documented in police crash reports but not properly flagged, making reports difficult to query. By using intelligent text-mining techniques to efficiently scan large numbers of crash narratives, crashes of certain types (i.e., distracted driving, alcohol involved, and drug involved) that are not flagged can be recovered; thus, the size of the misreporting problem can be estimated based on crash reports. The text classification method has two inherent challenges:
- The overreporting issue cannot be addressed because the crash flagged as a certain type is considered truthfully reported by a LEO.
- The number of crashes not reported by law enforcement remains unknown because the only data source applied in this study is reportable crashes.
5.2 Data Collection
Crash reports were acquired from the Wisconsin Department of Transportation (WisDOT) through the WisTransPortal data hub, including all crash narratives. Data were collected for the years 2019–22. Data fields DISTFLAG, ALCFLAG, and DRUGFLAG were used to query the reported distracted driving, alcohol-involved, and drug-involved crashes. According to the WisDOT DT4000 crash report user guide (TOPS Lab 2025), the flags represent the following:
- DISTFLAG: Indicates whether a crash involved distracting or inattentive driving (Y/N).
- ALCFLAG: Indicates whether law enforcement suspected that at least one driver or non-motorist involved in the crash had used alcohol. This includes both alcohol use under the legal limit and at or over the legal limit (Y/N/UNKN).
- DRUGFLAG: Indicates whether law enforcement suspected that at least one driver or non-motorist involved in the crash had used drugs (Y/N/UNKN).
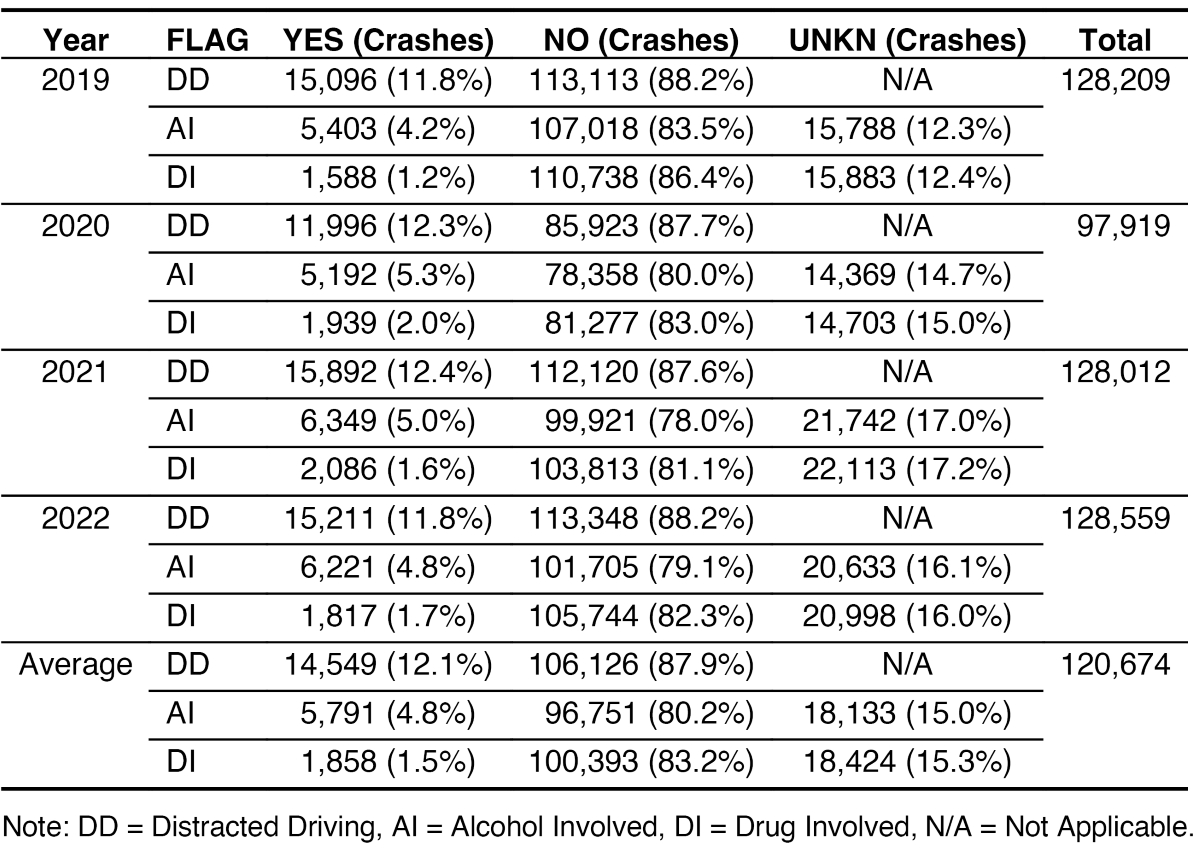
Table 6 presents the overall crash statistics after narratives were linked to the crash data. The total number of crashes is remarkably consistent throughout the years, except for 2020, when the international pandemic took place. The proportions of Yes or No for distracted driving, alcohol-involved, and drug-involved crashes are similar, with 2020 data included. Average
Long Description.
The column headers of the table are Year, FLAG, YES (Crashes), NO (Crashes), UNKN (Crashes), and Total. The five rows in the table are each separated into three sub-rows. The data given in the table row-wise are as follows:
Row 1: 2019
The first sub-row of Row 1 consists of the following data: DD; 15,096 (11.8%); 113,113 (88.2%); NA; 128,209
The second sub-row of Row 1 consists of the following data: AI; 5,403 (4.2%); 107,018 (83.5%); 15,788 (12.3%)
The third sub-row of Row 1 consists of the following data: DI; 1,588 (1.2%); 110,738 (86.4%); 15,883 (12.4%)
Row 2: 2020
The first sub-row of Row 2 consists of the following data: DD; 11,996 (12.3%); 85,923 (87.7%); NA; 97,919
The second sub-row of Row 2 consists of the following data: AI; 5,192 (5.3%); 78,358 (80.0%); 14,369 (14.7%)
The third sub-row of Row 2 consists of the following data: DI; 1,939 (2.0%); 81,277 (83.0%); 14,703 (15.0%)
Row 3: 2021
The first sub-row of Row 3 consists of the following data: DD; 15,892 (12.4%); 112,120 (87.6%); NA; 128,012
The second sub-row of Row 3 consists of the following data: AI; 6,349 (5.0%); 99,921 (78.0%); 21,742 (17.0%)
The third sub-row of Row 3 consists of the following data: DI; 2,086 (1.6%); 103,813 (81.1%); 22,113 (17.2%)
Row 4: 2022
The first sub-row of Row 4 consists of the following data: DD; 15,211 (11.8%); 113,348 (88.2%); NA; 128,559
The second sub-row of Row 4 consists of the following data: AI; 6,221 (4.8%); 101,705 (79.1%); 20,633 (16.1%)
The third sub-row of Row 4 consists of the following data: DI; 1,817 (1.7%); 105,744 (82.3%); 20,998 (16.0%)
Row 5: Average
The first sub-row of Row 5 consists of the following data: DD; 14,549 (12.1%); 106,126 (87.9%); NA; 120,674
The second sub-row of Row 5 consists of the following data: AI; 5,791 (4.8%); 96,751 (80.2%); 18,133 (15.0%)
The third sub-row of Row 5 consists of the following data: DI; 1,858 (1.5%); 100,393 (83.2%); 18,424 (15.3%)
The note below the table reads the following: Note: DD = Distracted Driving, AI = Alcohol Involved, DI = Drug Involved, N/A=Not Applicable.
percentages of flagged distracted driving, alcohol-involved, and drug-involved crashes from 2019–22 are 12.08 percent, 4.83 percent, and 1.63 percent, respectively.
5.3 Data Preparation
For the training data set, 3-year crash data, 2019 through 2021, were used. To exclude narratives without enough information, all narratives less than 20 characters in length were removed. Next, all the narratives valid for training were labeled as positive or negative based on the flags for each of the three crash types. Then, for the type of alcohol-involved and drug-involved crashes, all cases with UNKN (unknown) in the ALCFLAG and DRUGFLAG were discarded, as those could not be interpreted correctly. Table 7 shows the training data set statistics for distracted driving, alcohol-involved, and drug-involved crashes.
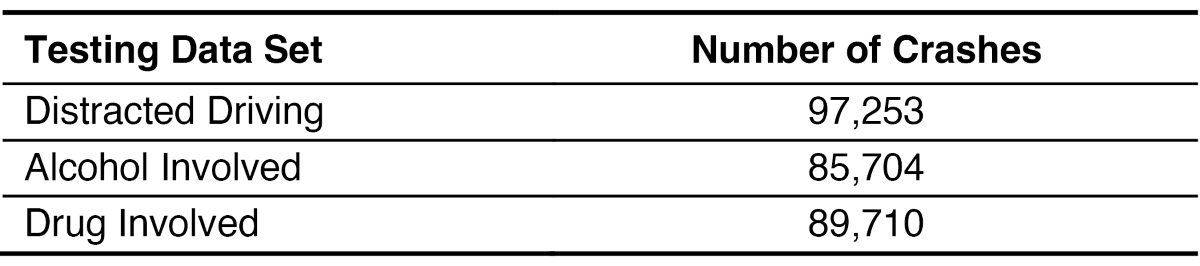
A similar approach was used for the test data set of 2022 crash data. The test data set included narratives not reported as distracted driving, alcohol-involved, or drug-involved crashes. Therefore, the test results could identify the underreported crashes for the year 2022. Table 8 shows the number of crash narratives used in testing data sets for each trained model.
5.4 Text-Mining Model Training
After data preparation, three NoisyOR probabilistic models were trained for distracted driving, alcohol-involved, and drug-involved crashes, respectively. This section investigates the intermediate output of the training data to examine the effectiveness of the trained models for identifying underreported crashes.

Long Description.
The column headers of the table are Training Data Set, Positive Case, Negative Case, and Total. The data given in the table row-wise are as follows: Row 1: Distracted Driving; 42,911 (14.1 percent); 260,974 (85.9 percent); 303,885. Row 2: Alcohol Involved; 16,832 (6.7 percent); 235,299 (93.3 percent); 252,131. Row 3: Drug Involved; 5,583 (2.2 percent); 245,753 (97.8 percent); 251,336.
Long Description.
The column headers of the table are Testing Data Set and Number of Crashes. The data given in the table row-wise are as follows: Row 1: Distracted Driving; 97,253. Row 2: Alcohol Involved; 85,704. Row 3: Drug Involved; 89,710.
5.4.1 Distracted Driving Crashes
After the distracted driving crash classifier model was trained, the training output provided the probability for unigrams and bigrams. The threshold value of 0.8 was selected as the best cutoff value for classification score to identify underreported crashes based on the evaluation metrics (i.e., F-score, precision, recall, and accuracy) of the model training.
Table 9 shows the top 25 unigrams and bigrams with their corresponding probability, positive count, and negative count.
According to Table 9, the top unigrams and bigrams, such as “distracted looking,” “texting,” and “coffee cup,” are related to driver distraction. This relation strongly supports the effectiveness of the trained model in identifying misclassified distracted driving crashes in the test data set.

Long Description.
The column headers of the table are Unigram, Probability, PosCount (NegCount), Bigram, Probability, PosCount (NegCount). The data given in the table row-wise are as follows: Row 1: swatting, 0.931, 26 (1), distracted looking, 0.9583, 45 (1). Row 2: attentively, 0.9091,19 (1), to texting, 0.9524, 39 (1). Row 3: Alexus, 0.8947, 16 (1), coffee cup, 0.9512, 38 (1). Row 4: jug, 0.8947, 16 (1), the task, 0.9512, 38 (1). Row 5: kell, 0.8824,14 (1), mobile phone ,0.9474, 53 (2). Row 6: song, 0.8718, 67 (9), radio when, 0.9468, 88 (4). Row 7: texting, 0.8709, 289 (42), away briefly, 0.9464, 52 (2). Row 8: tablet, 0.8696, 19 (2), looking off, 0.9444, 33 (1). Row 9: task, 0.8681, 78 (11), reached down, 0.9356, 304 (20). Row 10: manipulating, 0.8679, 91 (13), took eyes, 0.9355, 28 (1). Row 10: wasp, 0.8667, 12 (1), phone causing, 0.9333, 27 (1). Row 11: plugging, 0.8667, 12 (1), was manipulating, 0.9322, 54 (3). Row 12: plugging, 0.8667, 12 (1), was manipulating, 0.9322, 54 (3). Row 13: inattentively, 0.8592, 182 (29), texting while, 0.931, 80 (5). Row 14: sip, 0.8462, 10 (1), reach for, 0.9286, 77 (5). Row 15: seliger, 0.8462, 10 (1), song on, 0.9286, 25 (1). Row 16: matanich, 0.8462, 10 (1), his soda, 0.9259,24 (1). Row 17: inattentive, 0.844, 4,343, (802), phone just, 0.9259, 24 (1). Row 18: Bluetooth, 0.8333, 24 (4), swatting at, 0.9259, 24 (1). Row 19: Rhiannon, 0.8333, 9 (1), his radio, 0.9257, 186 (14). Row 20: daydreaming, 0.8333, 34 (6), texting on, 0.9242, 60 (4). Row 21: sacia, 0.8333, 9 (1), phone fell, 0.9211, 34 (2). Row 22: Niko, 0.8333, 9 (1), radio and, 0.9192, 329 (28). Row 23: stereo, 0.8333, 29 (5), became distracted, 0.9186, 281 (24). Row 24: swat, 0.8333, 19 (3), a song, 0.9143, 31 (2). Row 25: Ruesch, 0.8333, 9 (1), his mobile, 0.9143, 31 (2).
5.4.2 Alcohol-Involved Crashes
Similarly, the training output of the alcohol-involved crash classifier model provided the probability for unigrams and bigrams. According to the evaluation metrics (i.e., F-score, precision, recall, and accuracy) of the model training, 0.8 was selected as the best cutoff value for classification score to identify underreported alcohol-involved crashes. Table 10 shows the top 25 unigrams and bigrams with their corresponding probability, positive count, and negative count.
According to the word probability scores in Table 10, the top unigrams and bigrams, such as “intoximeter,” “to drinking,” “intoxicating beverages,” and “alcoholic,” are highly related to alcohol involvement. This relation strongly supports the finding that the trained model can be effectively used to identify misclassified alcohol-involved crashes.
5.4.3 Drug-Involved Crashes
Lastly, the training output of the drug-involved crash classifier model provided the probability for unigrams and bigrams. According to the evaluation metrics (i.e., F-score, precision, recall, and accuracy) of the model training, 0.7 was selected as the best cutoff value for classification score to identify underreported drug-involved crashes. Table 11 shows the top 25 unigrams and bigrams with their corresponding probability, positive count, and negative count.

Long Description.
The column headers of the table are Unigram, Probability, PosCount (NegCount), Bigram, Probability, PosCount (NegCount). The data given in the table row-wise are as follows: Row 1: pac, 0.9742, 188 (4), to drinking, 0.9746, 345 (80). Row 2: intoximeter, 0.9623, 50 (1), intoxicating beverages, 0.9726, 70 (1). Row 3: intoxicating, 0.9618, 125 (4), pac 1st, 0.9636, 52 (1). Row 4: glassy, 0.9474, 125 (6), intoxicated 1st, 0.9538, 61 (2). Row 5: beverages, 0.9415, 176 (10), an intoxicating, 0.9535, 40 (1). Row 6: glossy, 0.9245, 48 (3), to consuming, 0.9481, 273 (14). Row 7: vodka, 0.9231, 35 (2), an alcoholic, 0.9474, 35 (1). Row 8: consuming, 0.9091, 339 (33), s breath, 0.9444, 33 (1). Row 9: alcoholic, 0.9043, 188 (19), failed s f s t, 0.9444, 33 (1). Row 10: bloodshot, 0.9032, 83 (8), intoxicating beverage, 0.9444, 50 (2). Row 11: Moises, 0.8947, 16 (1), consuming alcohol, 0.9412, 175 (10). Row 12: bac, 0.8933, 66 (7), eyes slurred, 0.9412, 31 (1). Row 13: beers, 0.8919, 131 (15), intoxicated on, 0.9412, 31 (1). Row 14: exercises, 0.8889, 23 (2), alcohol prior, 0.9388, 91 (5). Row 15: intoxicated, 0.8779, 1,272 (176), was intoxicated, 0.9359, 262 (17). Row 16: intoxicants, 0.8663, 511 (78), glassy eyes, 0.9359, 72 (4). Row 17: drinks, 0.8636, 75 (11), glossy eyes, 0.9355, 28 (1). Row 18: slurried, 0.8571, 11 (1), alcohol concentration, 0.9348, 42 (2). Row 19: Boyer, 0.8571, 11 (1), drinking alcohol, 9304, 106 (7). Row 20: breath, 0.8551, 365 (61), of intox, 0.9286, 25 (1). Row 21: omvwi, 0.8550, 223 (37), intoxicated and, 0.9240, 315 (25). Row 22: slempkes, 0.8462, 10 (1), intoxicants and, 0.9231, 83 (6). Row 23: owi, 0.8440, 3,781 (698), performed sfsts, 0.9231, 23 (1). Row 24: intoxicant, 0.8427, 240 (44), intoxicated see, 0.9231, 35 (2). Row 25: karras 0.8333, 9 (1), open beer, 0.9231, 23 (1).

Long Description.
The column headers of the table are Unigram, Probability, PosCount (NegCount, Bigram, Probability, PosCount (NegCount). The data given in the table row-wise are as follows: Row 1: heroin, 0.9636, 52 (1), controlled substance, 0.9467, 70 (3). Row 2: Narcan, 0.9459, 34 (1), to smoking, 0.9348, 42 (2). Row 3: methamphetamine, 0.9118, 30 (2), restricted controlled, 0.9333, 27 (1). Row 4: narcotic, 0.8947, 16 (1), smoking marijuana, 0.9138, 52 (4). Row 5: meth 0.8824, 14 (1), marijuana prior, 0.8947, 16 (1). Row 6: povlich, 0.8571, 11 (1), of heroin, 0.8333, 9 (1). Row 7: karras, 0.8333, 9 (1), and marijuana, 0.8182, 8 (1). Row 8: dre, 0.8333, 19 (3), a restricted, 0.8095, 16 (3). Row 9: huffing, 0.7778, 6 (1), smoked marijuana, 0.7857, 10 (2). Row 10: ilias, 0.7778, 6 (1), paraphernalia was, 0.7857, 10 (2). Row 11: Thurber, 0.7333, 10 (3), substance unit, 0.7857, 10 (2). Row 12: recognition, 0.7273, 7 (2), had smoked, 0.7857, 10 (2). Row 13: smoked, 0.7143, 19 (7), drug para, 0.7778, 6 (1). Row 14: Hardyman, 0.7143, 4 (1), drug overdose, 0.7778, 6 (1). Row 15: 7802, 0.7143, 4 (1), possible drug, 0.7778, 6 (1). Row 16: inhalants, 0.7143, 4 (1), to drug, 0.7778, 6 (1). Row 17: Leighton, 0.7143, 4 (1), pin point, 0.7778, 6 (1). Row 18: 7606, 0.7143, 4 (1), marijuana use, 0.7778, 6 (1). Row 19: w d p d, 0.7143, 4 (1), substance and, 0.7368, 13 (4). Row 20: gabapentin 0.7143, 4 (1), t h c and, 0.7333, 21 (7). Row 21: Kathi, 0.7143, 4 (1), of controlled, 0.7333, 10 (3). Row 22: humbert, 0.7143, 4 (1), paraphernalia in, 0.7273, 7 (2). Row 23: t h c, 0.7069, 81 (33), a dre, 0.7273, 7 (2). Row 24: marijuana, 0.6815, 198 (92), 32 Ashland, 0.7143, 4 (1). Row 25: yeazle, 0.6667, 3 (1), drugs he, 0.7143, 4 (1).
Results in Table 11 show that the top unigrams and bigrams, such as “heroin,” “controlled substance,” and “smoking marijuana,” are highly related to drug involvement. This relation strongly supports the finding that the trained model can be effectively used to identify misclassified drug-involved crashes.
5.5 Model Testing and Result Analysis
All three trained models were tested using the test data sets prepared from 2022 crash data. This section includes an analysis of the test results and the process of finding the underreported crash rate for the three crash types.
5.5.1 Distracted Driving Crashes
Model test results found 1,096 crashes predicted as underreported for the year 2022. These were the crashes with a higher probability of being a distracted driving crash according to the best cutoff value of classification score. To verify the model prediction, a manual review was conducted by taking a random sample from those predicted underreported crashes. Among 329 random crashes (30 percent of the predicted crashes), 310 crashes were identified as distracted driving. Based on this random review, the total number of underreported distracted driving crashes for 2022 is estimated to be 1,033.
5.5.2 Alcohol-Involved Crashes
Similarly, 704 alcohol-involved crashes were predicted as underreported for the year 2022. These were the crashes with a higher probability of involving alcohol use according to the best cutoff value of classification score. To verify the model prediction, a manual review was conducted by taking a random sample from those predicted underreported crashes. Among 212 random crashes (30 percent of the predicted crashes), 145 crashes were confirmed as alcohol involved. Based on this random review, the total number of underreported alcohol-involved crashes for 2022 is estimated to be 482.
5.5.3 Drug-Involved Crashes
Lastly, for drug-involved crashes, 56 crashes were predicted to be underreported. A manual review of all those crash narratives revealed that 28 were found to be drug involved. Thus, the total number of underreported drug-involved crashes for 2022 is estimated to be 28.
5.5.4 Misreporting Rate
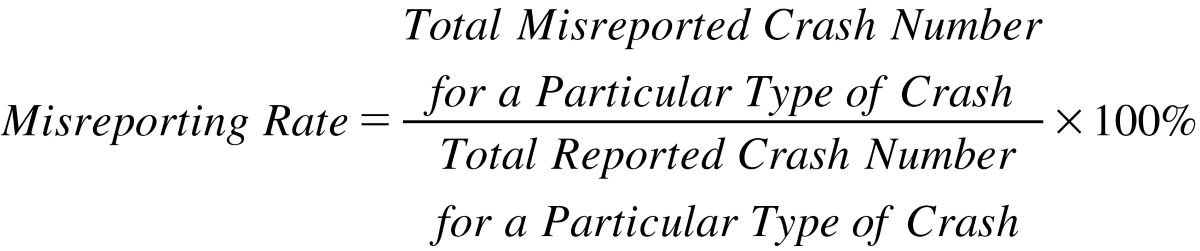
The misreporting rate is defined by Equation 1:
 (1)
(1)
The misreported rate is the percentage of crashes that should have been flagged for a certain type but were not. Based on 2022 reported crash data in Wisconsin,
- The total number of reported distracted driving crashes is 15,211 and an additional 1,033 crashes are likely to be affected by driver distraction but are not flagged, suggesting a misreporting rate (underreported) of 6.8 percent (1,033 ÷ 15,211) for distracted driving crashes.
- The total number of reported alcohol-involved crashes is 6,221, and possibly misreported alcohol-involved crashes are estimated to be 482, suggesting a 7.7 percent (482 ÷ 6,221) misreporting rate (underreported) for alcohol-involved crashes.
- The total number of reported drug-involved crashes is 1,817, and possibly misreported drug-involved crashes are estimated to be 28, suggesting a 1.5 percent (28 ÷ 1,817) misreporting rate (underreported) for drug-involved crashes.
5.6 Exploratory Analysis of Misreported Crashes
Exploratory data analysis was conducted to uncover patterns, or factors behind misreporting a particular type of crash. For distracted driving, alcohol-involved, and drug-involved crashes, an analysis of the factors associated with misreporting is reported in the next three sections.
5.6.1 Distracted Driving Crashes
Exploratory analysis was conducted on spatial and temporal information for a better understanding of the circumstances behind distracted driving crashes being misreported. To ensure an unbiased analysis, only those model-predicted distracted driving crashes confirmed as misreported after manual review were used. The following three figures show the distribution of reported distracted driving and misreported distracted driving crashes confirmed in this study by time of day, day of week, and month of year.
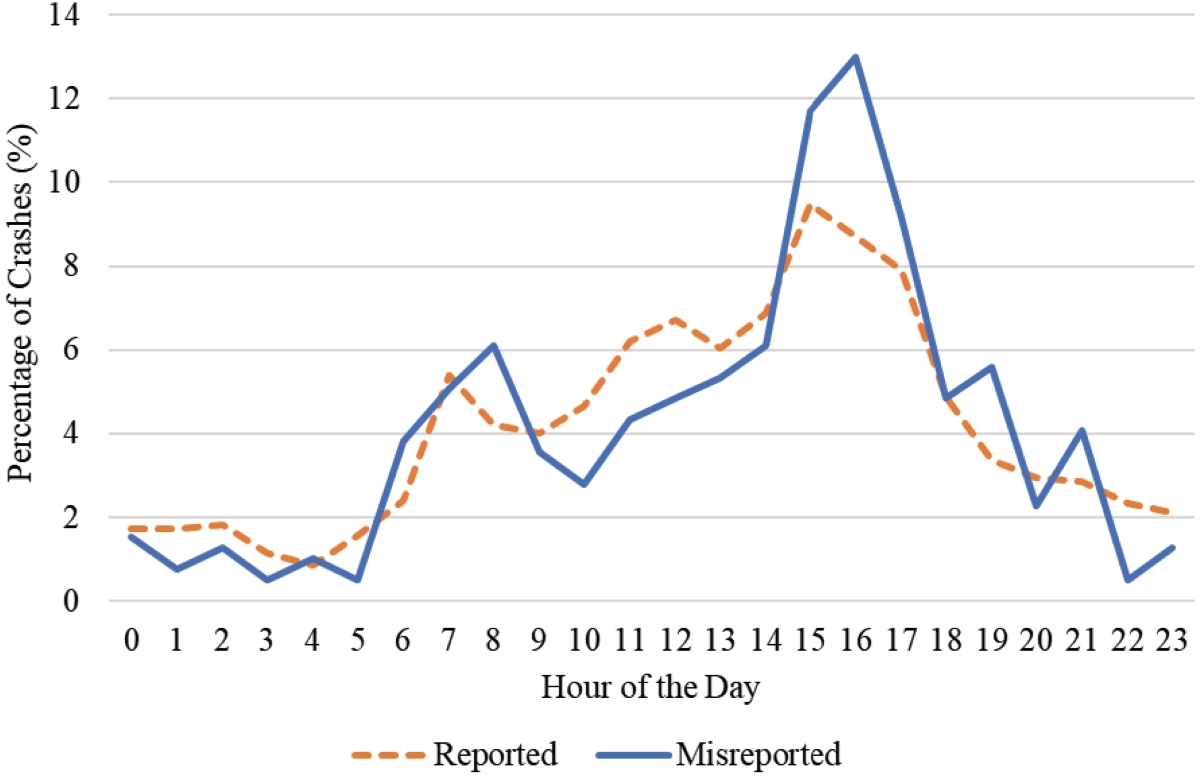
In 2022, 77.5 percent of all reported distracted driving crashes and 80.7 percent of the misreported distracted driving crashes identified in this study occurred during daylight hours from 6:00 a.m. to 6:00 p.m., as shown in Figure 7. Among daytime distracted driving crashes, a higher percentage of misreported cases occurred in the morning and afternoon peak hours. Also, the highest percentage of the reported distracted driving crashes occurred during the afternoon peak hour, from 4:00 p.m. to 5:00 p.m., when peak hour traffic is most often present.
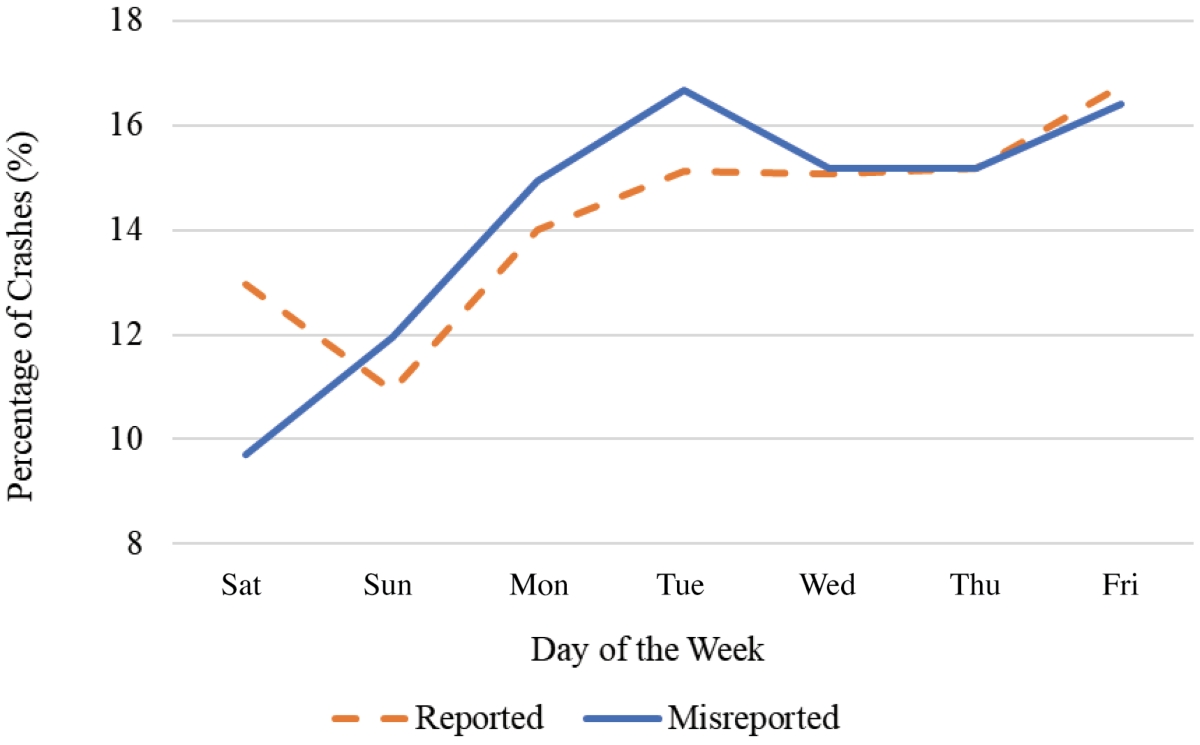
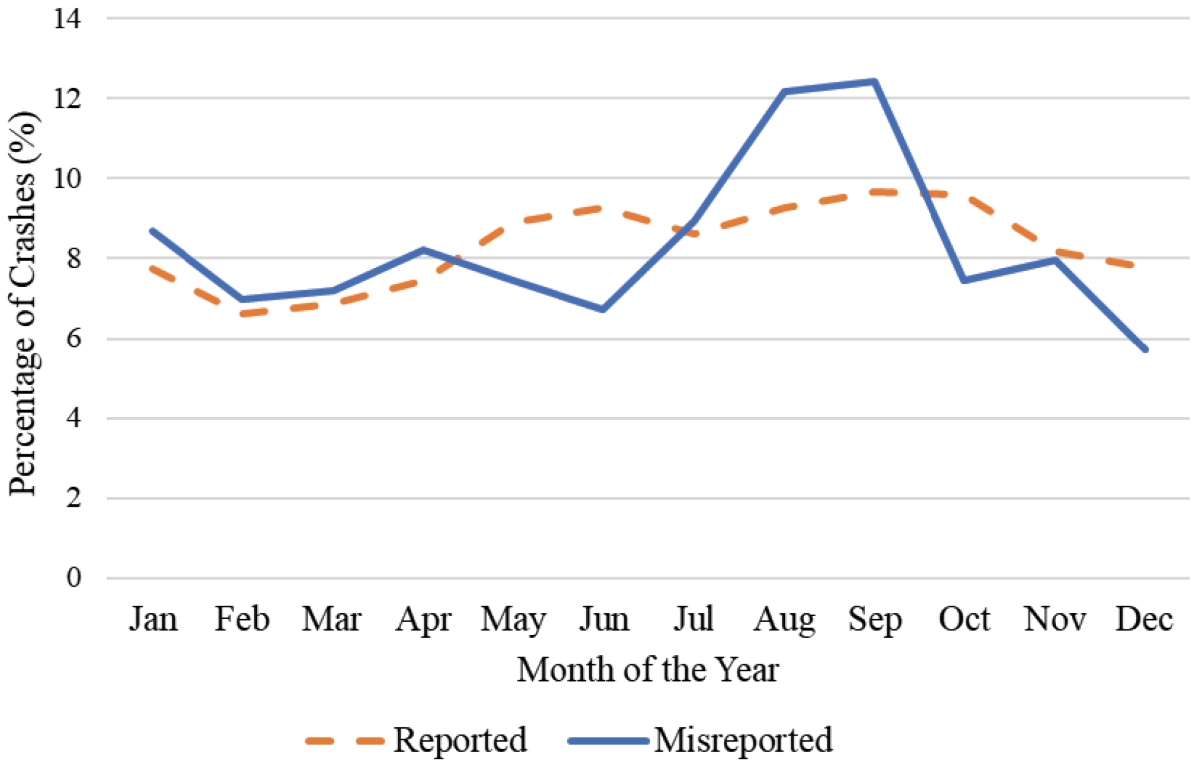
The day of week distribution suggests that the distracted driving crashes were misreported more during the weekdays, rather than on weekends (Saturday and Sunday), as shown in Figure 8. Both reported and misreported crashes follow similar trends with negligible differences. Figure 9 displays the monthly distribution of reported distracted driving crashes versus misreported distracted driving crashes, showing that a high percentage of misreported cases were observed in the summer, especially in July and August.
Long Description.
The graph illustrates the percentage of crashes reported and misreported throughout the day, from 0 to 23 hours in increments of 1 on the x-axis. The x-axis shows the hours of the day. The y-axis represents the percentage of crashes, ranging from 0 to 14 percent in increments of 2. The graph starts around 2 percent at 0 hours of the day for both reported and misreported. The reported crashes, depicted by a dotted line, show a gradual increase with a peak around 14:00 hours. The misreported crashes, shown by a solid line, peak sharply at 16:00 hours. Both lines indicate higher crash percentages in the afternoon compared to other times of the day. Both the lines decline at 2 percent at hour 23 of the day.
Long Description.
The line graph illustrates the percentage of crashes reported and misreported from Saturday to Friday. The y-axis represents the percentage of crashes, ranging from 8 to 18 percent in increments of 2. The x-axis lists the days of the week. The reported crashes, shown with a dotted line, start at 13 percent on Saturday, dip on Sunday, and rise steadily to 16 percent by Friday. The misreported crashes, shown with a solid line, start near 10 percent on Saturday, peak at 17 percent on Tuesday, and then slightly decrease to 15 percent before rising again towards Friday.
Long Description.
The line graph illustrates the percentage of crashes reported and misreported throughout the year. The x-axis represents the months from January to December, while the y-axis shows the percentage of crashes, ranging from 0 to 14 percent in increments of 2. The misreported data, shown with a solid line, starts at 9 percent in January, peaks in August and September at around 13 percent, and dips in February and December below 7 percent. The reported data, depicted with a dotted line, remain relatively steady, starting around 8 percent, fluctuating slightly around 8 to 10 percent throughout the year.
Figure 10 shows the distribution of misreported distracted driving crashes compared with reported distracted driving crashes by highway class. The evidence shows that most misreported distracted driving crashes occurred in urban areas, including urban city streets, and urban state highways. The interstate highway system, both urban and rural, has a higher ratio of misreported crashes to reported crashes (1.91 and 1.29, respectively). Urban state highways were found to have a misreported ratio of 1.23. Although urban city streets have the highest percentage of misreported crashes, the ratio of misreported to reported crashes in both urban and rural city streets is close to 1.
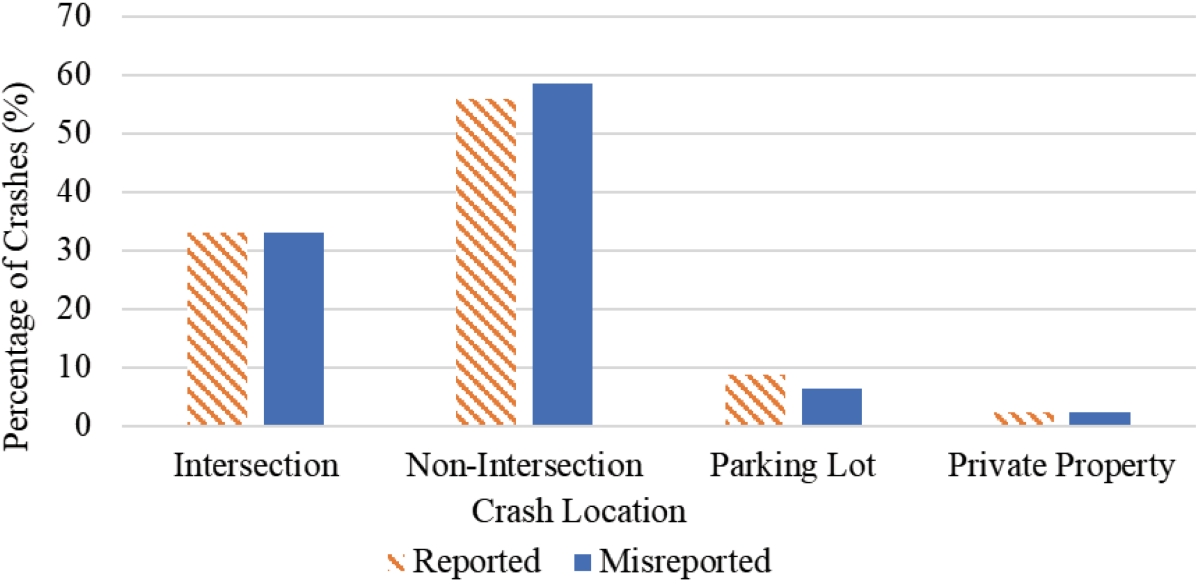
Figure 11 shows the distribution of misreported distracted driving crashes compared with reported distracted driving crashes by crash location, that is, the segment of the road where the crash occurred. Most of the misreporting took place at a non-intersection (58.5 percent), with a ratio of misreported to reported crashes higher than 1 (1.04).
Another important factor in proper reporting could be the effect of lighting conditions during the crash occurrence. Figure 12 shows the distribution of misreported distracted driving crashes compared with reported distracted driving crashes by lighting condition. One observation was similar to the findings in hourly trend observed in Figure 7, as most misreported crashes took

Long Description.
The vertical axis represents the percentage of crashes, ranging from 0 to 40 percent in increments of 10. The horizontal axis lists highway classes such as highway classes, including city streets, county trunks, interstates, and state highways, both in rural and urban settings. Reported crashes are shown with striped bars, while misreported crashes are shown with solid bars. City street urban has the highest reported crash percentage in reported and misreported, around 39 percent and 38 percent, while county trunk urban shows a significantly lower reported and misreported around 1 percent. City street rural has 7 percent in both, county trunk rural has 8 percent and 6 percent in reported and misreported, interstate highway rural has 2 percent in both, state highway rural has 15 percent in reported and 10 percent in misreported, town road rural has 8 percent in both, interstate highway urban has 5 percent and 8 percent in reported and misreported, and state highway urban has 17 percent and 20 percent in reported and misreported. Note that the bar values are approximate.
Long Description.
The bar chart illustrates the percentage of crashes reported and misreported at different locations. The y-axis represents the percentage of crashes, ranging from 0 to 70 percent in increments of 10. The x-axis categorizes crash locations into intersections, non-intersections, parking lots, and private properties. Reported crashes are shown with diagonal stripes, while misreported crashes are in solid bars. Non-intersection locations have the highest misreported percentage at almost 60 percent, while intersections have around 30 percent. Parking lots have around 10 percent, and private properties show a minimum of 2 percent for both reported and misreported crashes. Note that the bar values are approximate.

Long Description.
The bar chart illustrates the percentage of crashes categorized by lighting conditions: day, light, dark, dawn, and dusk. The y-axis represents the percentage of crashes, ranging from 0 to 70 percent in increments of 10. The x-axis lists the lighting conditions. The chart differentiates between reported and misreported crashes using distinct patterns. Daytime shows the highest, around 70 percent of crashes, while dawn and dusk have the lowest of 2 percent. Light and dark have around 15 percent for light and around 10 percent for dark for both reported and misreported. Note that the bar values are approximate.
place during daytime (70.4 percent) with a ratio of misreported to reported closer to 1. It is evident from Figure 12 that the ratio of misreported to reported crashes is closer to one in both dark (DARK) and lighted (LITE) driving conditions (1.05 and 1.02, respectively). Therefore, the analysis shows that the effect of lighting conditions on misreporting distracted driving crashes is negligible.
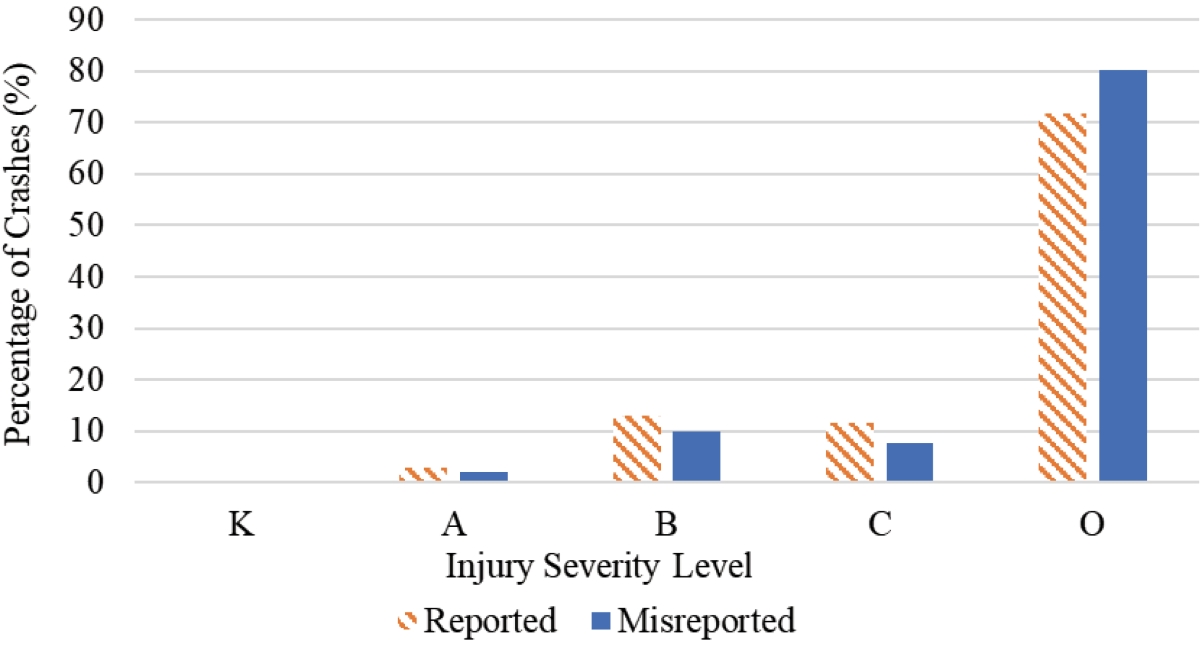
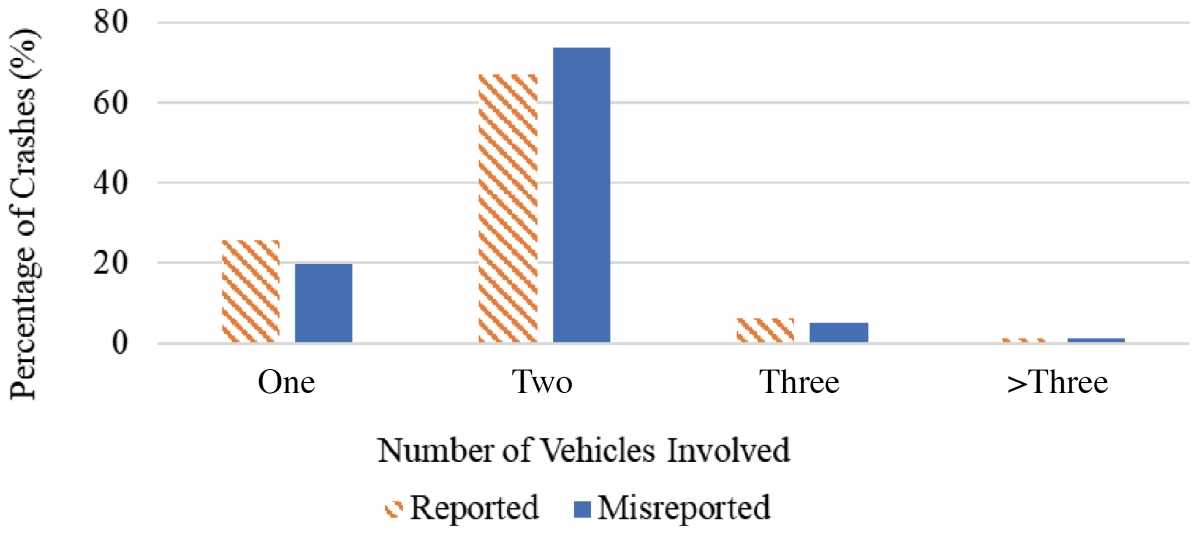
Comparisons were also conducted for two other structured data fields: injury severity and number of vehicles involved in a crash. Figure 13 shows the distribution of misreported distracted driving crashes compared with reported distracted driving crashes according to injury severity level from the FAA KABCO Scale. K is fatal injury, A is suspected serious injury, B is suspected minor injury, C is possible injury, and O is no apparent injury. Figure 14 shows the distribution of misreported distracted driving crashes compared with reported distracted driving crashes by number of vehicles involved. The results show similar distributions between all reported distracted driving crashes and misreported distracted driving crashes, mainly due to the lack of variety because most distracted driving crashes, reported or misreported, have comparatively less-severe injuries and involve two vehicles in the crash.
With injury severity, 80.1 percent of the misreported crashes are related to property damage only (severity level O) with a misreporting to reporting ratio of 1.12, as shown in Figure 13. All other injury severity–involved crashes have a lower misreporting to reporting ratio. For number
Long Description.
The bar chart illustrates the percentage of crashes categorized by injury severity levels: K, A, B, C, and O. The y-axis represents the percentage of crashes, ranging from 0 to 90 percent in increments of 10. The x-axis lists the injury severity levels. Two types of data are shown: reported crashes, indicated by striped bars, and misreported crashes, indicated by solid bars. The chart reveals that level O has the highest of 70 percent and 80 percent in reported and misreported crashes, while levels K, A, B, and C have significantly lowest of 0 percent in both for k, 2 percent in both for A. B has 11 percent and 10 percent in reported and misreported, 10 percent and 9 percent for C in reported and misreported. Misreported crashes are present across all levels except for k, but are notably higher in level O. Note that the bar values are approximate.
Long Description.
The bar chart illustrates the percentage of crashes based on the number of vehicles involved, categorized as one, two, three, and more than three. The y-axis represents the percentage of crashes, ranging from 0 to 80 percent in increments of 20, while the x-axis indicates the number of vehicles involved. The chart compares reported and misreported data, with reported data shown in striped bars and misreported data in solid bars. Crashes involving 2 vehicles have the highest percentage in both reported and misreported categories, while those involving more than three vehicles have the lowest. 1 has 21 percent and 20 percent in reported and misreported, and 3 has 5 percent in both categories. Note that the bar values are approximate.
of vehicles involved, Figure 14 shows that 73.6 percent of all misreported crashes were two-vehicle crashes having a misreporting to reporting ratio higher than 1 (1.10).
5.6.2 Alcohol-Involved Crashes
Analysis was conducted on the spatial and temporal information to better understand the misreporting of alcohol-involved crashes. From all model-predicted alcohol-involved crashes, only those crashes confirmed as misreported after manual review were used in the analysis. The next three figures show the distribution of reported alcohol-involved and misreported alcohol-involved crashes confirmed in this study by time of day, day of week, and month of year, respectively.
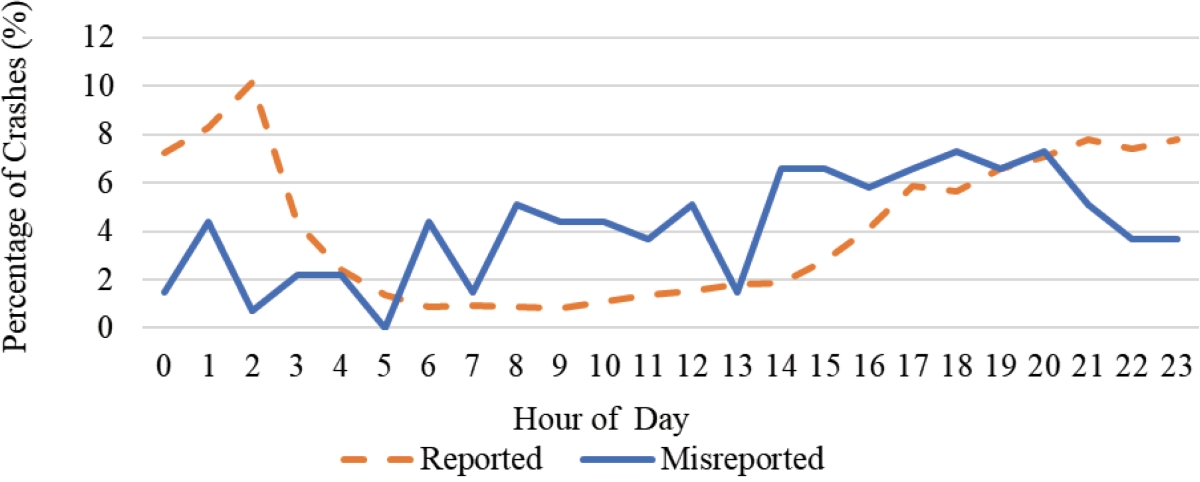
In 2022, 77.3 percent of all the misreported alcohol-involved crashes occurred during the daytime hours and early evening, from 6:00 a.m. to 8:00 p.m., with a comparatively lower misreporting to reporting ratio during the early morning (12:00 a.m. to 5:00 a.m.) and late-night hours (9:00 p.m. to 11:00 p.m.), as shown in Figure 15.
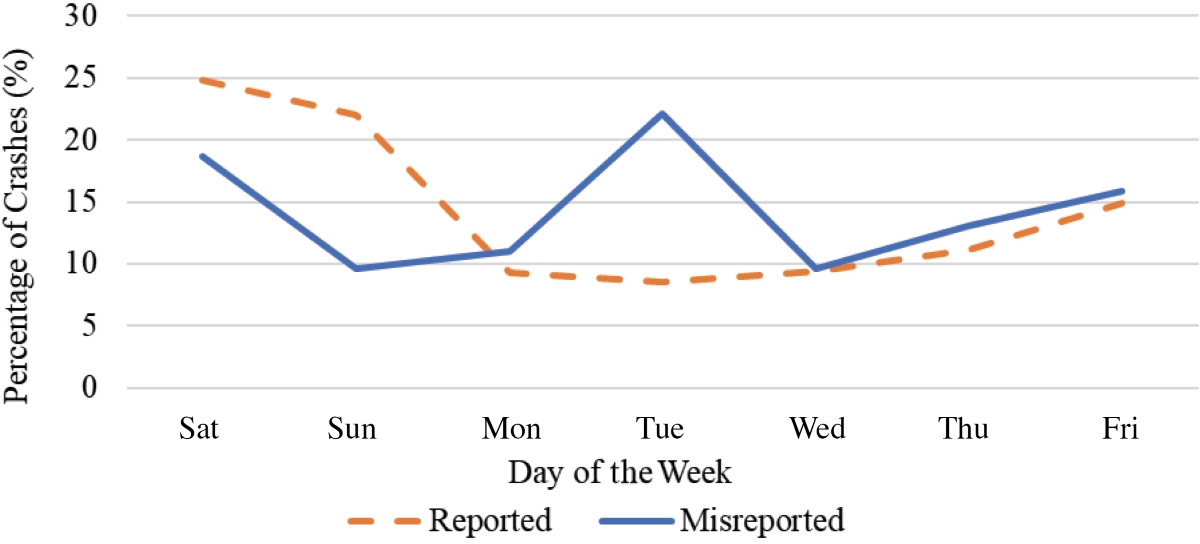
The day of the week distribution in Figure 16 suggests that both reported and misreported alcohol-involved crashes follow a similar trend, with negligible difference with a rise in misreported crashes on Tuesday. Thus, it is difficult to identify a day of the week pattern for misreporting alcohol-involved crashes.
Long Description.
The x-axis represents the hour of the day from 0 to 23 in increments of 1. The y-axis shows the percentage of crashes from 0 to 12 percent in increments of 2. The reported crashes, depicted with a dashed line, peak around 2 a.m. and gradually decrease, while the misreported crashes, shown with a solid line, fluctuate throughout the day with notable increases around 6 a.m. and 6 and 8 p.m. Note that the plot values are approximate.
Long Description.
The x-axis lists the days of the week from Saturday to Friday. The y-axis represents the percentage of crashes, ranging from 0 to 30 percent in increments of 5. The reported crashes, shown with a dashed line, start high on Saturday at 25 percent, decrease to 15 percent on Sunday, and then gradually fall, only to rise again to 15 percent by Friday. The misreported crashes, depicted with a solid line, begin at 20 percent on Saturday, drop to 10 percent on Monday, peak at 25 percent on Tuesday, and then decrease to 10 percent by Thursday, before slightly increasing again on Friday. Note that the plot values are approximate.
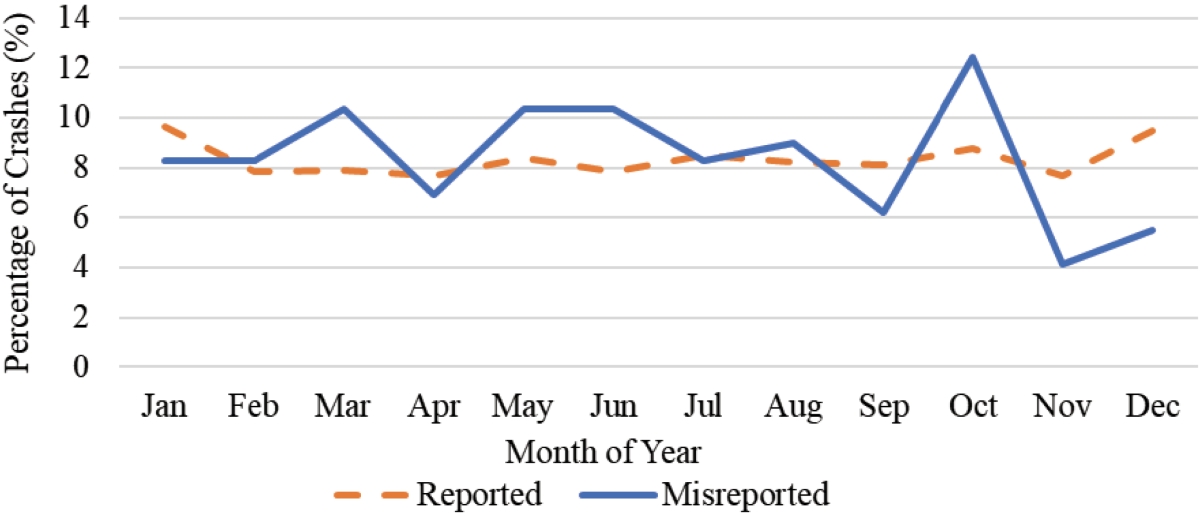
Figure 17 displays the monthly distribution of reported alcohol-involved crashes versus misreported alcohol-involved crashes, showing that they follow a similar trend with negligible difference, except during the last two months of the year.
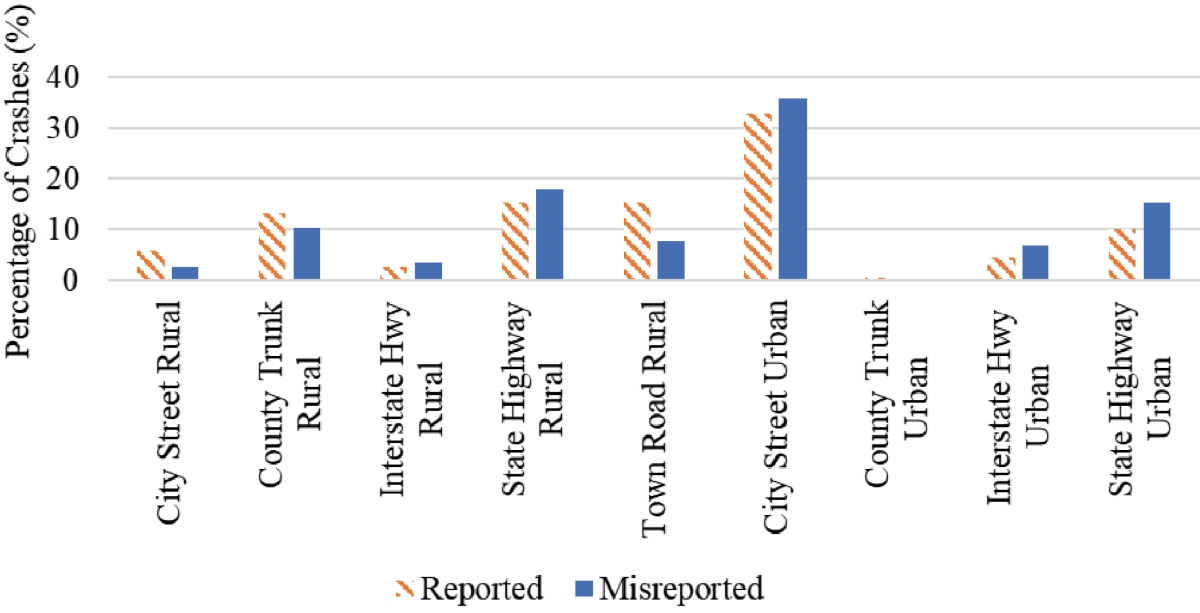
Figure 18 shows the distribution of misreported alcohol-involved crashes compared with reported alcohol-involved crashes by highway class. The evidence shows that most misreported alcohol-involved crashes occurred in urban areas, including urban city streets (35.9 percent) and urban state highways (15.2 percent). The interstate highway system, both urban and rural, has a higher ratio of misreported crashes to reported crashes (1.56 and 1.36, respectively). Urban and
Long Description.
The x-axis shows the months from January to December. The y-axis shows the percentage ranging from 0 to 14 percent in increments of 2. The reported crashes are depicted with a dashed line, while misreported crashes are shown with a solid line. Key observations include fluctuations in misreported crashes, peaking in October, while reported crashes remain relatively stable with slight variations. Note that the plot values are approximate.
Long Description.
The bar chart illustrates the percentage of crashes reported and misreported across different road types, namely city streets, county trunks, interstate highways, state highways, and town roads. The y-axis represents the percentage of crashes, ranging from 0 to 40 percent in increments of 10. The x-axis lists road types, divided into rural and urban categories. Reported crashes are marked with diagonal lines, while misreported crashes are shown in solid bars. City street urban areas have the highest reported and misreported percentages, with 32 and 35, while the county trunk urban areas show 0.1 and 0 percent. Note that the bar values are approximate.
rural state highways were found to have a ratio over 1 (1.53 and 1.17, respectively). Although the urban city streets have the highest percentage of misreported crashes, the ratio of misreported to reported crashes was closer to 1.
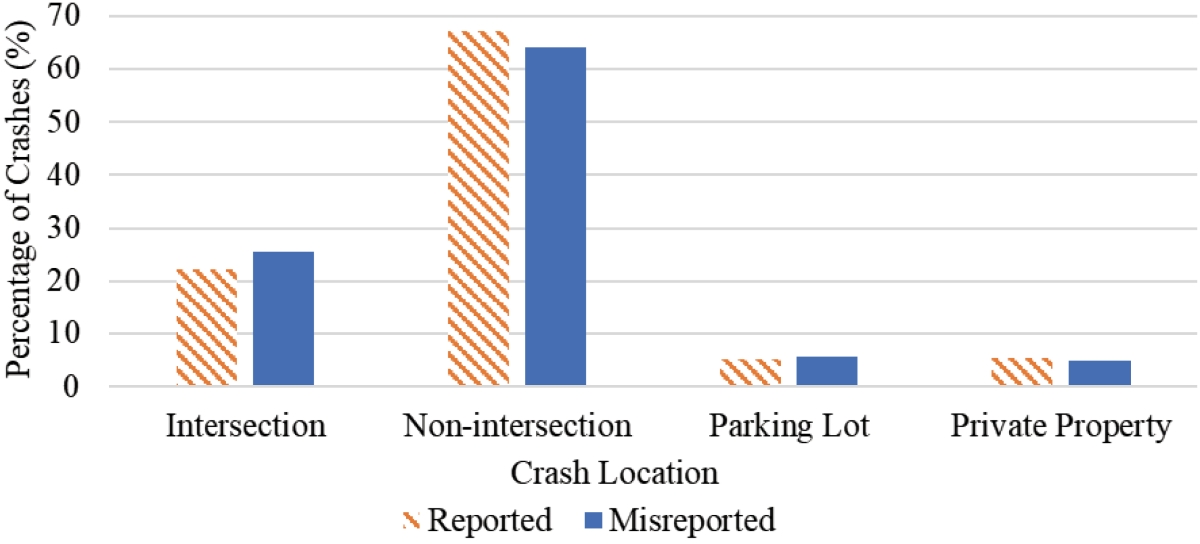
Figure 19 shows the distribution of misreported alcohol-involved crashes compared with reported alcohol-involved crashes by crash location, that is, the segment of the road where the crash occurred. Most of the misreporting took place at a non-intersection (64.1 percent) location, with a ratio of misreported to reported crashes of less than 1 (0.96). Also, the misreporting to reporting ratio (1.14) is higher at intersections.
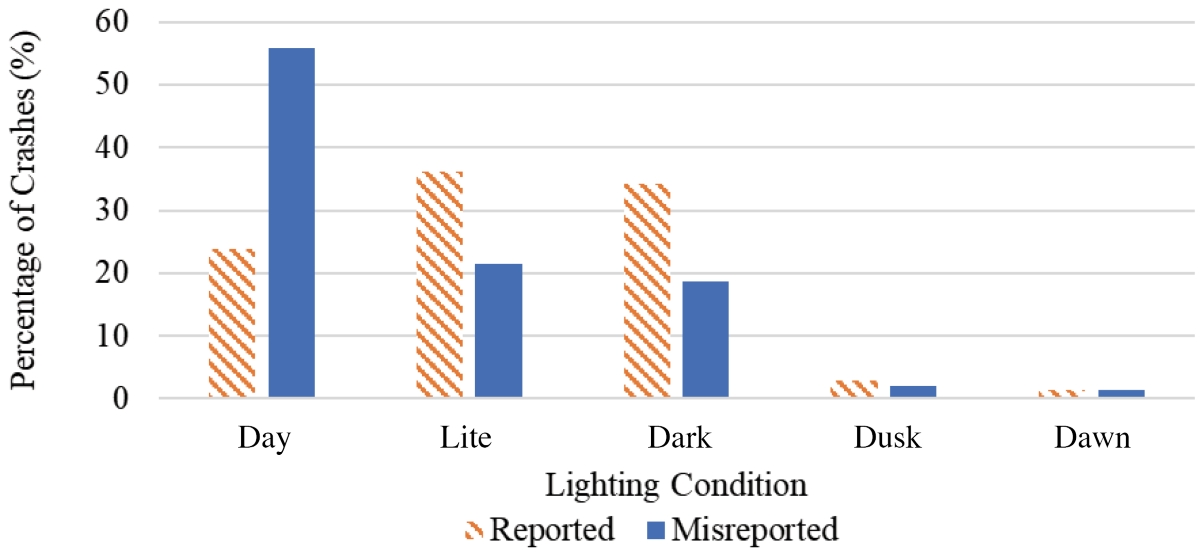
Figure 20 shows the distribution of misreported alcohol-involved crashes compared to reported alcohol-involved crashes by lighting condition. One observation, similar to the findings in hourly trends observed in Figure 15, is that most misreported crashes took place in the daytime (55.9 percent), with a ratio of misreported to reported crashes more than double (2.33). It is evident from Figure 20 that the ratio of misreported to reported crashes is much less than 1 for both dark (DARK) and lighted (LITE) driving conditions (0.54 and 0.59, respectively).
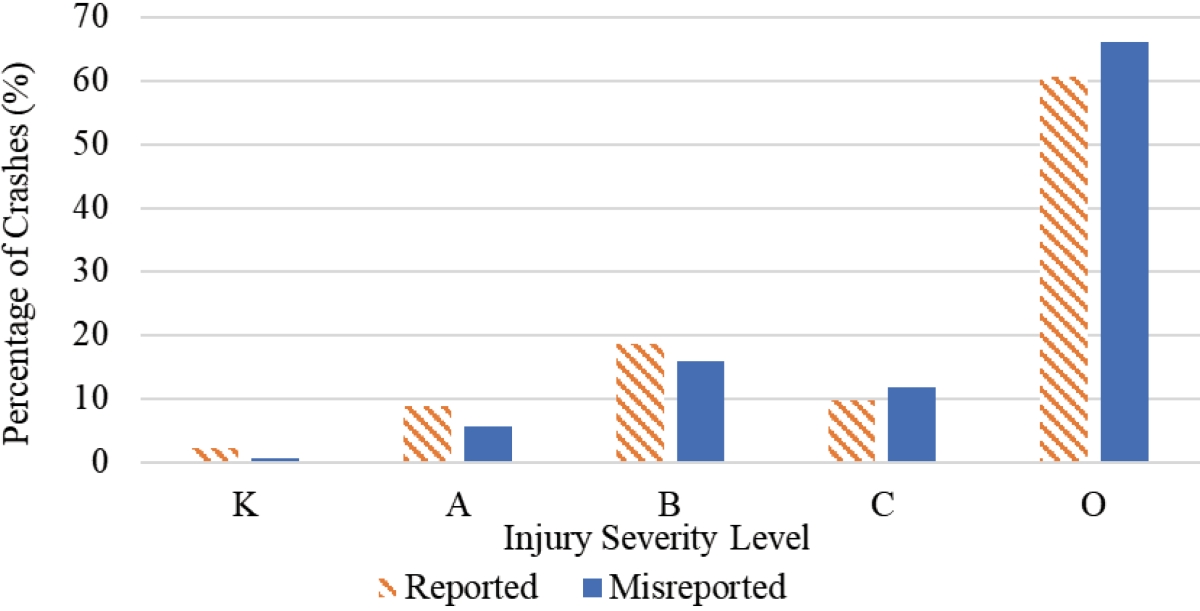
Comparisons were also conducted for two other structured data fields: injury severity and number of vehicles involved in a crash. Figures 21 and 22 show the distribution of misreported alcohol-involved crashes compared with reported alcohol-involved crashes according to injury severity level and number of vehicles involved, respectively. The results show similar distributions
Long Description.
The y-axis represents the percentage of crashes, ranging from 0 to 70 percent in increments of 10. The x-axis lists crash locations: Intersection, Non-intersection, Parking Lot, and Private Property. Reported crashes are shown with diagonal stripes, while misreported crashes are in solid bars. Non-intersection locations have the highest reported and misreported percentages, with 68 and 64 percent. Intersections show about 22 percent reported and 25 percent misreported. Parking lots and private properties have minimal percentages, each below 5 percent. Note that the bar values are approximate.
Long Description.
The y-axis represents the percentage of crashes, ranging from 0 to 60 percent in increments of 10. The x-axis lists the lighting conditions, such as day, light, dark, dusk, and dawn. During the day, reported crashes are around 21 percent, while misreported crashes reach 55 percent. In lite conditions, reported crashes are approximately 35 percent, with misreported crashes at 22 percent. Under dark conditions, reported crashes are about 34 percent, and misreported crashes are 19 percent. Dusk and dawn show minimal reported and misreported crashes, both under 3 percent. Note that the bar values are approximate.
Long Description.
The y-axis represents the percentage of crashes, ranging from 0 to 70 percent in increments of 10. The x-axis lists the five severity levels. Two sets of bars are shown for each severity level: reported crashes, indicated by diagonal stripes, and misreported crashes, shown in solid color. Level O has the highest percentages of reported and misreported crashes, with 60 and 66, while level K have the lowest percentages at 2 and 1. The chart highlights discrepancies in reporting across different severity levels. Note that the bar values are approximate.

Long Description.
The bar chart illustrates the percentage of crashes based on the number of vehicles involved, categorized as one, two, three, and more than three. The y-axis represents the percentage of crashes, ranging from 0 to 70 percent in increments of 10. The x-axis lists the number of vehicles: ONE, TWO, THREE, and greater than THREE. Each category has two bars, one for reported crashes and another for misreported crashes. The reported crashes are shown with a hatched pattern, while misreported crashes are in solid color. The chart highlights that single-vehicle crashes have the highest percentage, with 63 percent and 58 percent. Two-vehicle crashes show 30 and 32 percent. Three vehicles have lower percentages of 5 and 8. Three or more vehicles have significantly lower percentages of 1. Note that the bar values are approximate.
between reported and misreported alcohol-involved crashes, mainly due to the lack of variety because most alcohol-involved crashes, reported or misreported, have comparatively less-severe injuries and involve one vehicle.
Considering injury severity, 66.2 percent of the misreported crashes are property damage only (severity level O) with a ratio of misreporting to reporting ratio over 1 (1.09), as shown in Figure 21. The higher injury severity–involved crashes have a lower misreporting to reporting ratio, except for possible injury crash (severity level C).
Considering the number of vehicles involved, Figure 22 shows that one-vehicle crashes are the most misreported alcohol-involved crashes (57.9 percent), followed by the two-vehicle crash (33.1 percent). In the case of misreporting to reporting ratio, with more than one vehicle involved the ratio increases.
5.6.3 Drug-Involved Crashes
With very few misreported crashes, it is difficult to analyze the crash time and location pattern for a better understanding of the circumstances behind drug-involved crashes being misreported. A comparison was made for injury severity of a crash. Figure 23 identifies that crashes causing less-severe injuries seem to be misreported more than crashes involving more-severe injuries. As shown, 57.1 percent of the misreported crashes are property damage only (severity level O), with a misreporting to reporting ratio over 1 (1.10).
5.7 Choice Models to Identify Factors for Misreporting
Based on the exploratory data analysis, a binary logistic regression model was formulated for each distracted driving, alcohol-involved, and drug-involved crash type. In a binary logistic regression model, the response variable is the binary outcome variable, or categorical with two levels. In the context of predicting whether a crash is misreported, the response variable was defined as misreported, representing the binary outcome of interest. In this case,
- Misreported = 1: The crash is misreported (event of interest).
- Misreported = 0: The crash is not misreported.
The response variable, misreported = 1, was selected from the manually reviewed NoisyOR-method-based predicted misreported cases. For misreported = 0, data were selected from the flagged cases for each distracted driving, alcohol-involved, and drug-involved crash in police-reported data, as they are considered accurately reported in this analysis. In all models, the ratio

Long Description.
The y-axis represents the percentage of crashes, ranging from 0 to 60 percent in increments of 10. The x-axis lists the five various injury severity levels. Two sets of bars are shown for each level: one for reported crashes and another for misreported crashes. The data reveal that level O has the highest percentage of misreported crashes of 51 and 57, while level K has the lowest with 2 and 3 percent. The chart highlights discrepancies between reported and misreported data across different severity levels. Note that the bar values are approximate.
of misreported = 1 (positive) to misreported = 0 (negative) cases was set at 1:5 to balance the representation of both outcomes in the dataset. This approach aims to address the imbalance in the number of positive and negative cases in the whole dataset and enhance the modelʼs ability to produce statistically valid results.
5.7.1 Binary Logit Model for Distracted Driving Crash Misreporting
For distracted driving crash misreporting, the model variables were
- TIME: hour of the day the crash took place (morning peak: 7:00 a.m. to 10:00 a.m., afternoon peak: 3:00 p.m. to 6:00 p.m., other time)
- DAY: day of the week the crash took place (weekend, weekday)
- INJ: injury severity (K, A, B, C, O)
- HWY: highway class (urban versus rural)
- VN: number of vehicles involved in a crash (one, two, multiple)
- LGT: lighting condition during crash (dark, day, lite, other)
- LOC: crash location (intersection, non-intersection, other)
After stepwise variable selection was complete, the best model fit was determined. Table 12 shows the response variable count, and Table 13 shows the final model output for the predictor variables.

Long Description.
The column headers are Variable, Value, and Count. The data given in the table row-wise are as follows:
Row 1: Misreported; 1; 402; (Event)
Row 2: Blank; 0; 2,010
Row 3: Blank; Total; 2,412

Long Description.
The column headers are Variable, Coefficient, Standard Error (SE) Coefficient, Z-Value, P-Value, and Variance Inflation Factor (VIF). The data given in the table row-wise are as follows:
Row 1: Constant; −2.371; 0.411; −5.77; 0.000; Blank
Row 2: TIME—ref. level: OTHER
Row 3: AFTN PEAK; 0.298; 0.124; 2.40; 0.016; 1.17
Row 4: MORN PEAK; −0.215; 0.160; −1.35; 0.178; 1.26
Row 5: INJ—ref. levels: K, A
Row 6: B; 0.133; 0.404; 0.33; 0.741; 4.81
Row 7: C; C−0.316; 0.413; −0.77; 0.444; 4.21
Row 8: O; 0.170; 0.369; 0.46; 0.645; 7.30
Row 9: HWY—ref. level: RURAL
Row 10: URBAN; 0.316; 0.122; 2.58; 0.010; 1.11
Row 11: LGT—ref. level: DARK
Row 12: DAY; 0.464; 0.194; 2.40; 0.017; 2.62
Row 13: LITE; −0.043; 0.229; −0.19; 0.852; 2.33
Row 14: OTHR; −0.443; 0.327; −1.35; 0.176; 1.38
Row 15: LOC—ref. level: I
Row 16: N; 0.228; 0.122; 1.86; 0.063; 1.20
Row 17: OTHR; −0.215; 0.210; −1.03; 0.305; 1.17
A note below the table reads the following: The italicized variables are discussed further in the text.
A stepwise selection method was employed to identify variables in the model. A few statistically insignificant variables were added to the binary logistic regression model during stepwise selection, considering their contributions to increasing overall model fit, their potential interaction effects, and keeping in mind the overall model complexity. These additions were done prioritizing the improvement of model performance and alignment with theoretical knowledge over strict adherence to significance levels.
For each of the predictor variables in the regression model, the model output also shows the variance inflation factor (VIF) values, which are indicators of multicollinearity among predictor variables. According to the model output, VIF values for all variables except category O of the INJ variable were low (below 5), which meant that one predictor variable was not highly correlated with other predictors, and the coefficient estimates were more reliable.
AFTNPEAK was found to be significant for distracted driving crash misreporting. According to the coefficient value, holding other variables constant, a one-unit increase in AFTNPEAK is associated with a 0.298 increase in the log-odds of the event. As there is more traffic density and movement during afternoon peak hours, this might be the reason behind the distracted driving crash misreporting number being higher during that period of the day. In the case of highway class, URBAN highways were found to significantly contribute to the misreporting of distracted driving crashes. From the model output in Table 13, being in an urban location (URBAN) is associated with a 0.316 increase in the log-odds of the event compared with a non-urban location. For lighting conditions, DAY was found to significantly contribute to distracted driving crash misreporting. Location-wise, a non-intersection crash, N, was more probable to misreporting. As most crashes occur during the daytime, misreporting is also higher in the daytime. The model output found that being in daylight conditions (DAY) is associated with a 0.464 increase in the log-odds of the event compared with dark conditions.
5.7.2 Binary Logit Model for Alcohol-Involved Crash Misreporting
For alcohol-involved crash misreporting, the variables used for the model were INJ—injury severity (K, A, B, C, O); HWY—highway class (urban versus rural); LGT—lighting condition during crash (dark, day, lite, other); VN—number of vehicles involved in a crash (one, two, multiple); and LOC—crash location (intersection, non-intersection, other). After stepwise variable selection was completed, the best model fit was determined. Table 14 shows the response variable count, and Table 15 shows the final model output for the predictor variables.
Considering highway class (variable—HWY), URBAN highways were found to be a significant contributor to the misreporting of alcohol-involved crashes. A one-unit increase in the variable contributes a 0.423 increase in the log-odds of the event happening. The VIF value is 1.24, indicating a low level of multicollinearity. For lighting conditions (LGT), DAY was found to significantly contribute to alcohol-involved crash misreporting. The variable coefficient from model output shows that a one-unit increase in the variable contributes a 2.046 times increase in the log-odds of the event happening, with a VIF value of 1.71 indicating a low level of multicollinearity.

Long Description.
The column headers are Variable, Value, and Count. The data given in the table row-wise are as follows:
Row 1: Misreported; 1; 145; (Event)
Row 2: Blank; 0; 725
Row 3: Blank; Total; 870
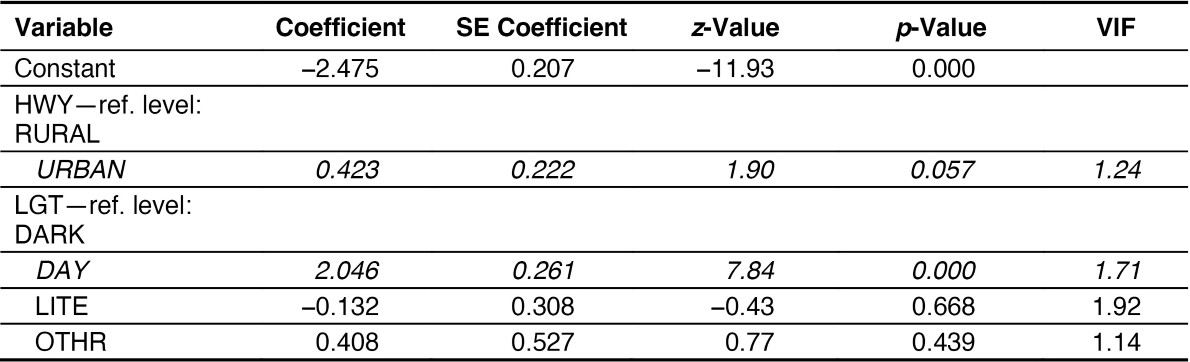
Note: The italicized variables are discussed further in the text.
Long Description.
The column headers are Variable, Coefficient, SE Coefficient, Z-Value, P-Value, and VIF. Column 1: Constant, Highway- reference level: RURAL, URBAN, LGT - reference level: DARK, DAY, LITE, OTHR. Column 2: minus 2.475, blank, 0.423, blank, 2.046, minus 0.132, 0.408. Column 3: 0.207, blank, 0.222, blank, 0.261, 0.308, 0.527. Column 4: minus 11.93, blank, 1.90, blank, 7.84, minus 0.43, 0.77. Column 5: 0.000, blank, 0.057, blank, 0.000, 0.668, 0.439. Column 5: blank, blank, 1.24, blank, 1.71, 1.92, 1.14.
5.7.3 Binary Logit Model for Drug-Involved Crash Misreporting
As there are few misreported drug-involved crashes, only injury severity level (INJ) was used for the drug-involved crash misreporting model. The logit model output could not find a significant variable contributing to drug-involved crash misreporting. Table 16 shows the response variable count, and Table 17 shows the final model output for the only predictor variable representing injury severity level of a crash.
In summary, the logit model analysis revealed several significant factors contributing to the misreporting of distracted driving crashes, including afternoon peak hours, urban highway locations, daylight conditions, and non-intersection crash sites. These findings suggest potential connections between higher traffic density, urban challenges, daytime visibility, and less closely observed non-intersection locations in influencing the likelihood of distracted driving crash misreporting. In the case of alcohol-involved crash misreporting, the analysis of the logit model found that URBAN highways significantly contribute to the misreporting of alcohol-involved crashes, potentially due to increased workload and challenges for police officers. Additionally, the variable DAY in lighting conditions plays a significant role, suggesting a higher likelihood of

Long Description.
The column headers are Variable, Value, and Count. The data given in the table row-wise are as follows:
Row 1: Misreported; 1; 28; (Event).
Row 2: Blank; 0; 140; Blank
Row 3: Blank; Total; 168; Blank

Long Description.
The column headers are Variable, Coefficient, S E Coefficient, Z-Value, P-Value, and VIF. The data given in the table row-wise are as follows:
Row 1: Constant; −1.946; 0.617; −3.15; 0.002; Blank
Row 2: INJ—ref. levels: K, A
Row 3: B; 0.602; 0.769; 0.78; 0.433; 2.24
Row 4: C; 0.560; 0.893; 0.63; 0.531; 1.72
Row 5: O; 0.288; 0.675; 0.43; 0.670; 2.58
misreporting for alcohol-involved crashes during daytime hours, possibly influenced by assumptions about reduced drunk driving during that time. Lastly, in the case of drug-involved crash misreporting, modeling with a larger data set is required for a better-fitted model to identify significant contributing factors.
Although many crash attributes have been considered and screened for their potential relevancy to a misreported distracted driving, alcohol-involved, or drug-involved crash, few are statistically significant based on the binary logit models. This finding signals the limitation of a crash characteristics–based approach to estimating the number of misreported crashes. Reviewing crash narratives, however, is still one of the most reliable ways to uncover misreported cases. With the advancement of large language models and text-mining techniques, the review can become more efficient and accurate.
5.8 Text Classification Method Used in Case Studies
This section describes the text classification method developed by the research team and used for the case studies in Chapter 6. The primary data source for the text classification method is structured crash data, supplemented by crash reports if narrative details are not included in the structured data. The elements used for text mining include (1) crash narratives obtained from either the structured crash data or the full crash reports and (2) indicators or flags for the specific crash type of interest, from either the structured crash data or manual annotations within the training dataset.
5.8.1 Overview of the Procedure
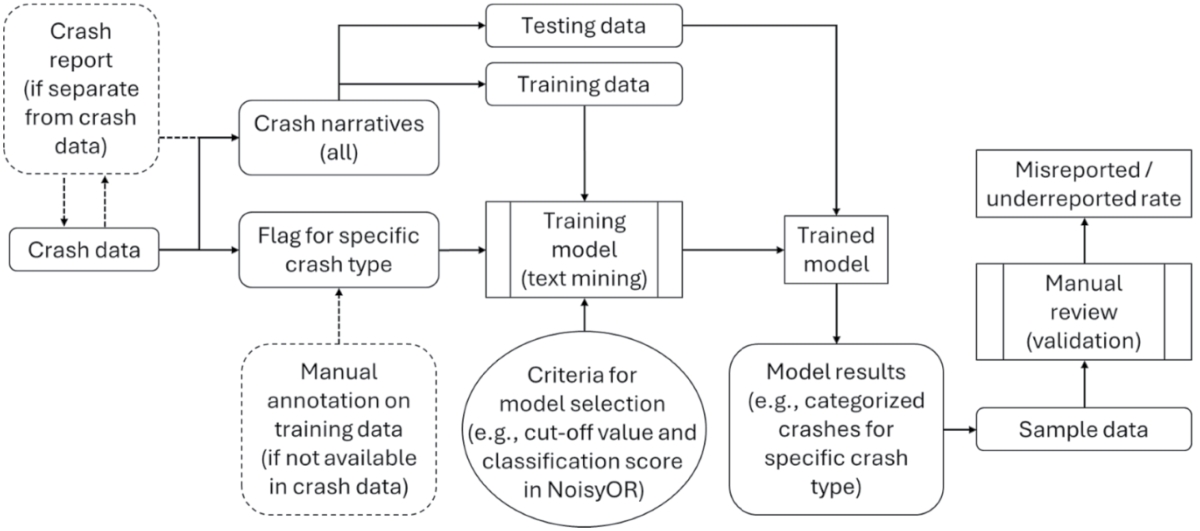
Figure 24 provides an overview of the text-mining procedure designed to identify and recover crash types that may have been misreported or underreported in structured crash data.
The procedure begins by extracting narrative text from either the structured crash dataset or the full crash reports. These textual data are then processed and input into a supervised machine learning model (e.g., NoisyOR) trained to detect specific crash types of interest. The model is developed using a labeled dataset that incorporates either existing flags from the structured crash data or manually annotated labels that accurately indicate the target crash type. Once trained,
Long Description.
The flowchart depicts a process that involves a crash report (if separate from crash data), which is branched to crash narratives (all) and crash data, which is branched into a flag for specific crash types. Crash narratives (all) are further branched into testing data and training data. Testing data leads to a trained model. Flag for specific crash type leads to training model (text mining), which further leads to a trained model. Flag for specific crash type is branched to manual annotation on training data (if not available in crash data), training model (text mining) is branched to criteria for model selection (e.g., cut-off value and classification score in NoisyOR) and trained model is branched to model results (e.g., categorized crashes for specific crash type) which leads to sample data, manual review (validation) and misreported or underreported rate.
the model can be applied to categorize crashes involving the specific type of interest. After the model generates results—whether using a test dataset or data of interest—it is recommended to validate the outcomes using a sample of the data. This validation can involve (1) reviewing cases originally labeled as negative in the structured data but flagged as positive by the model (if crash-type indicators are available) or (2) examining a reasonable sample of cases labeled as positive by the model. This validation process helps establish confidence in the modelʼs ability to identify misreported or underreported crash types accurately and calculate the number misreported or underreported.
5.8.2 Text-Mining Techniques: NoisyOR-Based Classification
In the NoisyOR method, the probability of being a specific type of crash narrative is calculated by combining the probability scores of unigrams (words) and bigrams (two consecutive words) in the narrative. It is a probabilistic extension of logical “or” (Oniśko, Druzdzel, and Wasyluk 2001; Vomlel 2006). If any input has a high probability score (such as a value close to 1), then the combined probability in NoisyOR becomes high. The combined probability in NoisyOR is even higher if more input probabilities are high. To apply NoisyOR classifiers to crash narratives, it is necessary to compute the probabilities of unigrams, bigrams, and trigrams and combine these probabilities using the NoisyOR method, discussed in the following section.
5.8.3 Equation of Simple Count Probability
For every unigram, bigram, and trigram term in the corpus, the method first computes the probability that if it is present in a narrative, then the narrative is positive, that is, P(positive). Then, this probability is computed using simple frequency counts, as shown in Equation 2:
 (2)
(2)
Where w is a unigram, a bigram, or a trigram. Positive count means the number of occurrences of w in the positive narratives. Similarly, the negative count indicates the number of events of w in the negative narratives.
The equation essentially computes from all narratives in which w occurs how many narratives are positives, that is, the probability that a narrative will be positive if w occurs in it. Then, smoothing is applied by adding 1 to the numerator and 2 to the denominator of the equation. This simple version of Laplace smoothing assumes w occurred at least once in a positive narrative and a negative narrative. Smoothing done in this way ensures that among the unigrams, bigrams, and trigrams that have zero negative counts, the ones with higher positive counts receive higher probability scores. Otherwise, they will all receive an unrealistic probability score of 1 because they occurred in a few positive narratives and no negative narratives. In the case of the words that appear in both positive and negative narratives with very high frequency (a high count), such smoothing is likely to reduce the probability of that specific word.
For example, if a unigram “unit” appears in the narratives of a specific type of crash (positive case) 110,933 times and in all the other narratives (negative cases) that exclude that specific crash 1,000,904 times, then Equation 2 gives a probability of 0.099. It indicates that the word is not relevant for the classification task. On the other hand, if a unigram, bigram, or trigram appears in both positive and negative narratives with high frequency but has a higher frequency in positive narratives, the equation gives a good probability score to the corresponding unigram, bigram, or trigram. For example, if a unigram “inattentive” appears in the narratives of a specific
crash 2,743 times and in all other narratives 1,808 times, then the equation gives a probability of 0.6029, indicating that the word is relevant for the classification task.
To classify a given narrative as positive or negative, its probability of being positive is computed by combining the probability scores of the unigrams, bigrams, and trigrams present in it. The method needs to compute P(positive|w1, w2, . . . , wn), where w1 . . . wn are unigrams, bigrams, and trigrams present in the narrative. The method computes it by combining the probabilities P(positive|w1), P(positive|w2), . . . , P(positive|wn), which have been computed as described earlier. NoisyOR is a method of combining probabilities (Zagorecki and Druzdzel 2004) commonly used in Bayesian networks (Oniśko, Druzdzel, and Wasyluk 2001; Vomlel 2006). Instead of true/false values in NoisyOR, the inputs and output are probabilities (hence termed “noisy”). Analogous to logical “or,” in NoisyOR, if any one of the input probabilities is high (i.e., close to 1), then the combined probability is high. But unlike logical “or,” the combined probability is even higher if more input probabilities are high. The combined probability is low (i.e., close to 0) only when all the input probabilities are low. NoisyOR combined probability is mathematically computed as shown here in Equation 3, where the probability score of a narrative is calculated by combining the probability scores of unigrams, bigrams, or trigrams occurring in it.
 (3)
(3)
where N is a given narrative, Pi indicates the probability score of the ith unigram or bigram as computed from the training data using Equation 1, and j means the number of occurrences of that ith unigram, bigram, or trigram in the crash narrative N. It should be clear from Equation 3 that if no unigram, bigram, or trigram emerges in a narrative with a high probability score, then the probability score of the narrative will be close to zero. On the other hand, a single unigram, bigram, or trigram with a high probability score will result in a high probability score of the entire narrative. This fact is precisely the behavior that has been observed in the data. Furthermore, more unigrams, bigrams, and trigrams with high probability scores make the combined probability score higher.
5.8.4 Equation of Weighted Count Probability
The probability scores computed using Equation 2 will be adversely affected if the number of negative narratives is disproportionately higher than the number of positive narratives. In the weighted count probability equation, the positive counts are weighted by the average number of positive word appearances in the positive narratives. It is designed to capture the unigrams, bigrams, and trigrams that appear not only more often in positive narratives than negative narratives but also more often per positive narrative than per negative narrative. The weighted count probability is formulated in Equation 4:
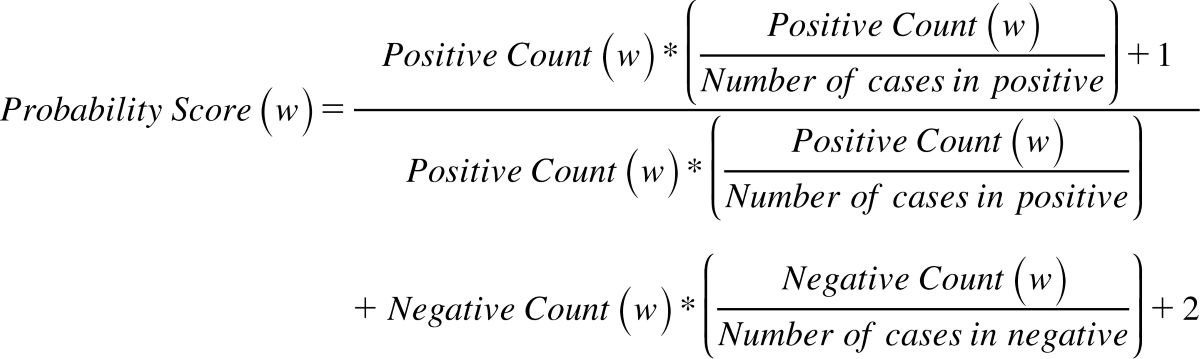 (4)
(4)
Here, positive count and negative count represent the same meaning as in Equation 2. The number of instances in positive means the total number of reported cases for distracted or
inattentive driving. The number of instances in negative means the total number of cases not reported as distracted or inattentive. With the probability scores obtained using Equation 4, the probability of a positive narrative is computed using the NoisyOR method described earlier. Given that a positive narrative will have an indicative word mentioned more than once, the NoisyOR probability score of the narrative will increase accordingly: in Equation 3, (1 - Pi) is raised to the power of j, the number of occurrences. In contrast, a negative narrative that has fewer indicative words will have a lower probability of being positive.
5.9 Direct Linkage Method
Linking to alternative data sources can provide information not available from datasets derived from crash reports. Hospital data are one of these data sources that numerous states already link to. Hospital data can provide procedure codes, diagnostic codes, and treatment costs. By linking individuals involved in crashes to hospital data, researchers can use diagnostic codes related to alcohol to identify drivers who may have been impaired.
This method uses hospital data available through the CODES program. CODES was originally a program facilitated by NHTSA as a component of its State Data Program. The system used a probabilistic methodology to link crash records to injury outcome records collected at the scene and en route by emergency medical services, by hospital personnel at the emergency department or hospital admissions office, or from death certificates. CODES was designed to foster and cultivate crash-outcome data linkage for highway safety applications at the state level, supporting state highway safety offices, state public health and injury prevention departments, state emergency medical services agencies, state transportation departments, and other state agencies. In 2013, the CODES program was transitioned to state-controlled programs.
The research team developed this direct linkage method using linked hospital data from Wisconsin. In Wisconsin, the hospital data linkage is part of CODES and is funded by the Wisconsin Traffic Records Coordinating Committee (TRCC). The project is a coordinated effort between WisDOT, the University of Wisconsin–Madison Traffic Operations and Safety Laboratory (TOPS Lab), and the Wisconsin Department of Health Services (DHS). Crash data are owned by the Wisconsin DHS and managed by the TOPS Lab. Hospital data are purchased from the Wisconsin Health and Hospital Association. Wisconsin DHS has agreements with Minnesota and Iowa to obtain hospital records from medical facilities outside Wisconsin.
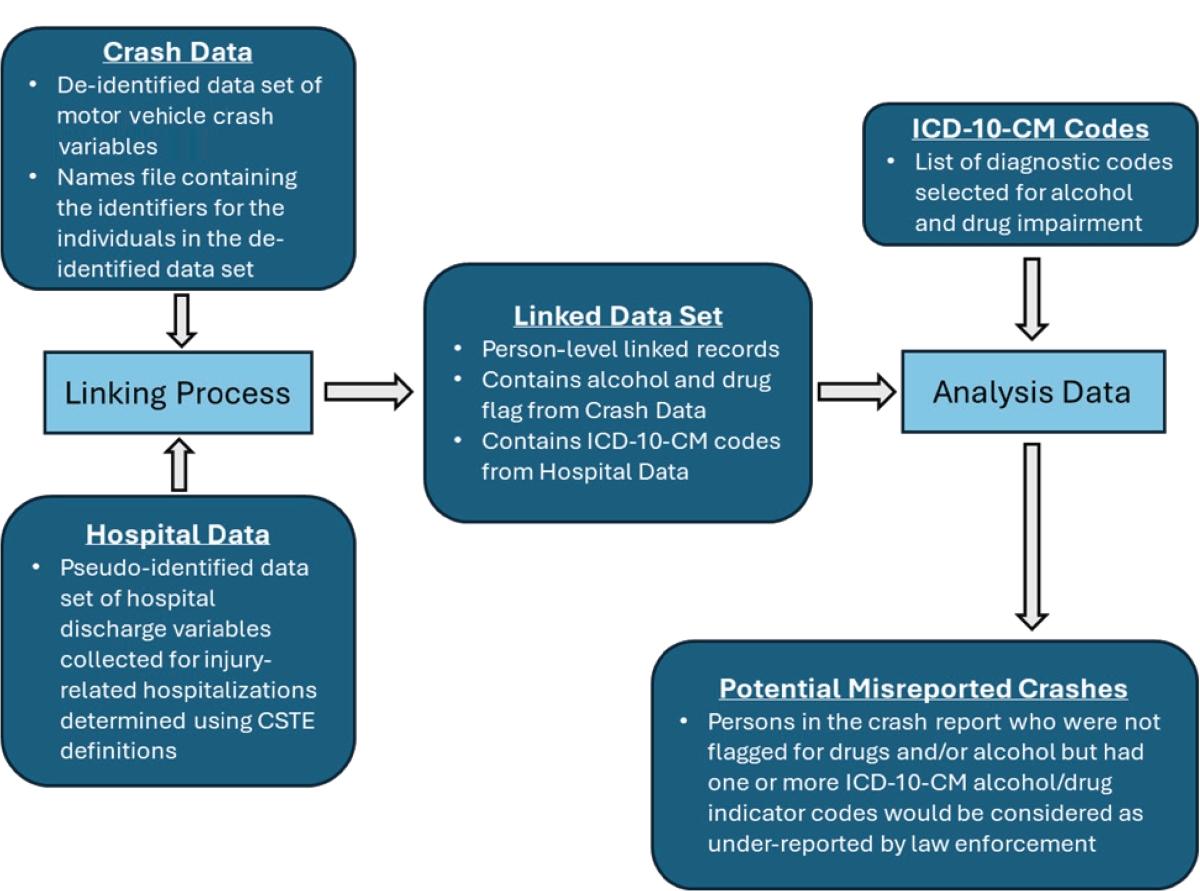
The following is a summary of the linking process in Wisconsin, visualized in Figure 25. First, a limited, de-identified data set of various motor vehicle crash variables and a names file that contains the identifiers for the individuals in the de-identified data set are prepared. At the same time, Wisconsin DHS prepares a limited, pseudo-identified data set of various hospital discharge variables collected for injury-related hospitalizations. The hospital discharge pseudo-identifier is a hash tokenized ID based on the soundex of the first name, last name, date of birth, and sex. Injury-related hospitalizations are determined using the Council of State and Territorial Epidemiologists definitions that specify the ICD-10 diagnosis codes for injury-related inpatient hospitalizations and injury-related emergency department visits. After that, the identifiers in the crash names file are converted into the pseudo-identifiers used in the hospital discharge data. A set algorithm is used to create pseudo-identifiers, so if a data set contains the components of the ID, the hospital pseudo-identifier can be created. It is termed pseudo-identifier because it is based on soundex methodology rather than using the original identifiable data. The pseudo-identifier is then linked to the crash data set based on a person ID variable. Then, the pseudo-identified crash data are linked to the injury-related hospital discharge data based on the pseudo-identifier and crash date or admission date. Once the hospital data are linked to person-level information from the crash report, the linked data can be filtered to show only persons reported as operating or driving the vehicle on the crash report. Because the same
Long Description.
The flowchart begins with crash data, which includes a de-identified data set of MVC variables and names file containing the identifiers for the individuals in the de-identified data set. Hospital data includes a pseudo-identified data set of hospital discharge variables collected for injury-related hospitalizations determined using CSTE definitions. These two data sets are linked. The linked data set is located at the center, which includes person-level linked records, contains alcohol and drug flags from crash data, and contains ICD-10-CM codes from hospital data. The linked data set branches into Analysis data, which is further branched to ICD-10-CM codes and potential misreported crashes. ICD-10-CM codes include a list of diagnostic codes selected for alcohol and drug impairment, and potential misreported crashes include persons in the crash report who were not flagged for drugs and or alcohol, but had one or more ICD-10-CM alcohol or drug indicator codes, which would be considered as under-reported by law enforcement.
soundex method is used for creating a pseudo-identifier from both data sources, the resulting data elements can be linked deterministically (exact matches) between the two files.
With the hospital data linked, the next step was to determine what ICD-10-CM diagnostic codes were used as indicators of alcohol involvement. Because Wisconsin crash data have separate flags for alcohol and drugs, it was determined to look only at alcohol when developing the method. While the method would be the same for drug-involved crashes, the process to determine what ICD-10-CM diagnostic codes to use would be more involved because of the more extensive definition of drugs and all the ICD-10-CM codes that would need to be identified for each drug class, polydrug impairment, drug and alcohol mix, and legal medications that may have been causing complications. A list of ICD-10-CM codes was obtained from the Massachusetts Department of Public Health Injury Surveillance Program. The conservative definition of alcohol codes was used for this method and is shown in Figure 26.
The linked Wisconsin hospital data include four types of diagnosis codes:
- Principal Diagnosis Code (dx_type = P): The condition established, after study, to be chiefly responsible for occasioning the admission of the patient to the hospital for care.
- Admitting Diagnosis (Inpatient data only) (dx_type = A): The ICD-10-CM Diagnosis Code provided at the time of admission as stated by the physician.
- Reason for Visit Diagnoses (Emergency and Observation data only) (dx_type = R): The ICD-10-CM Diagnosis Code provided as the reason for visit (up to three diagnoses) as stated by the physician.
- Other Diagnosis Codes (dx_type = S): Other diagnoses were to be reported if the diagnoses contributed to substantiation of the length of stay, substantiation of total charges, or accurate classification of the drug. Unlimited diagnosis codes were reported from each facility.
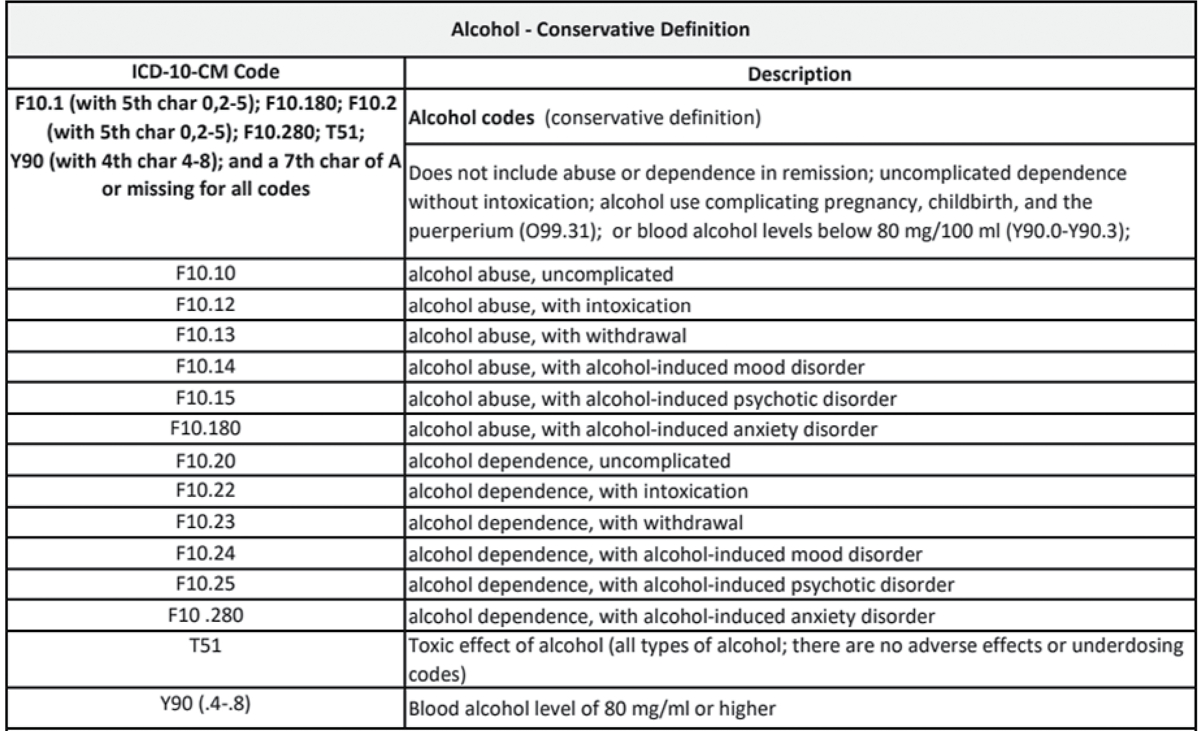
Long Description.
The column header of the table is Alcohol - Conservative Definition. The table has two columns. The column headers are ICD-10-CM Code and Description. The first row has two sub-rows. The data given in the table row-wise are as follows:
Row 1: F 10.1 (with 5th character 0, 2–5); F10.280; T51; Y90 (with 4th character 4-8); and a 7th character of A or missing for all codes.
Sub-row 1: Alcohol codes (conservative definition)
Sub-row 2: Does not include abuse or dependence in remission; uncomplicated dependence without intoxication; alcohol use complicating pregnancy, childbirth, and the puerperium (O99.31); or blood alcohol levels below 80 milligrams per 100 milliliters (Y90.0 – Y90.3)
Row 2: F10.10; alcohol abuse, uncomplicated
Row 3: F10.12; alcohol abuse, with intoxication
Row 4: F10.13; alcohol abuse, with withdrawal
Row 5: F10.14; alcohol abuse, with alcohol-induced mood disorder
Row 6: F10.15; alcohol abuse, with alcohol- induced psychotic disorder
Row 7: F10.180; alcohol abuse, with alcohol-induced anxiety disorder
Row 8: F10.20; alcohol dependence, uncomplicated
Row 9: F10:22; alcohol dependence, with intoxication
Row 10: F10.23; alcohol dependence, with withdrawal
Row 11: F10.24; alcohol dependence, with alcohol-induced mood disorder
Row 12: F10.25; alcohol dependence, with alcohol-induced psychotic disorder
Row 13: F10 0.280; alcohol dependence, with alcohol-induced anxiety disorder
Row 14: T51; Toxic effect of alcohol (all types of alcohol; there are no adverse effects or underdosing codes)
Row 15: Y90 (.4-.8); Blood alcohol level of 80 milligrams per milliliter or higher
Linked hospital data from 2019 were used to test the method, with the results shown in Table 18. In 2019, a total of 20,871 linked person-level records were taken, with 14,742 of those being flagged as the driver. Only motorists flagged as drivers were used for this analysis. Of those drivers, 1,257 were suspected of alcohol use by law enforcement. One hundred fifteen drivers were not flagged as suspected of alcohol but had an ICD-10-CM code for alcohol in the linked hospital records. These 115 records are considered underreported alcohol impairment crashes. The research team does caution against considering the cases flagged as suspected alcohol in the crash report but not associated ICD-10-CM codes for alcohol as overreporting.
Results of this analysis identify several challenges. First, alcohol exclusion laws allow health insurers to deny coverage to individuals if impairment was present and played a role in the events leading to their injury. These laws were discussed in Chapter 4; it is important for researchers and agency staff to understand the laws and the history of those laws when it comes to their state and region and how they might affect the hospital data they are linking to.

Long Description.
The column headers of the table are Suspects Alcohol Use (Yes or No), ICD-10-CM Alcohol Codes, and No Alcohol Codes. The data given in the table row-wise are as follows: Row 1: Suspects Alcohol Use – Yes (Crash Data), 343, 914. Row2: Suspects Alcohol Use – No (Crash Data), 115, 13,370.
Another challenge is that not all patients are screened for alcohol or drugs, and whether they were is not included in linked CODES data. ICD-10-CM codes are diagnosis codes used primarily for billing, and just because a code related to alcohol or drugs is absent from the linked hospital data does not mean that the patient was not impaired or had no alcohol or drugs in their system. During outreach, multiple stakeholders from different agencies and disciplines reported that medical data from trauma centers will be the most reliable when it comes to screening for drugs and alcohol, with reliability decreasing for inpatient data and emergency department data being the least reliable of the three. Medical staff also have other ways to document alcohol and drug impairment without generating an ICD-10-CM code. An example would be doctor or triage notes, which are not generally accessible or in a form that can be used in analysis.
A 2023 article from the Journal of Trauma and Acute Care Surgery titled “Hospital Variability in Adoption of Alcohol and Drug Screening in Adult Trauma Patients” looked at hospitals that participate in the Trauma Quality Improvement Program to report on variability in alcohol and drug screenings of injured persons (Silver et al. 2023).
- The study looked at 1,282,111 patients at 744 hospitals between the years 2017 and 2018.
- It found that 48.3 percent of patients were screened for alcohol.
- Looking specifically at motor vehicle crashes as the mechanism for injury, 69.5 percent of patients were screened for alcohol.
A 2024 study titled “Disparities in Screening for Substance Use Among Injured Adolescents” examined a national sample of injured adolescents (ages 12 to 17) to see whether sociodemographic disparities that were present in adults also showed up in adolescent patients (Rook et al. 2024).
- The study looked at 85,352 adolescent patients at 121 verified pediatric trauma centers.
- The study showed that 24.5 percent of patients were screened for alcohol.
- It also reported that of the 40,445 patients with an injury mechanism listed as motor vehicle crash, 28.9 percent were screened for alcohol.
Overall, linked hospital data can help analysts to identify underreported alcohol crashes; nevertheless, analysts need to understand the limitations of the data set.


